
Abstract
It has become almost a truism that parliamentary elections have become more personalized. However, evidence for this proposition among voters is relatively mixed and we lack a quantification of leader inspired voting. Using data from Comparative Study of Electoral Systems (CSES) project and consistent measures of leader and party popularity across 86 parliamentary elections in 31 polities between 1996 and 2019, we break new ground in the study of behavioral personalization in several respects. First, we provide a consistent and longitudinal test of leader inclined voting, separate from party evaluations, in the form of a vote-leader/party favorite alignment index. Our results show 6% of voters align their vote with their favorite leader solely, and one in five voters align their vote primarily with their favorite leader. While significant, more voters align their vote with their favorite party. Second, we find that leader motivated voting is most prevalent among non-partisans, older voters, and in elections where ideological polarization is low. Third, we demonstrate that voters solely motivated by leaders are most likely to switch their votes between elections. Our results have implications for our understanding of leaders’ impact on elections.
Introduction
Conventional wisdom suggests party leaders are an essential ingredient for electoral success. This seems plausible considering that countless leaders have appeared to translate their popularity into electoral triumph: Bob Hawke in Australia, Pierre and Justin Trudeau in Canada, Tony Blair in Britain, and Bertie Ahern in Ireland to name a few. It fits with a prominent research strand that suggests politics has become more personalized with politicians being the central anchor in understanding political developments.
Evidence indicates personalization has infused various aspects of politics. Institutionally, the adoption of electoral rules that promote individuals ahead of parties have become prevalent (Rahat and Sheafer, 2007; Renwick and Pilet, 2016). The media’s coverage of politics has become more individual-centered (Balmas et al., 2014; Stayner, 2012), while party leaders and prime ministerial candidates have become increasingly salient in election campaigns. Some have described this as the “presidentialization of politics” (Poguntke and Webb, 2005) leading to the view “leader centeredness” (Webb and Poguntke, 2013) now permeates politics. At the voter level, the personalization thesis assumes leaders are a critical dimension in explaining the vote and the influence of leaders is rising. Stimulating this is the declining influence of social structure on vote choice (Dalton, 2002; Knutsen and Langsaether, 2018) and weakening of party identification (Berglund et al., 2005; Dalton, 2002). Concurrently, the rise of television, a more educated electorate, and the rapidly changing communications climate, are argued to increase leaders’ role in shaping vote choice (for reviews see Karvonen, 2010; McAllister, 2007).
However, evidence for leader inclined voting is mixed. The research can be split into two camps: the leaders matter and the leaders minimalist schools. The former assumes leaders are critical to understanding vote choice and their impact is growing (Bean and Mughan, 1989; Garzia et al., 2020; Hayes and McAllister, 1997), bolstered by a profusion of recent studies which assume leaders have direct and indirect effects on the vote (Bittner, 2011; Costa Lobo and Curtice, 2015; Garzia, 2012, 2014; Garzia et al., 2020; Mughan, 2015). The minimalist school draws a more skeptical conclusion, arguing leader effects on the vote are at best modest, that their impact is mostly indirect, and increasing personalization is questionable (Aarts et al., 2011; Gidengil and Blais, 2007; King, 2002). While the subject has stimulated much academic interest, key questions remain. Existing literature is stymied by findings varying depending on countries and periods investigated and methodologies applied. Though comparative studies are increasing (Aarts et al., 2011; Costa Lobo and Curtice, 2015), there has been a lack of over-time analysis, resulting in impressionistic evidence gaining traction. A particular challenge has been to disentangle leader motivated voting from party motivated voting. In practice, voter assessments of party leaders likely strongly correlate with attitudes toward parties (although the temporal sequencing is contested, see Garzia, 2014). However, most agree that to arrive at a robust measure of leader motivated voting, a measure taking party assessments simultaneously into account is necessary. Most crucially, we continue to lack quantification of the extent of leader inclined voting. Our paper contributes to filling these voids.
We embrace a comparative descriptive research strategy to explore the extent of leader inclined voting using real-world leaders. Using the Comparative Study of Electoral Systems (CSES) Integrated Module Dataset (2019) and the second advance release of Module 5 (2020), our data comprises 399 leaders, 253 parties, and 86 elections from 1996 to 2019 in 31 polities. We plow a fresh field by developing the first quantification of the extent of leader inclined voting cross-nationally, (i.e., behavioral personalization) tapping both the direct and indirect pathways in which leader evaluations are aligned with vote choice. In doing so, we do not imply any causal thesis as to the temporal sequencing of party or leader motivations in the vote choice calculus (see Garzia, 2014). Instead, our goal is to quantify the phenomenon, identify its correlates, and explore its interplay with electoral outcomes while disentangling leader and party inclinations from one another as much as possible.
There are three takeaways from our study. First, our results show only 6% of voters align their vote with their favorite leader but not their favorite party. However, three times as many voters align their vote choice with their preferred party, not their favored leader. Overall, 1/5 of voters align their vote to a greater extent with their favorite leader, while 1/3 of voters parallel their vote with a greater preference for their party favorite. Additionally, we determine voters’ vote alignment with their favorite leader has remained relatively stable over time. Second, we discover that leader inclined voters are more likely to be non-partisans and more probable in depolarized electoral contests. Third, we show voters who align their vote choice with their favored leader and not their favorite party are more likely to have been vote switchers.
Identifying leader inclined voting
Personalization of politics: State of the art
In an influential review, Rahat and Sheafer (2007) identified three strands: institutional, media, and behavioral personalization. We address each in turn.
Institutional personalization is rules which privilege individuals over parties. Examples include electoral systems with a preferential vote component encouraging actors to cultivate a personal vote (Karvonen, 2010; Renwick and Pilet, 2016) or parliamentary elections where a prime minister is directly elected independently of parliamentary arithmetic. This aspect of personalization is visible in many political parties’ internal structures, with leaders increasingly elected by party members (Poguntke, 2016; Rahat and Kenig, 2018).
Media personalization concerns media coverage of politics and the emphasis placed on candidates and leaders at the expense of parties or cabinets. Some research indicates this personalized focus is increasing, with more attention on politicians’ private lives (van Aelst et al., 2012; Stayner, 2012), and evidence suggesting media personalization has taken root in Britain (Langer, 2007), Israel (Rahat and Sheafer, 2007), and Japan (Krauss and Nyblade, 2005).
Behavioral personalization focuses on actors—the politicians themselves (supply side) and the voters (demand side). On the supply side, Poguntke and Webb’s (2005) seminal study on presidentialization detected shifts in power toward the prime minister and discovered party leaders had gained more authority, while McAllister (2007) noted a corresponding decline in the influence of cabinets, parties, and parliament on public policy.
Our interest in this contribution is the demand side of the behavioral equation: how many voters are leader inclined voters? In reviewing this literature, two camps have emerged. The leaders’ matter school assumes leaders have a substantial impact on the vote. Bean and Mughan’s (1989) pivotal work demonstrated leaders in Australia and Britain had a significant direct effect on the vote, irrespective of partisanship (also see Hayes and McAllister, 1997). More recently, Bittner (2011) found voter perceptions of leader character traits influence vote choice in several states, while a recent comparative volume (Costa Lobo and Curtice, 2015: 247) concluded there is “very strong support for the importance of leader evaluations in the vote choices of electorates today.” Meanwhile, Berz (2019) shows prime ministers in Central and Eastern European states greatly influence the vote.
Elsewhere, Garzia (2014: 80) argues that leaders’ indirect influence on vote choice is overlooked and is growing, maintaining “voters’ feelings of closeness to the parties are ever more based on their evaluation of party leaders.” This implies that partisanship mediates leaders’ influence on the vote, with Garzia (2014: 80) contending that once leader evaluations are understood as a precursor to partisanship, their influence on the vote emerges stronger than that of partisanship. In half of the 20 elections explored, the research concluded that leaders were possibly decisive to the election outcome (also see Garzia, 2012, 2013). The indirect effects of leaders on vote choice have been championed by media scholars, with research showing media coverage influences voters’ perceptions of leaders (e.g., Bos et al., 2011; Eberl et al., 2017; Gidengil and Everitt, 2003), and how this can mediate the extent of leaders’ impact on the vote (Aaldering et al., 2018; Kleinnijenhuis et al., 2019).
While the above evidence might appear conclusive, the leaders minimalist school contends that while leaders might provide media copy and dominate election campaigns, their effect on the vote remains modest. These studies have tended to focus on direct effects. In an influential cross-national study King (2002: 216), having explored nearly 50 elections, concluded “it is possible to say in the cases of scarcely more than a handful that their outcomes probably turned on voters’ differing perceptions of the personal qualities and traits of the principal party leaders and candidates.” Using several measurement approaches, others have reached similarly reserved conclusions (e.g., Aarts et al., 2011; Dinas, 2008; Gidengil and Blais, 2007; Quinlan and O’Malley, 2018).
On the long-term importance of leaders, the personalization thesis assumes personalization of politics is growing. However, the evidence is inconclusive. Curtice and Holmberg (2005) found little evidence leaders have become electorally more critical. Karvonen’s (2010: 84) extensive study of personalization’s multiple aspects reaches a similarly dubious conclusion. Bittner’s (2018) survey of leaders in Canada over time concludes while leaders have always been relevant, there is no increasing trend. Most recently, however, Garzia et al. (2020), challenge this. Championing the idea that the indirect effects of leaders on the vote have been growing, this study maintains they have become more important in determining partisanship since the 1960s.
In sum, the kind of effect and the extent of leaders’ impact on the vote are contested. The existing literature suffers from several shortcomings. Many of the above studies have measured different facets of leaders, some capturing personality traits, others likeability, meaning comparisons across studies are complicated. Much of the scholarship has been restricted to a small number of countries. Cross-national and longitudinal analyses have been rarer. However, the biggest challenge is endogeneity. This concern arises from the not unreasonable assumption that partisanship may contaminate voters’ political attitudes (e.g., Bartels, 2002; Anderson and Evans, 2003). If true, citizens’ leader evaluations may be a byproduct of their feelings toward the party (for alternative perspective, see Garzia, 2014; Garzia et al., 2020). Consequently, we need to factor in party evaluations when assessing the impact of leaders. However, this is not straightforward, especially in cross-sectional studies (e.g., Holmberg and Oscarsson, 2011). It highlights a critical shortcoming—we lack a consistent cross-national measure of leader inclined voting and, thus, quantification of the phenomenon’s extent, quite remarkable considering several studies have tackled the issue. We address this by introducing a new measure of leader inclined voting which disentangles, to the extent possible, leader and party motivations.
Quantifying behavioral personalization: A new measure
Before advancing further, some details on our data: it comes from the CSES, a cross-sectional comparative study, optimal for testing leader effects as it asks respondents to evaluate multiple leaders and the parties themselves on a consistent 11-point likeability scale across time. We use the CSES Integrated Module Dataset (2019) and the second advance release of CSES Module 5 (2020). 1 We restrict our analyses to respondents that reported voting, to parliamentary and mixed systems, as presidential elections are by definition personalized (Holmberg & Oscarsson, 2011), to countries that are members of the OECD as of autumn 2019, and to modules that asked the likeability ratings of leaders and parties. Our starting micro number of observations was 96,080 respondents in 86 elections held between 1996 and 2019 across 31 polities.
Our goal is to establish the extent of leader inclined voting as distinct from party inclined voting to the extent possible. We expect if behavioral personalization is taking root, we should see a sizeable portion of the electorate align their vote with their favorite leader but not their favorite party—what we refer to as leader inclined voters. It would be the most tangible direct association of leader evaluations with the vote and, importantly, distinct from party likeability. That said, we do not discount other pathways for leader and vote choice to align. Respondents who align their vote with their favorite leader and party but assign a higher likeability score to the leader vis-a-vis the party are indicating a stronger preference for the leader. Consequently, it seems reasonable to infer a greater connection here between leader and vote choice—this group we refer to as leader leaning voters. We also acknowledge some respondents may align their vote with their favorite leader and party and assign the same favorability score to each. In this scenario, the association of leader and the vote exists, but it is indistinguishable from the party. We argue the strongest support for behavioral personalization is when the leader favorite and vote choice align, either irrespective of party favorability, or when leader favorability is higher than party favorability.
Additionally, if behavioral personalization is on the rise, we expect to observe vote-leader alignments will have increased over time. The most robust support for this proposition would come if the alignment between leader favorability only and vote choice rises. Still, one could legitimately claim we should consider leader leaning voting as part of this pattern too, which we do.
Our measure identifies six categories of voters, based on the alignment of respondents’ vote choice with their preferences for the leader and the party. We base our classification on three questions. The first is the respondent’s reported vote choice. The latter two measure the likeability of the party and the leader on 0–10 likeability scales.
We define Leader inclined voters as those who ranked the leader of the party they voted for as their favorite, but the party itself is not ranked as their favorite. It is the most tangible measure of leaders’ direct association with the vote as distinct from the party. Party inclined voters are respondents who ranked the party they voted for as their favorite but not the party’s leader as their favorite. This is also the most concrete measure of the party label’s direct association with vote as distinct from the leader. Leader leaning voters are respondents who ranked both the party and the leader of the party they voted for as their favorite, but who scored the leader higher than the party. Party leaning voters are similar, except they rank the party higher. Party and leader inclined voters ranked both the party and the leader of the party they voted for as their favorite and assigned them identical likeability scores. For this group, we cannot ascertain whether party or leader motivations are more important. Finally, incongruent voters are respondents who did not rank either the party or the leader of the party they voted for as their favorite (for similar approaches of classification, see Blais and Gschwend, 2010; Daoust et al., 2021; Quinlan and O’Malley, 2018). For a concrete example of this classification scheme, please consult Appendix E.
Before moving to the results, it is essential to clarify our measure is a descriptive index quantifying the association between the respondent’s vote and their favorite party and/or leader. It allows us to parse and enumerate the link between vote and leader/party evaluations to the maximum extent possible, given our comparative research design. This design has the advantage that we capture attitudes to real-world leaders and parties in elections, cross-nationally, over time, and with consistent metrics. This allows us to alleviate the endogeneity challenges encountered in the link between the vote and party/leader classifications. Nonetheless, we do not assume a particular causal sequence of the variables concerned, which is the subject of much debate in the leader inclined literature (see Garzia, 2014). We recognize our classification does not allow us to assume that leader and party popularity are not mediated by actors’ positions on other issues. Instead, our measure parses the distinct leader and party associations with the vote only providing the first quantification of direct and particular associations between vote choice, and leader and party evaluations, respectively. 2 Consequently, our measure identifies potential direct and indirect pathways for leader associations with the vote.
Analysis
Figure 1 depicts a Pareto chart. It details our vote choice alignment index with leader/party favorite (for election level distributions see Table D1, appendix). We find 6% of voters are leader inclined voters—voters who align their vote choice with their favorite leader and not with their favorite party. It signifies the leader’s most direct association with the vote as it is distinct from any party favoritism. As we expected some voters align their vote with leader favoritism as distinct from the party, but this represents the first quantification of this phenomenon. Nevertheless, Figure 1 shows it is the smallest of the six voting groups and is lower than the proportion of voters who align their vote with their party favorite solely (party inclined voters), which at 18% is three times greater than leader inclined voters.
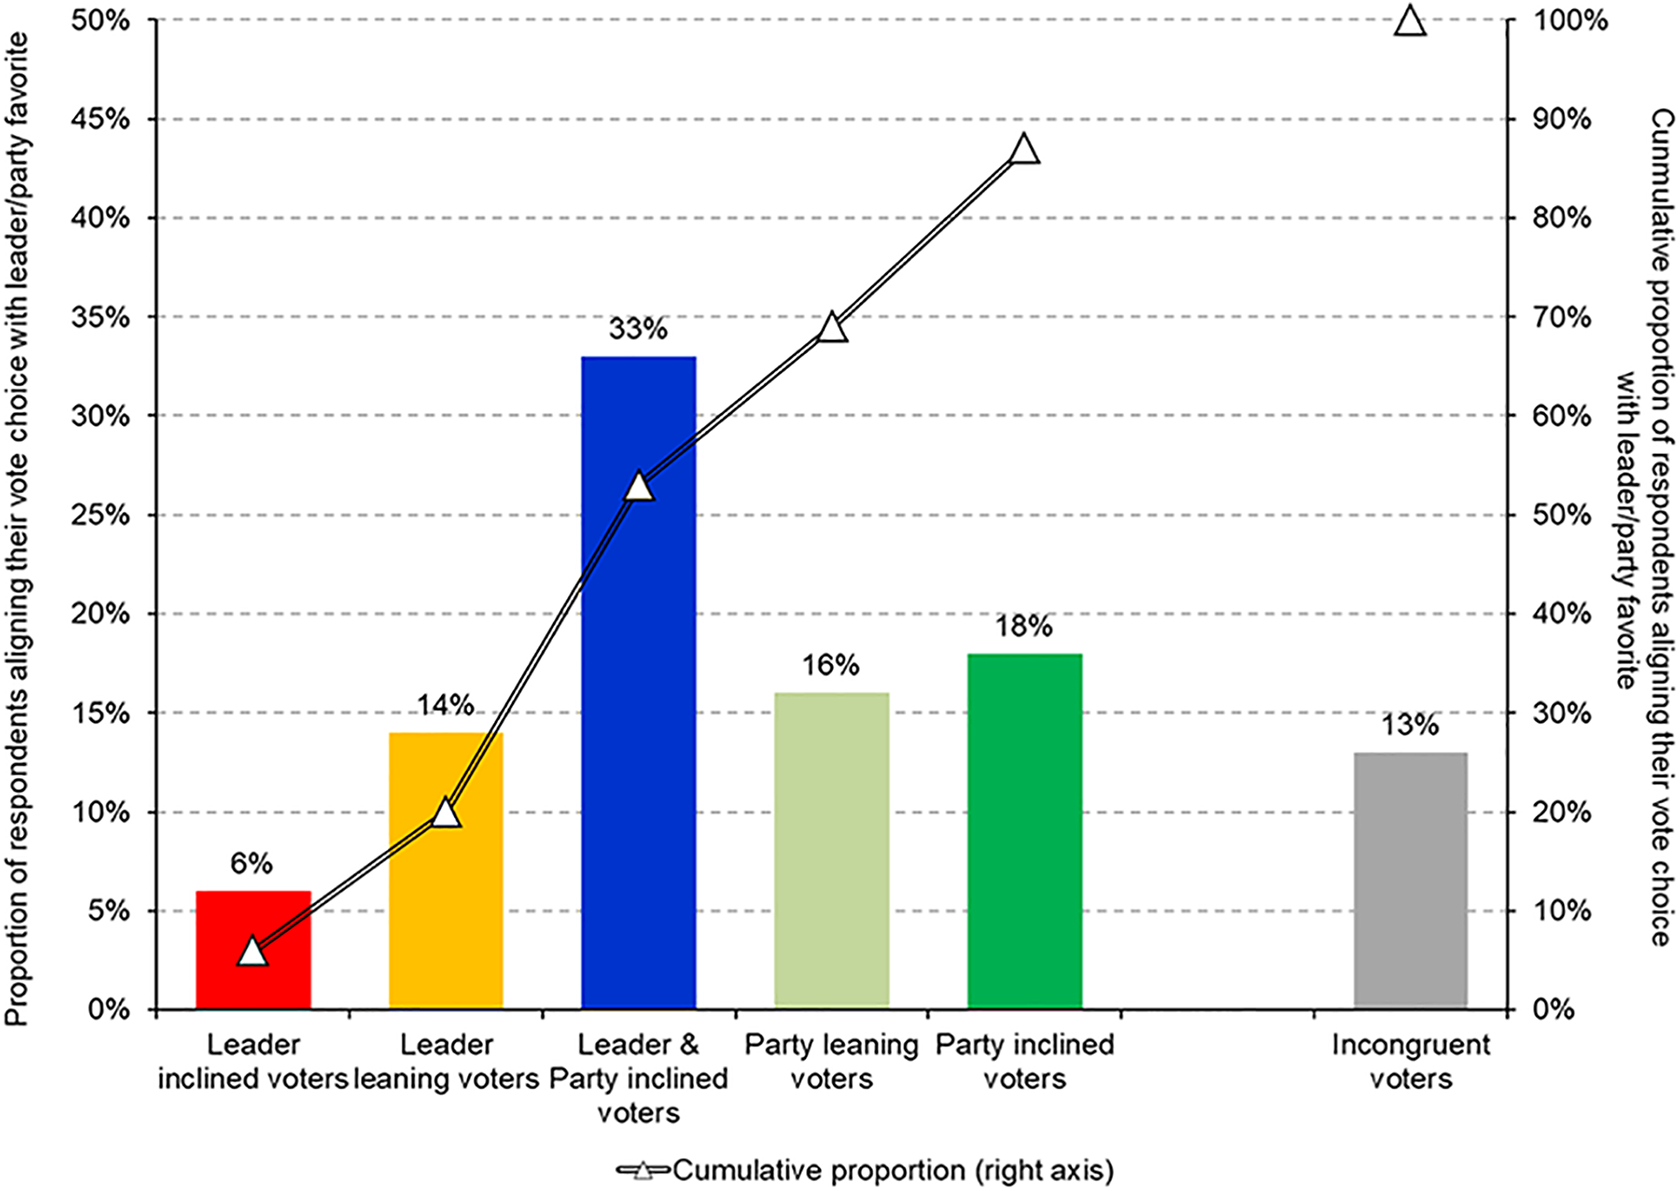
Pareto chart detailing alignments of Vote Choice with Leader/Party Favorite groups in 86 elections in 31 polities 1996–2019. Source of data: CSES (2019, 2020). Note: N = 96,080. Pareto chart order runs from leader/vote alignments (left) to party/vote alignments (right). Incongruent voters (far right) are separated to highlight this group doesn't fit to leader/party vote alignments. Left-axis depicts proportion for each vote-group alignment. Right-axis depicts cumulative proportion each category adds.
While leader inclined voters represent the most direct connection between leader and the vote, leader alignment with vote can emerge in other ways too. We observe 14% of voters are what we classify as leader leaning voters, respondents who rank the leader and party as their favorite, but assign the leader a higher favorability score than the party. While it is not possible to say in this instance whether leader or party is more important (given that the voter ranks both as their favorite), the higher score they give the leader vis-à-vis the party implies the leader connection with the vote is more prominent.
As indicated in Figure 1 by the cumulative proportion bar, combining leader inclined and leader leaning voters together means we can say one in five voters aligns their vote choice with their favorite leader principally. However, more voters align their vote choice with their favorite party—one in three voters in total if we combined party inclined and party leaning voters. Thus, our measure suggests behavioral personalization exists, but that leader favorite alignments with vote are less common than party favorite alignments. Nonetheless, we should not discount the biggest proportion of voters (33%) are those who align their vote with their favorite party and leader, meaning the influence of leaders is potentially more prevalent than the one in five voters we have identified here. That said, it’s probable some of these voters are more driven by party too but it is impossible to explore this further in our data.
Our next step is to tease out whether leader inspired voting is rising over time, as the personalization of politics thesis assumes. Figure 2 plots the proportion of voters who align their vote with their favorite leader solely in elections conducted between 1996 and 2019. The results provide no support for an over-time trend. Instead, the proportion of leader inclined voting has remained relatively stable and is not in line with conventional wisdom regarding personalization. This is also the case when we factor in leader leaners into the equation (see appendix Figure D1). 3 Thus, we conclude there is no evidence leader inclined voting is on the rise over the past 23-years, restricting the scope of the behavioral personalization thesis.
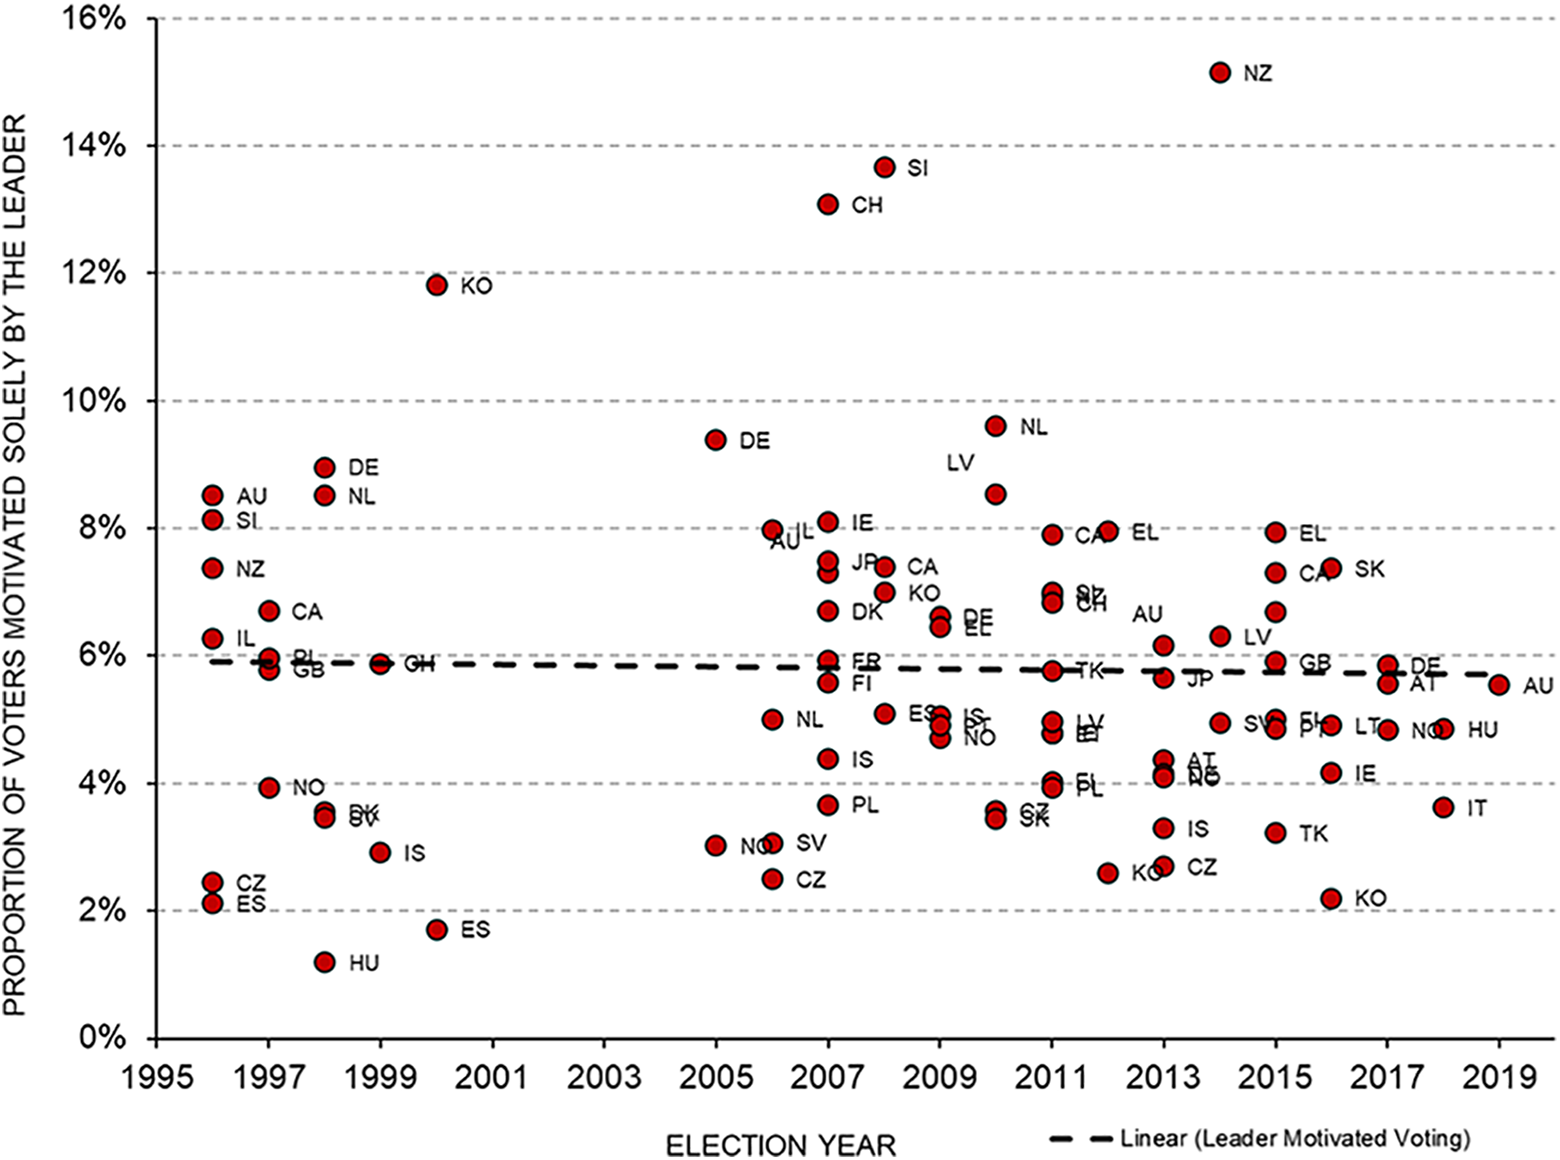
Leader inclined voting in 86 parliamentary elections 1996–2019 (%). Source of data: CSES (2019, 2020). Note: Polity abbreviations in Appendix A. Leader evaluations not asked in CSES Module 2 hence data for 2002-2005 limited.
Correlates of leader inclined voting
Expectations
Having established the extent of vote choice-leader/party favorability alignments, our next task is to establish in whom and what circumstances leader inclined voting is more likely to take root. We begin with voter identities—stimuli that affect how a person votes with a variety of research illustrating their importance in influencing voting behavior (Butler and Stokes, 1971; Sears and Funk, 1999). They are primarily dependent on the experiences and social networks of a voter and usually take root at the time a person becomes politically active. Perhaps the most studied voter identity is partisanship, the concept that voters “identify” with a particular party, and vote for one party consistently (Campbell et al., 1960). Considering partisanship has been weakening cross-nationally (Berglund et al. 2005; Dalton, 2002), dealignment has been linked to personalization (e.g.; McAllister, 2007; Garzia, 2012, 2014). Consequently, the conventional wisdom has been leaders are more likely to influence non-partisans and matter in countries where party attachment is weaker (Costa Lobo, 2015; Curtice and Hunjan, 2011; Tverdova, 2011). However, this narrative has been challenged, with Garzia (2012, 2014) contending partisanship is a function of leader evaluations, which implies partisans are more likely to be leader inclined voters. This would be in line with Gidengil (2011) who found leader evaluations were actually strongest for partisans. Even though the empirical evidence is mixed as to our expectations, we assume the traditional association will be observed and we expect those who identify with a party will be less inclined to be a leader inclined voter. Thus, we hypothesize:
The timing of citizens’ political maturity may also matter. Butler and Stokes (1971) crystallized the idea of a “generational effect”: groups of people voting differently because they share reciprocal experiences or have a distinct set of characteristics that are unique to this group. These experiences are considered to have a lasting impact on the vote as the individual ages. Two mechanisms are advanced to explain the distinct voting behavior of generations. One posits the political context when new generations enter the electorate determines their long-term behavior (Franklin, 2004). Alternatively, the values mechanism assumes each generation has distinct attitudes (Inglehart, 1997; Tilley, 2005).
How might this play into personalization? Conceiveably, both generational mechanisms could foster personalization. Newer generations have entered the electorate when the saliency of leaders is higher. Also, newer cohorts have come of political age when individualistic values have replaced group values as a means of political expression, and these may be generations more likely to see themselves as individuals and not part of a collective group (Inglehart and Welzel, 2005). Such thinking may stimulate a focus on leaders rather than parties. Consequently, we assume:
Linked to the generational component is rising citizen education levels. Some scholars maintain this constitutes a critical juncture, with new political behaviors emerging as a result (e.g., Kriesi et al., 2012). The premise is highly educated citizens will behave differently from the less educated because their different educational accumulation results in different values and opportunities, with the more sophisticated individuals in a better position to reason and process information. This links in with the idea of cognitive mobilization (Inglehart, 1997), which assumes increased education enables citizens to understand the complexities of politics without resorting to short cuts such as relying on leaders. Put another way: less-educated citizens lack the sophistication necessary to engage with political complexity and may resort to using leaders as a heuristic. Tying this into the literature on leader effects, the early assumption was leader-vote effects would be more prevalent among the less sophisticated (e.g., Glass, 1983; Gidengil et al., 2000). More recent research counters this, showing either inconclusive results (Gidengil, 2011; Rico, 2015) or contrarily that it is the most sophisticated voters that make use of leader evaluations (Bittner, 2011). Given the existing literature is unclear about the expectations, we test both potential mechanisms by formulating competing hypotheses, namely:
We suppose the degree of polarization between parties to influence leader inclined voting (also see Lachat, 2015). By polarization, we mean a clear division in the political system between actors on issues. Ideological divergence is an essential dimension in shaping voting behavior (Dalton, 2008; Lachat, 2008). It is no coincidence the personalization thesis gained traction when scholars debated whether ideological divisions between political parties were weakening. Concurrently, valence models of voting (e.g., Clarke et al., 2004), with their emphasis on the capacity to deliver commonly agreed goals became en vogue, heightening the saliency of leaders. We posit when parties are more polarized, voters will use ideology as a guide to determine their vote and focus on the party, leading to party inclined voting. However, when ideological differences between parties are small, we expect voters will look for other cues and leaders are likely to become more central in these circumstances. Thus, we assume:
Analysis
The clustering of CSES data observations means they violate the assumption of observational independence, and thus we adopt a multilevel strategy. Our micro-unit of analysis is voters nested within election studies. To account for election study clustering by country, our multivariate models apply robust standard errors by polity. We estimate multilevel logit models with three operationalizations of the dependent variable: Whether a respondent was a leader inclined voter or not. Whether a respondent was inclined to align their vote primarily with the leader—a combination of leader inclined and leader leaning voters. Whether a respondent was inclined both to the party and leader in equal measure.
All encompass the most explicit pathways of leader associations with votes. Besides the inclusion of variables capturing our expectations, our models also control for respondents’ sex, left-right ideology, whether the electoral system was a plurality system, and the module the respondent was surveyed in. Summary statistics for the variables and details of the polities and election studies included are available in Appendix A. Appendix B details our variable operationalizations. Our regression models’ variables have all been normalized to run on a scale of 0 to 1. We detail the full models in Table D4 of the appendix.
Our analysis consistently shows a strong negative association between partisanship and any aspect of leader inclined voting (models I–II) or party and leader inclined voters (model III). Partisan voters are less likely to be leader inclined voters. They are also less likely to be leader primary voters (i.e., a combination of leader inclined and leader leaning voters). Instead, partisans are more likely to be party and the leader inclined voters. Figure 3 plots the predicted probability of being a leader inclined, leader primary, and party and leader inclined voter by voters’ partisanship, holding all other variables in the model constant. The symbols show the likelihood of being a particular type of voter. The vertical lines around the symbols represent the 95% confidence intervals. The gray bars illustrate the distribution of partisanship in our sample. As we can see, the differences are substantively small, with partisan voters less likely to be either leader inclined or leader primary voters to the tune of 3-points (0.07 v 0.04) for leader inclined voters and 4-points for leader primary voters (0.22 v 0.18). But the difference is more considerable when it comes to the leader and party inclined group and in the opposite direction. Here partisans are more likely to be leader and party inclined voters to the tune of 12-points (0.27 v 0.39). These findings are in line with H1—when a voter is a partisan, they are less likely to align their vote solely with the leader favorite—instead, partisanship usually involves some factoring in of party.
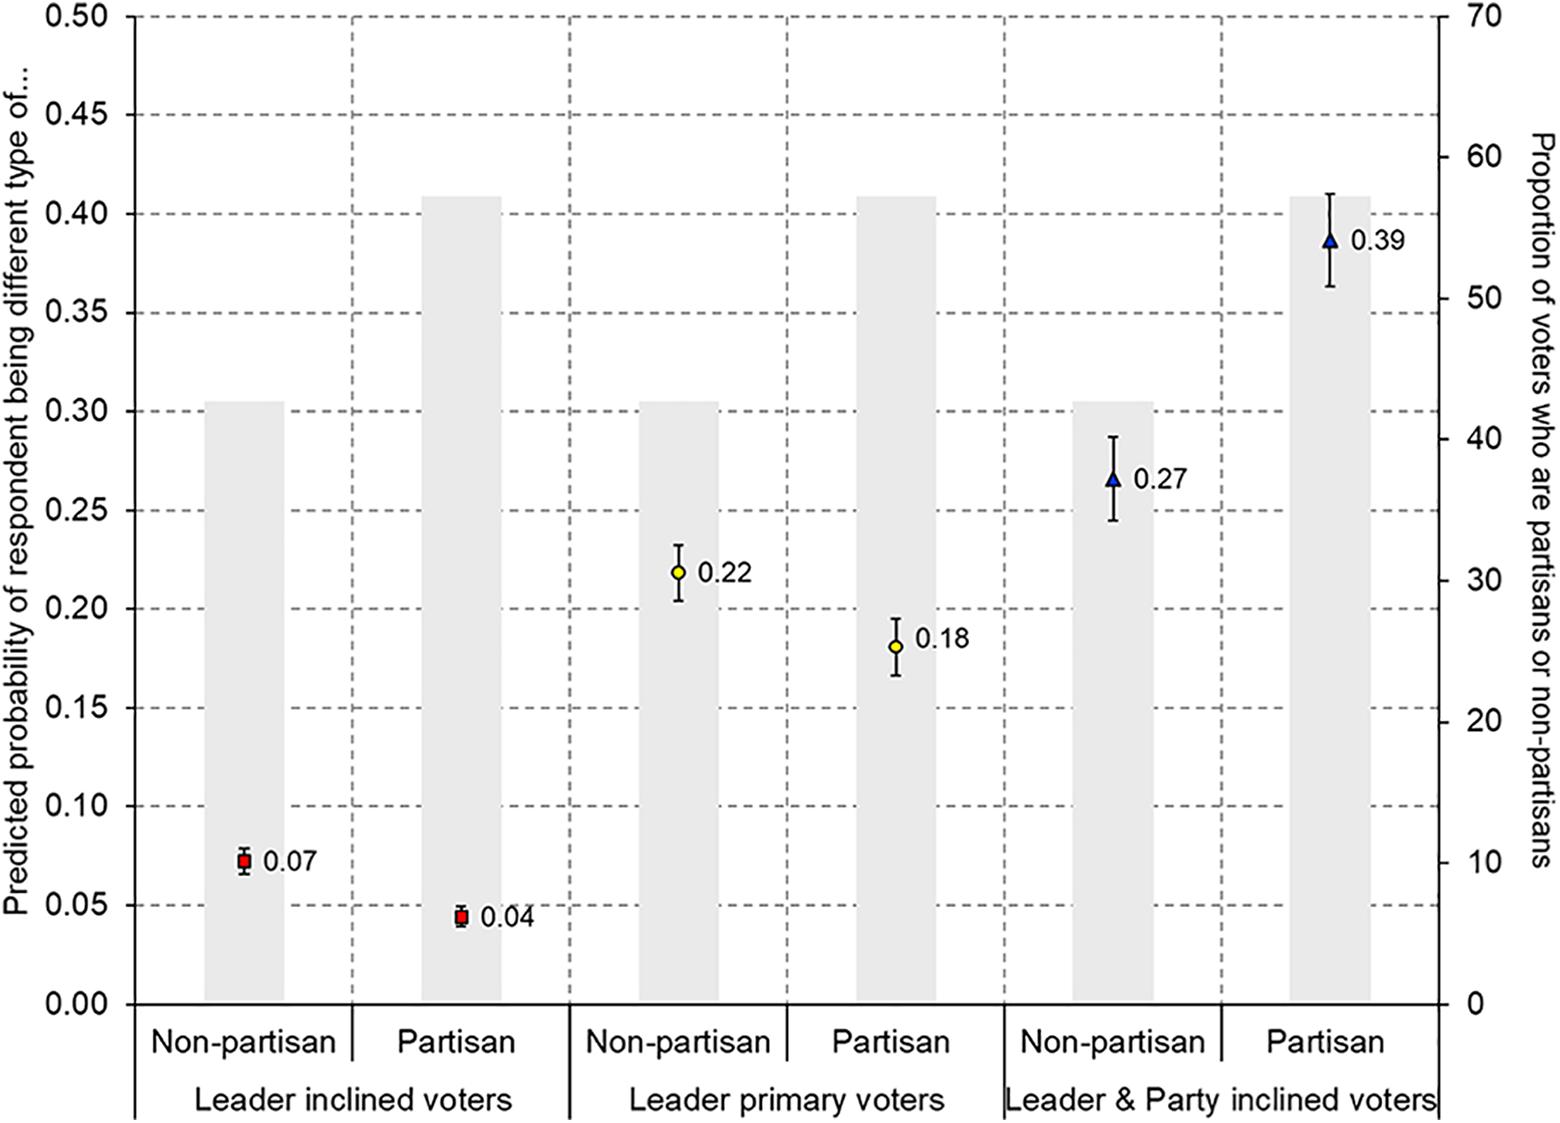
Predicted probability estimates of the impact of partisanship on the likelihood of being a leader inclined, leader leaning, or leader and party inclined voter Source of data: CSES (2019, 2020). Base: Table D4, appendix D. Note: The shapes depict the predicted probability estimates (left-axis). The vertical lines around the shapes represent the 95% confidence intervals. The gray bars indicate the proportion of voters in our sample who report a partisanship or not (right-axis).
Contrary to our expectations, we find no evidence newer generations are more likely to be leader inclined voters, and hence we reject H2. Instead, we find older generations are less likely to be party inclined voters (see Table D5, appendix). Our most consistent finding for leader inclined voting relates to voters born between 1925 and 1945—they are more likely to be leader motivated voters (models I–II) or driven by leader and party equally (model III). When we tease out the predicted probabilities however, the effects are substantively small—maximum 2-points in all cases. Equally, we fail to detect any significant difference in whether educated respondents were more probable to be leader inclined voters. Instead, we discovered evidence that the most educated voters were more likely to be party inclined voters (see Table D5, appendix). This doesn’t support either H3a or H3b but it does imply that the most educated are more party inclined if anything.
We detect robust and consistent evidence concerning ideological polarization as measured by the Dalton polarization index. Our analysis discovers that as ideological polarization increases, voters are less likely to be leader inclined or leader primary voters (models I–II), offering support for H4. Conversely, the more ideologically polarized parties are in the election, the more likely voters will be motivated by party and leader in equal measure (model III). Figure 4 teases out the substantive effects, which is similar to Figure 3, but the gray bars depict the distribution of respondents (rather than the proportion) as the polarization index is a macro level measure, and the probability of each respondent being a particular type of voter is plotted by different shapes and colors. We see that as polarization increases, the likelihood of being a leader inclined voter reduces from 0.1 at the minimum to 0.04 at the maximum, a six-point difference. The difference in probability from minimum to maximum is greater for leader primary voters—a nine-point difference from 0.25 at the minimum to 0.16 at the maximum level of polarization. Conversely, more polarization increases the likelihood of being a leader and party inclined voter—the likelihood estimate rises from 0.26 at the minimum to 0.41 at the maximum. We acknowledge the effects are substantively likely to be relatively modest in real terms as the distribution of polarization is concentrated away from the extremes. But it is clear that aligning ones’ vote solely or primarily with leader favorite is more probable when polarization is less.
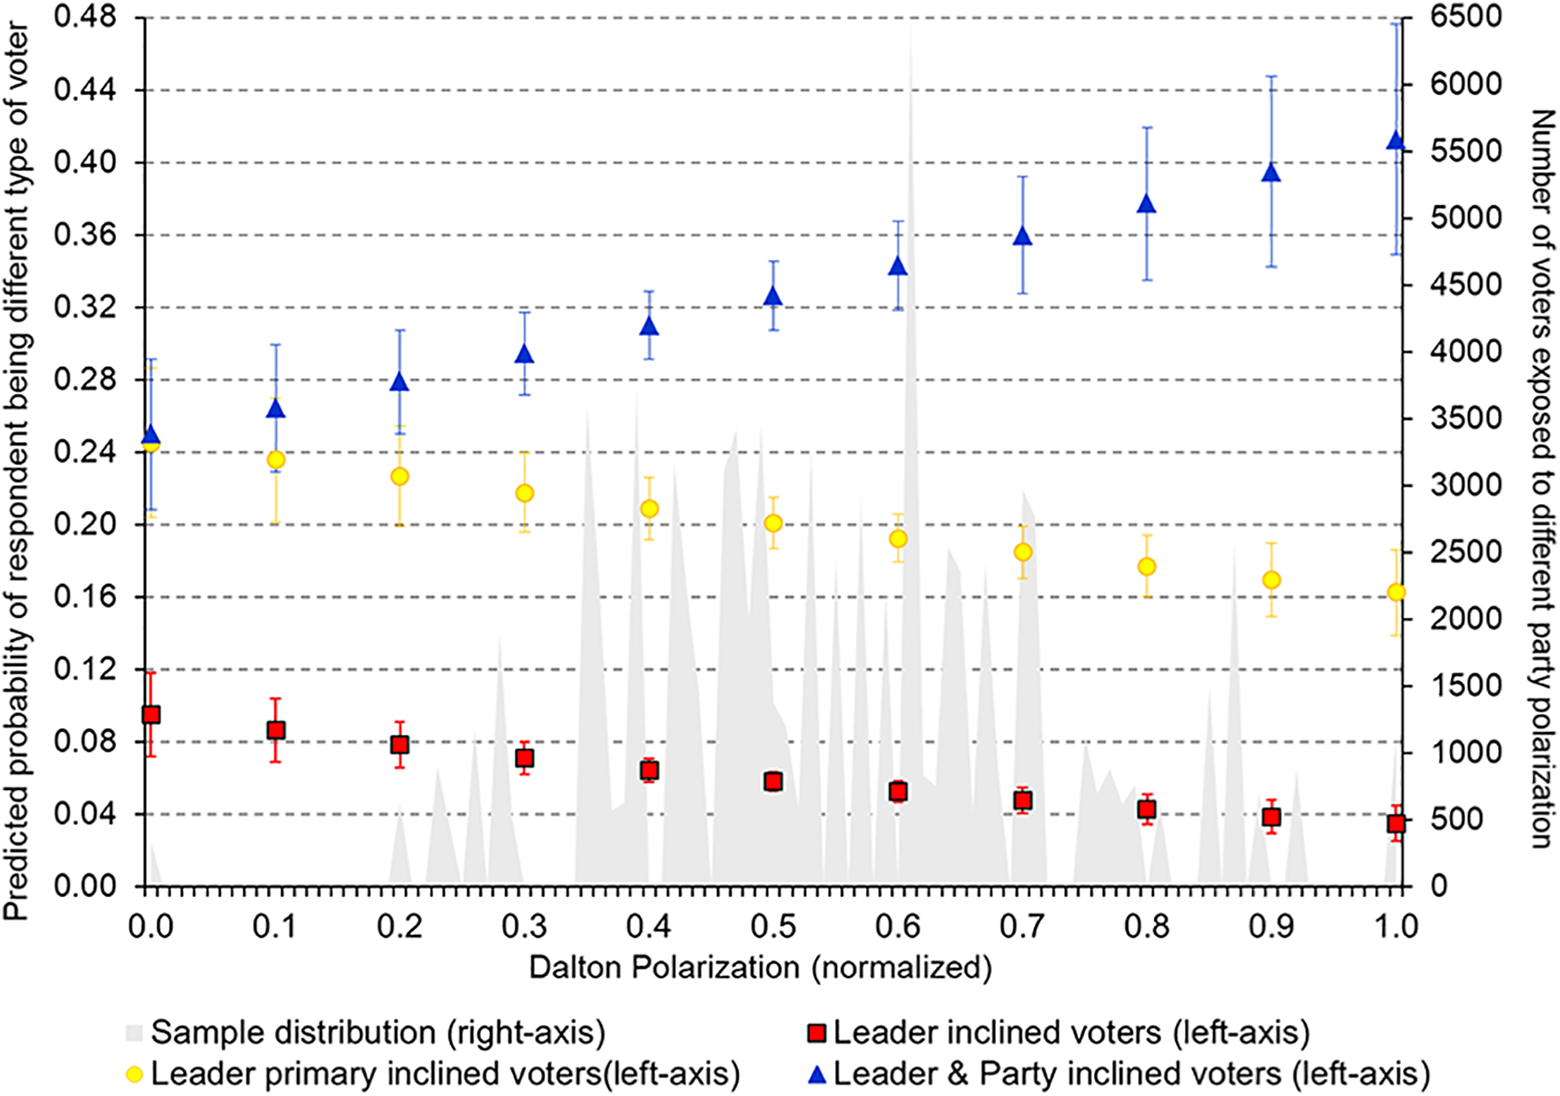
Predicted probability estimates of the impact of ideological polarization on the likelihood of being a leader inclined, leader leaning, and leader and party inclined voter. Source of data: CSES (2019, 2020). Base: Table D4, appendix D. Note: The shapes depict the predicted probability estimate (left-axis). The vertical lines around the shapes represent the 95% confidence intervals. The gray pointed bars indicate the numbers of voters in our sample exposed to polarization. We depict the raw number of cases as polarization is a macro level correlate (right-axis).
The behavioral consequences: Leader inclined voting and vote switching
Expectation
Previous research has highlighted liking a leader or evaluating their characteristics favorably increases the probability of voting for their party (e.g., Bittner, 2011; Costa Lobo and Curtice, 2015; Garzia, 2014). But existing research has merely scratched the surface on the behavioral impact of leaders. For the most part, we still lack conclusive evidence of when leader popularity, distinct of party reputation, is critical to shaping an individual’s vote choice. In response, we now turn to identifying if leader inclined voting is more prevalent among vote switchers.
There is a consensus we are witnessing higher electoral volatility in recent decades (Dassonneville, 2016; Mair, 2008). In response, a rich literature has developed on vote switching. The diminishing of the traditional determinants of voting has been identified as the root of this volatility with short-term factors more prominent. At the aggregate level, vote switching has been strongly linked with partisan dealignment and is more likely to occur in second-order elections (Carrubba and Timpone, 2005) and when more parties contest (Blais and Gschwend, 2010). In contrast, high polarization lessens the likelihood of vote switching (Dejaeghere and Dassonneville, 2017). Partisans and the politically sophisticated are least likely to be vote switchers (Dejaeghere and Dassonneville, 2017). Others have found general disillusionment (Zelle, 1995), frustration with the party one voted for previously (Dassonneville et al., 2015), and policies (Dassonneville, 2016; Mellon et al., 2018) all influence vote switching.
Leaders, among the chief short-term influencers of vote choice, and strongly linked with partisan dealignment (e.g., McAllister, 2007, Garzia, 2012, 2014), have received less attention in the vote switching literature. Those studies exploring it have reached mixed conclusions. Graetz and McAllister (1987) found leader popularity was linked to switching in the British elections of 1974, 1979, and 1983. However, Dassonneville (2016) found leaders mattered both for switchers and stable voters in UK elections between 1997 and 2010. We assume leader inclined voters will be most likely to be switchers because they lack the relevant linkages to parties, which previous research has shown fosters vote stability. Hence, we hypothesize:
Analysis
Our dependent variable is whether a respondent voted for the same party across two elections. Voters who report voting for the same party in each election are coded 0 while switchers are coded 1. We ascertain this from the respondent’s reported vote in the current and the previous elections. The recall vote question is only available for CSES Modules 3–5 and is restricted to elections where data is available. We recognize the pitfalls of using recall vote questions to measure switching (e.g., Converse 1962). Nonetheless, it is the industry standard (e.g., Dassonneville et al., 2015; Dejaeghere and Dassonneville, 2017) and research shows recall questions most likely underestimate volatility (Waldahl and Aardal, 2000). Among the respondents for which we had data, 32% report switching their vote between elections while 68% report voting for the same party in both elections.
Table D8 (Appendix D) details a multilevel logistic regression exploring vote switching. We find evidence that leader inclined voters are more likely to be vote switchers vis-à-vis party inclined voters, offering some support to H5. However, leader leaners, are slightly less likely to switch, implying that it is only when vote choice aligns solely with the leader that the leader is associated with a change in vote. We also find that voters who align their vote with both their favorite leader and party simultaneously are less likely to be vote switchers compared to party inclined voters.
Figure 5 presents the predicted probabilities of vote switching for three groups: leader inclined voters, leader leaner voters, and party and leader inclined voters. We estimate the marginal effects holding all other variables in the model constant. The reference category for this analysis is party inclined voters (see Table D8, appendix D). We find leader motivated voters are more likely to be vote switchers to the tune of 13-points (0.32 v 0.45). While the proportion of leader inclined voters is small and thus the substantive effect is likely to be modest, this is a key finding—voters who solely align their vote with their favorite leader are more probable to report shifting their vote. However, this does not extend to leader leaners who are 3-points less likely to switch (0.33 v 0.30). Elsewhere, voters who are leader and party inclined voters are also less likely to report switching to the tune of 6-points (0.35 v 0.29).
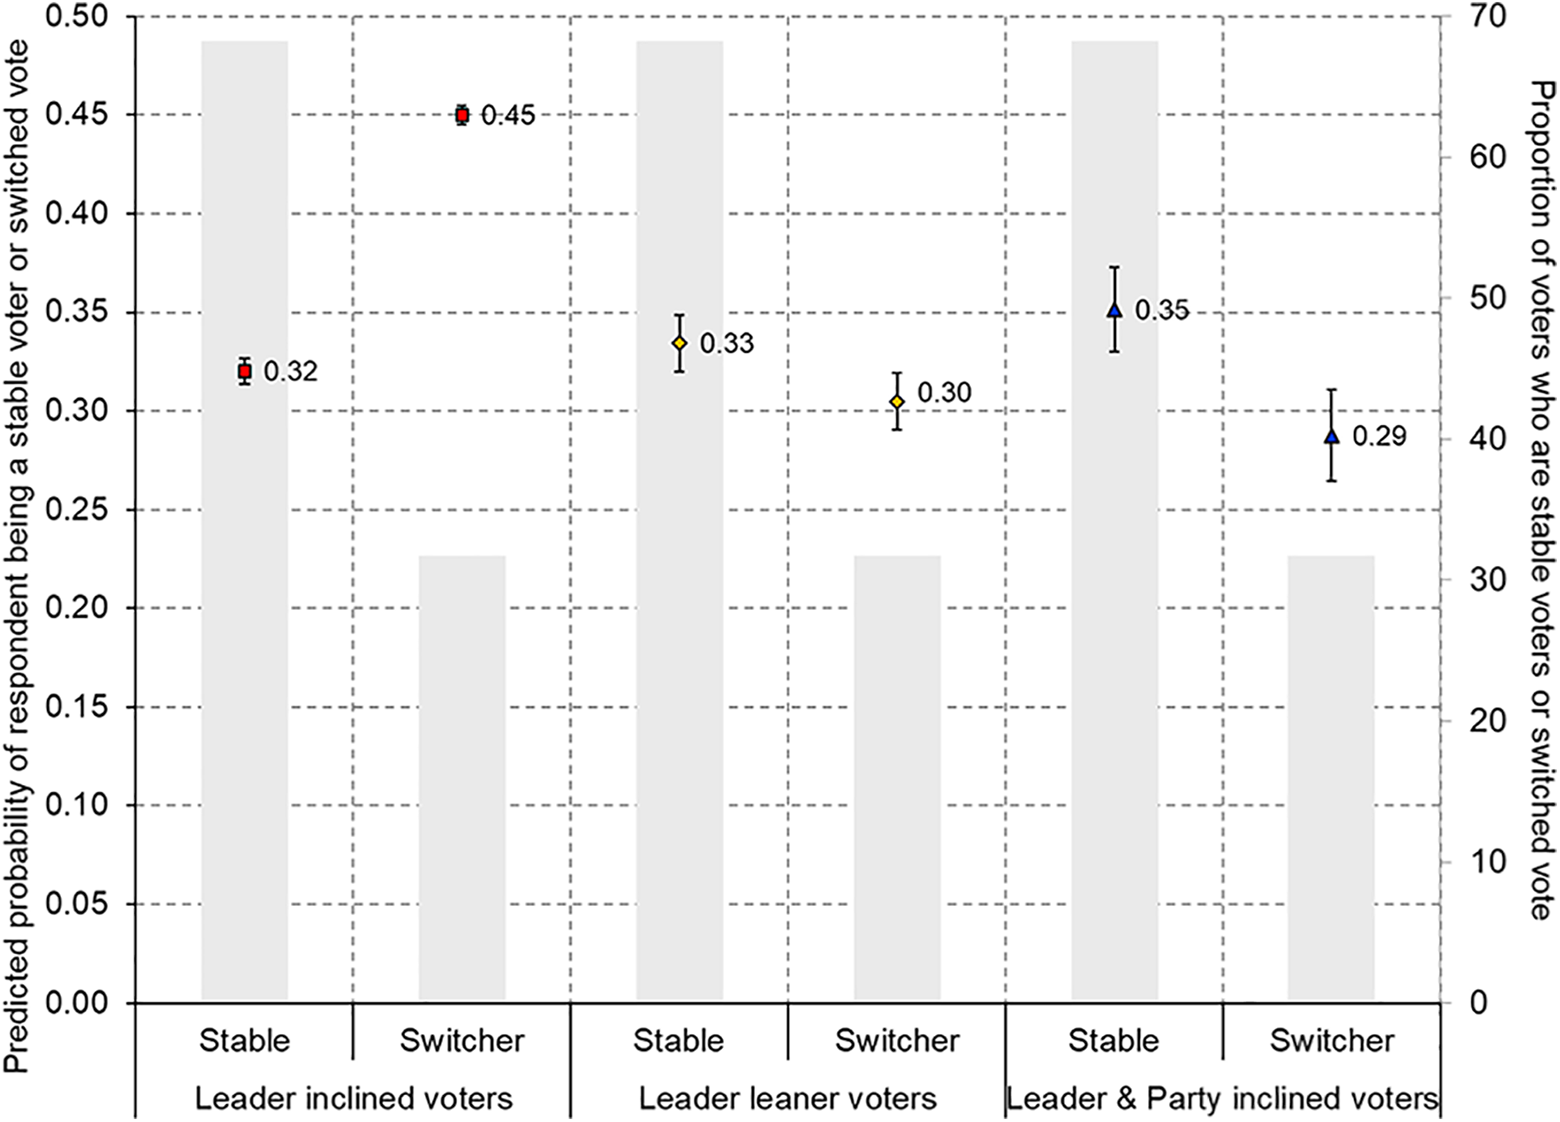
Predicted probability estimates of the impact of different voting groups (leader inclined, leader leaning, and leader and party inclined voters) reporting vote switching (reference category for analysis: Party inclined voters). Source of data: CSES (2019, 2020). Base: Table D8, appendix D. Note: The shapes depict the predicted probability estimates (left-axis). The vertical lines around the shapes represent the 95% confidence intervals. The gray bars indicate the proportion of voters in our sample who report being a stable voter or a vote switcher.
Discussion
Taking a comparative descriptive approach, we provide the first cross-national consistent quantification of leader inclined voting—a descriptive index that studies the alignment between vote choice and voters’ leader and party favorites. Our measure acknowledges the endogeneity issue which has plagued studies of leader motivated voting but alleviates it to the extent possible by disentangling leader inclined voting from party stimuli.
Our analysis shows that a small segment of voters (6%) are leader inclined voters who align their vote choice with their favorite leader and do not favor the party the leader leads. Let’s consider voters who give a higher score to the leader rather than the party. We can define what we call collectively as leader primary voters (i.e., vote choice aligns with leader favorability primarily). We find about 1/5 voters align their vote with their favorite leader more than their favorite party. It compares to over 1/3 of voters whose vote choice aligns more with party favorability principally. This shows that party favorability aligns with vote choice more often than leader favorability. Combining this with our finding that the proportion of voters who are leader inclined or leader primary inclined has not grown in the past 23 years provides nuance to the prevailing narrative that leaders alone are indispensable for electoral success and that their importance is growing.
To conclude that leader inclined voting is unimportant, however, would be premature. After all, 1/3 voters also align their vote with their favorite leader and favorite party simultaneously and do not distinguish their popularity for either. Consequently, leader inclined voting is likely to be somewhat higher than our 1/5 estimate as some of these voters may be principally motivated by the leader. That said, it’s also plausible some of this group are likely to be inspired by party favorability more too, thus questioning whether it would invalidate our finding that party favorability aligns with vote choice to a greater extent than leader favorability but this remains an open question.
Our paper goes beyond merely identifying the extent of leader inclined voting. We show voters who lack a party attachment are more likely to be motivated by the leader, whereas partisans are more likely to be driven by leaders and parties in equal measure. Ideological polarization is also crucial—the more polarized parties are on the ideological spectrum, the less likely voters are to principally align their vote with their leader favorite solely. We plow a fresh field by exploring how leader inclined voting influences vote switching. We find voters solely inclined by leaders are more likely to change their votes between elections. Our finding implies while leader inclined voting is far from uniform across electorates, leader-vote choice alignment (i.e., leader motivated voting) has notable consequences for election outcomes. Consequently, while leaders by themselves may solely be the essential motivation for only a small segment of voters, they have an important role to play, and parties are likely justified in spending an excessive amount of time in determining who leads them.
Our contribution, while making strides in the study of behavioral personalization, has limitations. First, critics may challenge our use of likeability scales as they are associated with measurement noise. Regrettably, they are the only consistent large-scale cross-national over-time measure of leaders available and in their defense they provide rich information and enable us to decipher respondent’s preferred leader and party. Second, our focus on popularity overlooks the dimension where the leader-vote function has received the most support—character traits (Bittner, 2011, 2018). Third, our paper has not teased out perhaps the most substantial realm from which leader effects on the vote can be channeled—the media. While most research on leaders and the media suggest it mediates leaders’ relationship with vote, more cross-national work on this strand would be worthwhile. Finally, perhaps the most significant critique is our reliance on cross-sectional data over the past quarter-century. Some may maintain this explains why we have failed to detect a growth in behavioral personalization, with studies showing this took root earlier than the period under study (e.g., Garzia et al., 2020). Additionally, this focus prevents us from probing the causal determinants more. In sum, the work on leader popularity and its electoral impact, particularly the causal sequence of party and leader popularity, is ripe for further exploration.
Supplemental material
Supplemental Material, sj-pdf-1-ppq-10.1177_13540688211019239 - Leader or party? Quantifying and exploring behavioral personalization 1996–2019
Supplemental Material, sj-pdf-1-ppq-10.1177_13540688211019239 for Leader or party? Quantifying and exploring behavioral personalization 1996–2019 by Stephen Quinlan and Ian McAllister in Party Politics
Footnotes
Acknowledgements
Earlier versions of the article were presented at the 2019 Canadian Political Science Association Conference (Vancouver, June 4-6), the 2019 CSES Conference “Democracy Divided? People, Politicians, and the Politics of Populism (Wien, June 14), and the 2019 Annual Meeting of the American Political Science Association (Washington D.C., August 29-September 1). We thank participants for insightful comments. We also appreciate the helpful critique from editors and anonymous reviewers. We thank Deirdre Tinney for additional feedback and proofreading and are incredibly grateful to Klara Dentler and Luisa Lutz for research assistance. We are also indebted to anonymous reviewers and the editor for constructive feedback and encouragement.
Declaration of conflicting interests
The author(s) declared no potential conflicts of interest with respect to the research, authorship, and/or publication of this article.
Funding
The authors disclosed receipt of the following financial support for the research, authorship, and/or publication of this article: The research was made possible by the support of the Australian National University (ANU) RSSS Fellowship Scheme which faciliated a research visit by Quinlan to the ANU in spring 2019. We are also grateful to the GESIS - Leibniz Institute for the Social Sciences Spitzenwisschafter Fund, which facilitated a visit by McAllister to GESIS in autumn 2018.
Supplemental material
Supplemental material for this article is available online.
Notes
References
Supplementary Material
Please find the following supplemental material available below.
For Open Access articles published under a Creative Commons License, all supplemental material carries the same license as the article it is associated with.
For non-Open Access articles published, all supplemental material carries a non-exclusive license, and permission requests for re-use of supplemental material or any part of supplemental material shall be sent directly to the copyright owner as specified in the copyright notice associated with the article.