
Abstract
Conventional wisdom is parliamentary elections have become more personalized. The idea of “leader-centeredness” pervades electoral politics, with leaders supposed to have a critical impact on election performance and popular leaders anticipated to yield significant electoral dividends, perhaps even more than party evaluations. While scholars agree leaders can and do matter to the vote, deliberations continue regarding the manifestation and extent of these effects. Using an original dataset inspired by popularity measures from the Comparative Study of Electoral Systems project and incorporating data from up to 87 elections in 30 polities, this article provides the first consistent aggregate quantification of demand-side behavioral personalization, disentangling the distinct and mutual influences of leader and party popularity to the extent possible. It finds that a leader’s popularity directly correlates with party vote share and the likelihood of winning office, evidence of demand-side behavioral personalization. However, the effect of leader popularity on its own is consistently less potent than that of party popularity, providing an imperative nuance to the narrative regarding demand-side behavioral personalization.
Introduction
Personalization—the promotion and focus on individual candidates and leaders, naturally assumed to be present in presidential systems considering voters vote for an individual by design—has been supposed to infuse many aspects of the politics of parliamentary systems, where parties have been the traditional standard-bearer actors. Research has classified three “arenas” (Pedersen and Rahat, 2021) where personalization can take root: institutional, media, and behavioral (also see Karvonen, 2010; Rahat and Sheafer, 2007). Studies have noted that several democracies have embraced institutional frameworks encouraging individuals over the party and other collective entities (Rahat and Sheafer, 2007; Renwick and Pilet, 2016; Stewart, 2018). The media’s coverage of politics has been documented to have become more individual-focused (Adam and Maier, 2010; Balmas et al., 2014; Stanyer, 2012; Van Aelst et al., 2012; although for more subtle interpretations, see Kriesi, 2011; Langer and Sagarzazu, 2018). And behavioral personalization—the impact of candidates and party leaders on politicians’ and voters’ behavior—some say, has become more prevalent, evidenced by parties’ election campaigns being more centered on individual personalities (e.g. Bøggild and Pedersen, 2018; Leahy, 2016; Zittel, 2015), or the supposed growing influence of candidates, especially leaders, on the vote (e.g. Aaldering, 2018; Garzia, 2014; Garzia et al., 2022; however for more nuanced inferences, see Aarts et al., 2011; King, 2002; Quinlan and McAllister, 2022). A vital premise of personalization in politics is that individuals gain prominence at the expense of collectivities (Karvonen, 2010; Rahat and Kenig, 2018). Such evolutions have been described as the presidentialization of parliamentary systems (Poguntke and Webb, 2005; Webb and Poguntke, 2013), with a recent cross-national review finding that on an array of metrics, politics is more personalized today than in previous decades in 22 of 26 democracies investigated (Rahat and Kenig, 2018).
With these developments, the prevailing narrative gaining traction in electoral politics is that individual politicians, particularly leaders, have a sizable, critical, and some say increasing, impact on election outcomes cross-nationally. At face, thinking of leaders like Pierre and Justin Trudeau in Canada, Jacinda Ardern in New Zealand, Angela Merkel in Germany, Bertie Ahern in Ireland, and Tony Blair in Britain, all of whom appeared to translate their personal popularity into electoral support, demand-side behavioral personalization—the academic vernacular—may seem ubiquitous. Indeed, there is scholarly consensus about the potential for leaders to leave both direct and indirect imprints on the vote. Nevertheless, the debate surrounding the extent of these effects, how they manifest, how we measure them, the circumstances in which leaders have a decisive influence, and whether the phenomenon of demand-side behavioral personalization is growing continues.
Central to ongoing deliberations is the impact of leaders on the vote independent of sentiments about the party they are standing for. Evidently, the two are linked, and both are assumed to correlate with the likelihood of a citizen supporting a party and with electoral dividends accrued. Indeed, the decline of partisanship (Campbell et al., 1960) in a host of democracies (Dalton, 2002) has been posited as one dynamic that has contributed to personality becoming more critical to citizen vote calculus, potentially rivaling the strength of partisanship (e.g. Garzia, 2014; Garzia et al., 2022; McAllister, 2007). These declining levels of citizen identification with parties, along with decreasing party membership (Van Biezen et al., 2011), and greater electoral volatility (e.g. Dassonneville, 2016; Mair, 2008), have prompted some scholars to herald the diminution of parties, with Mair (2013: 1), provocatively contending “the age of party democracy is gone.” In a recent review of their trailblazing work showing growing personalization across time, Garzia et al. (2021) opined: “Research depicts a grim prospect for the central actor of representative democracy: the political party.” Such dismal prognoses raise the question: how much influence do attitudes toward parties, independent of the individual who leads them, have on electoral support in a world where fewer people connect with them? And how does this play out vis-à-vis sentiments to party leaders? Dissecting the separate (and mutual) direct influences on the vote that party and leader evaluations have, where possible, is thus crucial to assessing whether the dismal prognoses of some regarding the impact of parties on the vote are well founded but also crucially to illuminating our understanding of demand-side behavioral personalization’s extent.
To advance these topics, I focus on popularity—an umbrella concept encapsulating the multiple pathways for leader and party evaluations to emerge and influence electoral performance. Significantly, to the extent possible, the article distinguishes leader popularity from party popularity. In doing so, the article crystallizes the distinct impact of each on electoral support, providing an enumeration of how many votes a popular leader and a popular party on average are associated with in elections today, a feat few studies have achieved In addition, this study advances our knowledge of demand-side behavioral personalization by exploring various facets of popularity. After all, popularity is not merely about being the most sought-after commodity. The flip side can be unpopularity, understudied in the behavioral personalization literature (an exception is Garzia and Ferreira da Silva, 2021). Research demonstrates how pessimistic features like negative partisanship (e.g. Mayer, 2017; Medeiros and Nöel, 2014) and affective polarization (e.g. Iyengar et al., 2019; Wagner, 2021) exert significant influences on voters. Moreover, we know that the popularity of something can depend on what else is on offer, with voter’s comparison shopping, as Mughan (2015) observes, weighing up the differences between parties and leaders, and popularity driven by these comparisons. In response, this article investigates the impact of being the most popular, the least popular, and the differential popularity between party and leader.
Besides the academic debates, there is another reason to explore demand-side behavioral personalization. We know the media devotes significant amounts of its coverage of politics to individual politicians, and parties spend a considerable amount of time choosing who shall be their “poster child” for the election. While leaders may act as a heuristic for voters come election time, some scholars opine that if electoral politics is too fixated on individuals, there is a danger of too much focus given to what former Australian Prime Minister Paul Keating referred to as “embroidery” (“The Recession We Had To Have,” 1993)—more attention on aesthetics and personality, and less consideration of policy (e.g. D’Arma, 2015; Mainwaring and Torcal, 2006; Poguntke and Webb, 2018). Voters who are less interested in politics are considered to be especially swayed by such dynamics (Aaldering, 2018). This could foster a cult of personality, which could be injurious to democracy (although for a positive view of personalization, see Kruikemeier et al., 2013). Consequently, quantifying the extent of behavioral personalization, especially vis-à-vis party evaluations, can enlighten our understanding of these dynamics.
The article tackles demand-side behavioral personalization from an aggregate-level perspective, novel among existing studies, and takes a comparative descriptive approach. This macro framework allows us to sidestep the endogeneity challenges that have proved a bugbear of individual-level analyses. With this approach, I remain agnostic about the causal sequencing of the relationship between party and leader evaluations and individual vote choice (see Dentler et al., 2024; Garzia, 2014). Instead, my goal is four-fold: 1) to quantify the impact of popularity in its various guises and determine its association with aggregate electoral outcomes to establish if the connections are in sync with the observable implications of demand-side behavioral personalization; 2) to establish the degree of the connection between leader popularity, independent of party popularity to the extent possible, and aggregate electoral dividends; 3) to demonstrate the weight of associations between party and leader popularity and electoral outcomes, allowing us to put demand-side behavioral personalization and the decline of party theses into a quantifiable and more precise context; and 4) to identify any temporal pattern between leader popularity and electoral dividends and see if demand-side behavioral personalization in recent elections is on the grow, as some scholars have assumed. I use an originally constructed dataset inspired by party and leader popularity measures gleaned from the Comparative Study of Electoral Systems (CSES, 2020, 2022) project, the industry “go-to” for studying electoral behavior cross-nationally. The study incorporates up to 553 observations of leader/party popularity for 87 elections spanning 30 polities across nearly a quarter of a century (1996–2020).
Four takeaways emerge from this article. First, I demonstrate a link between a party boasting the most popular leader, independent of that party’s popularity, and aggregate electoral performance—on average, parties gain votes when they are considered to have only the most popular leader. Leader unpopularity is also connected to aggregate vote share. These findings provide additional testimony to the demand-side behavioral personalization thesis—leaders matter to electoral success. Second, and unsurprisingly, the magic formula for electoral success is when a party is deemed to have the most popular party and the most popular leader. Third, there is no evidence that the connection between leader popularity and electoral dividends is strengthening over time, inconsistent with the expectations of growing demand-side behavioral personalization. And fourth, being considered the most popular party is associated with more electoral dividends than when a party merely boasts the most popular leader. These results provide an essential corrective to the narratives that we are beyond the age of party democracy—sentiments toward parties still exhibit solid connections to aggregate electoral dividends. Moreover, popular leaders hold electoral sway, but on average, they do not match popular parties’ electoral payoffs, offering valuable nuance to demand-side behavioral personalization.
Theory
Behavioral Personalization: The Story So Far
Behavioral personalization has two features: the supply side and the demand side. The supply side focuses on political actors—parties and politicians. Research has highlighted the centralization of power by prime ministers and their increased role at the expense of cabinets (McAllister, 2007; Poguntke and Webb, 2005) and the power of party leaders (Schumacher and Giger, 2017, 2018). The increasing emphasis placed on party leaders in selling the party’s message in election campaigns, significant considering the changing communications landscape of the last 50 years, where first television and today social media are prominent channels in engaging with voters, has also been noted (e.g. Boumans et al., 2013; Leahy, 2016; McAllister, 2007).
The other side of the coin—the demand side—centers on voters and election outcomes, and this article concentrates on that. Two potential levels (Pedersen and Rahat, 2021) for demand-side behavioral personalization exist—candidates and party leaders. To clarify the actor activating demand-side personalization, I use the terminology “leader-inclined voting” to denote my focus on leaders. While a sizable amount of literature shows attitudes toward candidates correlate with vote choice (Bøggild and Pedersen, 2018; Marsh, 2007; Marsh and Schwirz, 2016; Zittel, 2015), there is much greater deliberation about leader-inclined voting. Yes, there is consensus about its existence and its potential. However, there is debate regarding its manifestation, whether the effect is direct or indirect, the circumstances when leader-inclined voting is significant and for which voters, and whether the phenomenon is growing over time. While the nomenclature personalization has been the conventional taxonomy used to classify these questions, recent scholarship (Hellboe Pederson and Rahat, 2021) has distinguished between “personalized politics”—a specific point in time where individuals outweigh parties in politics, and “personalization of politics”—an increasing pattern over time where individuals become more important at the expense of parties, the latter requiring longitudinal data to investigate. While a reasonable distinction, both describe the phenomenon of individuals having greater importance than parties. This study incorporates data from 25 years of election studies, and thus can speak to both aspects. Hence, I use the general nomenclature of demand-side behavioral personalization.
The literature on demand-side behavioral personalization can be broken into two camps: the leaders’ matter school and the leaders’ minimalist school. The leaders’ matter school is the most enthusiastic about leader-inclined voting, with advocates claiming that leaders have a significant and, in many cases, determinative impact on election outcomes (e.g. Alexiadou and O’Malley, 2022; Bean and Mughan, 1989; Berz, 2019; Bittner, 2011; Costa Lobo and Curtice, 2015; Garzia, 2014; Garzia and De Angelis, 2016; Garzia et al., 2022). Research reaching this optimistic conclusion has embraced direct and indirect effects, with a comparative review of the issue concluding there is “very strong support for the importance of leader evaluations in the vote choices of electorates today” (Costa Lobo and Curtice, 2015: 247). Arguably, the most encouraging component of the leader-inclined voting literature is explorations of voter assessments of character—be it competence, honesty, compassion, or authenticity, all of which directly correlate with the vote (e.g. Bittner, 2011; Stiers et al., 2021). This strand of research also highlights the media as a mediator in the leader-vote function (e.g. Bos et al., 2011; Eberl et al., 2017), with media coverage shaping how candidates and leaders are perceived by voters, which, in turn, influences voters’ choice (e.g. Aaldering et al., 2018; Boumans et al., 2013; Kleinnijenhuis et al., 2019). Perhaps the most substantial claim emerging from this camp is that leader effects on the vote can be as strong as the impact of party evaluations. Some work (e.g. Garzia, 2014; Garzia and De Angelis, 2016) contends that much previous research has underestimated leader-inclined voting due to its implicit acceptance of the Michigan model of voter choice (Campbell et al., 1960), which attributes great importance to voters attachment to parties, assumed to be a relatively static citizen predisposition that has a determinative influence on shaping individual attitudes. Skeptics charge that statistical models complying with this assumption (i.e., supposing a funnel of causality logic with partisanship coming first in the causal chain) overlook the probable reciprocity between partisan leanings and leaders and the potential that voters first decide their evaluation of a leader and that this predilection subsequently influences their attitudes to the party (Garzia, 2014). These skeptics maintain that once model specification acknowledges the likely reciprocal forces, leader-inclined voting is more substantial than previously presumed, and rivals (and in some circumstances surpasses) the impact of party evaluations in the form of partisanship (Garzia, 2014: 79; Garzia and De Angelis, 2016: 620). Finally, the leaders’ matters camp is associated with the idea that leader-inclined voting, be it direct or indirect, has risen over time and is much more prevalent today than in previous decades (e.g. Garzia et al., 2022). A recent study concluded that “parties have faded away as collective identities and agents of political mobilization in contemporary democracies . . . they have been replaced to a large extent by their leaders” (Garzia et al., 2022: 328).
Conversely, the leaders’ minimalist camp reaches more reserved assessments about leader-inclined voting. This bloc of literature has concentrated on investigating leaders’ direct effects on the vote. While finding some evidence for leader-inclined voting, these effects tend to be modest and, importantly, secondary to the impact of party assessments (e.g. Aarts et al., 2011; Brettschneider et al., 2006; Dinas, 2008; Wessels and Wagner, 2013). Detractors contend that much of this research is context-specific and lacks sufficient longitudinal depth. Nevertheless, recent studies have discovered while leader evaluations directly correlate with individual vote choice, 1 in 5 voters align their vote principally with their favorite leader, while 1 in 3 do so with their favorite party, implying party evaluations have more direct sway (Quinlan and McAllister, 2022). While a recent study in Germany (Dentler et al., 2024) suggests when the simultaneous measurement of party and leader evaluations and the possibility of reciprocity between the leader and party appraisals are accounted for, leader popularity has a direct connection to voting, but its impact trails party popularity’s association, fitting with a leader minimalist perspective. This camp has also noted the conditionality of leader-inclined voting. For example, countless research has documented the direct impact of leader evaluations is stronger among vote switchers, late deciders, or voters who have no partisan attachment to a party (Barisione, 2009; Catellani and Alberici, 2012; Mughan, 2015). The leaders’ minimalist school draws a null conclusion regarding the idea of growing leader-inclined voting (Aarts et al., 2011; Kaase, 1994; Karvonen, 2010), although critics charge that the time horizon of most of these studies fails to capture when personality politics was on the grow (although for more recent evidence finding limited support for growing demand-side behavioral personalization, see Dentler et al., 2024; Quinlan and McAllister, 2022).
While much ink has been spilled on leader-inclined voting, current research has three challenges. The first is that different facets of leaders are often measured. Some studies evaluate popularity, while others investigate character traits. Some pit leaders and/or parties against one another, while others look at leaders in isolation. Researchers exploring the role of leaders vis-à-vis party have approached party effects by exploring partisanship, while other scholars, acknowledging the decline of party identification cross-nationally and that party assessment likely now comes in other forms, have investigated party popularity. While some are single-country case studies, others embrace more macro diversity. And then, some studies investigate direct effects, while others incorporate indirect effects. These varied approaches can hinder our ability to compare and interpret the pull of leader-inclined voting. Second, the quantification of leader-inclined voting is incomplete. While most studies offer predicted probability estimates of effects, Bittner (2011: 113–114) acknowledges that this can refer to the maximum potential impact of leader-inclined voting, with real effects potentially more moderate. Until recent work (Quinlan and McAllister, 2022), we lacked a consistent cross-national estimate of leader-inclined voting at the individual level, especially one acknowledging the distinctness of leader popularity from party popularity. But we need an enumeration of the electoral dividends that leaders can potentially yield to put the behavioral personalization effect in the proper context. Third, perhaps most complicated, is unraveling leader effects from party evaluations. To appropriately establish the extent of behavioral personalization, what is required is to acknowledge Särlvik and Crewe’s (1983: 131) 40-year-old sage advice that “(f)or the party leaders to have an independent, personal impact on the vote, they need to be judged separately and differently from their parties” (also see Holmberg and Oscarsson, 2011; Pedersen and Rahat, 2021). This involves moving beyond the accepted adage that party attachment has declined, and correspondingly, leader effects vis-à-vis this parameter have taken on greater weight, but realizing party evaluations now likely come in different guises and must be accounted for accordingly.
The Next Frontier: Testing the Macro Electoral Dividends of Leader-Inclined Voting
This article focuses on popularity—a form of likeability or acceptance accorded status by the collective consensus perception of citizens. Conventionally, popularity involves comparison shopping—evaluating something relative to something else (Mughan, 2015). Despite Oscar Wilde’s cautious presumption that “everything popular is wrong,” modern society places a high value on admiration. Thus, in theory, popularity benefits the commodity or actor that possesses it. For example, assets perceived as positive attributes are likely to have greater value (Ibbotson and Idzorek, 2014). Individual popularity has been linked to positive work outcomes (Scott and Judge, 2009). Thus, we can assume it will translate into the electoral arena in a similarly positive way.
Why focus on the popularity of leaders and parties? Arguably, it is an all-encompassing measure capturing the multiple pathways potentially connected to voting for an actor. Previous research has established physical attractiveness, or perceived personality characteristics like empathy, authenticity, honesty, or the ability to manage the government and policy (e.g. Bean and Mughan, 1989; Bittner, 2011; Stiers et al., 2021) is connected to perceptions of candidates and the vote. My objective is not to understand the motivations for leader or party popularity, which I acknowledge are likely multifaceted. Instead, it is to establish the connection between popularity and macro election performance. I argue that there is scope to assume that measuring the likeability of leaders and parties will broadly capture citizens’ sentiments toward both. Crucially, popularity is a concept that can be measured for both leaders and parties, unlike physical attractiveness or traits, which are associated with individuals and less commonly with collectives.
Popularity has several features. The trait that likely springs to most peoples’ lips is likeability and being deemed the most popular. When it comes to being the most accepted actor (i.e., the most popular Coie et al., 1982), this involves comparison with the other actors—either/or other leaders and parties, this requires parsing popularity to parties where popularity is ascribed merely to its leader and not the party itself (the most direct means of leader-inclined voting), those who assign popularity to the party but not the leader, and those who allot popularity to both or neither. Some studies at the individual level have pursued similar strategies (e.g. Mughan, 2015), but there has been no attempt to do so at the aggregate level. This study fills this void. I anticipate all forms of popularity will correlate with a party winning more votes and increase the likelihood of a party entering government. I posit that the strongest association will be when a party is ascribed as having both the most popular party and the most popular leader. However, I assume leader and party popularity by themselves will also directly correlate with electoral dividends. If leader-inclined voting has the distinct impact that some in the leaders’ matter school argue, it would be assumed that when popularity differs between party and leader, a party merely having the most popular leader should correlate with at least as robust an electoral bonus compared with the scenario when a party is considered the most popular.
There is a potential flip side—unpopularity—being the least liked. In 1944, journalist Franklin P. Adams assumed that “elections are won by men and women chiefly because most people vote against somebody rather than for somebody” (Ratcliffe, 2016: 2). Scores of studies have shown that negative partisanship—having a consistent adverse predilection to a party or its policies, which Abramowitz and Webster (2017) analogize as akin to a sports rivalry—holds great sway among segments of the electorate cross-nationally (e.g. Abramowitz and Webster, 2016; Mayer, 2017; Medeiros and Nöel, 2014). Another strand of literature observes affective polarization permeates electorates in several states, whereby citizens view people who are in sync with their partisanship positively but consider those who hold opposite views negatively, with this influencing vote (e.g. Iyengar et al., 2012, 2019; Iyengar and Westwood, 2015; Wagner, 2021). Thus, it is plausible that the unpopularity of a leader or a party can be associated with electoral loss. This aspect has recently entered the behavioral personalization arena with Garzia and Ferreira da Silva’s (2021) work on negative personalization, showing that adverse leader evaluations correlate with individual vote choice. Thus, I expect a similar mechanism to play out at the aggregate level, and unpopularity will be negatively associated with macro electoral performance. I anticipate unpopularity will cost a party electoral support and lessen the chances of entering government. I assume its most significant impact will be when a party is deemed the most unpopular party and simultaneously has the most unpopular leader. But if leaders are exhibiting potentially as strong influences as party, as some suppose, I assume that when unpopularity differs between party and leader, a party with the least popular leader will be connected to at least as significant electoral loss compared to a scenario when a party is merely deemed the most unpopular party.
Popularity, though, is not necessarily confined to an either-or dynamic. Behavioral personalization is most aptly tested when exploring the differences in favor ascribed to parties and their leaders, as it is here that the leader or party advantage will be most visible. This would be in line with Mughan’s (2015) “leader versus own party” model, which explored how the differences in likeability between party leader and voter partisanship correlated with reported vote choice for a similar intuition with leader and party likeability. I anticipate that the popularity differential is connected to aggregate electoral performance. If we accept the leaders matter school assumption of behavioral personalization, we might expect when the leader is considered more popular than the party in popularity comparisons; it will be connected to at least a significant electoral dividend than when the party is more popular.
Finally, there is the issue of whether there is an increasing pattern of leader effects on the vote. We know that leader effects on individual-level vote choice likely have a greater impact today than in previous decades (Garzia et al., 2022), contributing to the idea of an emerging “partyless democracy.” Increasing demand-side behavioral personalization over time is primarily interpreted through the lens of declining partisanship. However, party evaluations can influence the vote via mechanisms beyond party attachment. Moreover, recent growth in the phenomenon is less firmly established, though, and with a measure that explicitly acknowledges the distinction between party and leader evaluations to the extent possible, examining the over-time dynamics is worthwhile.
Even though the empirical evidence supporting the leaders matter school is mixed, considering conventional wisdom that demand-side behavioral personalization is on the rise in the electoral arena and the related literature supporting the personalization of politics in other arenas (institutional, media, and supply-side behavioral personalization), I formulate expectations as follows:
Expectation 1a: (Un)The popularity of leaders is directly connected to aggregate-level electoral performance. When a party is deemed to have the most popular leader exclusively, it will gain votes. When a party is judged to have the most unpopular leader exclusively, it will lose votes.
Expectation 1b: (Un)The popularity of parties is directly connected to aggregate-level electoral performance. When a party is deemed exclusively the most popular party, it will gain votes. When a party is judged solely the most unpopular party, it will lose votes.
Expectation 2a: The strongest association between (un)popularity and aggregate-level electoral performance will be when the (un)popularity between parties and leaders is in sync.
Expectation 2b: When (un)popularity differs between parties and leaders, a party ascribed to have the most (un)popular leader will be associated with at least as significant electoral dividends/losses than when a party is merely the most (un)popular.
Expectation 3: The direct association between a party having the most popular leader exclusively and its aggregate-level electoral performance becomes more robust over time.
Research Strategy
Data and Case Selection
The data is from an originally constructed dataset inspired by the Comparative Study of Electoral Systems Integrated Module Dataset (IMD) and Module 5 (CSES, 2020, 2022), cross-sectional micro-macro datasets exploring reported electoral behavior cross-nationally. Chosen by national election study investigators, CSES respondents evaluate up to nine parties and leaders. The study is restricted to parliamentary systems, as defined by the CSES, in sync with the premise personalization is considered a sine qua non in presidential systems.
I aggregated popularity measures from the individual to the party level to create the dataset. The unit of analysis is party, guided by the availability of party and leader popularity measures, with observations only included if measures were available for both. It results in observations from up to 87 elections in 30 polities over 25 years (1996–2020), including a maximum of 553 party/leader observations from parliamentary systems. The polities, parties, and leaders included in the dataset are listed in Appendix A. Aggregate-level election performance for parties and whether they entered government post-election comes from CSES’ extensive suite of macro data. Previous party vote share data comes from ParlGov (Döring and Manow, 2019).
Variable Operationalization and Modeling Approach
Our primary independent variable is the party’s popularity and the leader’s popularity. Each respondent to the CSES post-election survey evaluates multiple parties and party leaders on an 11-point likeability scale ranging from 0 (strongly dislike) to 10 (strongly like). I take the mean likeability assigned to each party and each leader as a benchmark of their popularity and then rank each party vis-à-vis the other parties and each leader concerning all the leaders. The most popular of each is ascribed a score of 1; the second most popular is assigned a score of 2, and so forth. From this, three different measures of popularity are devised. Our first measure classifies the most popular party and most popular leader (mostpop) based on parties and leaders assigned a rank score of 1. From these assignments, I parse the parties into four groups:
Parties where neither the leader nor the party was classified as most popular.
Parties where the leader is most popular, but the party is not.
Parties where the party is considered the most popular but not the leader.
And parties where both the leader and the party are the most popular.
Appendix D provides an example of this operationalization. 1
Our second measure categorizes the least popular party and least popular leader (leastpop). It follows a similar intuition to the first measure, except the least popular is classified as the lowest ranking assigned to each party or each leader. The third measure—popularity differential (popdiff)—is computed by taking the leader popularity ranking from the party popularity ranking. Positive values indicate the leader is more popular, negative values indicate that the party is more popular, and a score of 0 indicates no difference in the popularity rank. I then recode this into a trichotomy—no difference, leader more popular, and party more popular. 2
I recognize this partitioning does not allow us to fully capture the distinct dynamics of leader and party popularity’s independent connection with electoral dividends, given there is a category where both the party and the leader are simultaneously considered the most (un)popular. Thus, we will not be able to disentangle fully the endogeneity issue that has bedeviled studies of behavioral personalization (see Dentler et al., 2024; Garzia, 2014). Nevertheless, it alleviates some challenges and separately models the distinct impacts of party and leader popularity, an advance on previous studies.
There are three dependent variables to capture electoral performance. 3 The first is the percentage vote share a party achieves in the parliamentary election. 4 The second is whether a party won a plurality vote share—a dichotomous measure coded 1 for a party that won the most votes and 0 for all others. The third measure, classifying whether the party entered government after the election, is also a dummy variable, coded 1 for those who entered government and 0 for those who did not. To investigate whether popularity dynamics on the vote have shifted over time, I interact a continuous variable capturing time categorized as the year the survey was conducted with the primary independent variables. 5
I estimate ordinary least squares (OLS) models to study the connection between aggregate vote share and (un)popularity. I estimate logit models to investigate the link between (un)popularity, winning a plurality of the vote, and gaining office. Besides our primary independent variables of (un)popularity, I control for the party’s previous vote share in the election and whether the party was part of the incumbent government, standard correlates when modeling aggregate-level electoral behavior (e.g. Cuzan, 2015; Lewis-Beck and Rice, 1984). All models include election fixed effects to avoid critiques of omitted variable bias at the macro level. All models are estimated with robust standard errors given the data’s nested structure. Summary statistics and details of the operationalization of the variables are available in Appendices A and B.
Analysis
The Popularity Contest: Leader Versus Party Popularity
Of the 87 elections where the most popular party and leader can be deciphered, in 77% of instances, the most popular party and the most popular leader were the same. The remaining cases in the sample deviate—admittedly slight but sufficient variation to allow parsing of the data into four distinct categories. 6
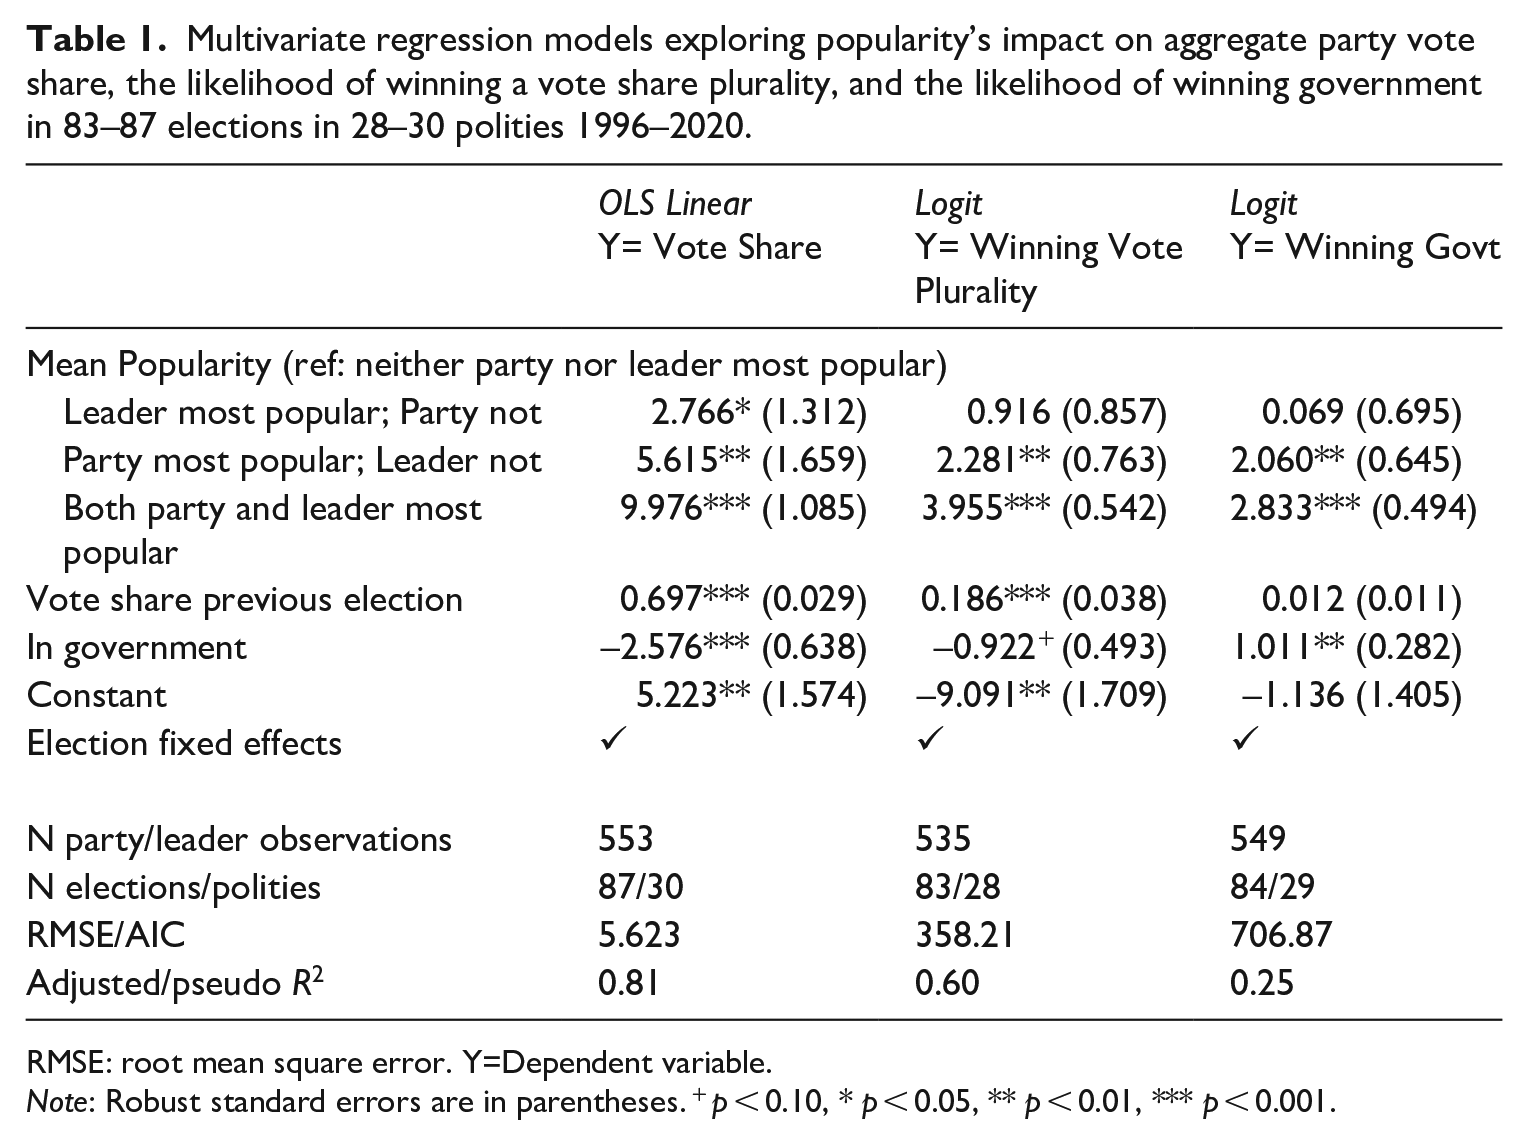
Table 1 explores the connection between the most popular leader and party on macro vote share and the probability of winning a plurality of the vote and winning government. We see a connection between when a party is deemed to have the most popular leader but is not considered the most popular party and its vote share. On average, a party in this scenario gains 2.8 points compared to a party deemed to have neither the most popular leader nor the most favored party. It supports expectation 1a and leader-inclined voting. As anticipated, the magic formula of popularity is when a party is ascribed to be the most popular and judged also to have the most popular leader. It is associated with an average 10-point increase in vote share compared to a party that is not considered the most popular party nor has the most popular leader—in line with expectation 2a.
Multivariate regression models exploring popularity’s impact on aggregate party vote share, the likelihood of winning a vote share plurality, and the likelihood of winning government in 83–87 elections in 28–30 polities 1996–2020.
RMSE: root mean square error. Y=Dependent variable.
Note: Robust standard errors are in parentheses. + p < 0.10, * p < 0.05, ** p < 0.01, *** p < 0.001.
When a party is judged the most popular, but its leader is not, it is linked to a party gaining more votes. Parties in this scenario earn, on average, 5.6 points more of the vote than if the party nor its leader is considered popular support for expectation 1b. Notably, this is two times more the increased vote share than the leader popularity effect and demonstrates the allure of party evaluations, against the expectations of some in the leaders matters school, which assumed leader evaluations could be connected with more significant (or similar) electoral dividends than party popularity. 7
Regarding the likelihood of topping the poll and winning government, neither coefficient for leader popularity reaches statistical significance (p < 0.05), implying no support that leader popularity has a sufficient connection with these electoral dividends, against expectation 1a. But being considered the most popular party is positively connected to the probability of winning the most votes and gaining office, support for expectation 1b. Figure 1 plots the predicted probabilities of each level of popularity on electoral performance while holding all other variables in the models constant at their observed values. We see that a party deemed not to be the most popular but considered to have the most popular leader has a predicted probability of 0.12 of winning the most votes. Compared to a scenario when the party is the most popular, but its leader is not—the likelihood of winning the most votes is estimated to be 0.24, a 12-point difference. As expected, the likelihood of winning the most votes when a party is deemed most popular and considered to have the most popular leader is anticipated to be 0.42, in line with expectation 2a. This pattern is even more concrete regarding the likelihood of winning government. Figure 1 shows that the estimated chance of winning government when the leader of a party is merely deemed most popular is 0.28. But the probability of winning government when the party is considered the most popular is estimated to be 0.66, a 38-point difference, rising to 0.78 when a party is deemed the most popular party and has the most popular leader, in line with expectations 1b and 2a, respectively.
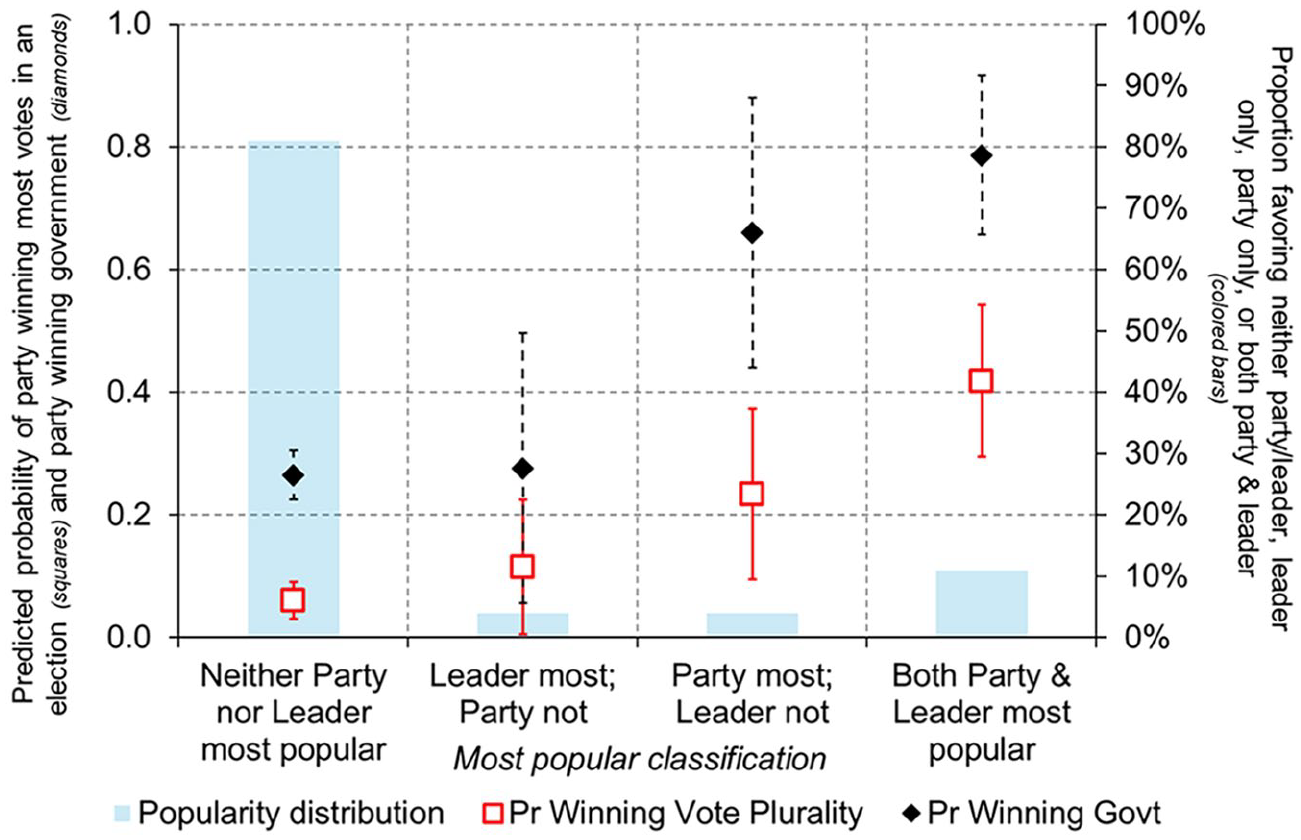
Average predicted effects of popularity on the likelihood of obtaining plurality vote share (squares) and winning government (diamonds) in 83 (squares) to 85 (diamonds) elections in 28 (squares) to 29 (diamonds) polities 1996–2020.
What have we learned? As expected, leader popularity on its own positively correlates with aggregate vote, sustaining the idea of leader-inclined voting and support for expectation 1a. The most significant electoral dividends are associated with a party having the most popular leader and simultaneously being deemed the most popular party. But importantly, the analysis identifies that when popularity between party and leader diverges, party popularity compared with leader popularity has a more powerful connection with the aggregate electoral performance, as it is directly connected to aggregate vote share, and the likelihood of winning the most votes and office, and in the main, yields greater electoral dividends.
Losing the Popularity Contest
In about 7 of 10 instances, the most unpopular party and unpopular leader were identical. In the remaining 30% of cases, they diverge, meaning the variation is modest but sufficient to evaluate the unpopularity expectations.
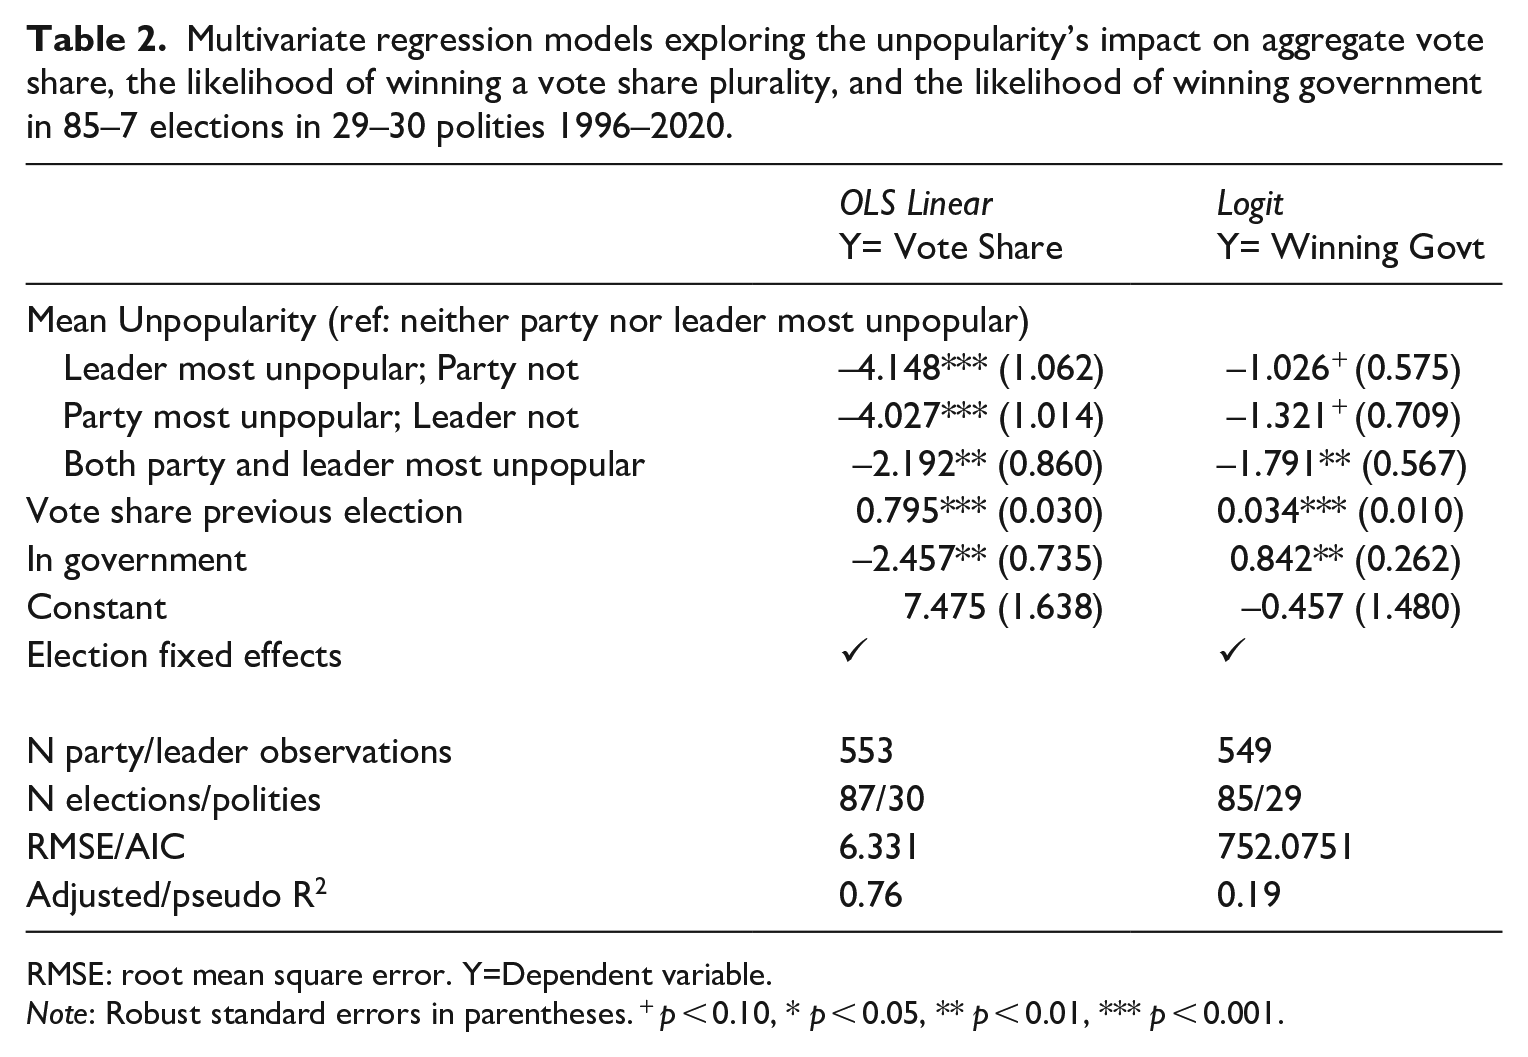
Table 2 shows the impact of unpopularity on electoral performance. Here the analysis is confined to its connection with vote share and winning government, as the chances of topping the poll when the leader and the party are concurrently the most unpopular is implausible. Regarding vote share, when a party is considered to have the most unpopular leader, on average, it is linked to a 4.1-point decrease in macro vote share compared to when the party does not have an unpopular leader or is not ranked as the most unpopular party. This supports expectation 1a—the unpopularity of a leader is connected to a party’s vote yield and suggests a negative dimension to leader-inclined voting, further testimony of demand-side behavioral personalization. Compare this to a scenario when the party is solely considered the most unpopular—this is linked to an average 4.0-point decrease in vote share, support for expectation 1b, and notably of similar magnitude as leader unpopularity. Surprisingly, when a party is regarded as the most unpopular party and deemed to have the most unpopular leader, it is associated with only an average 2.2-point decline in vote share, significantly less than the average vote share drop when unpopularity is on a single-dimension. It is not evident why a double whammy of unpopularity is not more costly.
Multivariate regression models exploring the unpopularity’s impact on aggregate vote share, the likelihood of winning a vote share plurality, and the likelihood of winning government in 85–7 elections in 29–30 polities 1996–2020.
RMSE: root mean square error. Y=Dependent variable.
Note: Robust standard errors in parentheses. + p < 0.10, * p < 0.05, ** p < 0.01, *** p < 0.001.
The models detect no statistically significant evidence that leader unpopularity alone or party popularity alone are connected to winning government, with each coefficient only statistically significant at p < 0.1. But when a party is considered the most unpopular in addition to having the most unpopular leader, it is associated with a significantly reduced likelihood of winning government, in line with expectation 2a that assumes the most robust connection with electoral dividends will be when unpopularity is in sync on both dimensions. Figure C1 (Appendix C) explores this. It shows that when neither the party nor its leader is deemed the most unpopular, the probability of winning the government is estimated to be 0.38. It falls to 0.22 when a party has solely the most unpopular leader and 0.17 when it is considered the most unpopular party. When unpopularity befalls both the party and the leader, the likelihood of winning the government is estimated to be 0.12. In sum, party and leader unpopularity are connected to votes, which aligns with the general expectations. Unpopularity has a more consistent connection to obtaining votes and less of a consistent link with the likelihood of winning office.
Popularity Differential
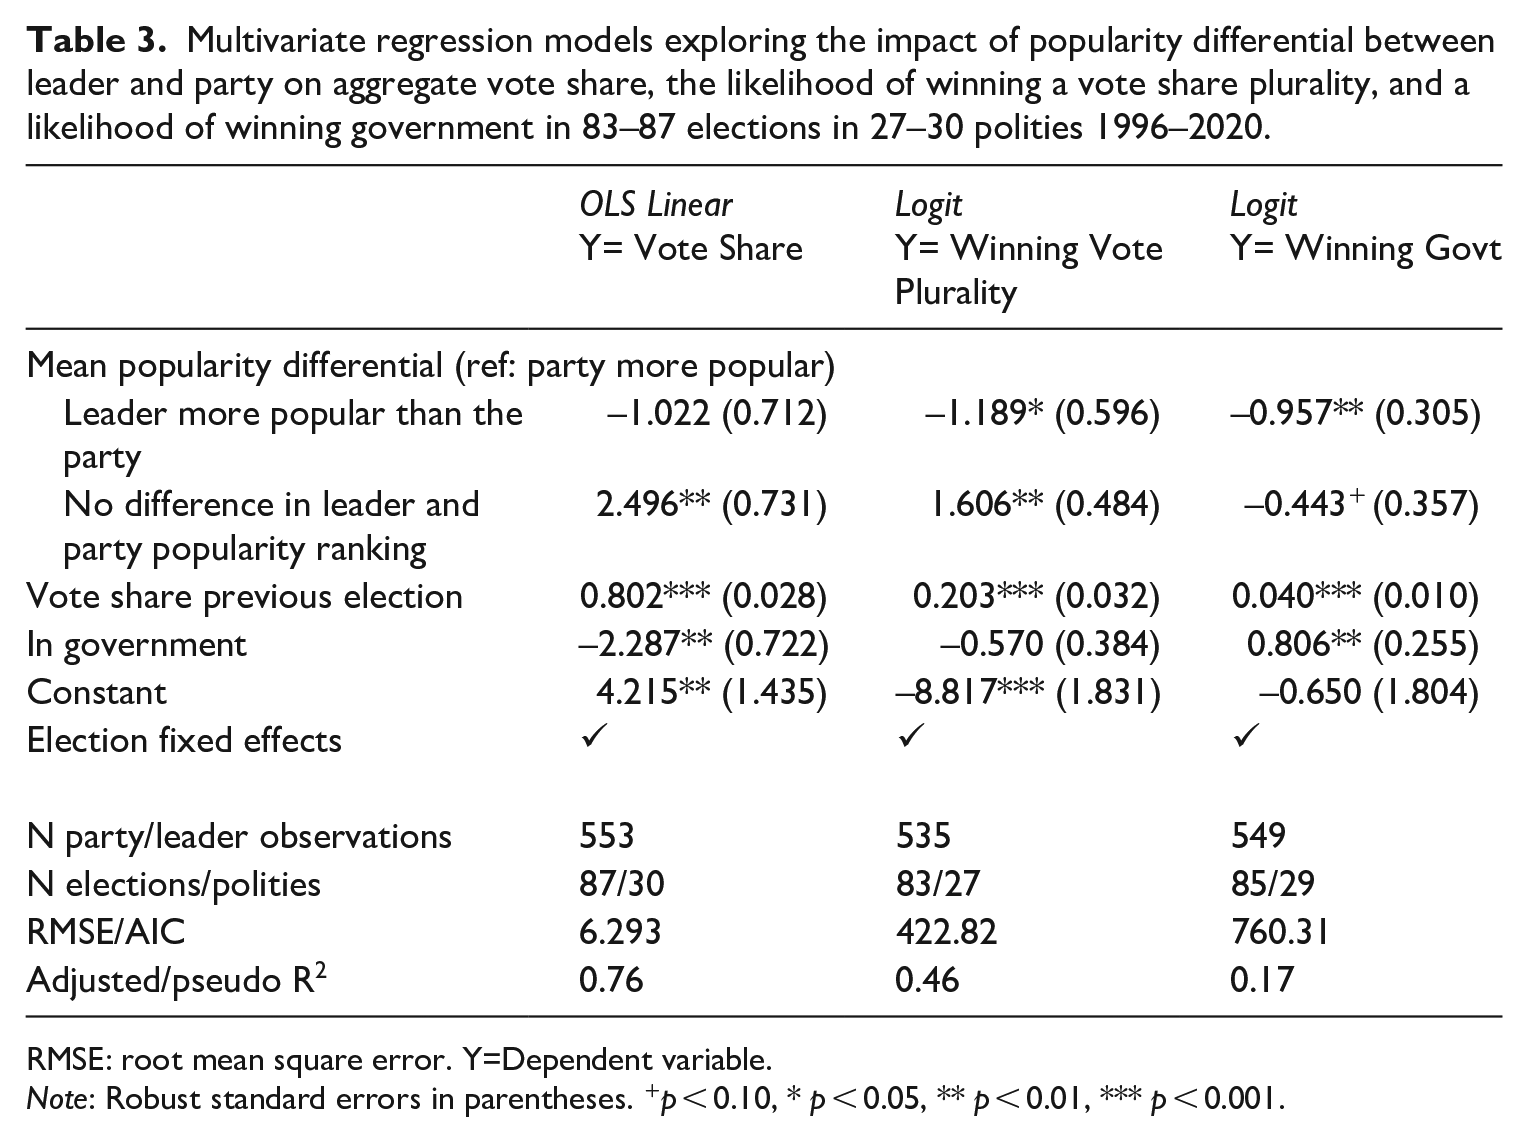
The final measure of popularity is to look at the popularity differential—the difference between the leader and the popularity of a party. In about half of the cases in the sample, the party and leaders attained the same popularity ranking, meaning there is much greater variability in this measure. This arguably provides the most robust test of leader-inclined voting as we are explicitly separating the difference in popularity rank between the two. Table 3 examines this connection.
Multivariate regression models exploring the impact of popularity differential between leader and party on aggregate vote share, the likelihood of winning a vote share plurality, and a likelihood of winning government in 83–87 elections in 27–30 polities 1996–2020.
RMSE: root mean square error. Y=Dependent variable.
Note: Robust standard errors in parentheses. +p < 0.10, * p < 0.05, ** p < 0.01, *** p < 0.001.
Regarding vote share, there is no discernable connection between vote share and scenarios when the leader is more popular than the party—the coefficient is negatively signed, implying there is a negative link and does not reach conventional levels of statistical significance. This represents insufficient evidence for expectations 1a or 1b—there is no support that a popularity advantage on leadership is connected to a more significant vote harvest. But we see that when the party and leader’s popularity rank are in sync, the vote share for a party, on average, is 2.5 points higher than when the party is more popular than the leader. This aligns with expectation 2a—the popularity connection with votes is most evident when the two are aligned.
Exploring the association with topping the poll, we discover support for expectation 2b that leader popularity is associated with a smaller likelihood of winning a plurality of the vote vis-à-vis party popularity. The possibility of winning the most votes is estimated to be 0.23 when there is no difference in party or leader popularity. However, the likelihood of topping the poll is 0.05 when the leader is more popular. In contrast, when the party is more popular, it is forecast to be 0.11, a modest but notable difference. Hence, there is no support for expectation 2b—leader popularity is not associated with a greater chance of winning the most votes vis-à-vis party popularity.
The pattern is more acute regarding the likelihood of winning government. Figure 2 shows that when there was no difference between party and leader popularity, the possibility of winning office is estimated to be 0.34. When the leader is ranked more popular than the party, the likelihood of winning government is 0.24. Compare this to when the party was ranked more popular than the leader, and the possibility of entering government rises to 0.42, an 18-point difference. Again, the analysis suggests party evaluations are more strongly connected to electoral dividends. The message from the popularity differential analysis is mixed. Differences in popularity between leader and party are not associated with significantly different vote yields. But there seem to be meaningful effects in topping the poll, but most distinctly in winning government, where a higher party popularity ranking is associated with a higher likelihood of entering office than a higher leader popularity ranking.
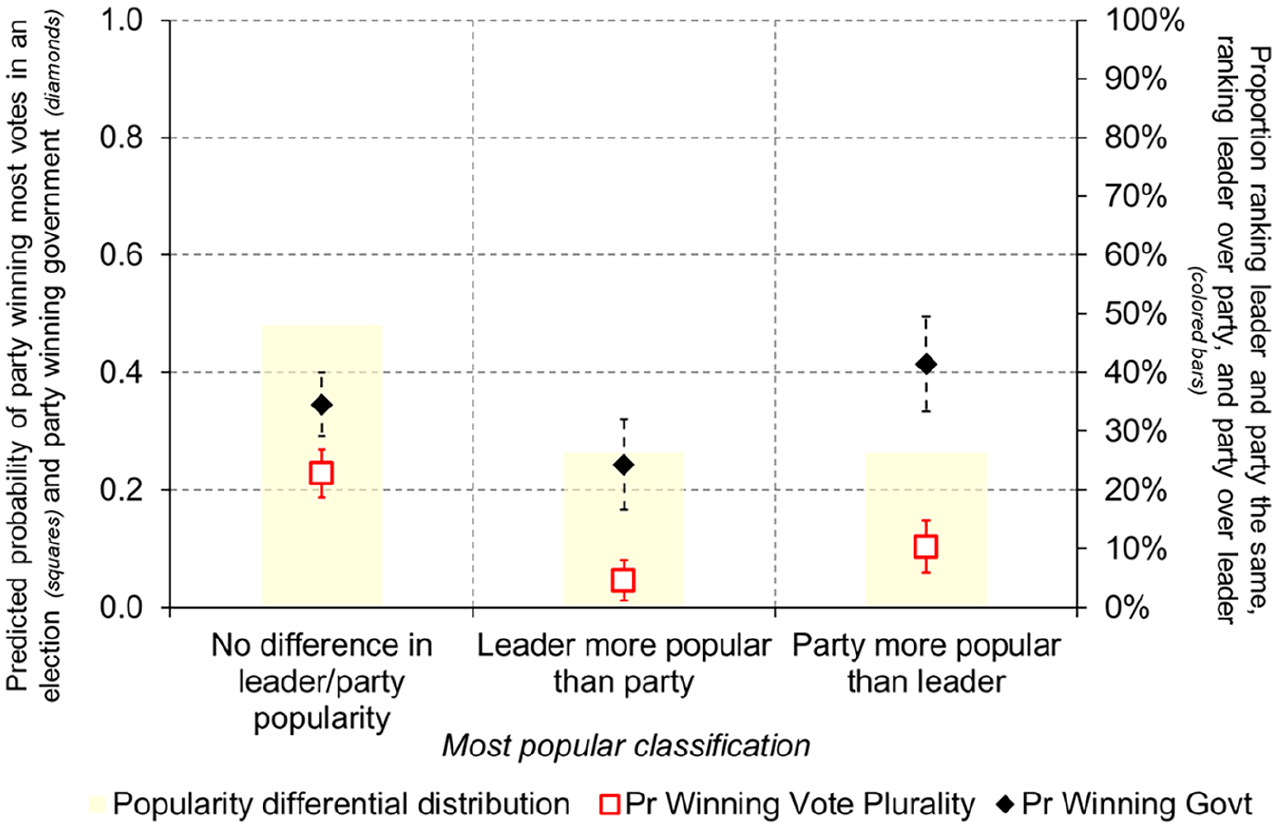
Average predicted effects of popularity differential on the likelihood of winning vote share plurality (squares) and winning government (diamonds) in 83 (squares) to 85 (diamonds) elections in 27 (squares) to 29 (diamonds) polities 1996–2020.
Testing the Popularity and Vote Connection Across Time
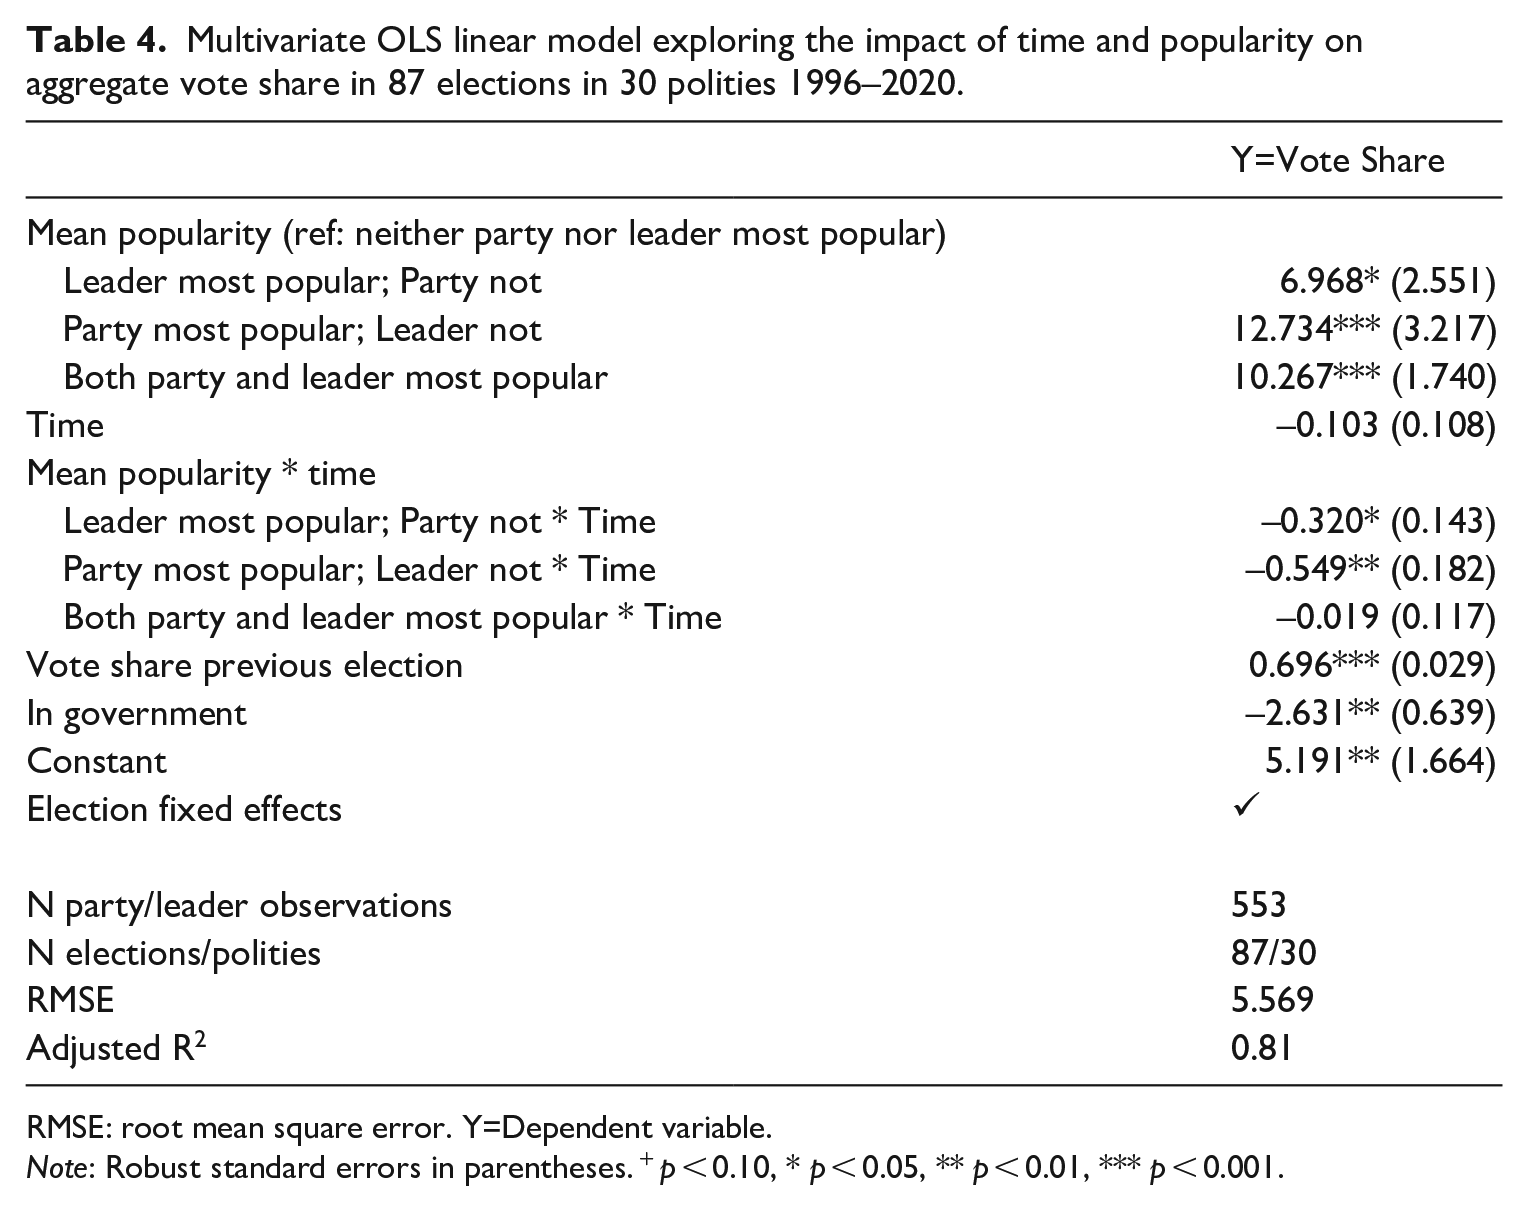
Table 4 tests whether leader and party popularity dynamics have become more critical to electoral performance across time with a series of interactions between time and our popularity measures, with our focus solely on vote share for this supposition. Suppose leaders have become more critical in shaping aggregate electoral performance, as the demand-side behavioral personalization thesis assumes. In that case, I anticipate a positive and statistically significant interaction term for popularity measures connected to the leader and time. Regarding vote share, the interaction coefficient between the most popular leader alone and time is negative, against expectations. It indicates that the effect of having the most popular leader solely on vote share decreases over time by an average of 0.32 points each year (compared to a decrease of –0.103 points each year for a leader who is not the most popular, as indicated by the time coefficient). Notably, the interaction term for most popular party and time is also negative and statistically significant (–0.549), implying the effect of being the most popular party on vote share decreased over time, too, and more so than leader popularity. These analyses suggest that having the most popular leader by itself or being the most popular party alone on average provides a vote share boost. However, these electoral advantages aeroded over time, indicating that voter evaluations of leader and party popularity have become less potent in delivering aggregate electoral dividends, certainly against expectation 3 and a view that leader effects are more likely to yield greater electoral gains over time. 8
Multivariate OLS linear model exploring the impact of time and popularity on aggregate vote share in 87 elections in 30 polities 1996–2020.
RMSE: root mean square error. Y=Dependent variable.
Note: Robust standard errors in parentheses. + p < 0.10, * p < 0.05, ** p < 0.01, *** p < 0.001.
Conclusion
Twenty years ago, Poguntke and Webb (2005: 5) observed: “all aspects of the electoral process are decisively molded by the personalities of leading candidates.” Since then, personalization suffusing various aspects of the politics of parliamentary systems has reached aphorism status. Nevertheless, this has sometimes obscured ongoing debate about the impact of political leaders on electoral politics. Taking a comparative descriptive and longitudinal approach, this article focuses on the connection between leader popularity, distinct to the extent possible from party popularity, and electoral performance at the aggregate level, providing a first quantification of the phenomena.
There are four key results to emerge from the study. First, I show that demand-side behavioral personalization is active at the aggregate level. A party can expect to win about three percentage points more on average when its leader is deemed the most popular, but the party is not. I also discovered that a party with the least popular leader solely is connected to electoral performance, and is on average associated with a mean 4-point loss in vote share. It adds crucial testimony to demand-side behavioral personalization. Leaders can and do matter to the vote in themselves. Second, and unsurprisingly, the magic electoral ingredient is when a party is deemed the most popular and is considered to have the most popular leader. It correlates with winning more votes, an increased likelihood of topping the poll, and winning government. Third, the analysis finds little evidence of an increasing connection between leader popularity and electoral performance across time, weakening the thesis of increasing demand-side behavioral personalization, at least in recent years. Nevertheless, to conclude that there has been no growth in behavioral personalization generally from these analyses would be hasty. Detractors will counter that more detailed analysis and a more extended time series is required to sustain this premise, as the most persuasive evidence showing increasing behavioral personalization implies it developed in the 1980s/1990s (Garzia et al., 2022). This time series might fail to capture it. However, this analysis suggests any growth in the electoral sway of leaders may be a phenomenon of a particular time and might be less salient in recent years, but further research is required to sustain this. Fourth, and perhaps the most important finding to emerge from this study, party popularity consistently has a stronger connection to macro electoral performance than leader popularity, yielding a more significant electoral dividend in votes and winning government. This implies that party appraisals retain potency and that doomsday predictions of the age of party democracy and their diminishing connection to electoral performance may be premature. The analysis allows us to put demand-side behavioral personalization into an appropriate context. Leader-inclined voting is active and has notable aggregate-level electoral implications by itself. However, leaders’ direct impact remains secondary to the parties’ direct effect, which fits more with the leaders’ minimalist school. These findings emphasize that parties retain a central role in the democratic process, a remarkable feat given the personalization trends in non-electoral politics and a decade that might be legitimately called populism’s golden age, where electoral actors promoting a leader-centered approach have gained traction. This suggests the dismal prognosis of party decline and of partyless democracy are hasty.
Skeptics may contend focusing on direct connections ignores indirect associations highlighted in the demand-side behavioral personalization literature. While this study does not account for indirect effects, it tests the premise of direct associations with the vote, which is central to the demand-side behavioral personalization thesis. Detractors may query the use of thermometer scales due to potential measurement noise. However, these are the only consistent cross-national measures and they do provide rich information. Some may disagree with capturing attitudes to parties using party popularity scales, given that behavioral personalization has been strongly linked with the decline in party attachment. This overlooks that declining partisanship does not negate that party evaluations still influence the vote in alternative ways. Since partisanship has been concentrated on only a segment of the electorate in recent years, a preoccupation with this measure of party risks only giving a partial picture. Finally, while this comparative descriptive design may not fully reveal causal determinants, it provides valuable nuance by decomposing leader and party popularity, contributing to the ongoing discussion. This is unlikely to be the last word on the subject.
Supplemental Material
sj-docx-1-psx-10.1177_00323217241300991 – Supplemental material for The Popularity Factor: A Comparative Investigation of Demand-Side Behavioral Personalization
Supplemental material, sj-docx-1-psx-10.1177_00323217241300991 for The Popularity Factor: A Comparative Investigation of Demand-Side Behavioral Personalization by Stephen Quinlan in Political Studies
Footnotes
Acknowledgements
Earlier versions of this article was presented at the 2023 Midwest Political Science Association Conference (Chicago, April 12–15, 2023), the University of Montenegro (Podgorica, April 2024), and the GESIS – Leibniz Institute for the Social Sciences Research Day (Köln, October 2024). I thank the participants for their insightful comments. I also acknowledge the encouragement and valuable feedback of anonymous reviewers and the superb research assistance of Flynn Schirott. As ever, all remaining errors are mine.
Data availability
Declaration of Conflicting Interests
The author(s) declared no potential conflicts of interest with respect to the research, authorship, and/or publication of this article.
Funding
The author(s) received no financial support for the research, authorship, and/or publication of this article.
Supplemental Material
Additional Supplementary Information may be found with the online version of this article.
Contents
Appendix A: Study Overview and Summary Statistics.
Table A1: Summary Statistics
Table A2: Correlations between leader popularity and party popularity in non-Presidential elections
Table A3: Summary of Election Studies by Polity included in the analysis.
Appendix B: Variable Operationalizations.
Appendix C: Supplementary Analysis.
Figure C1: Average predicted effects of unpopularity on the likelihood of winning government in 86 elections in 27-8 polities 1996–2020. Note: Analysis based on ![]() , model II. Variables held constant at their observed values. Shapes indicate the predicted probability of voting for a party. Vertical lines around the shape depict the 95% confidence intervals associated with the estimates. Colored bars indicate the distribution of the variable.
, model II. Variables held constant at their observed values. Shapes indicate the predicted probability of voting for a party. Vertical lines around the shape depict the 95% confidence intervals associated with the estimates. Colored bars indicate the distribution of the variable.
Table C1: Multivariate regression models exploring the impact of the mean popularity of the party and mean popularity of the leader on the vote share in 87 elections in 30 polities 1996-2020.
Table C2: Multivariate regression models exploring the impact of popularity on vote share, the likelihood of winning a vote share plurality, and the likelihood of winning government in 82–84 elections in 27–28 polities 1996–2020.
Table C3: Multivariate regression models exploring the impact of popularity on vote share, the likelihood of winning a vote share plurality, and the likelihood of winning government in 93–98 elections in 32–34 polities 1996–2020—including semi-presidential systems.
Table C4: Multivariate regression models exploring the impact of popularity on vote share, the likelihood of winning a vote share plurality, and the likelihood of winning government in 80–84 elections in 26–28 polities 1996–2020—democracies only.
Table C5: Models exploring the impact of unpopularity on vote share, the likelihood of winning a vote share plurality, and the likelihood of winning government in 84–6 elections in 28–29 polities 1996–2020—democracies only.
Table C6: Models exploring the impact of popularity differential between leader and party on vote share, the likelihood of winning a vote share plurality, and a likelihood of winning government in 83–87 elections in 28–30 polities 1996–2020—democracies only.
Table C7: Models exploring the impact of popularity differential between leader and party on vote share (categorical classification), the likelihood of winning a vote share plurality, and a likelihood of winning government in 83–87 elections in 28–30 polities 1996–2020—alternative classification of party differential.
Table C8: Multivariate OLS regression models exploring the impact of median popularity on vote share in 87 elections in 30 polities 1996–2020.
Table C9: OLS models exploring the impact of time and popularity, time and unpopularity, and time and popularity differential on vote share in 86 elections in 28 polities 1996–2020—alternative specification of time.
Table C10: OLS models exploring the impact of time and popularity, time and unpopularity, and time and popularity differential on vote share in 86 elections in 28 polities 1996–2020—time specified as decade.
Table C11: OLS models exploring the impact of time and popularity, time and unpopularity, and time and popularity differential on vote share in 86 elections in 28 polities 1996–2020—time specified by CSES Module.
Table C12: Multivariate OLS regression models exploring the impact of popularity on seat share in 87 elections in 30 polities 1996–2020.
Table C13: Logit model exploring the impact of time and unpopularity in 87 elections in 30 polities 1996–2020.
Table C14: Logit model exploring the impact of time and Popularity differential in 87 elections in 30 polities 1996–2020.
Appendix D: Examples of Party and Leader Popularity Classifications in practice.
Table D1: Mean popularity and popularity ranking for parties and leaders in the 1996 Australia Parliamentary election.
Table D2: Mean popularity and popularity ranking for parties and leaders in the 2006 Sweden Parliamentary election.
Notes
Author Biography
References
Supplementary Material
Please find the following supplemental material available below.
For Open Access articles published under a Creative Commons License, all supplemental material carries the same license as the article it is associated with.
For non-Open Access articles published, all supplemental material carries a non-exclusive license, and permission requests for re-use of supplemental material or any part of supplemental material shall be sent directly to the copyright owner as specified in the copyright notice associated with the article.