
Abstract
There is growing evidence that voter and party positions on economic items do not conform to a left–right dimension. This article proposes that in Northern Eurozone states voter policy positions on economic issues are characterized by two dimensions: A redistribution dimension that consists out of views on income equality and a reform dimension that divides those who favour reform of the welfare state to ensure its long-term sustainability and those who oppose such reforms because they would hurt those who need the welfare state now. It examines to what extent voters positions on economic issues conform this two-dimensional pattern, employing the 2012 Dutch Election Survey; to what extent positions on these dimensions reflects voters’ attitudes on other issues and demographic characteristics; and to what extent these two dimensions help to understand voting behaviour. It shows that indeed a multidimensional approach to economic issues is justified; that voters who oppose reforms are characterized by higher levels of Euroscepticism; and that this reform dimension helps to understand voting behaviour, in particular preferences for the socialist, social-democratic and social-liberal party.
Introduction
Political scientists, since Lipset et al. (1954), have tended to conceptualize the economic policy space as one-dimensional. There are left-wing parties and voters that favour a strong welfare state and income redistribution and right-wing parties and voters that want a leaner welfare state and see income differences as a way to reward performance. This model plays a central role in contemporary models of voting behaviour and political representation (Kriesi et al., 2008; Mair, 2007). There is growing evidence that positions of voters on economic issues do not conform to a traditional left–right pattern in every country or every election (Achterberg et al., 2011; Derks, 2004; Roosma et al., 2012).
These studies provide little insight into the reasons why voter positions on economic issues do not fit the traditional left–right pattern. Recent evidence concerning party positions in the European Parliament (Otjes and Van der Veer, 2016), Greece (Katsanidou, 2013; Katsanidou and Otjes, 2016) and the Netherlands (Otjes, 2015, 2016) offers Europeanization of the economic policy space as an explanation for the structure of the economic policy spaces they uncover. Where Kriesi et al. (2008) argued that European integration led to the reinvigoration of the competition between economic left and right, these cases point to a new, distinctly European division on economic issues: in order to keep to the requirements of the Stability and Growth Pact in a period of economic down-turn, mainstream, pro-European political parties pursued programs of austerity and reform to keep to the European budgetary requirements. Only Eurosceptic parties could mobilize voters against these cuts, arguing that specific social groups, such as pensioners were the victims of these measures. A new ‘European’ economic dimension divided parties who were willing to accept such measures and those who did not.
The goal of this article is to determine to what extent a one-dimensional model holds for the economic policy positions of voters in the Eurozone countries after the Eurozone crisis. The Netherlands is selected as a representative case for ‘Northern’, creditor Eurozone states which had to reform their welfare states to keep to EU budgetary requirements but that were not bailed out. This study looks at voter positions in the 2012 elections – in the middle of the Eurozone crisis. In order to determine whether a multidimensional approach to economic issues is justified, a three-pronged research strategy is employed, each with its own subquestion: first, scaling methods are used to determine the dimensionality underlying voter preferences on economic issues. This will answer the question: do voter preferences on economic issues fit a single-dimensional left–right pattern? Second, this article will determine whether variance picked-up by these dimensions reflect meaningful differences between voters. Here the central question is: to what extent do these two dimensions reflect different social and attitudinal bases? Finally, the utility of multidimensional approach to economic attitudes for other questions in political science, specifically the study of voting behavior, will be assessed. This section will examine the question: do voter positions on these two dimensions help to understand party preferences?
Theory
At the core of the economic left–right model is the issue of egalitarianism: ‘[b]y left we shall mean advocating social change in the direction of greater equality -political, economic or social; by right we shall mean (…) opposing change towards greater equality’ (Lipset et al., 1954: 1135). Egalitarianism was also the key issue in the notions of left and right developed by Bobbio (1996): the right believes that inequalities reward individual achievement while the left favours an equal distribution of resources between social groups. According to Noëll and Thérien (2008) left and right have different conceptions of equality: the left is committed to equal outcomes and the right to equal opportunity. Left-wing voters favour not only economic equality but also the government intervention, necessary to reach it, such as higher taxes and generous welfare state benefits. Right-wing voters accept income inequality and oppose government intervention and prefer lower taxes and limited welfare state benefits.
There is growing evidence, however, that voter positions on economic issues should be approached multidimensionally (Otjes, 2014). Studies of public opinion towards the welfare state have found that those citizens who support the principle of egalitarianism do not necessarily support the welfare state; a substantial share of the voters combines egalitarian values with critical opinions of how the welfare state functions (Achterberg et al., 2011; Derks, 2004; Goerres and Prinzen, 2011; Roosma et al., 2012). These studies do not explain why voter preferences on economic policies do not conform to the standard left–right model.
Recent theorizing about the effect of globalization, specifically Europeanization, on the policy spaces in West European states may offer an explanation for this phenomenon. Kriesi et al. (2008: 13) have proposed that EU integration has come to ‘reinforce the classic opposition between pro-state and pro-market’ with the left-wing position becoming ‘more defensive and more protectionist’ and the pro-market position favouring a leaner state to enhance ‘national competitiveness on the world market’. Kriesi et al. (2012) have found that the extent to which globalization has been contested along left–right lines is limited. The Eurozone crisis may have changed the dynamic. During this crisis it became clear that positions on European integration and positions on welfare state reform are linked: in the Stability and Growth Pact, members of the Eurozone agreed to keep their budget deficit to 3% of their gross domestic product. During the Eurozone sovereign debt crisis, the European Commission has increased its power to enforce this norm (Bauer and Becker, 2014). This meant that parties could no longer conceive of expansionary budgetary policies without contesting the notion of Eurozone membership (Katsanidou and Otjes, 2016): pro-European parties and voters have to accept the European budgetary norms; Eurosceptic voters and parties have the freedom to pursue expansionary budgetary policies independent of European rules. In Greece, a country where European institutions directly intervened in economic issues, economic policies became ‘Europeanised’ (Katsanidou and Otjes, 2016): the question whether one favours or supports further European integration structured positions on day-to-day economic issues. In contrast to earlier periods, European integration shapes the dynamics of everyday politics (Mair, 2000). Mair (2008) already observed a similar development before the Eurozone crisis: the European Union (EU) has put more and more constrains on domestic decision-making. Government parties can only pick from a predefined stock of available policies that is determined by the EU. As the EU started as an internal market, this used to be the case for the choice of the level of economic regulation: one could not contest economic liberalization without contesting EU integration. Now that the EU expanded its control over the budgetary process, this phenomenon now also concerns the welfare state. Evidence from the European Parliament (Otjes and Van der Veer, 2016) and the Netherlands, a Northern creditor Eurozone country (Otjes, 2015, 2016), sustain these patterns on the party side. In the Netherlands, for instance, the Eurosceptic right-wing parties explicitly link EU issues with welfare state reform, as one MP argued ‘in order to ingratiate themselves with uncle Herman in Brussel [Herman van Rompuy, the president of the European Council] a blunt-axe approach is applied to healthcare’. 1 A second economic dimension could thus reflect whether citizens support the welfare state reform that is deemed necessary to keep to the EU’s budgetary requirements.
This, however, says very little about the substance of a second economic dimension on economic issues. Otjes (2015, 2016) used a two-dimensional model to describe party positions in the 2012 elections. The first, the redistribution dimension, concerned classical questions of income distribution. The second dimension, the reform dimension, concerned a new division. This division related to issues such as raising the retirement age and cutting healthcare costs by, for instance, raising health insurance deductibles. All in all, one may expect that there is a second dimension on economic issues that taps into voter positions on EU integration.
Substantively, this reform dimension may reflect different societal divisions such as those between generations: politicians advocated limiting the welfare state in order to ensure its long-term sustainability: ‘only [by raising the retirement age] can we keep our pensions affordable, can we do something against the aging of the population and can we ensure that our public services are affordable on the long-term’ as one social-liberal MP argued.
2
The issue can be framed as whether the welfare state should be reformed in order to ensure its long-term financial sustainability or whether it should be maintained to serve the interests of the current generation of pensioners who need its support most. A reform dimension may therefore reflect a difference in economic interests between generations that has been discussed extensively in the literature on welfare state reform (Goerres, 2008; Sinn and Uebelmesser, 2002; Tepe and Vanhuysse, 2009). This would mean that older voters are more likely to oppose welfare state reforms than that they are to favour egalitarianism.
A reform dimension may also tap into differences between higher and lower educated citizens. Bovens and Wille (2010) showed that higher and lower educated voters disagree over new cultural issues but not over economic redistribution. This may be different for the reform dimension, as education-level is closely related to healthcare and pension issues: higher educated workers are more satisfied with their job, in particular due to the income, autonomy and prestige it gives (Glenn and Weaver, 1982; Ross and Reskin, 1992). As such rewards are greater at the end of one’s career, higher educated voters are likely to accept raising the retirement age, compared to lower educated workers, who are more likely to do menial or manual work. Lower educated citizens are less healthy than higher educated citizens (Ross and Wu, 1995); lower educated voters are more likely to use and therefore favour collective healthcare than higher educated voters. All in all, support for these reforms may follow a division between higher and lower educated voters.
Finally, if the reform dimension is distinct from the preexisting redistribution dimension, it should not tap into what is usually the realm of the redistribution dimension. It divides the traditional economic left that supports a more equal distribution of income from the traditional right that proposes that differences in income provide an important incentive for economic performance. Because of this conceptual link between the left–right dimension and egalitarianism, it seems more likely that these two are empirically related than that citizens’ policy position on welfare state reform and their left–right self-identification are related.
Similarly, if the reform dimension is distinct from the redistribution dimension, it is unlikely to relate to the class division, which is linked to the left–right dimension: as MacIver (1947: 215) put it: ‘the right is always the party sector associated with the interests of the upper or dominant classes, the left the sector expressive of the lower economic or social classes’. According to Lipset (1960: 92) ‘the poorer strata everywhere are (…) leftist on economic issues: they favour more welfare state measures, higher wages, graduated income taxes, support of trade unions’. Given this strong theoretical link, egalitarianism is likely to be more closely related to citizens’ class identification than their support for welfare state reform.
In order to show the external validity of these dimensions and their usefulness, one could show their value for modeling voting behaviour. Otjes (2015, 2016) shows that there are pro- and anti-reform parties. For these dimensions to play a relevant role in politics, pro-reform voters must vote for pro-reform parties and anti-reform voters must vote for anti-reform parties.
Case selection
This article follows Otjes (2016) by selecting the Netherlands as a representative case of Northern, creditor Eurozone countries that were not bailed-out during the sovereign debt crisis. A bail-out is an extreme case of European intervention on economic matters (Katsanidou and Otjes, 2016) and therefore countries that were bailed out are likely cases to see their economic policy space Europeanize. The Netherlands, which had the median number of years with excessive budget deficit between 2008 and 2014 (Otjes, 2016) is representative for the Eurozone countries that were not bailed out. Still during the Eurozone crisis, these countries had to reform their welfare states to balance their budgets. This allows one to examine whether the kind of patterns found in Greece also apply to other Eurozone countries.
As discussed earlier, at the party level a two-dimensional approach was useful to model party positions on economic issues before the 2012 elections. Table 1 provides an overview of the positions of the six largest Dutch parties on the reform and redistribution dimensions. There are anti-reform parties such as the right-wing populist Partij voor de Vrijheid/Freedom Party (PVV) and the left-wing socialist Socialistische Partij/Socialist Party (SP), which are divided over egalitarianism, as well as pro-reform parties such the centrist, social-liberal party Democraten 66/Democrats 66 (D66). The main parties in the system (the Labour Party, the Christian-Democrats and the Liberal Party) have taken centrist positions on the reform dimension. These parties are more divided on the egalitarianism dimension. The goal of this article is to test to what extent this difference at the party level is reflected at the voter level.
Positions of six Dutch parties on economic issues.
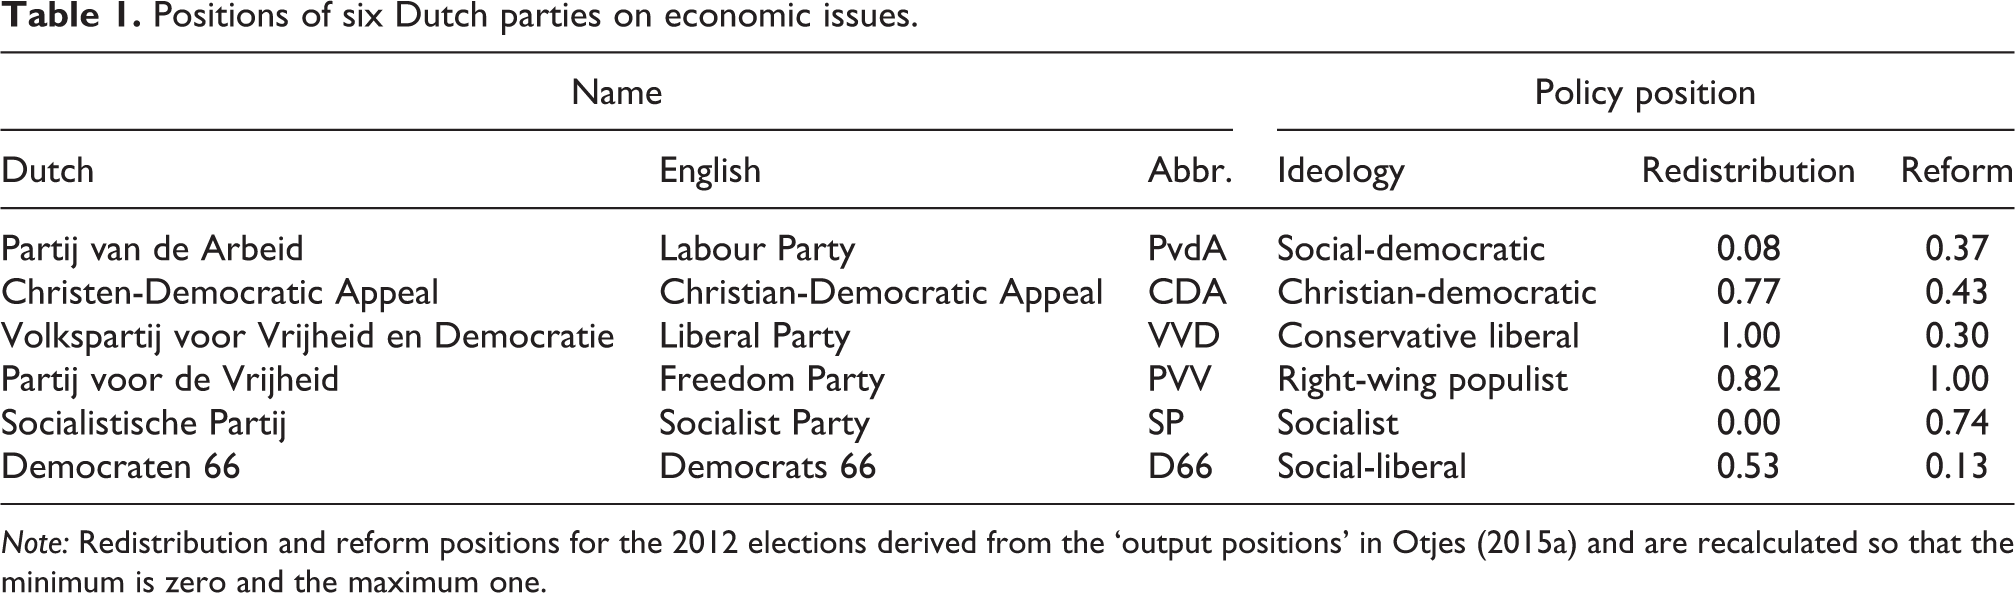
Note: Redistribution and reform positions for the 2012 elections derived from the ‘output positions’ in Otjes (2015a) and are recalculated so that the minimum is zero and the maximum one.
Methodology
It is not the case that a set of voter preferences necessarily has a given number of dimensions (Benoit and Laver, 2012). Determining which number of dimensions is appropriate to model the political space is a creative process; a researcher creates a model by selecting which observations will be used and by means of which method they will be aggregated (Coombs, 1964). A set-up with a particular number of dimensions can be defended on three grounds: The first ground is that a model with fewer dimensions than the chosen model would have more errors and the chosen model meets established guidelines for acceptable error. The second ground is that the variance that these dimensions contain, is meaningful. This article tests whether these dimensions reflect other social and attitudinal distinctions. And the final third ground is that the additional dimension is useful to understand other phenomena. Here the relationship between voters’ economic policy positions and party preferences is examined. A model with a given number of dimensions has to be justified on the basis of its internal validity and the dimensions have to be meaningful and useful in terms of their external validity.
First, scaling methods are employed in order to determine which number of dimensions is justified. The choice of scaling method has strong implications for the results that one will get. Therefore two different models with different assumptions are used: Mokken scaling and factor analysis. If they both point in the same direction the result is likely not an artefact of one method. Mokken scaling belongs to the item response theory (IRT) approach to scaling, while factor analysis belongs to classical test theory. IRT-methods tend to employ fewer assumptions about the distribution and nature of the data that is used compared to factor analysis that employs assumptions common to regression such as a normal distribution.
Factor analysis is a well-known method in political science and requires little introduction. In order to interpret the dimensionality in factor analytical models, two different criteria are employed here: the optimal coordinates approach and the Cattell subjective scree test. Cattell subjective scree test seeks to find an ‘elbow’ in the eigenvalues, that is the point where adding an additional factor contributes much less than the previous factors (Cattell 1966). Optimal coordinates approach relies on an extrapolation of the preceding eigenvalue by a regression line. The dimensions are added until the observed eigenvalue for that dimension fall below this line (Raiche et al., 2006). Scree plots and the relevant lines are produced using the package nFactor in R.
Mokken scaling approaches scaling from the perspective of exams (Mokken, 1971). It was meant to identify which share of students answer the difficult questions correctly (that least students answer correctly) but the difficult questions incorrectly (that most students answer correctly). If this is a large share of the respondents, the exam questions do not measure the same underlying dimension. This share is calculated in the H value. A H value below 0.3 indicates that the scale should not be used. This method is adapted for left–right items instead of correct–false items and for polytomous items instead of binary items (Van der Ark, 2007). One can also calculate Hi values, which measure to what extent an item relates to a scale and Hij values, which measure to what extent two items relate to each other. The Mokken package in R is used for these analyses.
This article examines the positions of voters on economic issues. The 2012 Dutch Parliamentary Election Survey is used (Van der Kolk et al., 2014), which provides a representative sample of 1677 voters and 13 items that are generally considered part of the economic left–right dimension. The high number of items on a diverse number of economic issues (including healthcare and pension reform) create an opportunity to examine the dimensionality of the economic voter space in a comprehensive way; earlier Dutch Parliamentary Election Surveys did not have this many questions on such a diverse set of economic issues. A complete list of all questions employed in this study can be found in Online Appendix.
Next, this study continues to determine which preexisting attitudinal and social variables are related to voter positions on these dimensions. That is, the analysis examines whether the variance picked up by these two dimensions is meaningful. To this end ordinary least squares (OLS) regression is used. A stacked data set-up with interaction variables is employed as this allows one to compare the relationships between the independent variables and the positions on the reform and redistribution variables directly. The process goes as follows: a variable was constructed that consists out of two entries for each respondent, namely their positions on the reform and redistribution variables. All the independent variables are included twice: once for the reform positions and once for the redistribution positions. Finally, a dichotomous term that expresses whether the reform or the redistribution variable is the dependent variable, was added. One can use this dichotomy as an interaction term to determine whether there are significant differences in the strength of the relationship between an independent variable and the reform and redistribution dimension. Cluster robust standard errors are used in R to compensate for the stacked nature of the data. In order to understand the modelling strategy, a regression equation may be helpful:
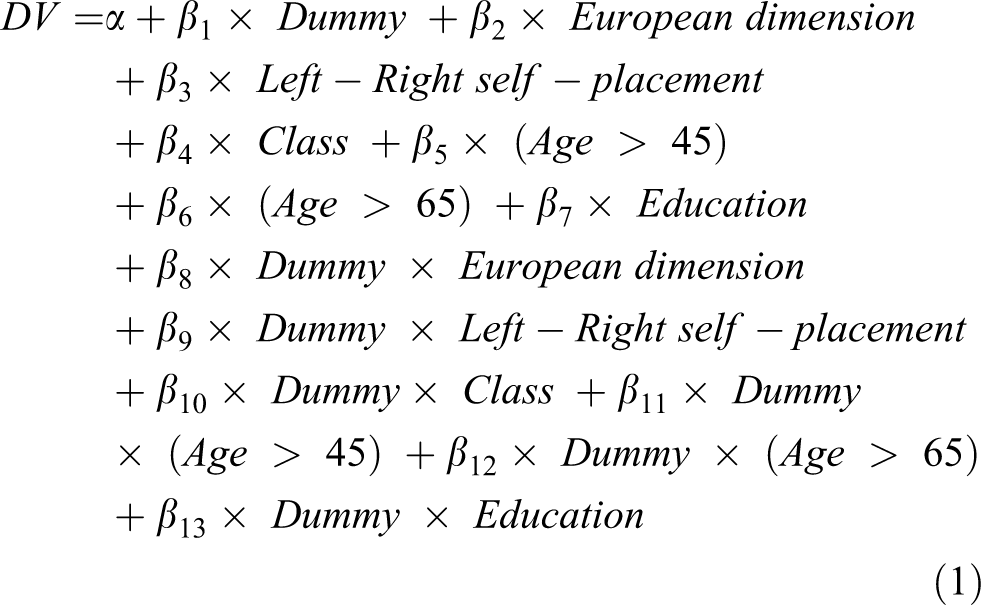
DV is the dependent variable for this part of the study, a variable that first lists the reform positions for all voters and then their redistribution positions. The dummy is a dichotomous variable that is one if the voter’s position is their position on the reform dimension (and zero otherwise). The other variables refer to variables related to the hypotheses: to measure citizens’ attitudes towards European integration (for the European integration hypothesis) six items concerning EU integration are combined to the European dimension, these items concern whether citizens’ approve of EU integration, Dutch EU membership, whether they trust the EU, favour the intervention of the EU and the European Central Bank into the economy and whether they favour bailing out Eurozone members (H value is 0.38). For the left-wing hypothesis, left–right self-identification is used. For the class hypothesis a class variable is used. The five-step class ladder, where respondents could identify their own position, is truncated to create a simple working class/non-working class dichotomy. For the generation hypothesis, two variables are included to differentiate between those who are older than 65 (age > 65), older than 45 and younger than 45 (age > 45). The choice for these age categories is substantive: 65 is the pension age; 45 is the median age of those younger than 65 but older than 18. Voters between 45 and 65 are more likely to be concerned about their pensions than those who are younger. The substantive interpretations are not different compared to when one uses a linear and a squared-age term (see Online Appendix), but these results are easier to interpret. For the education hypothesis, an education variable is used: The five-point education scale is truncated to a dichotomy between those with at least the equivalent of a bachelor degree (from a university of applied sciences or a research university) and those without such a degree. These truncated variables refer to the exact distinctions in the hypotheses, there are no theoretical grounds to expect that upper-class voters approach economic issues differently from middle-class voters or those with a degree from a university of applied sciences would approach economic issues differently from someone with a degree from a research university. Table 2 provides an overview of the descriptives of these variables.
Descriptives.
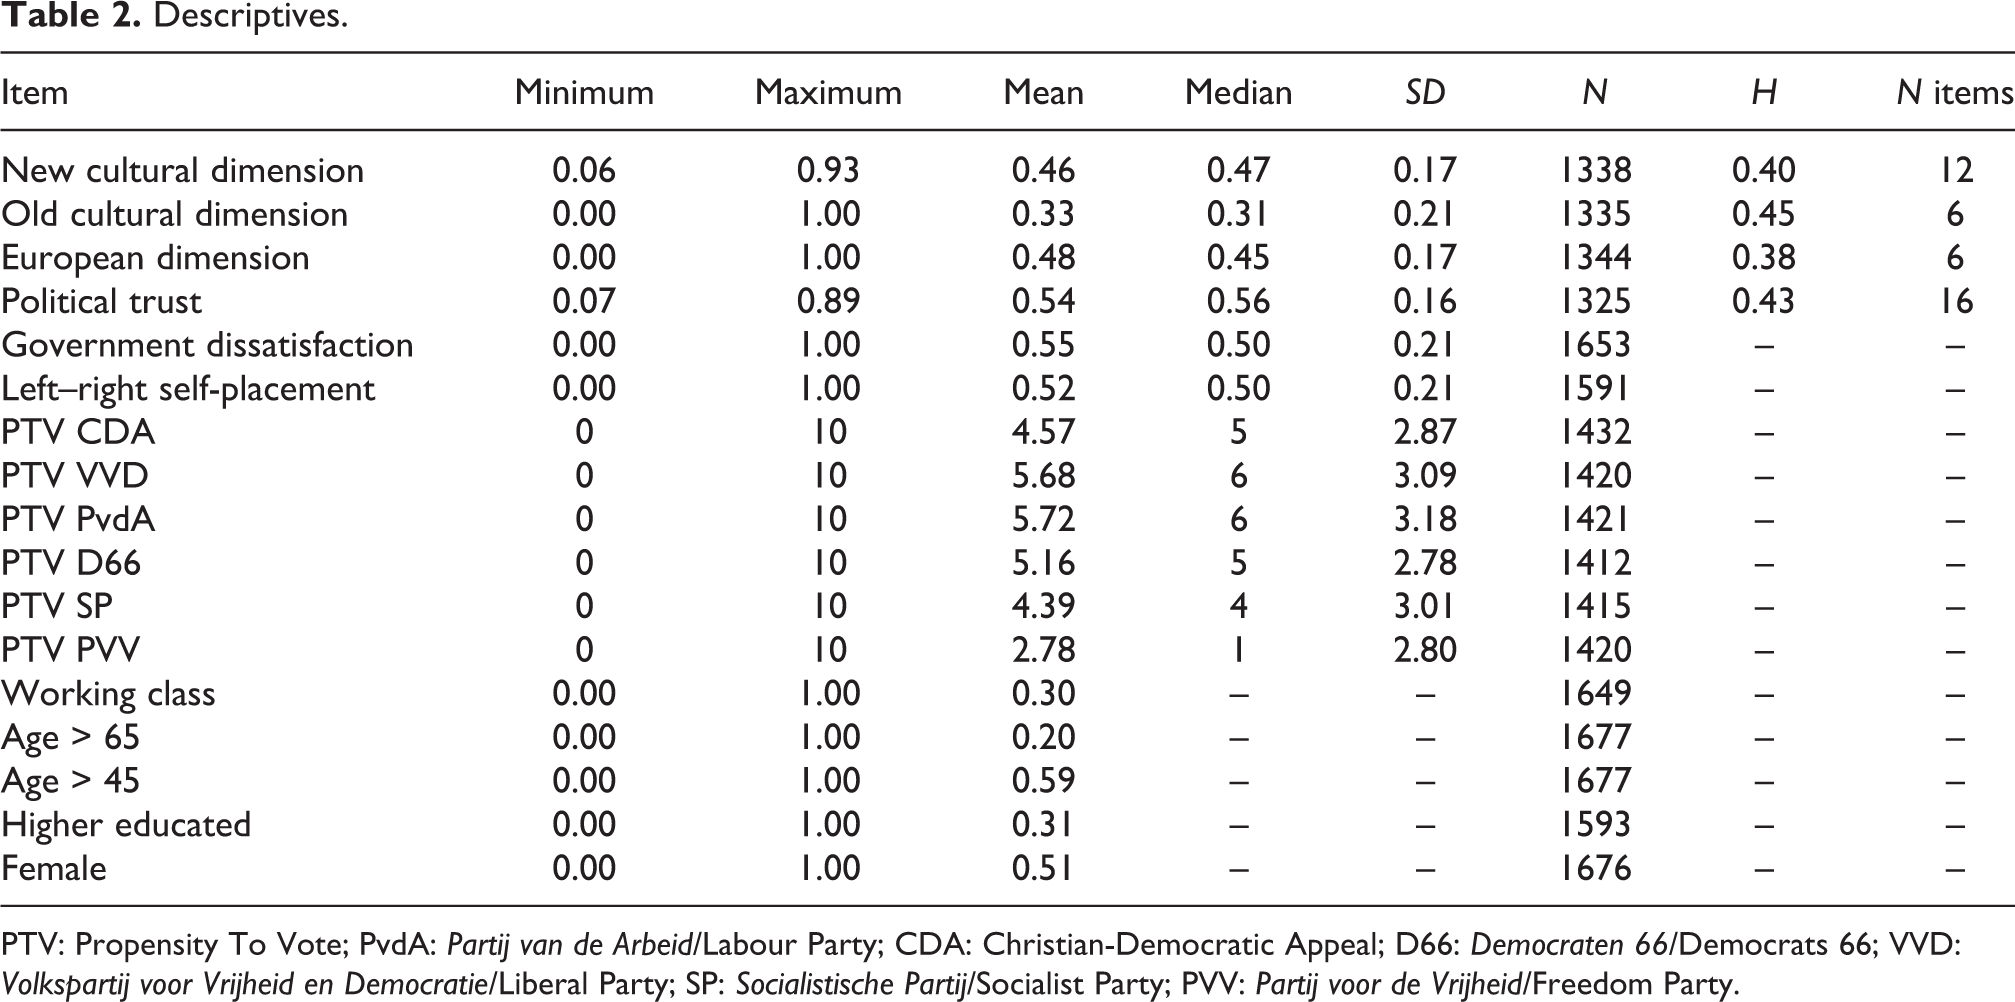
PTV: Propensity To Vote; PvdA: Partij van de Arbeid/Labour Party; CDA: Christian-Democratic Appeal; D66: Democraten 66/Democrats 66; VVD: Volkspartij voor Vrijheid en Democratie/Liberal Party; SP: Socialistische Partij/Socialist Party; PVV: Partij voor de Vrijheid/Freedom Party.
Finally, the usefulness of a two-dimensional approach for voting behaviour is determined by examining whether these dimensions are related to party preferences. These preferences are measured by propensity to vote (PTV) variables. The relationship between party preference and party choice is quite strong (Van der Eijk, 2002). Vote propensities are preferable over vote intention because they offer more fine-grained measurement (Van der Eijk et al., 2006). OLS regression with robust standard errors is used, in order to compensate for the skewed distributions of the PTVs (Van Spanje and Van der Brug 2009). In these models a number of traditional covariates of party preference are included: all the aforementioned variables, as well as citizens’ positions on the so-called new cultural dimension (which consists out of twelve items concerning immigration and civic integration and law and order; H = 0.4), the old cultural dimension (which consists out of six items concerning the role of religion in society and moral issues; H = 0.45) and their political trust (which consists out of 16 items concerning trust in politics and politicians and the quality of democracy; H = 0.43). Moreover, satisfaction with the government is included to measure retrospective voting. Finally, gender is included. Multiple analyses are run in order to examine the relationship between party preferences for the six largest parties and the scales and factors derived from the Mokken scaling and the factor analysis.
Is a two-dimensional approach to voter positions on economic issues justified?
Table 3 shows the results of the Mokken scaling analysis of the 13 social-economic items. These items clearly do not form a single scale. The H-value is 0.12. As one can see from the Hi -values, it is not the case that a single item pulls the entire scale down. The item for taxation is reversely related to the other items: this means that voters who tend to have left-wing positions on other economic items (e.g. supporting egalitarianism) tend to support lower taxes. The Hij -values for only six pairs of items exceed the 0.3-level. As expected, the relationship between egalitarianism and government redistribution is sufficiently strong. The relationship between pension spending and raising the retirement age is sufficiently strong, as well as the relationship between healthcare spending and raising the retirement age. In order to determine whether a two-dimensional interpretation of the economic policy space is justified, one can examine whether the H-values for a two-item redistribution scale of the egalitarianism and government redistribution items and a three-item reform scale of the retirement age, health and pension spending items are sufficient. These H-values are presented in Table 4. As seen previously, the two redistribution items form a sufficiently strong scale. There is no item that can be added to these two items, so that its Hi -value for this scale would exceed the 0.3. This would be a redistribution scale. The three reform scale items barely meet the requirements with a H-value of 0.3.
Mokken scale of all 13 items.a
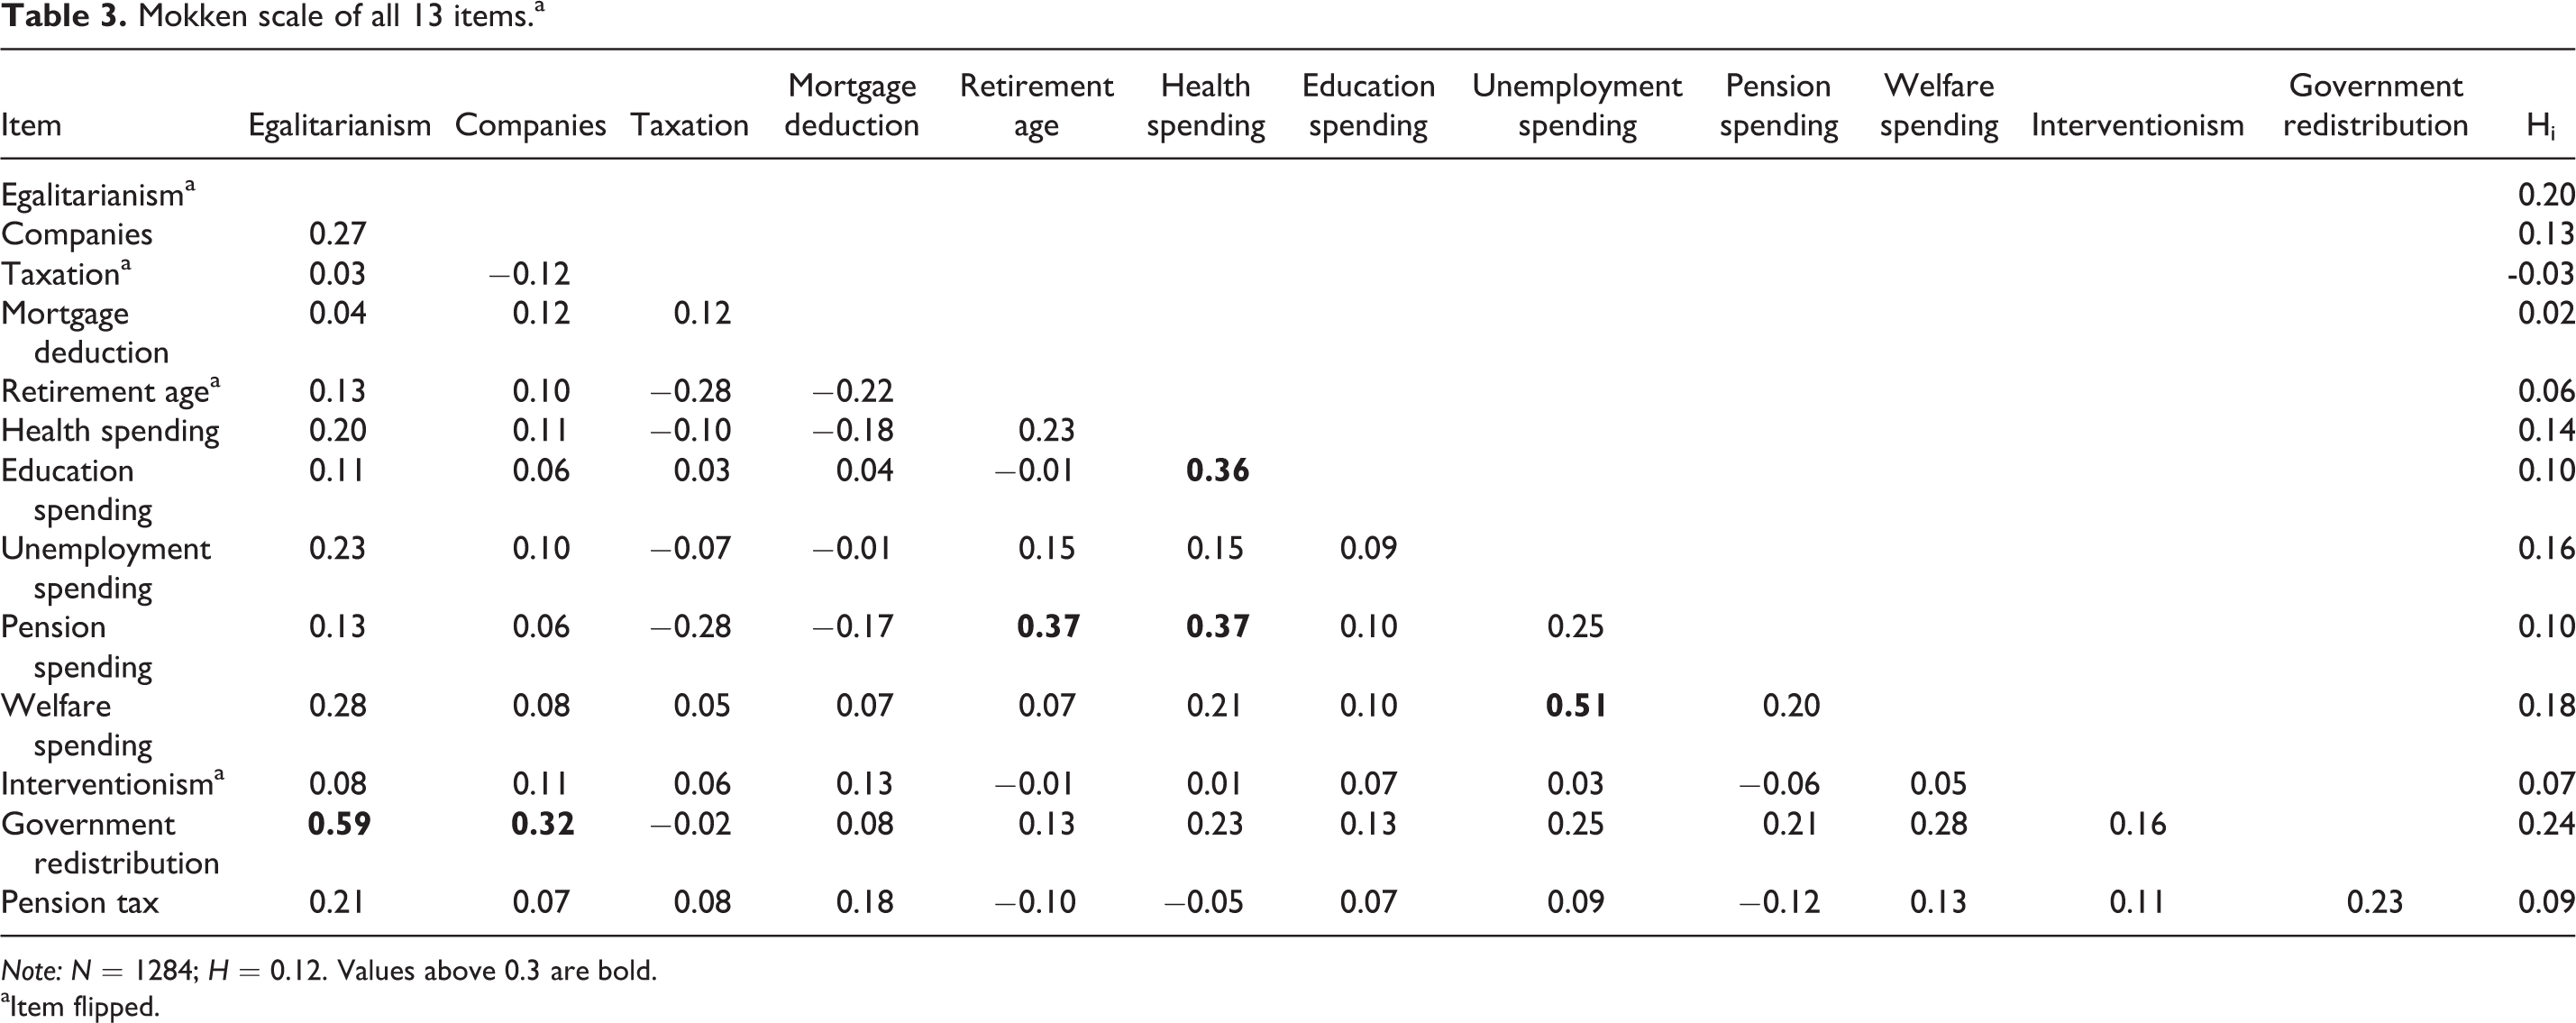
Note: N = 1284; H = 0.12. Values above 0.3 are bold.
aItem flipped.
Two-dimensional factor analysis and Mokken scaling models.a
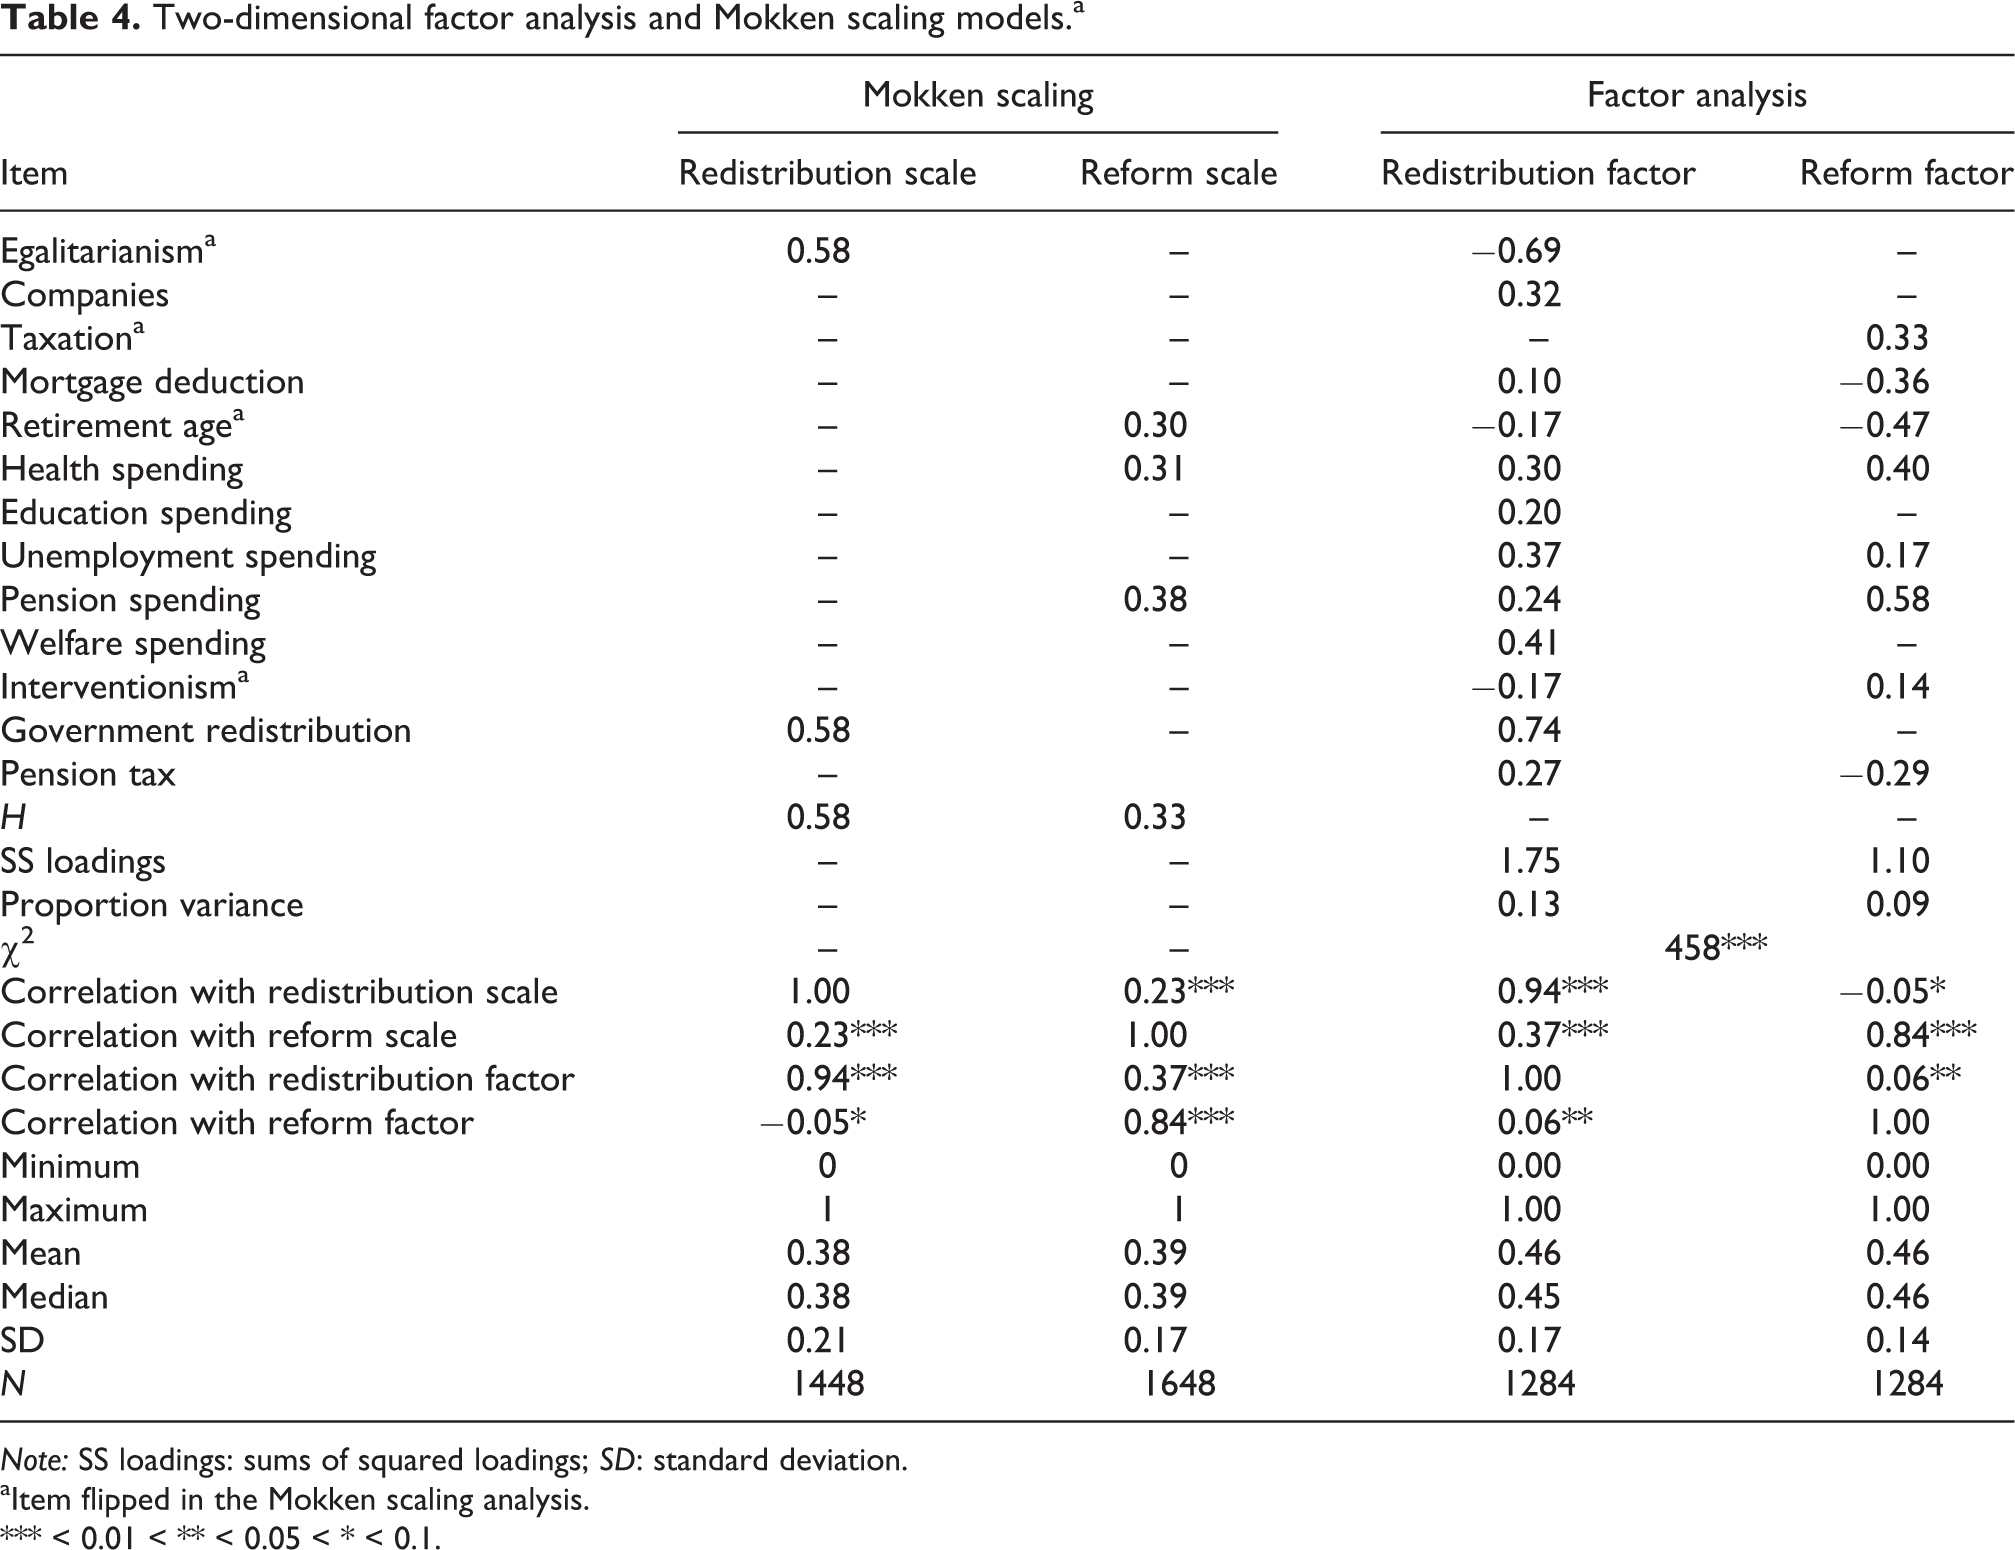
Note: SS loadings: sums of squared loadings; SD: standard deviation.
aItem flipped in the Mokken scaling analysis.
*** < 0.01 < ** < 0.05 < * < 0.1.
Exploratory factor analysis is to cross-validate the results above. Two methods to determine the number of factors are used. First, the Cattell subjective scree test: the ‘elbow’ in the scree plot is located at the third dimension, implying a two-dimensional structure (see Figure 1). Second, the optimal coordinates approach; the extrapolated pattern of eigenvalues crosses the actual eigenvalues at three items, again implying a two-dimensional structure. The two-dimension model is supported by both methods. 3 Table 4 gives an overview of the factor loadings in the two-dimensional model using a varimax rotation. 4 The egalitarianism and government redistribution items load strongly on the first dimension. Welfare and unemployment spending as well as distrust of companies also load on this dimension. Items concerning pension and health spending as well as the retirement age load on the second dimension. Items on taxation and the mortgage deduction also load on this dimension. The factor loadings for these two items imply that those who support lower taxes support more spending and a lower retirement age. As can be seen in Table 4, scales and factors reflect the same variance. There are strong correlations between the dimensions that measure the same concepts.
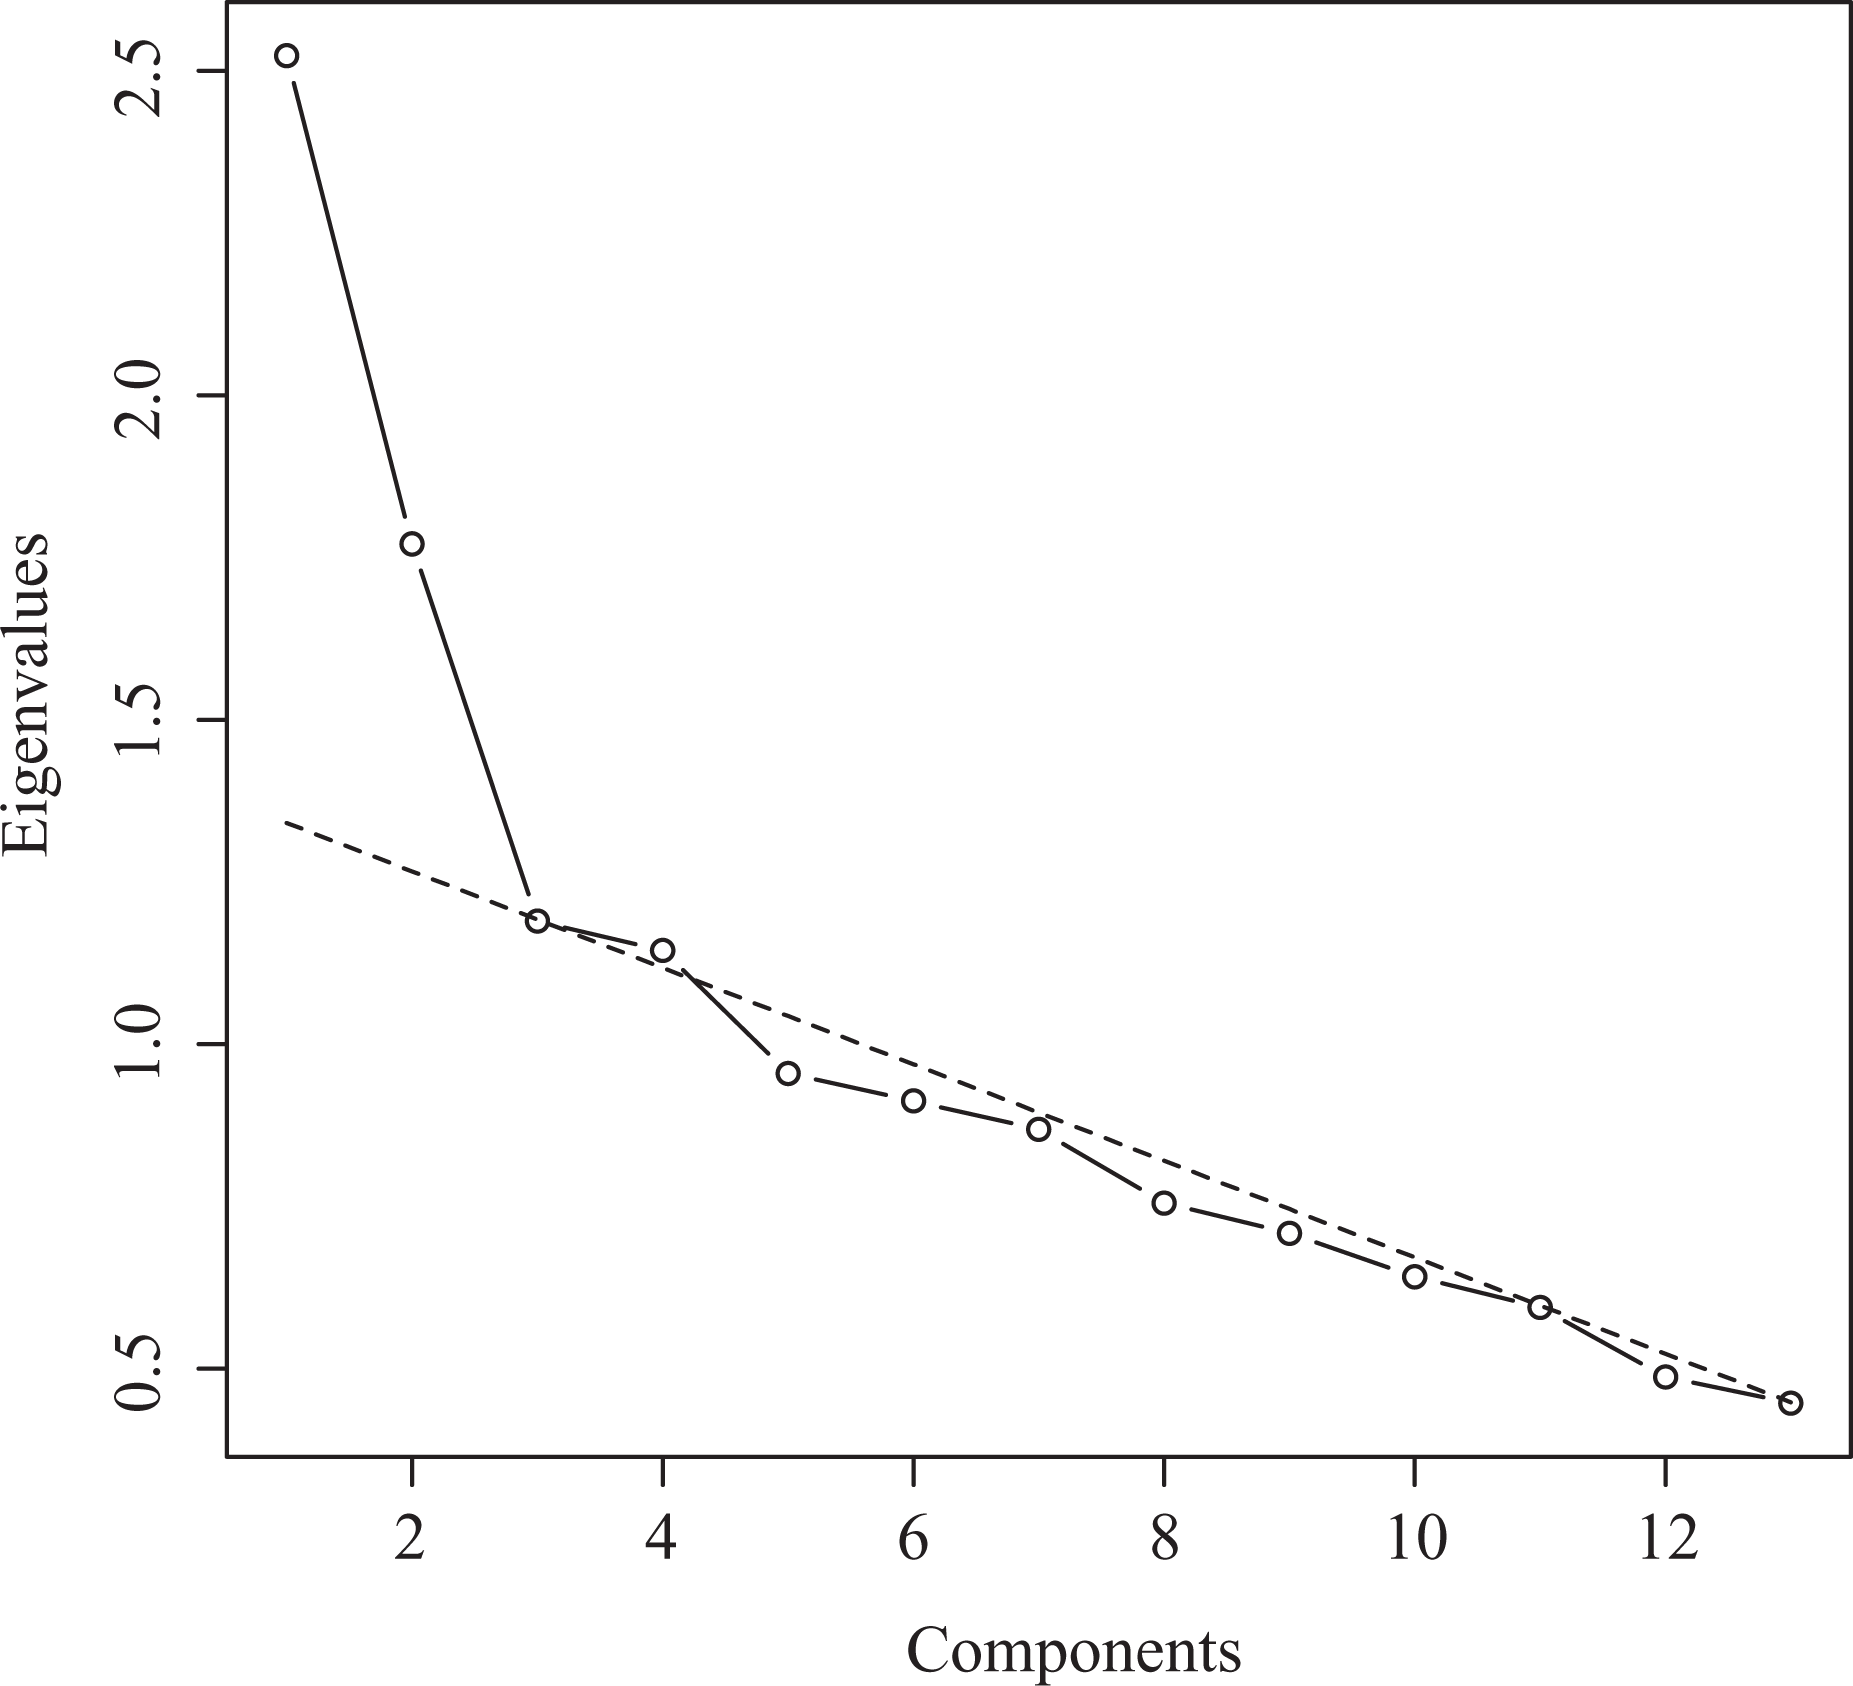
Scree plot. Circles and lines show the actual eigenvalues and the dashed line the line for parallel analysis.
Both methods support the notion that a single dimension does not suffice for understanding economic positions in the Netherlands in 2012. Multiple dimensions are necessary. The results of the Mokken scaling and the factor analysis imply that there is at least a two-dimensional structure with a reform and a redistribution dimension. Online Appendix looks at the possibility of four-dimensional model and finds the same substantive results as presented in the sections ‘Is a two-dimensional approach to voter positions on economic issues meaningful?’ and ‘Is a two-dimensional approach to voter positions on economic issues useful?’.
Is a two-dimensional approach to voter positions on economic issues meaningful?
In order to see whether the variance that is measured by the reform and the redistribution dimension is meaningful, this article will show whether voter positions on these dimension reflect voters’ views on other issues and their societal background. The hypotheses are written as interaction relationships; the question that is asked is whether relationship with these independent variables is stronger for the reform dimension than for the redistribution dimension. The results for the positions derived from the Mokken scaling (Model 1) and the factor analysis (Model 2) are presented in Table 5.
Explaining positions on the two dimensions.a
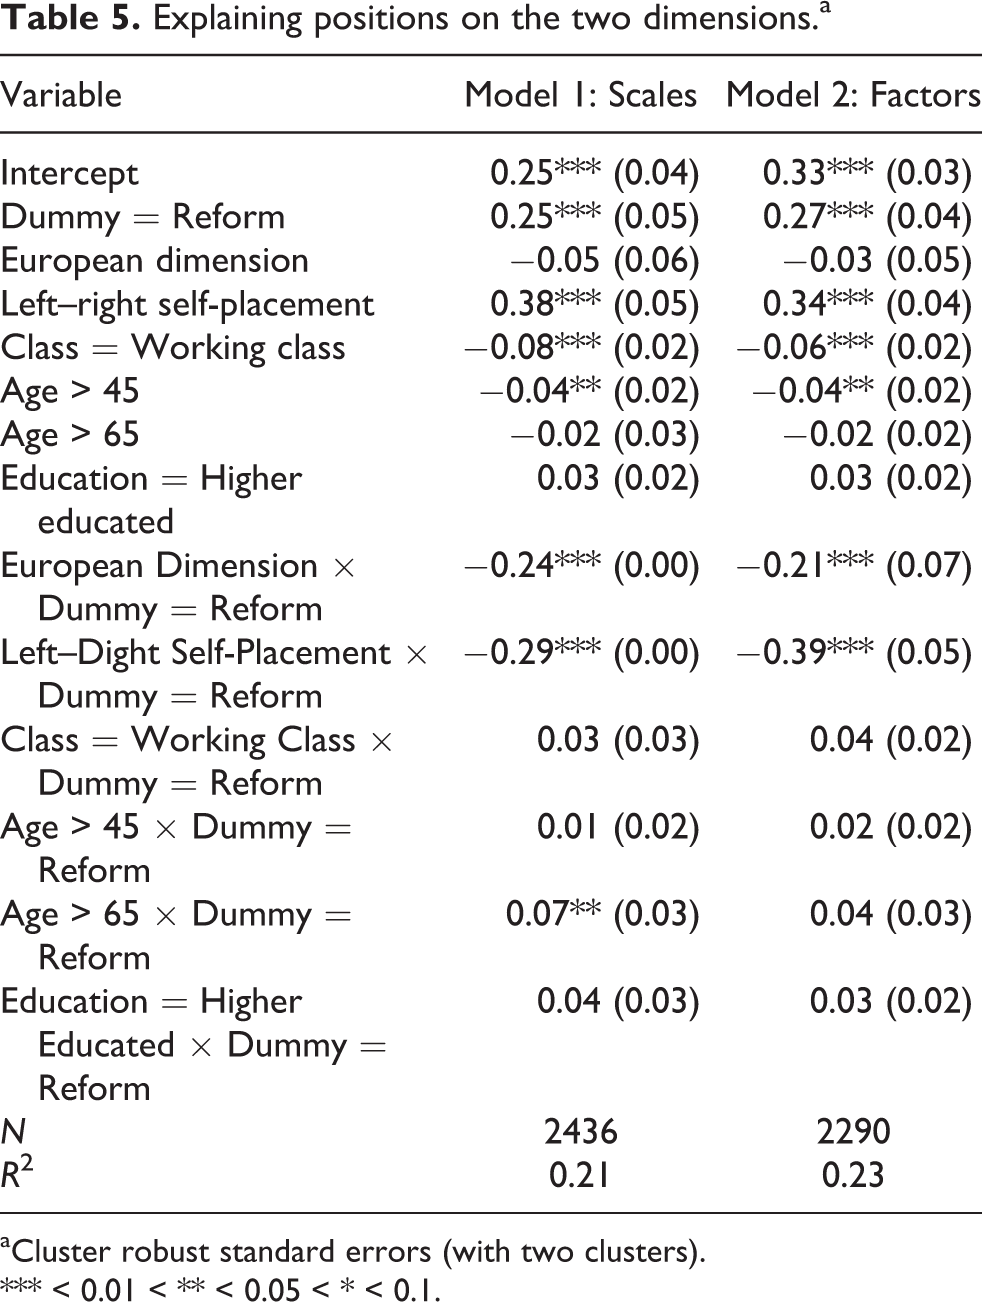
aCluster robust standard errors (with two clusters).
*** < 0.01 < ** < 0.05 < * < 0.1.
The first hypothesis predicted that pro-European voters tend to favour reform more than that they oppose redistribution. In Models 1 and 2 there are a no significant relationships between the redistribution dimension and the European dimension. In both models, the interaction term is in the correct direction, significant and much larger than the term for redistribution. This means that in line with the European integration hypothesis, the relationship between favouring EU integration and welfare state reform is significantly stronger than the relationship between favouring EU integration and redistribution: voters who favour EU integration tend to favour reforms of social security and healthcare. 5
The generation hypothesis predicted that older voters tend to oppose reform more than that they favour redistribution. Respondents are split into three groups, those who are younger than 45, those who are older than 45 and those who are older than 65. Note that the terms are calculated in such a way that to know net-effect of being 65 one needs to combine the effects of being older than 45 and 65. Voters older than 45 tend to favour income redistribution significantly more than voters under 45. Voters above 65 do not differ significantly from those younger than 65. The interaction terms are in the opposed direction compared to the hypothesis. The effects for those above 45 are small and not significant. For those above 65 the interaction effects lead to slightly different conclusions between Model 1 and Model 2. In Model 1, the net effect of the interaction effects is such that voters older than 65 are more inclined to support welfare state reform than those aged between 45 and 65, but they do not differ significantly from those under 45. In Model 2, there are no significant differences (although the coefficient shows a similar pattern). All in all, in contrast to the generation hypothesis, it is not the case that older voters tend to support welfare state reform less than younger voters. 6
The education hypothesis predicted that those who are higher educated tend to favour reform more than that they oppose redistribution. There is no significant relationship between being higher educated and opposing redistribution. If one combines the base term and the interaction term, one finds a weak relationship between being higher educated and the reform dimension: higher educated voters tend to favour reforms of the welfare state, slightly more than lower educated voters. The interaction coefficient however is not significant. Therefore the education hypothesis has to be rejected.
The left-wing hypothesis predicted that left-wing voters tend to favour redistribution more than that they oppose reform. Left–right positions are the strongest predictor of positions on redistribution in Models 1 and 2. The interaction term is strong, significant and negative in both models. The net effect of the main and interaction term is such that the relationship between left–right positions and the reform dimension is much weaker than the relationship between left–right self-placement and the redistribution dimensions. Moreover it is not consistent between the models: the net-effect is negative but not significant in Model 1 and positive and significant in Model 2. This shows that there is a clear, significant and strong relationship between the redistribution dimension and the left–right dimension, while there is no consistent relationship between the reform dimension and the left–right dimension when comparing Models 1 and 2. Together these patterns sustain the left-wing hypothesis.
The class hypothesis predicted that working-class voters tend to favour redistribution more than that they oppose reform. The relationships are much weaker than for the left–right dimension: working-class voters favour redistribution significantly more than voters from other classes. The interaction terms for the reform dimensions are positive and just smaller than the main term for working class but they are not significant. The net result of the main term and the interaction term is that working-class voters tend to oppose reforms more than voters from higher classes. This effect is significant in Model 1 but not in Model 2. These patterns follow the class hypothesis, but because one of the two interaction terms was not significant, it has to be rejected.
All in all, these results show that the redistribution and reform dimension reflect ideological differences between voters; the redistribution dimension relates strongly to left–right self-placement and the reform dimension to voters’ positions on EU integration. The results for the demographic variables did not follow the expected direction (for age) or were not significant (for education and class). 7
Is a two-dimensional approach to voter positions on economic issues useful?
In order to justify a multidimensional approach to voter positions one would need to determine whether a multidimensional approach to economic policy preferences is useful. This section examines whether a multidimensional approach adds to the analysis of party preferences. Tables 6 and 7 provide ample overview of the relationships between the PTV for the six largest parties employing the redistribution and reform factors and scales. A large number of control variables are added to determine whether the patterns for the reform dimension are not the result of other variables. The focus lies on the effects of the two economic variables, the other effects are not discussed in detail.
Explaining propensity to vote (with Mokken scales).a
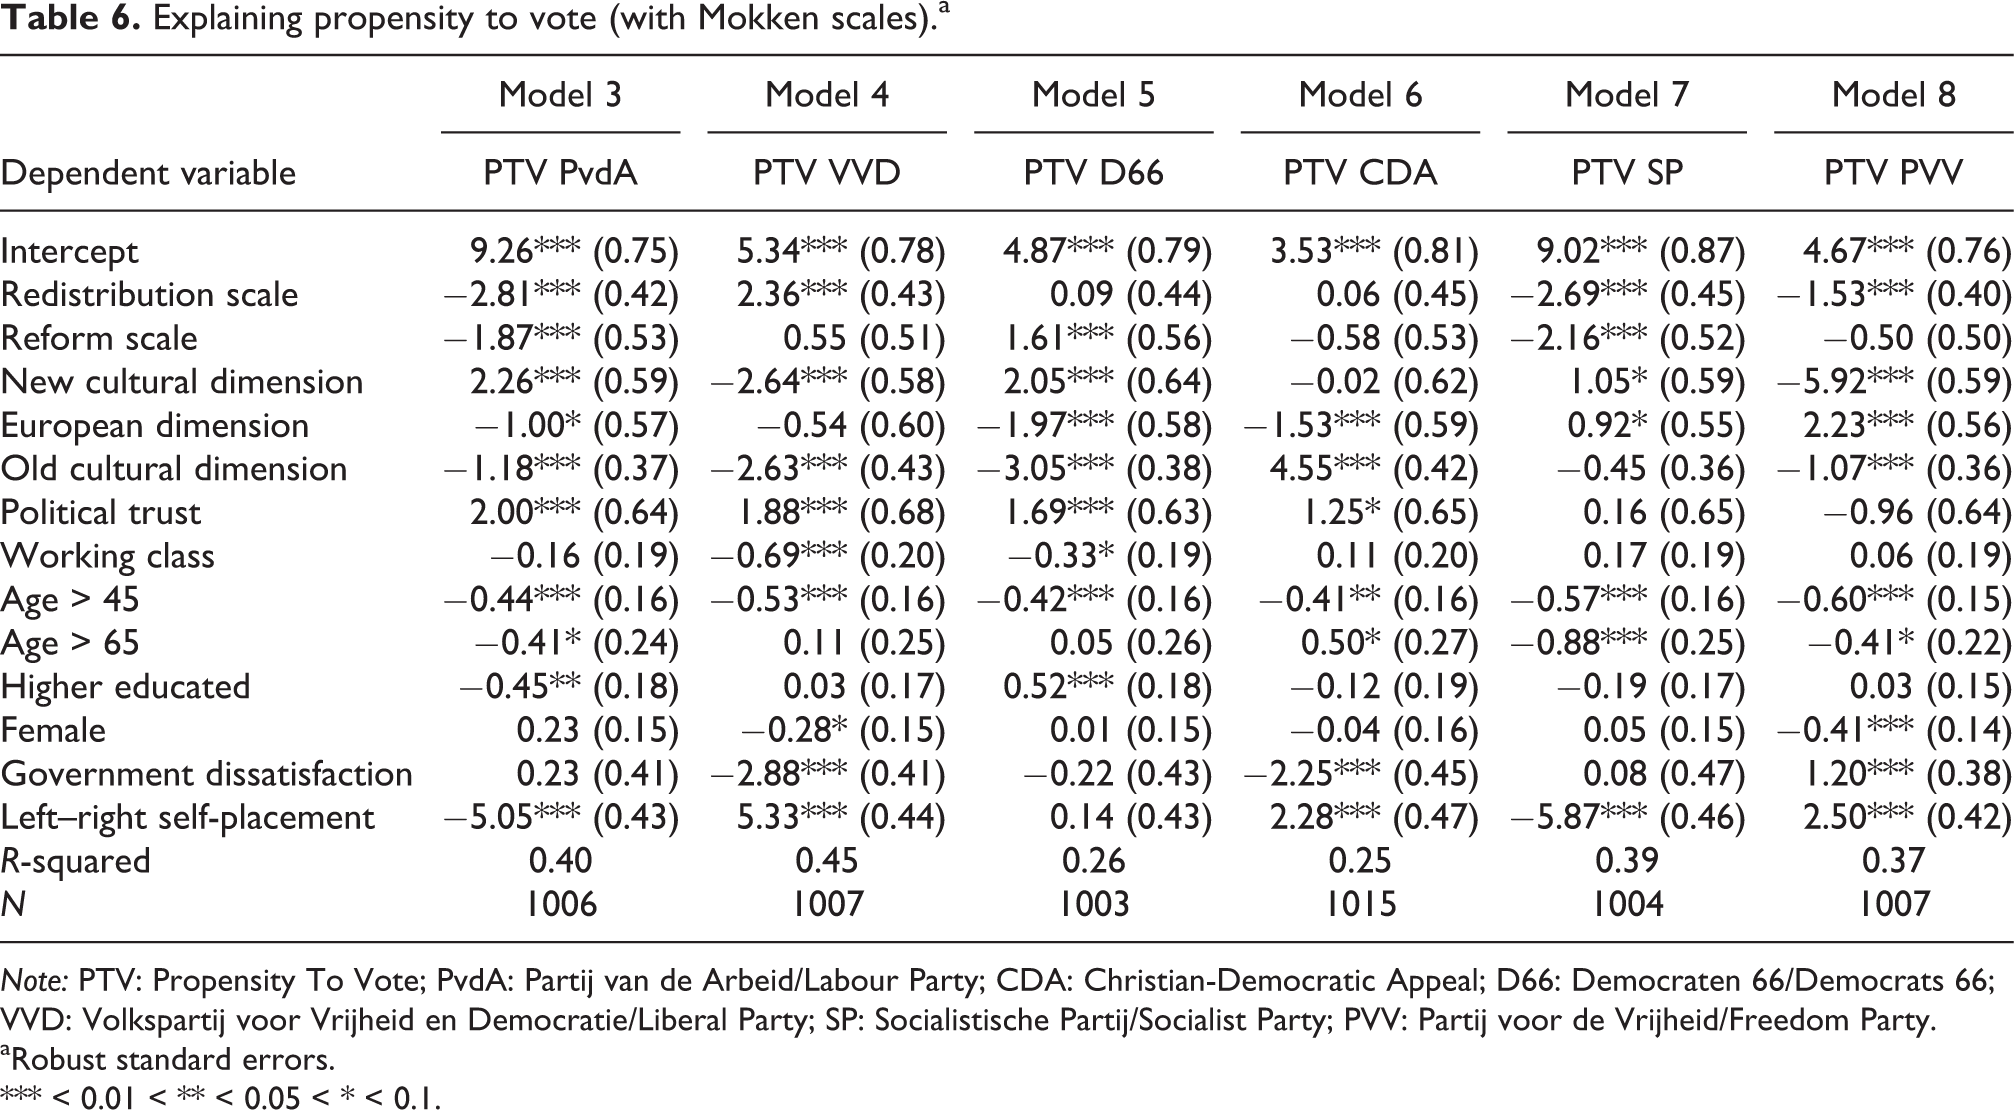
Note: PTV: Propensity To Vote; PvdA: Partij van de Arbeid/Labour Party; CDA: Christian-Democratic Appeal; D66: Democraten 66/Democrats 66; VVD: Volkspartij voor Vrijheid en Democratie/Liberal Party; SP: Socialistische Partij/Socialist Party; PVV: Partij voor de Vrijheid/Freedom Party.
aRobust standard errors.
*** < 0.01 < ** < 0.05 < * < 0.1.
Explaining propensity to vote (with factors).a
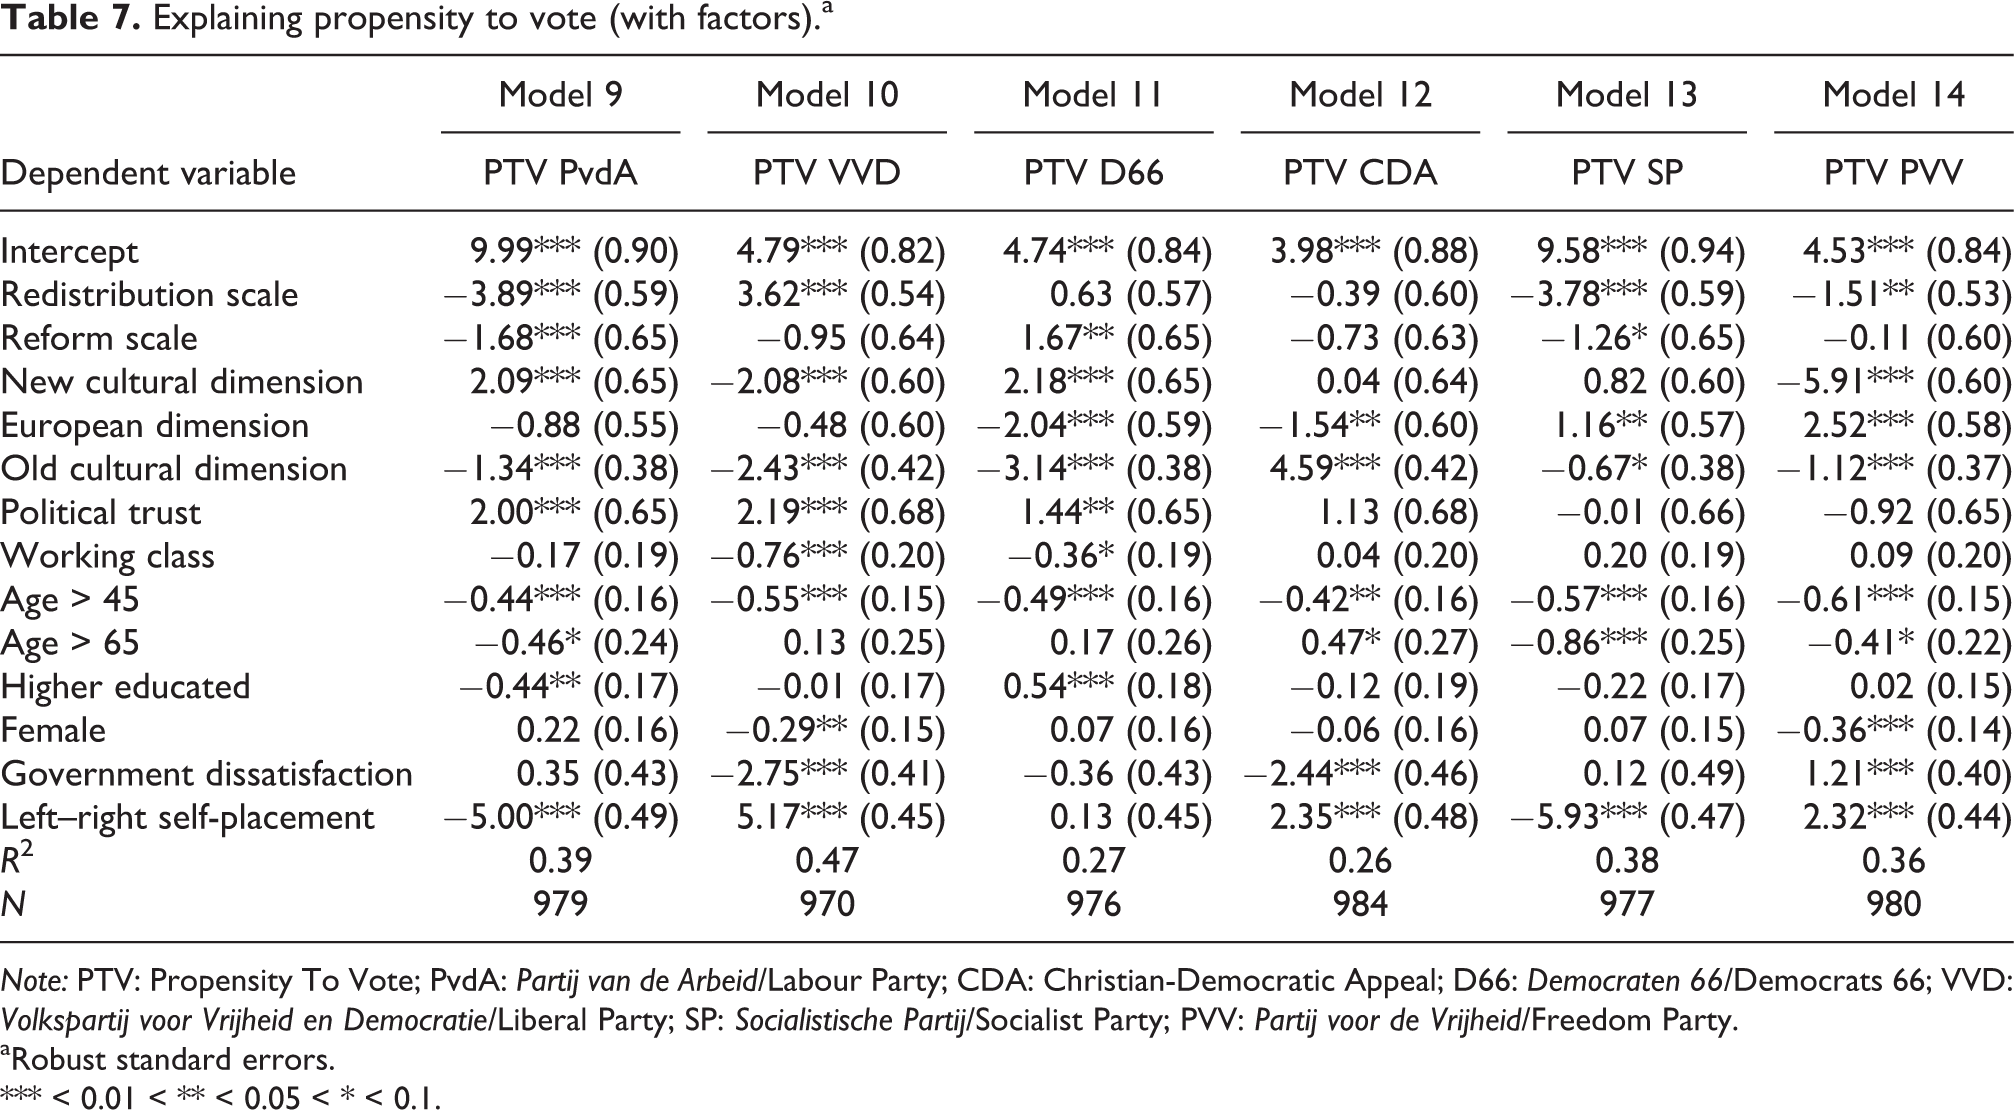
Note: PTV: Propensity To Vote; PvdA: Partij van de Arbeid/Labour Party; CDA: Christian-Democratic Appeal; D66: Democraten 66/Democrats 66; VVD: Volkspartij voor Vrijheid en Democratie/Liberal Party; SP: Socialistische Partij/Socialist Party; PVV: Partij voor de Vrijheid/Freedom Party.
aRobust standard errors.
*** < 0.01 < ** < 0.05 < * < 0.1.
The voters of the Labour Party are first up. As seen in Table 1, this party is characterized by its clear pro-redistribution position and a more centrist position on the reform dimension. In both models, voters of this social-democratic party are characterized by anti-reform and pro-redistribution positions. The effect of the redistribution dimension is stronger than the effect of the reform dimension. That the Labour Party mobilized anti-reform voters goes in against the formulated expectations, as the party program itself was (moderately) pro-reform. The reason for this may be that the Labour Party’s campaign focused strongly on the party’s opposition to proposed cuts to healthcare and social security, more than its actual program. The electorate of the SP, which did position itself as an anti-reform, pro-redistribution party, is similar to the voters of the Labour Party in terms of these economic variables.
Next up is the Liberal Party. As seen earlier, this party is characterized by its anti-redistribution position and a more centrist position on the reform dimension. In both models the voters of the Liberal Party are characterized by their anti-redistribution positions, while the relationship with the reform dimension is not significant.
The voters of D66 precisely match their party; this party has a centrist position on the redistribution dimension and a clear pro-reform position. Likewise, D66 voters are pro-reform but these are not characterized by their positions on the redistribution dimension.
The following party is the Christian-Democratic Appeal (CDA). This party was opposed to redistribution and more centrist on reform issues. Voters’ positions on economic issues do not relate to their likelihood to vote for this party. CDA voters are primarily characterized by their positions on old cultural and European issues, as well as their satisfaction with the VVD-CDA government and their right-wing self-identification.
Finally, the voters of the PVV offer quite a puzzle. This party (as can be seen in Table 1) has an anti-reform, anti-egalitarian position during the 2012 elections. For instance, like the VVD but unlike the parties of the left the PVV wanted to maintain the mortgage deduction for homeowners, which is a tax-break for the wealthy, but it also opposed raising the retirement age, like the left-wing SP. Despite this positioning, it attracts voters that are in favour of redistribution and centrist on the reform dimension. Online Appendix indicates that while the PVV voters were clearly opposed to raising the retirement age, the relationship with public sector spending was weaker. Perhaps, its anti-reform message combined with an economically populist message (defending the interest of the proverbial average Dutch people ‘Henk and Ingrid’) has blurred its position on economic issues (Rovny, 2013), allowing the party to attract egalitarian voters. The effect of economic issues is limited, far more important for understanding the electorate of this party are its conservative positions on the new cultural dimension.
The analyses including the scales (from the Mokken scaling) and the factors (from the factor analysis) indicate the same result for 94% of the coefficients. 8 Where it comes to the theoretically motivated variables, the two of sets regressions indicate the same result: the reform and the redistribution dimension have separate value for understanding voter positions. The reform dimension in particular appears to divide PvdA, SP and D66. D66 voters are characterized by their support for reforms. Those who vote for the Labour and Socialist Party are characterized by both their opposition to welfare state reform and their preference for income redistribution. On the right, there is a clear difference between the VVD and the PVV, but only on the redistribution dimension: VVD voters are right-wing and oppose income redistribution, PVV voters are right-wing and favour income redistribution. For these voters the reform dimension does not matter, despite the fact that the party positions on this dimension are quite different.
Conclusion
A two-dimensional approach to the economic policy space at the voter level in the Netherlands in 2012 is justified, meaningful and useful. The Netherlands was selected as a representative case for Northern Eurozone countries. These countries were not bailed out by the EU but still had to reform their welfare states to keep to European budgetary requirements. This conclusion will consider the question what these results mean for the nature of the policy space in similar countries.
This article showed that a single economic left–right dimension did not suffice to capture the diversity in voter positions. Two different data reduction methods both pointed to the same two-dimensional set-up. The first dimension concerned the difference between those who favour income equality and those who embrace income inequality. The second dimension divided those favoured reforms of social security and healthcare and those who opposed these reforms. The pattern at the voter level lined up with the pattern at the party level (Otjes, 2015, 2016). These results add to a growing literature that sheds doubts on the all-encompassing nature of the economic left–right dimension. Future research may want to be cautious in applying a single-dimensional model of economic issues when studying voting behavior and political representation.
The results indicate that economic policy positions of citizens do not just reflect their left–right attitudes but in part also reflect their attitudes towards European integration. Citizens who favour reforms of the welfare state, such as cuts to healthcare and raising the retirement age are also those who favour European economic integration. This study adds to a growing number of studies that show that since the onset of the European sovereign debt crisis, policy positions on economic issues have become linked to attitudes towards European integration (Katsanidou and Otjes, 2016; Otjes, 2015, 2016; Otjes and Van der Veer, 2016). Now that the European Commission has gained considerable control over budgetary decision-making, it has become more and more difficult to think of economic reforms without considering the role of the EU. While the previous evidence looked at party behaviour or at Greece, a country strongly affected by the European sovereign debt crisis, this article examined voters in a Northern Eurozone country. As expected, there is a second economic dimension, distinct from the left–right dimension. It did not relate to voters’ age, education or class in a way that was hypothesized.
Finally, the two-dimensional approach was also useful to predict voting behavior; while the redistribution dimension mattered to understand the preference for the social-democratic, socialist, conservative-liberal and right-wing populist parties, the reform dimension divided social-liberals from social-democrats and socialists. In this sense, this new economic dimension reflects a consistent difference in views between citizens on which different political parties mobilize voters.
This study selected the Netherlands as a representative country for Northern Eurozone countries, such as Germany and Austria. In these countries, existing single-dimensional approaches to the economic policy space have yielded unsatisfactory results (Dolezal et al., 2013; Goerres and Prinzen, 2011). This article has shown that a multidimensional approach to economic issues can produce more meaningful results. While a single-country study cannot prove that the patterns found here also apply to these countries, the underlying mechanism of Europeanization is not related to specific characteristics of the Dutch political system and may be at work in those countries as well. Further research is necessary to determine to what extent the patterns found here hold in different countries. Examining the structure of voters’ economic policy preference in and outside of the Eurozone and before and after the Eurozone crisis is necessary to determine whether the patterns found are indeed the effect of Europeanization.
Supplemental material
Supplemental Material, pp-2015-0222-File010 - Distinguishing welfare state reform and income redistribution. A two-dimensional approach to the Dutch voter space on economic issues
Supplemental Material, pp-2015-0222-File010 for Distinguishing welfare state reform and income redistribution. A two-dimensional approach to the Dutch voter space on economic issues by Simon Otjes in Party Politics
Supplemental material
Supplemental Material, pp-2015-0222-File011 - Distinguishing welfare state reform and income redistribution. A two-dimensional approach to the Dutch voter space on economic issues
Supplemental Material, pp-2015-0222-File011 for Distinguishing welfare state reform and income redistribution. A two-dimensional approach to the Dutch voter space on economic issues by Simon Otjes in Party Politics
Supplemental material
Supplemental Material, pp-2015-0222-File012 - Distinguishing welfare state reform and income redistribution. A two-dimensional approach to the Dutch voter space on economic issues
Supplemental Material, pp-2015-0222-File012 for Distinguishing welfare state reform and income redistribution. A two-dimensional approach to the Dutch voter space on economic issues by Simon Otjes in Party Politics
Footnotes
Acknowledgements
The author would like to thank Senna Maatoug, the three anonymous reviewers and the editor of Party Politics for their useful comments and suggestions.
Declaration of Conflicting Interests
The author(s) declared no potential conflicts of interest with respect to the research, authorship, and/or publication of this article.
Funding
The author(s) received no financial support for the research, authorship, and/or publication of this article.
Supplemental material
Supplemental material for this article is available online.
Notes
References
Supplementary Material
Please find the following supplemental material available below.
For Open Access articles published under a Creative Commons License, all supplemental material carries the same license as the article it is associated with.
For non-Open Access articles published, all supplemental material carries a non-exclusive license, and permission requests for re-use of supplemental material or any part of supplemental material shall be sent directly to the copyright owner as specified in the copyright notice associated with the article.