
Abstract
Despite comprehensive reform (Political Parties, Elections and Referendums Act) and recent review (Phillips Review in 2007) of party finance in Britain, public opinion of party finance remains plagued by perceptions of corruption, undue influence from wealthy donors, carefree and wasteful spending and, more generally, from the perception that there is just ‘too much money’ in politics. In this article we argue that knowledge of and attitudes to party finance matter, not least because advocates of reform have cited public opinion as evidence for reform. However, because attitudes to party finance are part of a broader attitudinal structure, opinion-led reforms are unlikely to succeed in increasing public confidence. Using data generated from YouGov’s online panel (N=2,008), we demonstrate that the public know little of the key provisions regulating party finance and attitudes to party finance can be explained along two underlying dimensions – Anti-Party Finance and Reformers. As such, we consider whether parties and politicians should be freed from the constraints of public opinion in reforming party finance.
Introduction
In this article we examine public knowledge of, and attitudes to, party finance in Britain. In comparison with other issues that dominate the public agenda more or less routinely, party finance emerges (usually) in response to perceived scandal or, more accurately, ‘episodes' (Fisher, 2009). These episodes reinforce public perceptions of the negative influence of money in public life, and generate public distaste for parties and further calls for reform. Indeed, the Political Parties, Elections and Referendums Act (PPERA, 2000), the most significant overhaul of party finance regulation in over a century, was motivated in large part by a series of allegations of sleaze that affected both the Conservatives and Labour (Clift and Fisher, 2004). While the PPERA reforms were comprehensive, party finance was back on the agenda in 2005 as a result of loophole-seeking behaviour by parties' attempts to secure loans rather than donations, circumventing the spirit of the new law (Fisher, 2009). The subsequent Phillips Review of Party Finance (2007) produced a number of recommendations, some of which emerged in the Political Parties and Elections Act (PPEA) 2009. However, the Review failed to achieve inter-party agreement on key issues such as voluntary funding and a cap on donations. As a consequence of this and more recent episodes, party finance is likely to remain on the political agenda.
A lack of consensus among the parties may suggest we look to public opinion for guidance on the reform agenda (Electoral Commission, 2006a; Primo, 2002). Relying on public opinion, however, is a potentially hazardous and unpredictable path for three principal reasons. First, despite ‘fits of interest’ generated by newsworthy episodes, party finance is generally a low-salience issue, especially compared with issues that tend to dominate public consciousness: the economy, immigration, health and welfare. As a consequence, the public show little knowledge of some of the key provisions regulating party finance, particularly the size and source of donations and legal limits established for constituency and national party spending (vanHeerde-Hudson, 2010). As existing scholarship has shown, knowledge matters because preferences or decisions based on limited or partial information can lead citizens to hold preferences they would not hold under alternative conditions (Bartels, 1996; Kuklinski et al., 2000). Moreover, Gilens (2001) has demonstrated that the effects of policy-specific ignorance may have an even greater influence on preferences than previously thought.
Second, low levels of information open up the opportunity for opinion shapers to influence public understanding of and attitudes to party finance. While parties, politicians and policy-makers certainly frame facts and figures to further their agenda, the impact of the media as an opinion-shaper is potentially more pernicious. As the primary source of information on party finance, the media frequently perpetrate misinformation (Kuklinski et al., 2000) stemming from sampling bias in reporting on donations and expenditures (Ansolabehere et al., 2005), market-based incentive structures (Hamilton, 2004), or from the use of slant or (ideological) bias (Baron, 2006; Druckman and Parkin, 2005; Kahn and Kenney, 2002).
Third, if taken at face value, public opinion can produce mixed messages for policy-makers. With regard to funding political parties for example, limited polling evidence suggests that there is widespread support for caps on voluntary donations (Joseph Rowntree Reform Trust, 2004) and significant opposition to funding by trade unions and business. Moreover, nearly three-quarters of the public support the idea that parties should be responsible for raising their own income rather than relying on the state, for which there is little appetite for (increased) state funding as a substitute form of income (Electoral Commission, 2004; Shapiro, 2003). Thus, the only seemingly acceptable party finance model to public opinion is parties funded solely by membership subscriptions: a model which has never genuinely existed in mainstream British party politics and is unlikely to exist in the future given the diminishing number of party members.
The aim of this article is to contribute to the limited body of empirical evidence on public knowledge of and attitudes to party finance in Britain. Drawing on a nationally representative survey from YouGov’s online panel (N = 2,008), we present three key findings: first, the public have little knowledge of key aspects of party finance; second, ignorance is no barrier to hostility to the system; third, attitudes to party finance can be understood to exist along two dimensions – ‘anti-party finance’, i.e. those who feel parties overspend and perhaps waste significant sums of money on campaigning and that they are inherently corrupt, and ‘reformers', i.e. those who feel that existing party finance arrangements are unsatisfactory, but support additional reform to remedy current problems.
More generally, we argue that understanding attitudes to party finance matters not least because advocates have cited the low regard in which the public hold party finance systems as prima facie evidence for reform (Primo, 2002, 2003; Primo and Milyo, 2006), but because attitudes to party finance are informed by pre-existing dispositions – based in a wider malaise – which suggests that opinion-led reforms are unlikely to succeed. Given this, to what extent should policy-makers heed and be guided by public opinion? 1 Effective democratic governance requires responsiveness to the will of the people, but what happens when the will of the people is difficult to establish? Are there instances where parties and politicians should be freed from the constraints of public opinion?
Empirical accounts and normative implications
A feature of previous work on knowledge and attitudes to party finance in Britain is the lack of comprehensive and indeed comparative study. While much is known concerning the impact of spending and the vote (Fisher 1999; Johnston and Pattie, 2008, 2009), the sources and funding of political parties (Ewing, 2006, 2007; Fisher, 2002, 2004; Johnston and Pattie, 2007a, b) and the impact of reforms (Clift and Fisher, 2004, 2005), significantly less work has examined public attitudes to party finance. Indeed, most of the empirical data generated on knowledge and attitudes stems from work by the regulator – the Electoral Commission – and from polls commissioned by public interest organizations. Collectively, the central finding is rather pessimistic: political finance is plagued by widespread and pervasive misunderstanding by the general public. In this regard, the British public are not unique, as evidence from the United States draws similar conclusions (Mayer, 2001; Primo, 2002; Shaw and Ragland, 2000; Sorauf, 1988).
Evidence of this is shown in reviews of public attitudes to party finance by the Electoral Commission (2006a). Their study found that while respondents admitted to having little knowledge of the existing regulations governing party finance, perceptions of party finance varied systematically by knowledge levels: participants with little-or-no knowledge of party finance were surprised at the ‘complexity’ of the system and the diversity of sources of donations; those with some knowledge were surprised by the (high) levels of spending by the three main parties; and those with the most knowledge – who could contextualize party expenditure in relation to general public expenditure – were ‘surprised that party spending wasn’t higher’ (Electoral Commission, 2006a: 24). More generally, participants believed that parties spend a large proportion of their income on election campaigning – particularly large national advertising campaigns – with little knowledge of parties' day-to-day operating costs or expenditure (Cragg Ross Dawson, 2004; Electoral Commission, 2006a).
Despite low knowledge levels, participants were able to articulate significant shortcomings of the system and demonstrated widespread agreement on options for reform, including greater transparency in the source of donations and party expenditure, enhanced regulatory oversight, caps on donations from individuals and business, and (further) decreasing national party spending. However, and as demonstrated in the Commission’s study, it would appear that some of the more severe evaluations of party finance and much favoured reforms are not specific to the issue of party finance, but as part of a remedy to curing the political system of what seemingly ails it, namely part of the process of ‘cleaning up politics'.
Understanding the interplay of knowledge of and attitudes to party finance may help to shed light on what can be perceived as the public sending mixed messages to policy-makers. For example, there is widespread public support for caps on voluntary donations – a clear and effective limit on party income – while simultaneously the public support limiting/prohibiting state funding. Under the ‘mixed messages' view, the public want to restrict party income without providing an alternative source: they neither want the ‘undue influence’ affiliated with income by voluntary donations, nor do they wish to fund parties through the public purse. This is analogous to the debate about taxation and public expenditure, where surveys repeatedly show that voters desire the seemingly incompatible goals of low taxation and high levels of public expenditure. In short, there is no clear means of supporting parties, save for income generated from membership fees – an idealized and almost certainly unworkable model – and indeed one that has its own normative drawbacks (Hopkin, 2004). Nevertheless, as Fisher (2008) shows, this model is still promoted as an ideal type. Taking into account the low regard with which the public view politics and political life, however, may suggest greater consistency in the public’s attitudes to party finance. The public’s desire to restrict party income via party finance reform may go some way towards ‘cleaning up politics', restoring trust and eliminating influence. Indeed, for these reasons, and as noted by the Commission, ‘public attitudes should not be taken at face value’ (Electoral Commission, 2006a: 4).
Data and approach
To examine public knowledge and attitudes to party finance, we surveyed British adults (N = 2,008) in June–July 2008 using YouGov’s online panel. 2 Respondents were prompted to consider party finance in respect of the three main political parties – Conservative, Labour and Liberal Democrat – for the 2005 general election. Among other items, we asked respondents their perception/best estimate of constituency and national party spending, and the source and amount of donations received by the parties in the 2005 general election. We included questions tapping preferences for funding parties, mandatory disclosure requirements for all donations and expenditures and perceptions of the integrity of the current system. Finally, we included questions tapping knowledge of national and constituency party spending limits along with standard demographic controls.
In designing the survey, much consideration was given to question wording and ordering and, in particular, the impact of closed vs. open-ended response options in generating missing data. One approach would be to ask these questions with open-ended response options because – statistically – it allows us to capture both the average estimate and (the anticipated large) variation of estimates: those who underestimate spending, those who are correct, those who (significantly) overestimate spending and those who are unwilling to respond because they genuinely don’t know or are otherwise unwilling to provide an answer. Theoretically, at least, we can learn something about knowledge and perceptions of party finance by the percentage of respondents who significantly over or underestimate expenditures or say they ‘don’t know’. However, such an approach is likely to generate a significant amount of missing data and there is increasing evidence that arbitrary features of surveys like open vs. closed-ended questions can affect validity (Prior and Lupia, 2008). To this end, we utilized both open and closed-ended formats, the consequences of which are discussed below.
The analysis proceeds in three parts. We begin by examining public knowledge and perceptions of spending by parliamentary candidates at constituency level and the three main political parties at national level. 3 Second, we examine respondents' estimates of sources of income for the three parties and the appropriate limit or cap for voluntary donations. We compare the former estimates with actual sources of income as reported by the Electoral Commission (2006b). Finally, we seek to model attitudes to political finance more generally by examining the influence of newspaper readership, party preference, underlying assumptions about the motivations for donors and demographic controls.
Knowledge and attitudes to party finance
Our first task is to demonstrate the range of responses given by respondents to questions probing their knowledge of the key aspects of the British party finance system, constituency and national party spending limits and estimates of the sources of voluntary donations. We begin by analysing respondents' knowledge of national and constituency level party spending.
Campaign expenditure
First, and using an open-ended question format, we asked respondents to estimate the total amount spent campaigning by the average successful candidate during the 2005 general election. The range of responses varied significantly, from £1 to £300m, with a mean expenditure of £1.6m – a figure rivalling that of US elections for the House of Representatives. Among other things, the wide range of estimates suggests that there is a lot of ‘noise’ surrounding estimates of constituency spending. To reduce some of it in the data we excluded estimates greater than 3 standard deviation units from the mean, and in doing so the mean estimated expenditure fell to just over £352K. We report the 5 percent trimmed mean, showing the average expenditure to be £36,567. Despite steps to reduce the noise, estimates of constituency spending are still three times the legal limit that could be spent in any one constituency. 4 And, as expected, the open-ended nature of the question generated a substantial amount of missing data. Of the original sample, this question generated only 834 valid responses, or 58 percent of missing cases.
We then asked respondents to estimate national party expenditure, with two important differences. We asked them to estimate how much each of the three main parties spent on campaigning during the 2005 general election, and we gave respondents the option of choosing from a set range of options in a closed-ended format. Table 1 gives respondents' estimates of Labour, Conservative and Liberal Democrat spending. Again, respondents overestimated the actual amount spent by each of the three parties, and there is significant variation in the distribution of estimates. With respect to Labour and the Conservatives, only one in five respondents accurately identified the correct band (£10–20m), but respondents were far more accurate in their estimate of Liberal Democrat spending with nearly half of all respondents identifying the correct band (< £5m). Given the lack of comparability of the two questions, it is difficult to say that respondents were more accurate in estimating national party expenditure, although this would be unsurprising given greater media attention devoted to the national campaign. In any case, as with constituency level expenditure, respondents overestimated the national party spend, though the difference in question format is marked with 22 percent missing data – less than half of the figure recorded for the open-ended question.
Estimates of party spending in 2005 general election
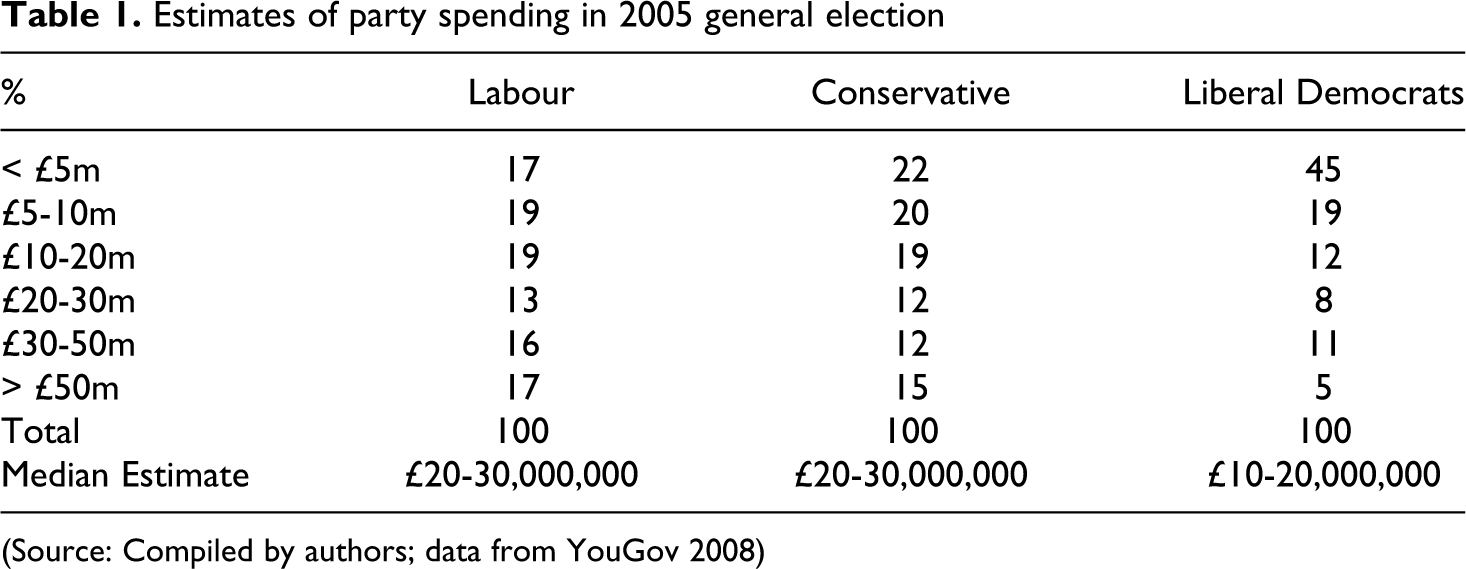
(Source: Compiled by authors; data from YouGov 2008)
Our finding that respondents overestimate campaign expenditure is common to other studies. However, we were also interested to know how respondents felt about actual levels of spending once properly informed of the established limits. Spending limits for constituency level elections in 2005 were calculated based on a base limit of £7,150 for borough and county constituencies plus an additional 5p and 7p, respectively, for each elector on the electoral register, or roughly £12,500 on average. Spending limits for the national parties in Britain are aggregated at £30,000 per contested constituency; a party fielding candidates in all 628 seats could spend a maximum at national level of £18,840,000. Table 2 gives respondents' attitudes to campaign spending once informed of the limits.
Attitudes towards current levels of campaign spending
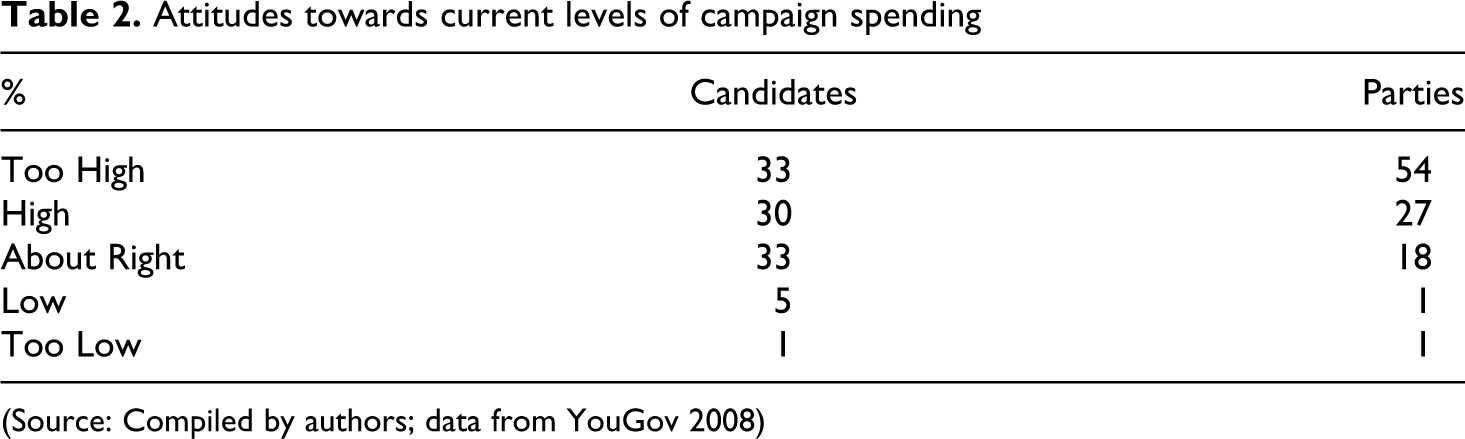
(Source: Compiled by authors; data from YouGov 2008)
For both national and constituency level expenditure, significant majorities say that spending is (too) high at 81 percent and 63 percent, respectively. One-third of respondents thought that constituency level spending was ‘about right’, with less than one in five saying national party spending was at the appropriate level. Only a very few respondents considered national or constituency level spending (too) low. Overall, respondents show little knowledge of limits on spending and, once informed, think there is too much money in politics: significant majorities believe campaign spending is excessive, though this is more pronounced for national than for constituency level spending. However, even at the constituency level, where spending is limited to £12,500 (three times less than the average estimate), nearly two-thirds of respondents think spending is too high.
Sources of income
The funding of political parties has received significant media attention and scrutiny in recent years in light of recent episodes. Such events have contributed to the perception that large donors have undue influence on the decisions taken by political parties and that a very small number of donors are responsible for the vast majority of income. To measure respondents' knowledge of the sources of income, we asked them to identify the percentage of donations coming from individuals, business, trade unions and other sources and compared them to the actual percentage as reported by the Electoral Commission (2006b). There are significant differences in the estimates made by our respondents compared with those reported by the Commission (see Table 3). 5
Estimates of sources of donations
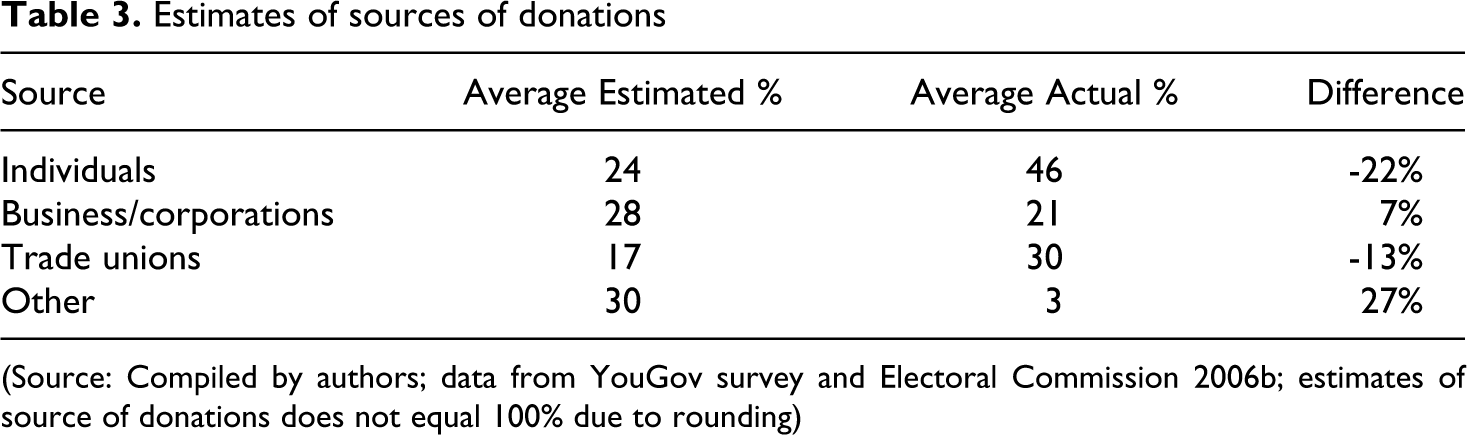
(Source: Compiled by authors; data from YouGov survey and Electoral Commission 2006b; estimates of source of donations does not equal 100% due to rounding)
Despite extensive media coverage of (large) donations made by individuals (vanHeerde-Hudson, 2010), respondents estimated that just under a quarter came from individuals, whereas 46 percent actually do, a difference of 22 percent. Respondents were more accurate in their estimates of donations from business (28 percent; actual 21 percent), but much less so in their estimates for trade unions and other sources of income. Trade unions are responsible for some 30 percent of donations, but were thought to contribute only about 17 percent and, most surprisingly, respondents estimated that nearly a third of all donations came from other sources (e.g. state funding and membership fees), whereas only 3 percent do.
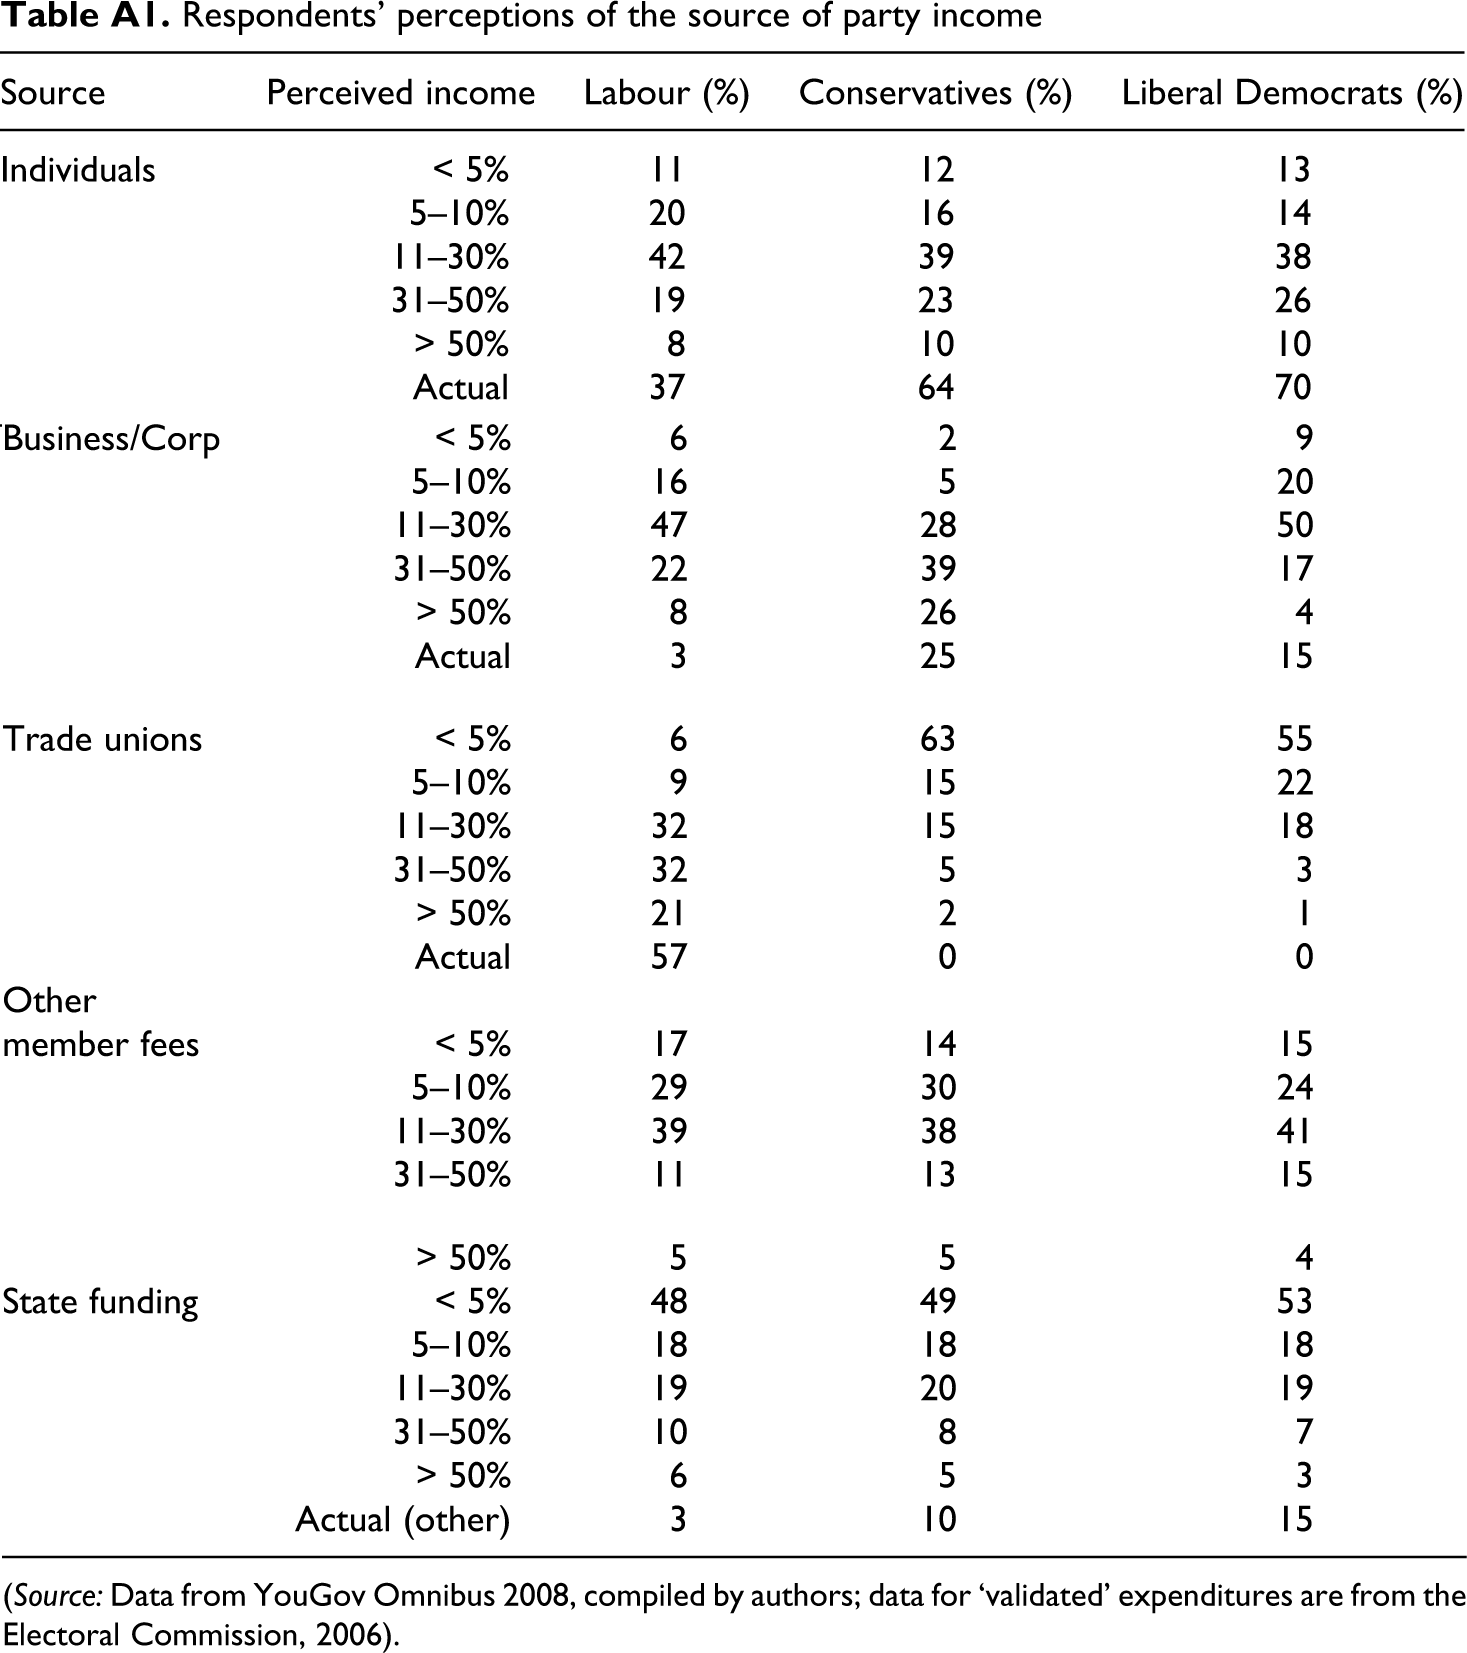
These aggregated data, however, do not show whether the public recognize differences in the sources of funding for the three main political parties. In disaggregating sources of donations by party (see Table 1A in the Appendix), the data show that the public recognize some variation in the sources of funding: in general, they see trade unions as primarily funding Labour and business funding the Conservatives, but they make little distinction in individual donations to political parties. Importantly, other sources of income are less well understood, in particular, state funding. On the one hand, they accurately perceive that state funding does not account for much income for the three parties, but they do not distinguish between the primary beneficiaries of state income – opposition parties. The data also suggest that the public overestimate how much parties receive in income from membership dues.
Attitudes
In common with other studies, our respondents showed little knowledge of the sources of income for political parties. However, because of the recent attention party funding has received in Britain, we probed respondents' attitudes to caps on donations from individuals, business and trade unions. A key motivating factor in an individual’s calculus to supporting or opposing a cap on donations may be the perceived source of party income. While it can certainly be the case that an individual supports a cap on donations in principle, i.e. regardless of the source of the donation, others may be motivated to limit donations in an effort to minimize influence from particular sources of income. In the US, for example, much was made of Barack Obama’s ability to secure donations of small amounts (<USD200) from a large number of donors, rather than relying on large amounts from individuals or indeed, special interests. At least in the US, the public perception is that, ceteris paribus, small donations are preferable to large ones and from individuals rather than business or other special interest organizations. Canada has recently taken this sentiment one step further and has banned donations other than those from individuals.
As indicated in Table 4, for all sources of donations a plurality of respondents favoured capping them at £50,000. For individual donations, there appear to be two poles of opinion: those (59 percent) who favour caps of less than £50K annually, although, of these, 30 percent of respondents favoured a cap at £15K, and those (21 percent) who felt that donations to parties by individuals should be unlimited. The data suggest, however, that the public view individual and business/trade union donations differently. Respondents were more likely to wish to prohibit donations from business (11 percent) and trade unions (19 percent) than from individuals (7 percent), but fewer felt business (15 percent) and trade unions (13 percent) should be able to make unlimited donations to political parties compared with individuals (21 percent). Finally, there were strong preferences for allowing business and trade unions to make larger donations than individuals, especially those exceeding £50K, but this appears to be a trade-off against allowing them to make unlimited donations. Thus, while there is some variation in public perceptions of the appropriate limit for donations to parties by various entities, there is a plurality – and, in the case of individual donations, a majority – in favour of capping donations at £50K per year. These findings are in keeping with previous surveys (Joseph Rowntree Reform Trust, 2004) and evidence from the Phillips Review (Phillips, 2007).
Perceptions of appropriate limit for party donations
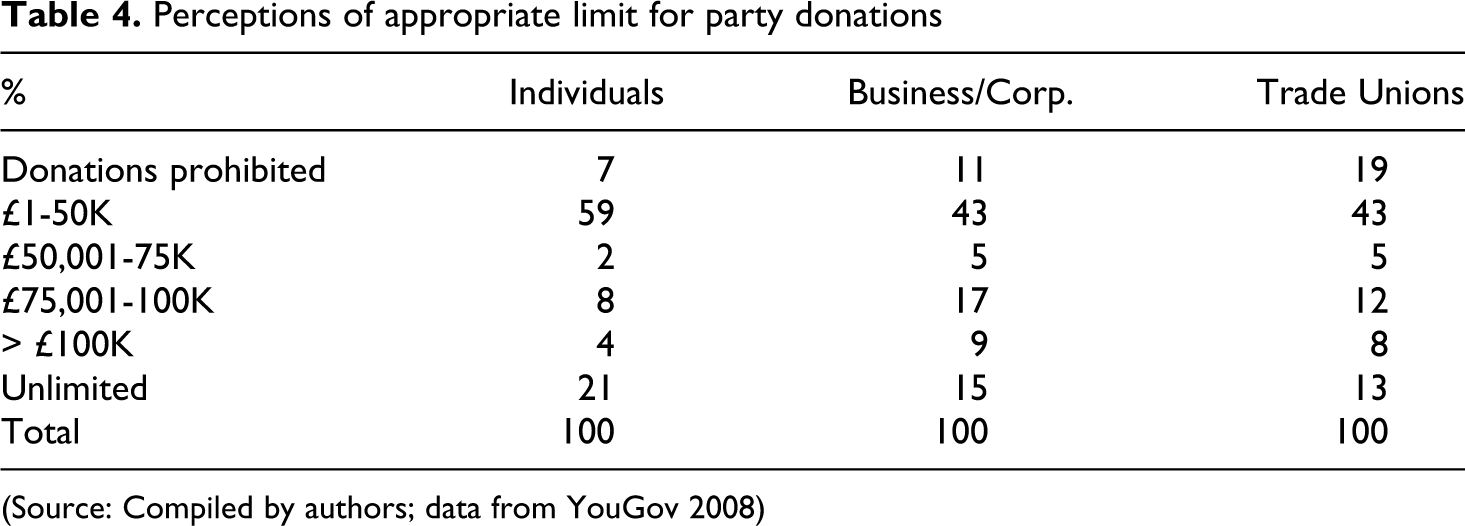
(Source: Compiled by authors; data from YouGov 2008)
Explaining attitudes
Our analysis thus far shows that respondents have little knowledge of two key aspects of party finance – limits for constituency and national party spending and the sources of party income – but have strong preferences for (further) limiting campaign expenditure and for capping donations. Our next task is to understand public attitudes to party finance. Table 5 details responses to four general questions about party finance. They suggest that there is public desire for more regulation. Despite extensive regulation, which introduced reporting requirements above certain thresholds for donations and expenditure in 2001, some 87 percent favour reporting of any donations or expenditure. Equally, a sizeable majority (67 percent) favour contribution limits. Attitudes to voluntary funding in general are more mixed, though a plurality agree that voluntary funding produces unacceptable consequences – again, in keeping with previous surveys (Electoral Commission, 2004). Finally, there is general suspicion about the probity of British party finance. While an encouraging 22 percent agree that party finance is ‘clean’, some 61 percent disagree. In general, then, it is fair to say that attitudes to party finance in Britain are generally negative: the perception is that campaign costs are too high, that more regulation is required, that voluntary funding produces inequitable consequences and that party finance is not ‘clean’.
General attitudes towards party finance
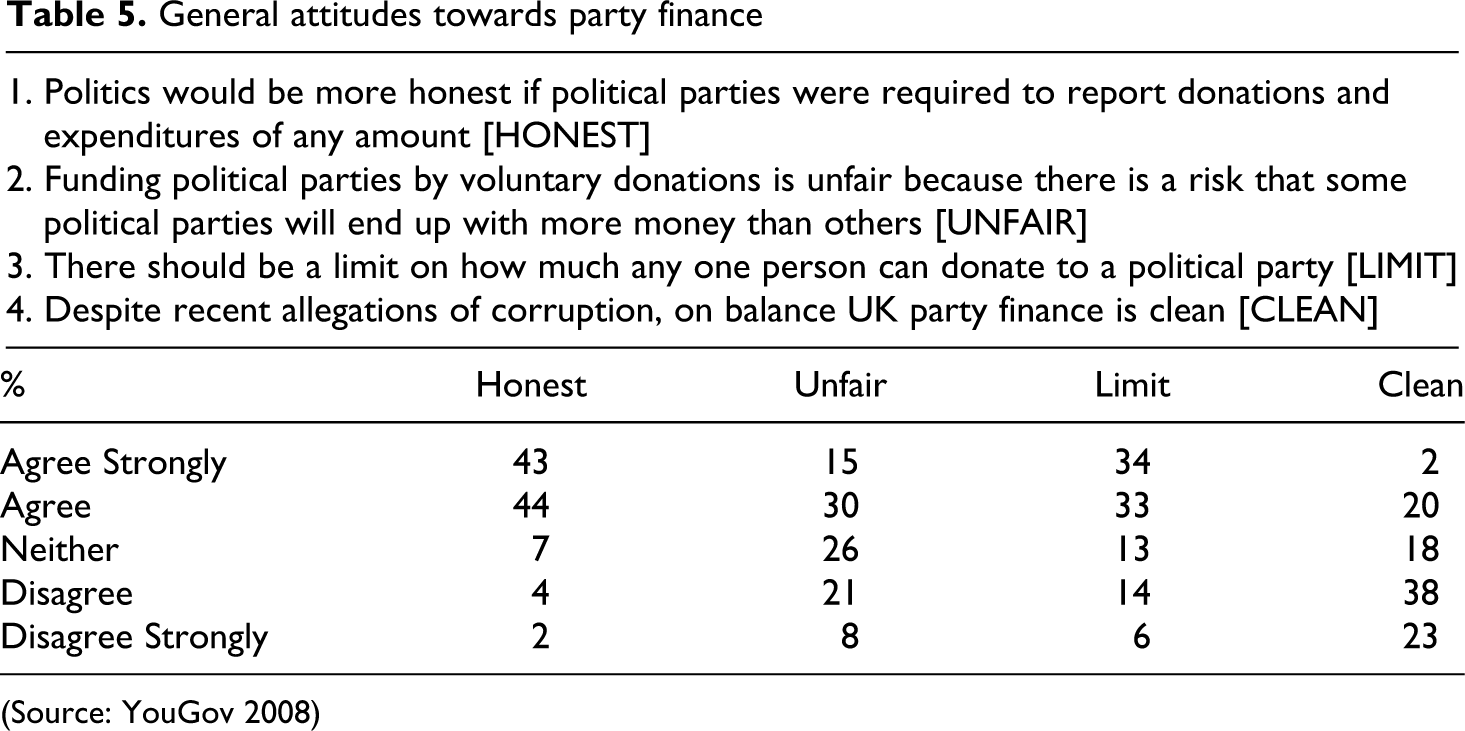
(Source: YouGov 2008)
In order to better understand attitudes (and following recoding of the variable measuring perceptions of probity in political finance to ensure directional commonality), all six variables detailed in Tables 2 and 5 were entered into a Principal Components Analysis using Varimax rotation with Kaiser normalization. The results are given in Table 6. What emerge are two underlying dimensions. Not surprisingly, responses to levels of party and campaign expenditure hang together well. In addition, the two items also correlate strongly with attitudes to the overall probity of party finance – a perception that party finance in general is not ‘clean’. This component is labelled Anti-Party Finance, since it reflects a common discourse in commentary on this topic: that parties ‘waste’ significant sums of money on campaigning and that they are inherently corrupt. The second component is labelled Reformers. Responses to the three questions on greater regulation of party finance all hang together, suggesting that there is a second group of respondents who feel that existing party finance arrangements are unsatisfactory, but that reforms offer possible solutions.
Factor analysis of attitudes towards campaign spending and party finance
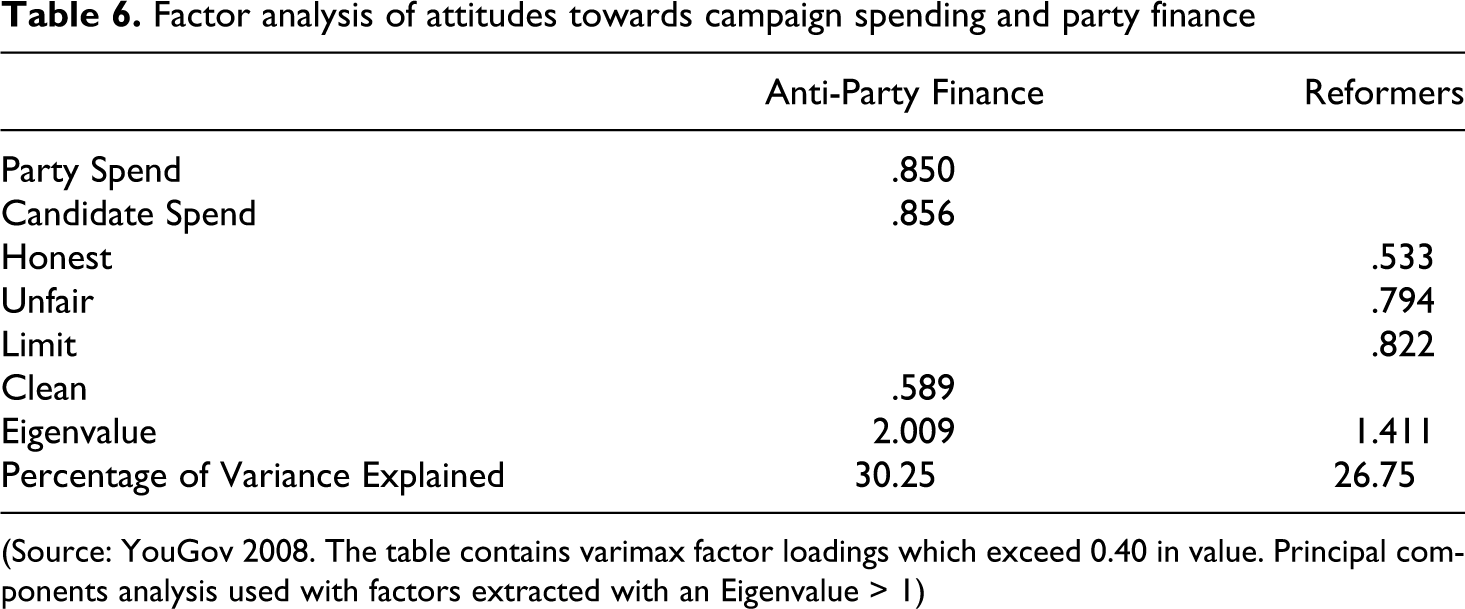
(Source: YouGov 2008. The table contains varimax factor loadings which exceed 0.40 in value. Principal components analysis used with factors extracted with an Eigenvalue > 1)
A second set of questions seeks to capture respondents' perceptions of the motivations for making donations. Respondents were presented with a set of reasons for making a donation and were asked to indicate which of them were apparent in the decision-making process. Responses are detailed in Table 7 . We see first that all motivations bar the last are deemed strong, and that the proportions indicating an affirmative response are broadly similar, with a range of 58 to 66 percent. Only in the case of the final response – promoting democratic engagement – do we find only a minority (7 percent) seeing this as an incentive.
Perceived reasons for donations
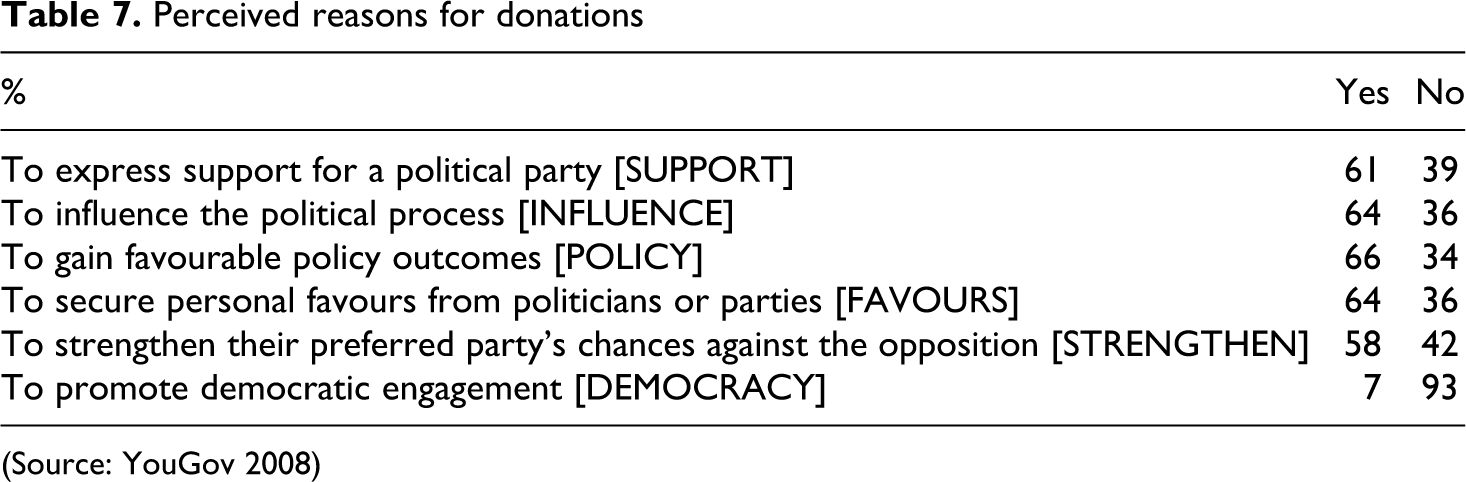
(Source: YouGov 2008)
Again, it is useful to establish whether there are any underlying clusters of attitudes. Table 8a details the phi coefficients for each 2 × 2 cross-tabulation between the items. The coefficients suggest that motivations which represent a selective incentive for the contributor (INFLUENCE, POLICY and FAVOURS) have a stronger association with each other. Equally, collective incentives (SUPPORT, STRENGTHEN and DEMOCRACY) are similarly linked. These patterns are confirmed by the exploratory factor analysis in Table 8b. Since the six items are all binary variables, care should be taken in interpreting the results from the factor analysis too closely. However, combined with the findings in Table 8a, the patterns are fairly clear. There are two underlying dimensions in respect of perceived motivations for political donations – selective incentives and collective incentives.
Matrix of Phi coefficients for perceived reasons for donations
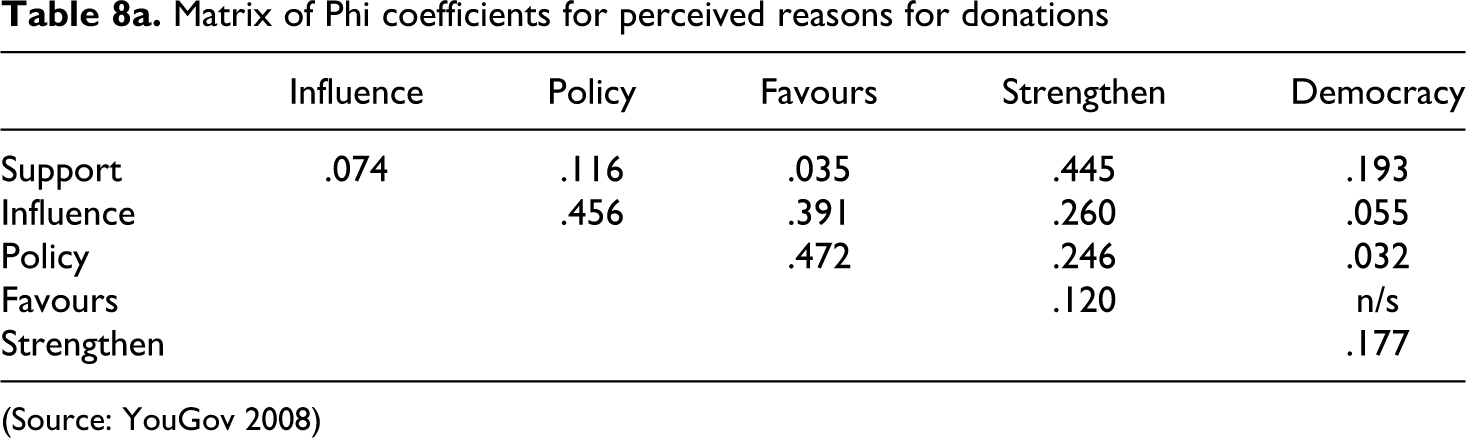
(Source: YouGov 2008)
Exploratory factor analysis of perceived reasons for donations
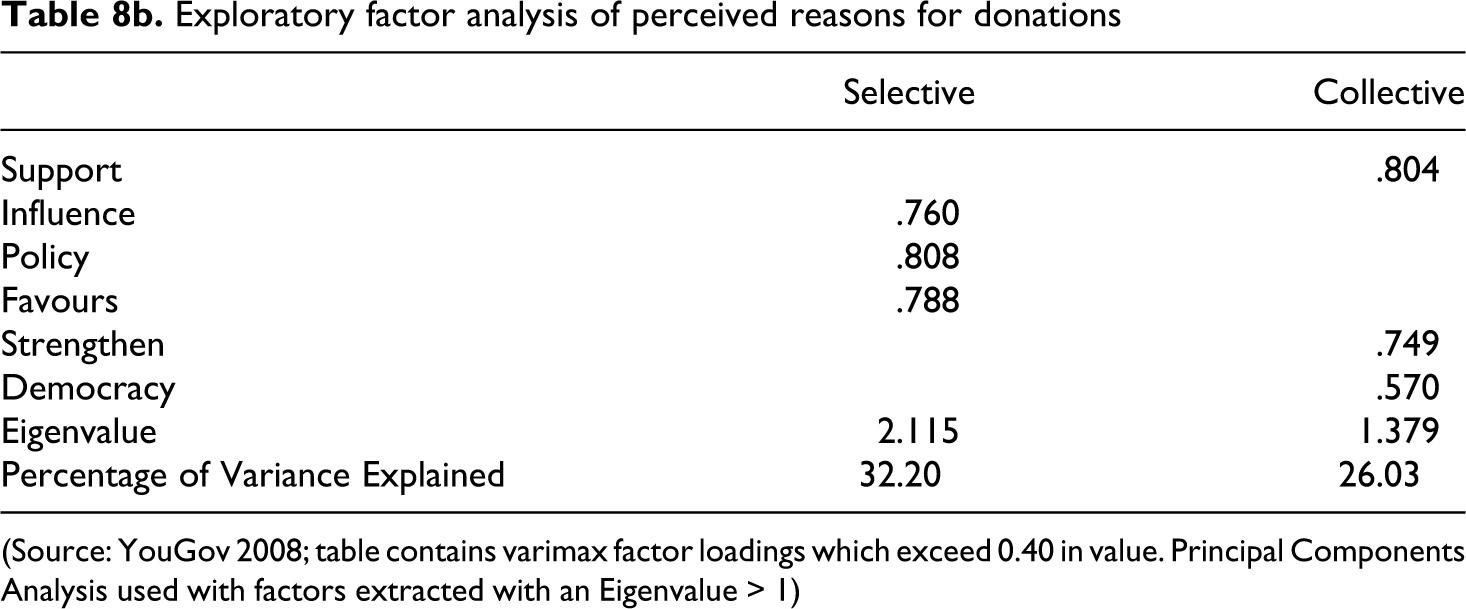
(Source: YouGov 2008; table contains varimax factor loadings which exceed 0.40 in value. Principal Components Analysis used with factors extracted with an Eigenvalue > 1)
To help explain attitudes to party finance further, we create two scales, each constructed from three 5-point variables to represent the Anti-Party Finance and Reformers dimensions. As indicated in Table 6, these two groups of variables hang together well. However, to ensure the scales are robust, Cronbach’s alpha scores were calculated, producing scores of 0.640 and 0.568 for the Anti-Party Finance and Reformers scales, respectively. On initial observation, these scores do not appear to be especially impressive. However, they provide only a partial picture. The reliability of Cronbach’s alpha as a measurement is strongly dependent on the number of items in a scale (Carmines and Zeller, 1979: 43–7; Niemi et al., 1986). 6 In our scales, there are only three items and thus the chances of the Cronbach’s alpha score reaching the norm of 0.7 are slim. The solution to the problem of establishing reliability with small item scales is to use the Spearman-Brown Prophecy Formula (Hulin, 2001). Here, an estimate is made of the level of reliability if the number of items in the scale was increased. 7 Using this technique, we estimated the reliability of our scales using the lowest possible multiplier (2), therefore producing an estimate based on six items. The results were 0.780 and 0.724 for Anti-Party Finance and Reformers, respectively, and suggest that the scales are reliable; and they confirm the patterns detected in the Principal Components Analysis (see Table 6).
The Anti-Party Finance and Reformer scales were then regressed against a series of predictor variables including perceptions of motivations to donate to political parties (selective and collective incentives), vote preference (measured as a series of dummy variables; reference category ‘no party preference’/‘no intention of voting’), newspaper readership (measured by a series of dummy variables; reference category ‘those who do not read a newspaper’), and demographic measures (age, education, income). In predicting each scale, there are two models. The first includes the demographics, party preference and newspaper readership. The second adds two scales created from the variables that capture perceived motivations for donations, collective and selective incentives, informed by the analyses in Tables 8a, b. These two scales were themselves regressed against the demographic, party preference and newspaper readership variables, but produced extremely poor model fits, suggesting that they can be used as independent variables in these analyses. The models were run using OLS (stepwise method) and logit, and as the results were near identical OLS results are reported here for ease of interpretation.
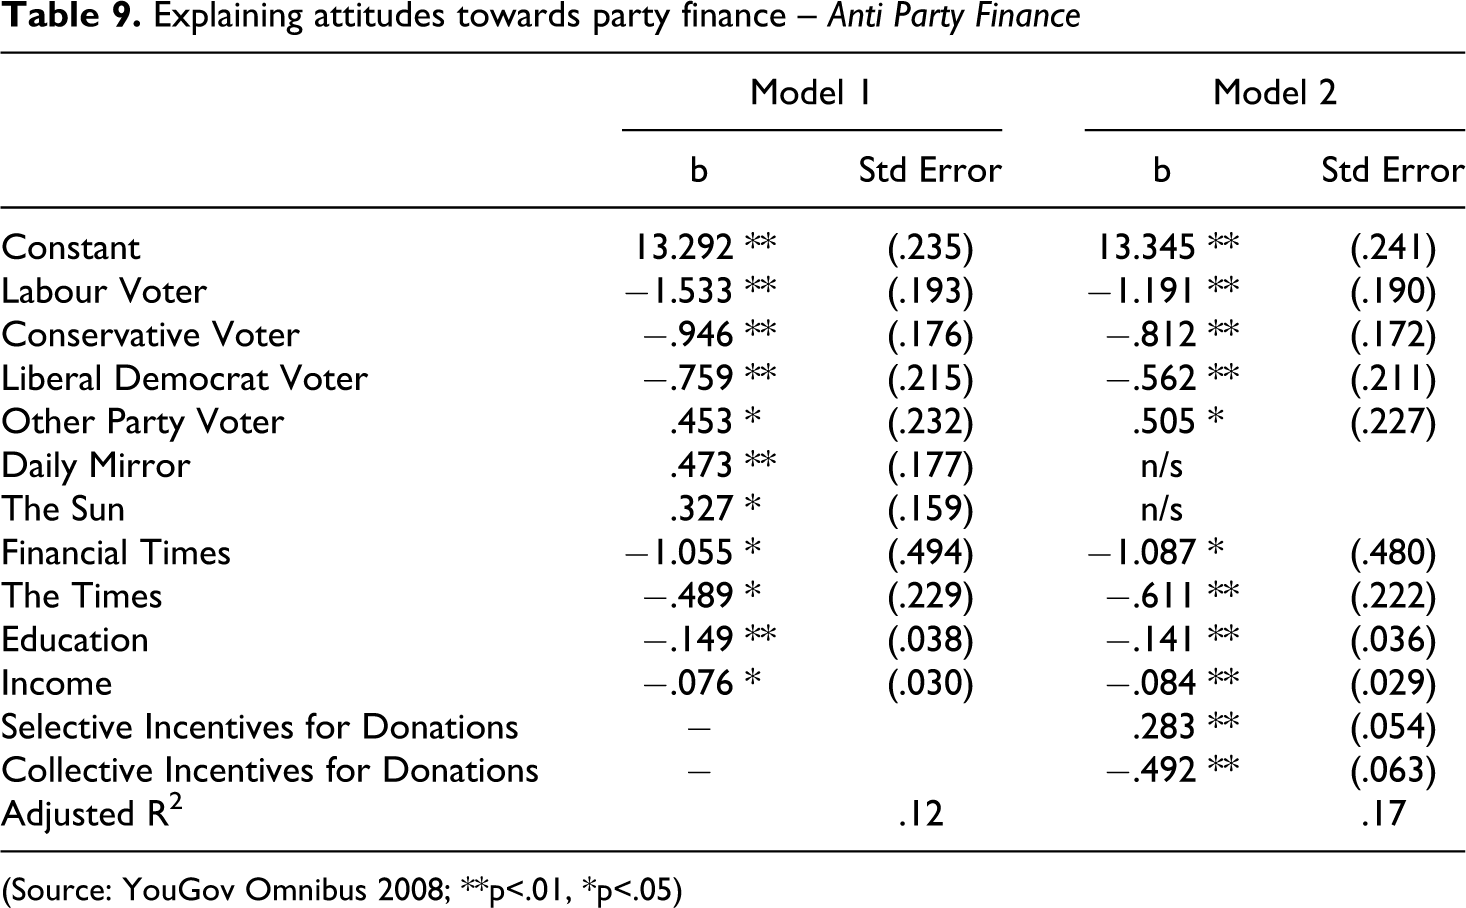
Table 9 details results in predicting anti-party finance attitudes. Only variables that are statistically significant are displayed. In model 1, there is a clear effect of mainstream versus smaller party support. Supporters of Labour, the Conservatives and Liberal Democrats are much less likely to take an anti-party finance perspective. The reverse is true for supporters of smaller parties. Secondly, income and education both have an effect – the less educated and lower earners are more likely to take an anti-party finance view. In respect of newspaper readership, there are mixed results. Readers of the Sun and Mirror are more likely to take an anti-party finance perspective, while the reverse is true of the Times and Financial Times. Media influence, where it exists, may therefore be taken as being both positive and negative.
Explaining attitudes towards party finance – Anti Party Finance
(Source: YouGov Omnibus 2008; **p<.01, *p<.05)
The introduction of the incentives for donations in model 2 leads to some changes in the results. While readerships of the Sun and Mirror are no longer statistically significant, the effects of other variables are unchanged compared with model 1. The effects of the incentives for donations variables are as expected. Those who score more highly on the selective incentives scale are more likely to see party finance in a negative light, while the reverse is true for those who emphasize collective incentives more strongly.
Overall, the results in Table 9 are interesting. On the one hand, ‘political outsiders' (represented by support for smaller parties) are more likely to be critical of existing party finance arrangements. Those parties are recipients of less income than the mainstream ones, and are arguably therefore more likely to perceive that arrangements are biased in favour of the larger parties. Moreover, while the views of Liberal Democrat supporters are broadly in line with those of Labour and the Conservatives (in as much as the coefficients are all negatively signed), their opposition to anti-party finance sentiments is far lower than that of the larger two parties (and to a statistically significant level in the case of the comparisons with Labour). Nevertheless, these results are broadly as expected. The impact of the press, however, is perhaps more unexpected. Even when controlling for perceptions of the motivations for donations, readership of two newspapers, at least, is associated with more positive views of party finance. That said, press impact is also notable for which newspapers do not appear to have any impact. 8
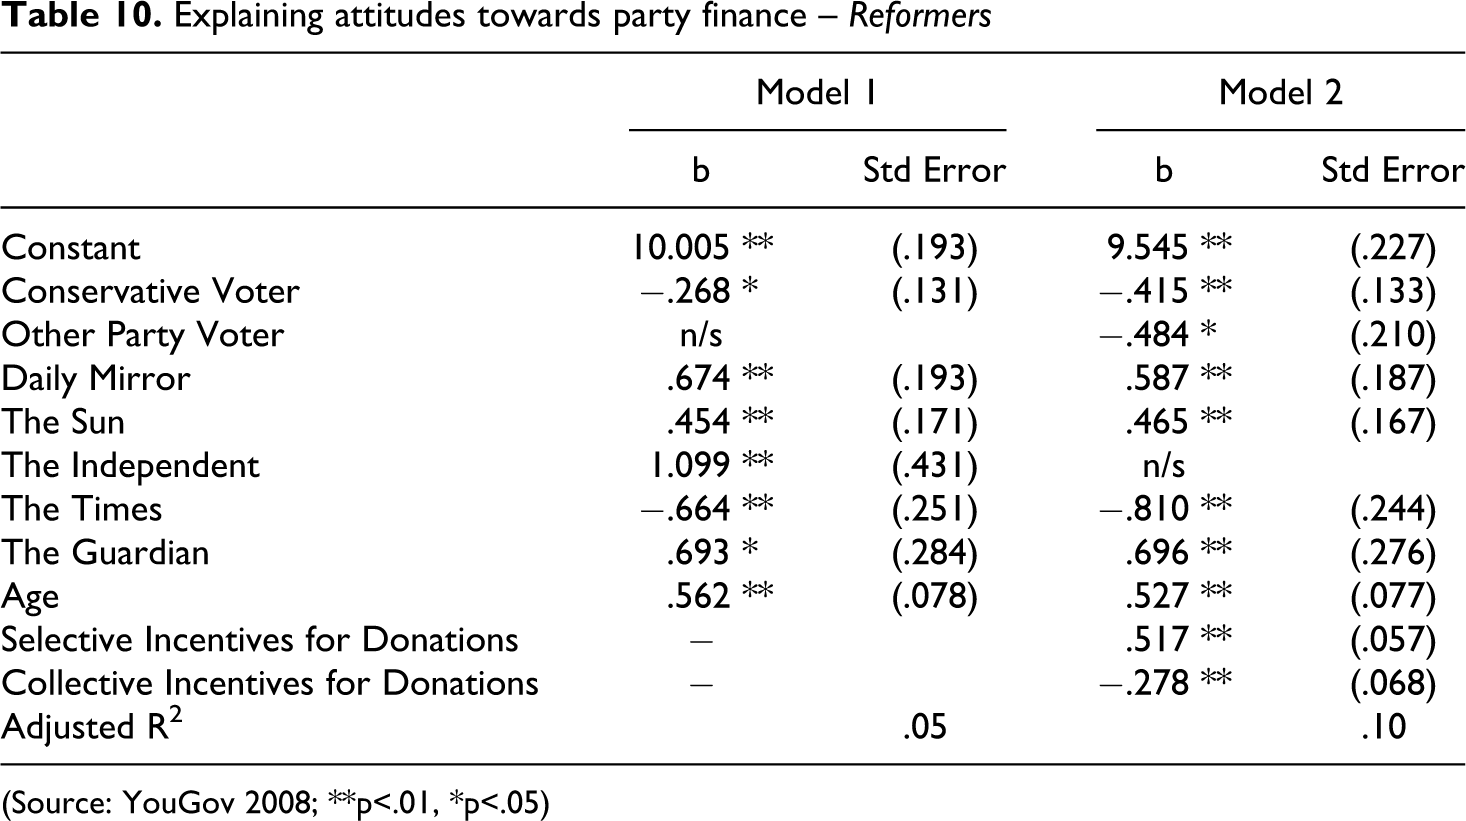
In Table 10, we seek to explain variations in attitudes on the Reformer scale. We use the same variables and models as in the case of the Anti-Party Finance analysis. In model 1, there are some notable contrasts with the Anti-Party Finance results. First, party preference has a much diminished effect. Only Conservative voters register a statistically significant effect and that impact is negative – Conservatives are less likely to favour reform. By way of contrast, support for the Reformer scale is greater among higher age groups. In respect of newspaper readership, there are some further notable contrasts. Readers of the Sun, Mirror, Independent and Guardian are all more likely to favour party finance reform. Readership of the Times also has an effect. However, it is a negative one – while Times readers are more likely to reject the Anti-Party Finance approach, they are also opposed to reform, which suggests – like Conservative voters – that they regard the status quo as being preferable. This is an interesting finding, since despite the widespread criticism of party finance arrangements that have appeared in the press readers of the Times appear to have concluded that the alternative proposals would not be preferable.
Explaining attitudes towards party finance – Reformers
(Source: YouGov 2008; **p<.01, *p<.05)
In model 2, the scales measuring perceptions of selective and collective incentives for donations are introduced. The impact on other variables is minimal, with the exception that the effect of reading the Independent is eliminated, and support of smaller parties becomes statistically significant. Somewhat surprisingly, however, the coefficient is negatively signed. Smaller parties should gain from party finance reform, because it would be likely to include such measures as donation caps, reductions in expenditure limits or even an extension of state funding – all measures that could potentially reduce the financial disparities between smaller and larger parties. However, these results and those in Table 9 suggest that supporters of smaller parties take the view that party finance is beyond repair! The coefficients for donation incentives may also be surprising: selective incentives deliver a positive effect, while collective incentives deliver a negative one. Arguably, however, the reasoning behind this is logical. Those who take the view that donations are made for personal gain are more likely to view reform as being necessary. By way of contrast, those who view donations as simply acts of party support (and, to a lesser extent, support for democracy) are more likely to view reforms as being unnecessary, since reforms would hinder acts of political preference.
Overall, then, the data reveal some significant results. If Table 9 suggested that newspaper readership may be associated with a reduction in opposition to party finance systems (relative to those who do not read newspapers), Table 10 suggests that those who read certain newspapers may be inclined to prefer reform without damning the whole system (Guardian, Independent), while the readership of others may prefer maintenance of the status quo (Times). In this respect, and in many ways counter to expectations, the supposed press influence on public perceptions of party finance may not be either as pervasive or as negative as might be assumed.
Conclusions
In this article we seek to contribute to the small number of studies examining public knowledge of and attitudes to party finance in Britain. Our respondents overestimate the amount of money spent in elections by both constituency and national parties, and in some cases by considerable margins. Moreover, respondents are generally ignorant of the average size and source of voluntary donations. We demonstrate that attitudes to party finance exist along two dimensions, what we term Anti-Party Finance and Reformers, and in modelling attitudes we find effects for mainstream versus smaller party support for the anti-party finance model, less consistently for the reformers model. We also find effects for newspaper readership with broadsheet readers less likely to take anti-party finance positions. Finally, respondents who feel there are select incentives for making donations are more likely to take anti-party finance attitudes and favour reform.
In closing, we return to our argument that understanding public attitudes matters in more detail. As we have noted, the low regard in which the public hold party finance systems has been touted as prima facie evidence of the need for reform (Primo, 2002, 2003), thus making the understanding of attitudes important. In this regard, a purely academic understanding of attitudes facilitates democratic responsiveness: the more aware policy-makers are of the opinions of the citizenry, the better they can respond to their preferences. Yet, despite extensive reform and review of party finance in recent years, the data here suggest that there remains a large appetite for reform – of just about any kind – by the British public. We might interpret the desire for additional reform as part of an iterative democratic process where consultation and deliberation inform the legislative process and, in the long-run, opinion and policy are congruent. We would suggest, however, that opinion-led reform is unlikely to succeed. Indeed, as Primo and Milyo (2003) have shown, popular reforms, such as limits on expenditure and individual donations, have failed to increase citizens' sense of political efficacy. 9
If we take public opinion at face value, it would appear that the public is downright hostile to political parties and favours policies to restrain them at almost every opportunity. Upon further deliberation, however, the public is less intent on restraining parties so much as to use reform of the party finance system as a vehicle to restore trust in government more generally. Our analysis shows that public opinion is itself divided between those who are hostile to party finance and those who seek some kind of reform. This is due in part because the specific mechanisms by which income and expenditure are regulated matter less; what the public want from reform is a new kind of politics – transparent, fair, accountable and engaging.
None of these goals – in and of themselves – is unfair to ask of party finance regulation. The problem for opinion-led reform is that attitudes to party finance do not exist in isolation; they are embedded in a set of attitudes to government more generally, and can have deep psychological roots. As Persily and Lammie (2004) have shown, although most Americans believe campaign finance to be corrupt, ‘perception of corruption may be a subspecies of a broader psychological phenomenon: distrust of others. Cynics who are predisposed to see the worst in people, also tend to see the worst in government’ (2004: 173). Understanding attitudes to party finance in this manner allows us to move beyond summaries of preferences on income and expenditure and to show why reform measures designed at least in part to increase trust may be likely to fail (Rosenstone, 2009).
In summary, the British public knows little of party finance and, consequently, public opinion is unlikely to offer a rational course of action for effective reform. Thus, in this case, there may be reason for parties and politicians to be free of the constraints of public opinion. Future reform efforts may be better suited to finding a workable equilibrium between income and expenditure, and transparency and accountability, rather than using party finance general reform as a vehicle aimed at increasing trust in government. Indeed, these findings have wider implications, both outside Britain and for other areas of reform. The results presented are remarkably similar to those observed in the United States, and suggest that there may be common patterns in terms of public attitudes to party finance and broader positions on system malaise. Political scientists may wish to consider this, too, when advocating the importance of public opinion as a spur to reform in other low salience or low knowledge areas such as House of Lords reform or possibly even electoral reform. Of course, this is not an argument for ignoring public opinion altogether. Rather, it is a note of caution for those who seek to make significant reforms based on the sometimes selective use of public opinion.
Footnotes
Appendix
Respondents' perceptions of the source of party income
| Source | Perceived income | Labour (%) | Conservatives (%) | Liberal Democrats (%) |
|---|---|---|---|---|
| Individuals | < 5% | 11 | 12 | 13 |
| 5–10% | 20 | 16 | 14 | |
| 11–30% | 42 | 39 | 38 | |
| 31–50% | 19 | 23 | 26 | |
| > 50% | 8 | 10 | 10 | |
| Actual | 37 | 64 | 70 | |
| Business/Corp | < 5% | 6 | 2 | 9 |
| 5–10% | 16 | 5 | 20 | |
| 11–30% | 47 | 28 | 50 | |
| 31–50% | 22 | 39 | 17 | |
| > 50% | 8 | 26 | 4 | |
| Actual | 3 | 25 | 15 | |
| Trade unions | < 5% | 6 | 63 | 55 |
| 5–10% | 9 | 15 | 22 | |
| 11–30% | 32 | 15 | 18 | |
| 31–50% | 32 | 5 | 3 | |
| > 50% | 21 | 2 | 1 | |
| Actual | 57 | 0 | 0 | |
| Other | ||||
| member fees | < 5% | 17 | 14 | 15 |
| 5–10% | 29 | 30 | 24 | |
| 11–30% | 39 | 38 | 41 | |
| 31–50% | 11 | 13 | 15 | |
| > 50% | 5 | 5 | 4 | |
| State funding | < 5% | 48 | 49 | 53 |
| 5–10% | 18 | 18 | 18 | |
| 11–30% | 19 | 20 | 19 | |
| 31–50% | 10 | 8 | 7 | |
| > 50% | 6 | 5 | 3 | |
| Actual (other) | 3 | 10 | 15 |
(Source: Data from YouGov Omnibus 2008, compiled by authors; data for ‘validated’ expenditures are from the Electoral Commission, 2006).