
Abstract
Background:
Age is the strongest factor determining disease expression in multiple sclerosis (MS). We previously demonstrated biological age acceleration in pediatric-onset MS (POMS) compared to controls with both epigenetic clocks (DNAm) and telomere length (TL). It is unknown whether these markers report overlapping or distinct aging-related processes.
Objectives:
To determine the correlation between DNAm and TL aging markers.
Methods:
We conducted a cross-sectional case–control study within the US Network of Pediatric MS Centers. We calculated age acceleration residuals for the Horvath, Hannum, PhenoAge, and GrimAge epigenetic clocks and measured TL from whole blood samples to estimate telomere to somatic DNA ratios (T/S ratio). We employed multivariable analysis of covariance to assess the correlation between DNAm estimates and TL.
Results:
We analyzed biological ages in 270 participants (125 POMS, mean 15.7 years; 145 controls, mean 15.3 years). There were moderate correlations among the different DNAm clocks, but no correlations between DNAm clocks and TL in pooled analyses. In a stratified analysis, only the control group showed a modest correlation between TL and PhenoAge clock (r = 0.2, p = 0.06).
Conclusions:
DNAm did not correlate with TL in this sample of POMS and controls, suggesting that these biomarkers may capture complementary and non-overlapping elements of aging-related biology.
Background
Age is the strongest factor associated with disease expression in multiple sclerosis (MS). 1 Younger individuals with MS have high relapse attack rates with remittance of symptoms, and older individuals tend to have a progressive neurodegenerative disease course. 2 Biological age can be estimated with measurements of aging processes, whereas chronological age is simply defined as the time since birth date. Both have been associated with disability accumulation in MS. 3 Capturing the multiple facets of aging is challenging, but several biomarkers have emerged as promising candidates for measuring biological age in patients with MS, including epigenetic age and leukocyte telomere length (TL). 1 These biological aging markers have been associated with the accumulation of MS-related disability and may be accelerated in people living with MS. 3
TL is one of the most reliable and widely recognized markers of biological age. 4 Telomeres are highly regulated, repeated nucleotide sequences that cap eukaryotic linear chromosomes, protect chromosomal degradation during DNA double-strand breaks, and maintain cell proliferation and genomic stability.4,5 Chronic inflammation and autoimmune diseases are associated with accelerated telomere shortening, 6 and early telomere attrition occurs in childhood in association with disease and environmental stress. 7 In adults with MS, peripheral blood cell TL is shorter compared to controls and associated with clinical disability and brain atrophy.6,8 More recently, data from the US Network of Pediatric MS Centers demonstrated shorter TL in pediatric-onset MS (POMS) participants compared to controls. 9
DNA methylation age, also referred to as “epigenetic age” (DNAm age), corresponds to specific CpG methylation patterns that associate with aging-related outcomes. 10 Several epigenetic clocks have been developed that capture both lifespan and healthspan in both healthy and disease states.10 –12 In adults with MS, epigenetic age acceleration has been observed in B cells 13 and in glial cells from individuals with progressive disease. 14 In a separate study from the US Network of Pediatric MS Centers, POMS participants demonstrated greater epigenetic ages compared to healthy controls. 15
Despite independent work evaluating biological aging markers, correlations among these different aging biomarkers are less understood, and it remains unclear whether they are capturing different or converging biological pathways. Focusing on the pediatric population offers a unique opportunity to measure accelerated aging in MS by minimizing potential confounding from normal aging and medical comorbidities. We have so far demonstrated that POMS patients have both shortened TL and accelerated epigenetic age compared to age-matched controls.9,15 Here, we sought to evaluate the correlation between epigenetic age and TL in early POMS.
Methods
Design and participants
We conducted a case–control study leveraging clinical and DNA samples collected in the parent Environmental and Genetic Risk Factors for Pediatric MS study from the US Network of Pediatric MS Centers (R01NS071463, PI Waubant). POMS cases and healthy pediatric control participants were recruited from 17 pediatric MS centers from November 2011 to July 2017. POMS cases were defined as participants aged 3 to 18 years at disease onset with clinical features fulfilling the 2010 McDonald criteria for MS or clinically isolated syndrome at risk of MS with a disease duration of less than 5 years. Participants with the diagnosis of myelin oligodendrocyte glycoprotein antibody disease and aquaporin-4 antibody-positive neuromyelitis optica were excluded. Healthy control participants were recruited from pediatric subspecialty clinics in the same underlying catchment areas as each of the POMS participants at the US Network of Pediatric MS Centers locations. For the epigenetics analysis, samples were limited to those of European ancestry to minimize confounding by population substructure.
DNA methylation and TL measurements
Whole blood was collected from cases and controls. DNA was purified using the QIAamp DNA Mini Kit with bisulfite, and the Zymo EZ-96DNA Methylation Kit was used for bisulfite conversion of unmethylated cytosines to uracil. The DNA was then processed, and quantitative methylation values were measured using Illumina’s Infinium Methylation EPIC BeadChip whole-genome microarray analysis platform. The methylation scores were quantitatively preprocessed using the Minfi R package.16,17 Cell-specific proportions were estimated based on the Houseman method. 18 Epigenetic ages were calculated from methylation patterns based on previously published lifespan and healthspan epigenetic clocks. These include the Horvath, 19 Hannum, 11 PhenoAge, 20 and GrimAge 12 clocks. Age acceleration residuals were calculated by regressing epigenetic age on chronological age. An epigenetic estimator for TL (DNAmTL) based on 140 CpG patterns was also calculated based on previously published methods by Lu et al. 21
TL was measured from DNA extracted from the whole blood samples using real-time quantitative polymerase chain reaction (qPCR) as previously published. 22 The TL was expressed as a telomere to single copy gene ratio (T/S) that compares repeat copy number T to a reference single gene copy number S as previously described. 23 Duplicate samples were measured, and the final measurement was accepted if the variation was <10% between duplicates.
Statistical analyses
Covariate information was summarized using means, medians, and frequencies as appropriate. Demographic comparison between POMS cases and controls used Welch’s two-sample t-test for continuous variables and chi-square tests for categorical variables. Univariate estimates of correlations utilized non-parametric Spearman’s rank coefficients. Conditional correlation estimates between the epigenetic clocks and TL, adjusting for potential confounding, were obtained using multivariable analysis of variance (MANOVA) models, adjusting for covariates chosen a priori based on face validity and previous research. 24 These potential confounders included the following demographic variables: chronological age, sex, race, and ethnicity; participant health covariates (tobacco exposure (exposure to tobacco smoke at any time for more than 6 months including passive smoke exposure) and body mass index (BMI)); socioeconomic variables (biological mother’s highest level of education, insurance type, and food security); blood cell proportion type in individual samples (CD8+ T cells, CD4+ T cells, NK cells, B cells, monocytes, granulocytes, plasmablasts, CD8+ CD28-CD45RA- T cells, CD8+ naïve T cells, and CD4+ naïve T cells); and case–control status. We also included treatment covariates for POMS cases, including documented use of disease-modifying therapies (DMTs) and exposure to lymphocyte-depleting treatments (rituximab, natalizumab). We evaluated for batch effects in the multivariable model, but their effect on the point estimate was minimal after adjusting for other key confounders and was thus not included in the final model.
Our primary analysis included all participants for whom complete data were available on epigenetic markers and TL. The data exhibited some moderate missingness in several important covariates. Therefore, we explored correlation estimates from both a complete case analysis and after utilizing multiple imputation via chained equation (MICE), 25 the latter method being motivated by a desire to limit loss of sample size and minimize potential bias. 26 We used a fully conditional imputation model with predictive mean matching to impute continuous variables and logistic regression for categorical covariates. Estimates of correlation, with associated standard errors (reported as 95% confidence intervals), were then obtained using Rubin’s rules and bootstrap resampling. 27 For sensitivity analysis, we employed the same analysis method just described using all subjects for whom TL data were available (a larger sample than for epigenetic age) and utilized the multiple imputation scheme described above to impute missing epigenetic biological aging markers along with missing covariate information. 26 In a secondary analysis, we applied the same multivariable model to assess the correlation between TL and the age-accelerated residuals (AAR) for the DNAm age clocks. The AAR is calculated by regressing the epigenetic age on chronological age for each clock and represents a difference in biological and chronological age. As an exploratory analysis, we assessed the correlation between the methylation pattern-based estimate of TL (DNAmTL) and directly measured TL and the DNAm age clock estimates. In stratified analyses, we applied the same methodologies to POMS and control groups separately to examine effect modification by the disease state.
Analyses were conducted in R (version 4.3.1) and RStudio.28,29 Imputation was accomplished using the MICE package. 25 We utilized the standard cutoff level of p = 0.05 as the threshold for statistical significance.
Results
Demographics
A total of 270 participants were included in the study, including 125 POMS cases (mean age 15.7 years, SD 2.6, 64% female) and 145 pediatric controls (mean age 15.3 years, SD 3.4, 64% female). The median disease duration at time of blood draw for the POMS group was 0.72 years (inter-quartile range (IQR) 0.28–1.35 years). The cohort was predominantly white (POMS 97.6%, controls 93.8%) and non-Hispanic (Hispanics: POMS 2.4%, controls 2.1%). In the POMS group, 51.2% of participants were on a DMT at the time of sample collection, though only 4.8% were exposed to high-efficacy lymphocyte-depleting therapies. The median exposure time for the DMT-exposed group was 0.65 years (IQR 0.25–1.10 years). DMTs included glatiramer acetate, interferon, dimethyl fumarate, teriflunomide, natalizumab, fingolimod, rituximab, or other. High-efficacy DMTs were designated as natalizumab, fingolimod, and rituximab. Disability scores were low in the POMS group (median EDSS 1.5, IQR 1.0–2.0), and only 3.2% had an EDSS ⩾ 4.0.
Tobacco exposure was similar in both groups (POMS 20.8%, controls 17.2%, p = 0.67). The median BMI was higher (p = 0.001) in the POMS group (22.9, IQR 20.3–27.2) than in the control group (21.4, IQR 18.5–24.5). In both groups, most mothers reported their highest education level to be either a high school and/or associate degree (POMS 49.6%, controls 34.5%) or a bachelor’s and/or graduate degree (POMS 32.8%, controls 53.1%). Insurance type differed between POMS and controls (p < 0.001), with the majority reporting either government (POMS 20.8%, controls 11.7%) or private (POMS 58.4%, controls 79.3%) insurance. Most of the participants’ mothers reported enough income to purchase food (POMS 74.4%, controls 78.6%, p = 0.64). Medical comorbidities were minimal in both the POMS and control groups, with <1% reported to have diabetes and other chronic disorders. Table 1 summarizes the demographic and clinical characteristics of all participants.
Demographics and clinical characteristics of POMS and controls.
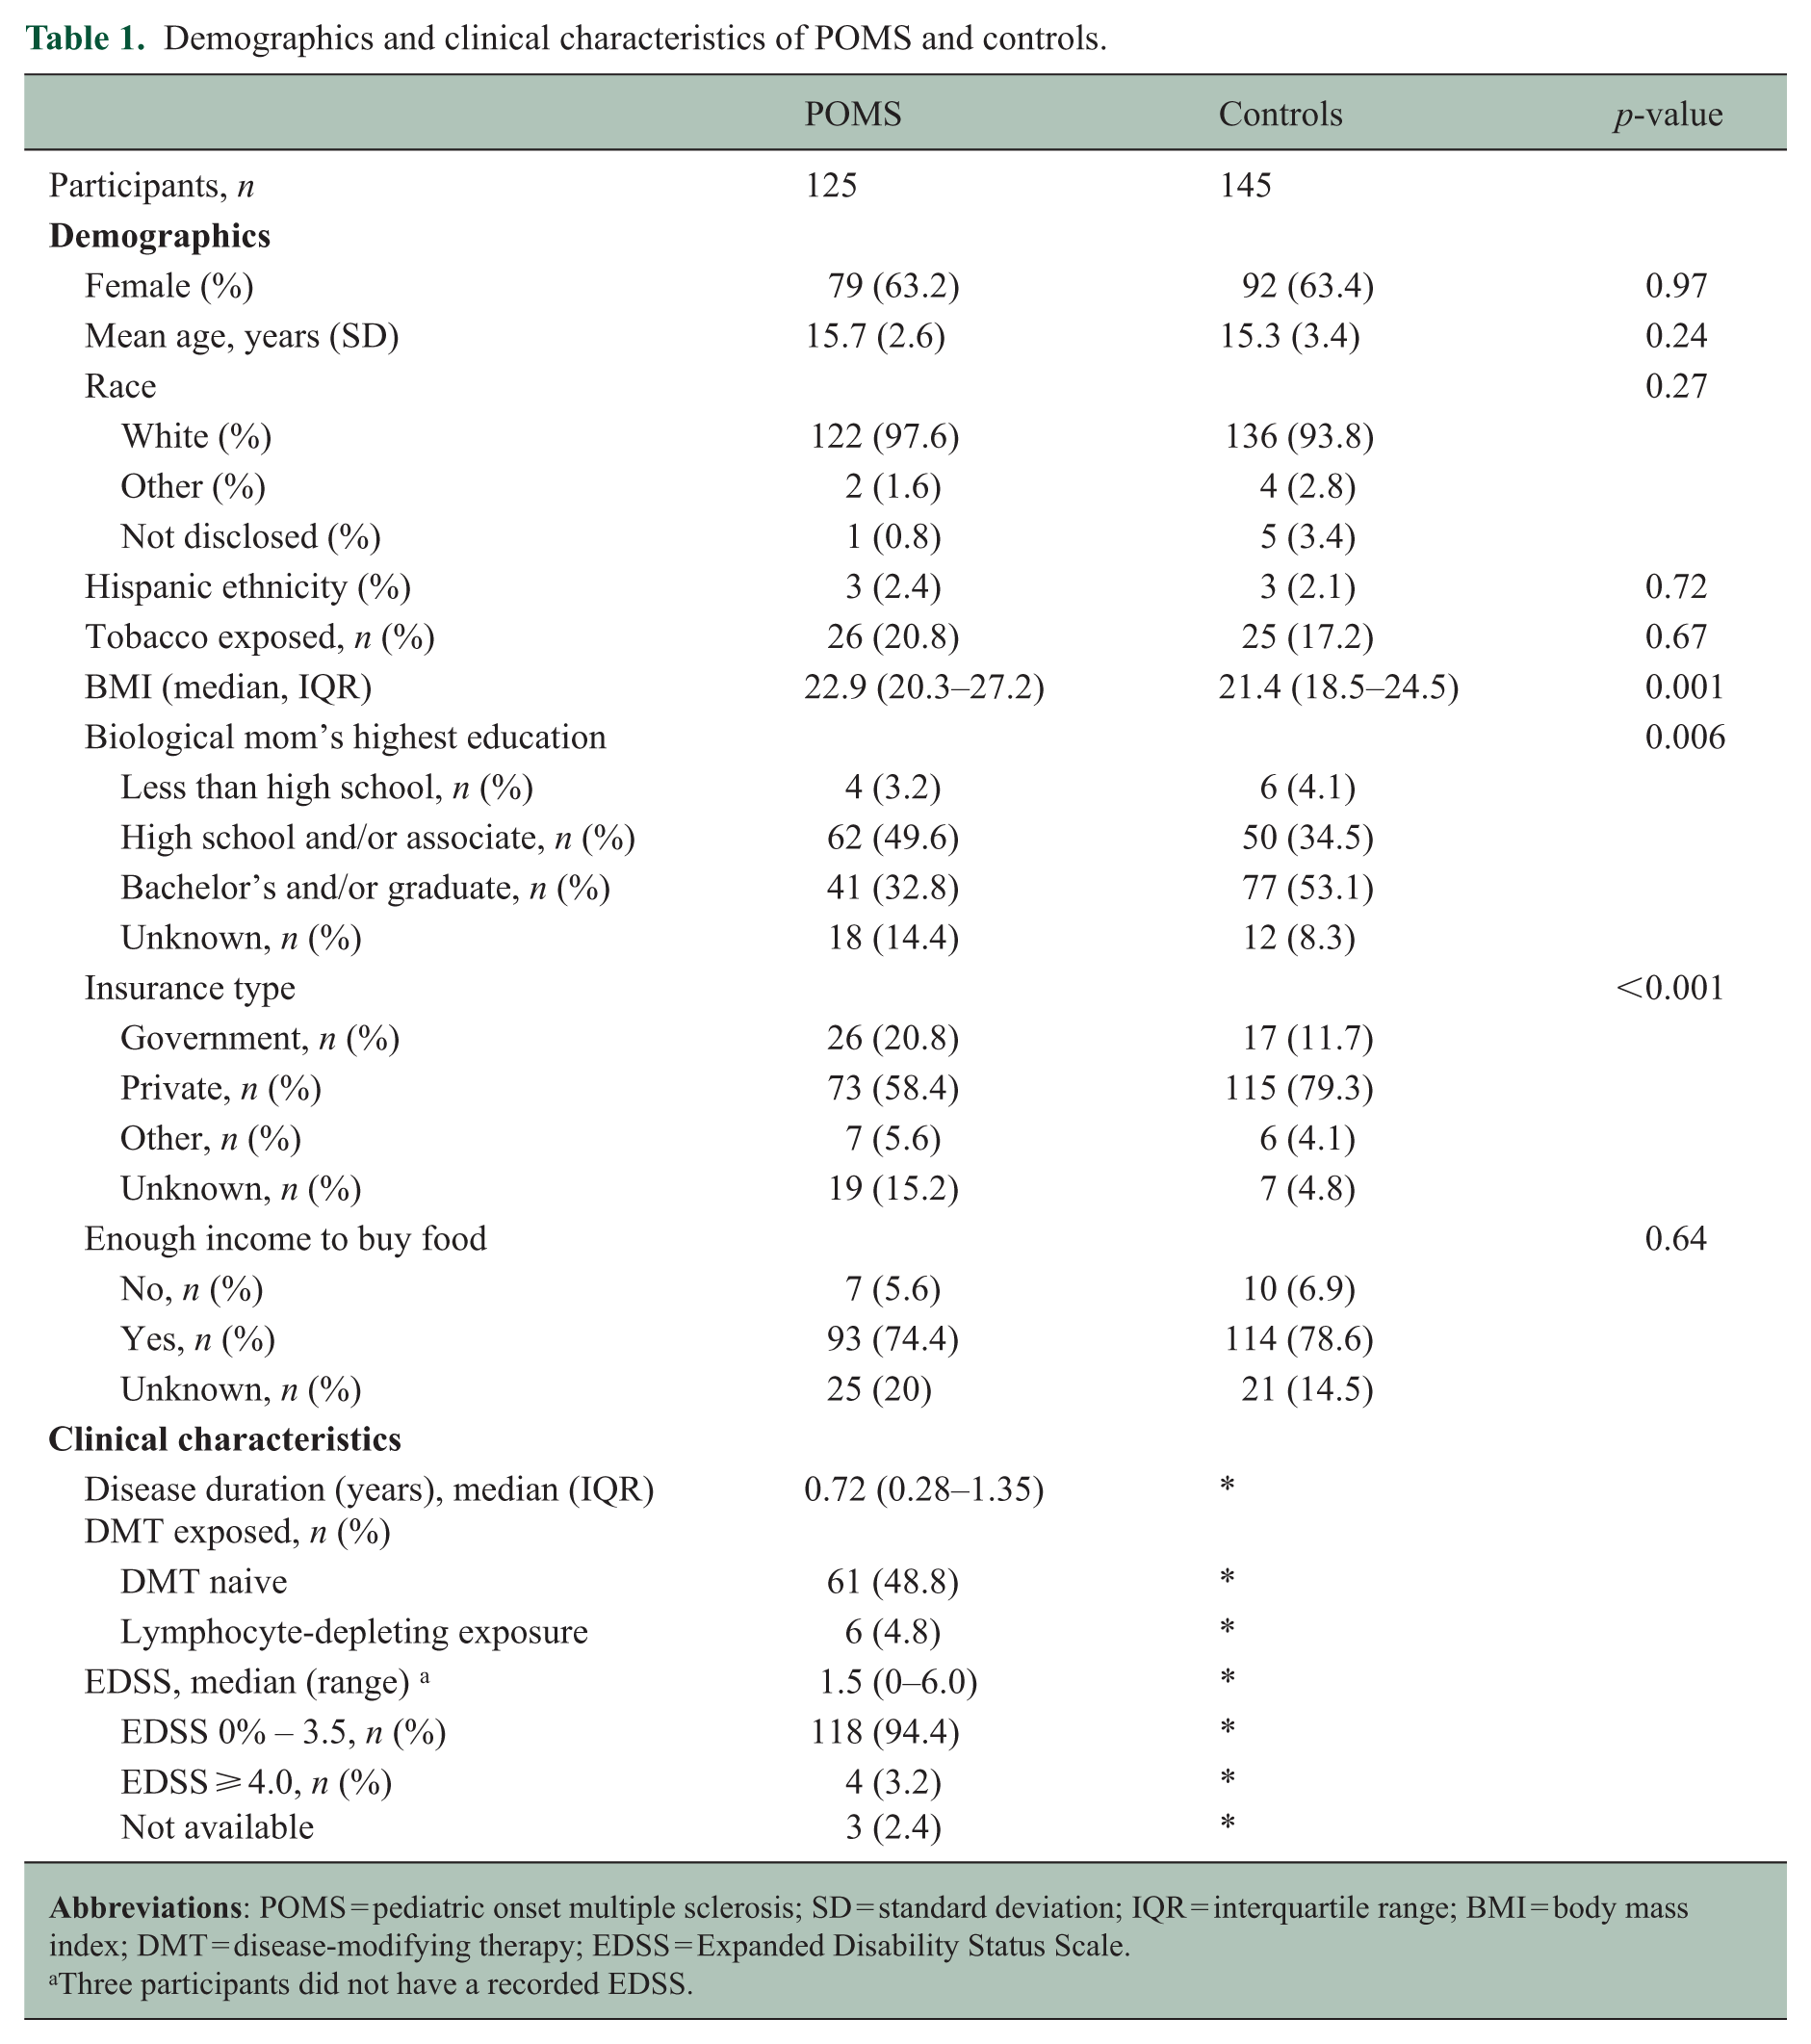
Three participants did not have a recorded EDSS.
Correlation between epigenetic clocks and TL
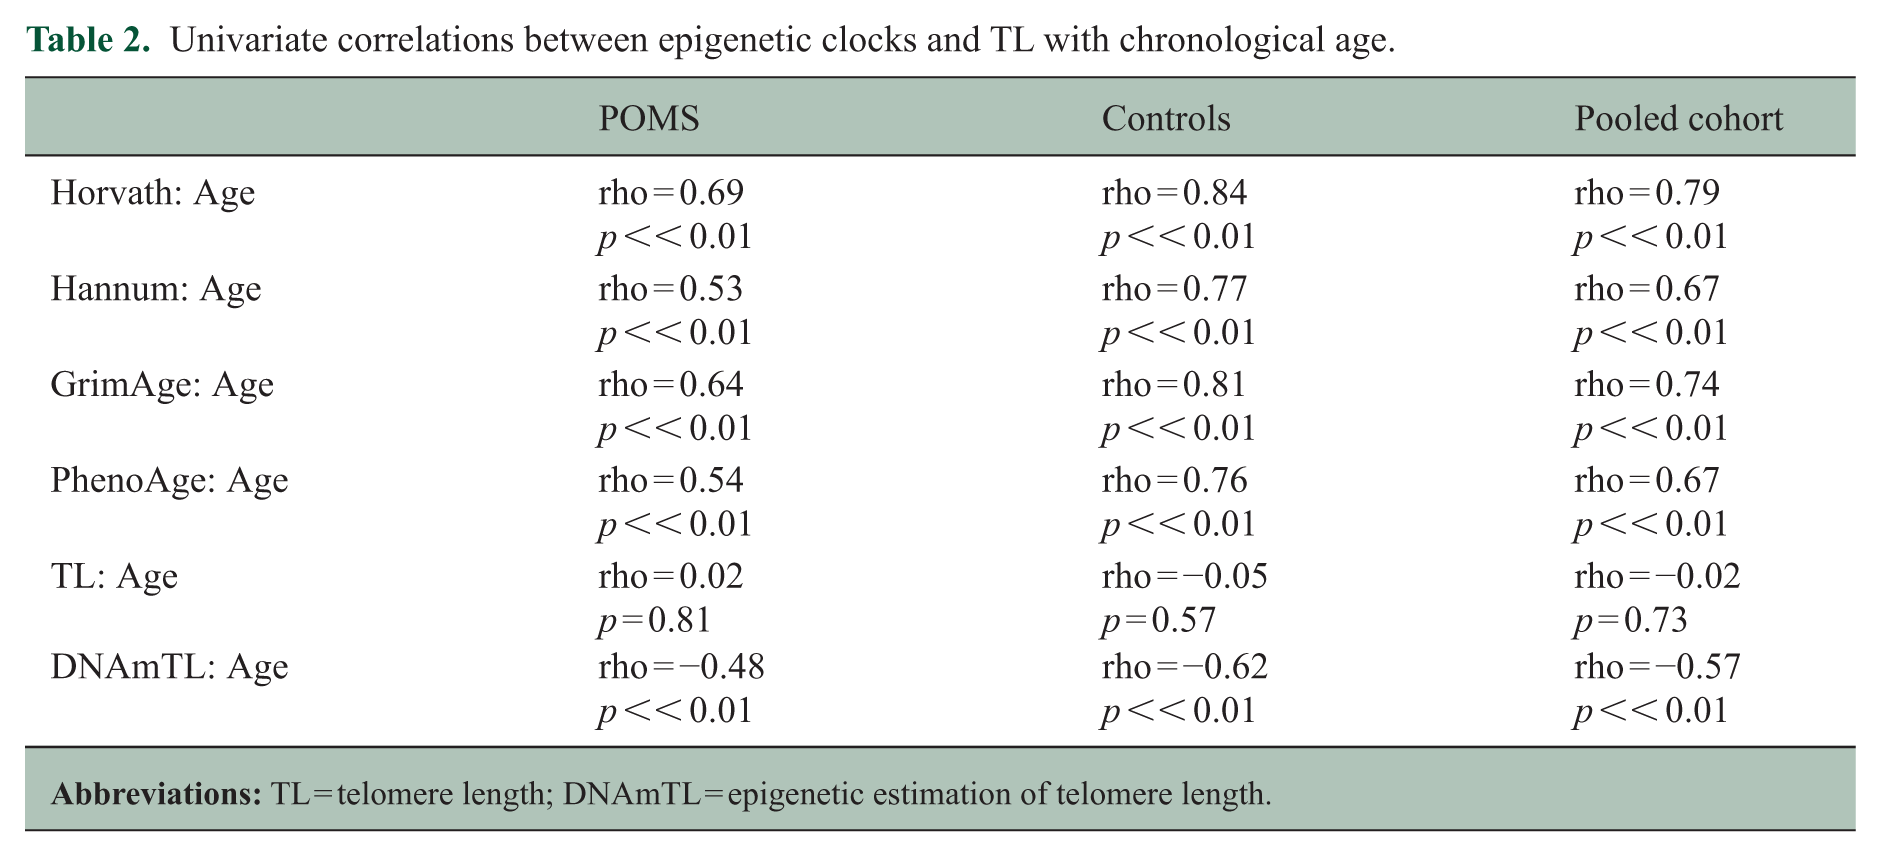
In univariate analyses (Table 2), chronological age was strongly correlated with each of the epigenetic clocks and DNAmTL: Horvath (rhos = 0.79, p << 0.01), Hannum (rhos = 0.67, p << 0.01), GrimAge (rhos = 0.74, p << 0.01), PhenoAge (rhos = 0.67, p << 0.01), DNAmTL (rhos = −0.57, p << 0.01). However, chronological age had no correlation with TL (rhos = −0.02, p = 0.73).
Univariate correlations between epigenetic clocks and TL with chronological age.
For the primary analysis using multivariable analysis of covariance models adjusting for chronological age, sex, race, ethnicity, tobacco exposure, socioeconomic status, BMI, and case control status, the four epigenetic clocks were correlated with each other at varying degrees (Figures 1(a) and 2(a)). With imputation, there were minimal changes to the observed correlations among the different epigenetic clocks (Figure 2(a)). We found no significant correlation between TL and any of the epigenetic clocks for the pooled POMS and control group in any of the tested models (Figures 1 and 2). In the non-imputed analysis for pooled data, there was no significant correlation between TL and the four epigenetic clocks, with the correlation coefficient ranging from r = 0.02 to 0.11 (Figure 1(a)). After imputing for missing covariates, the correlation between TL and the epigenetic clocks was still not significant, with the correlation coefficient ranging from r = 0.03 to 0.08 (Figure 2(a)).
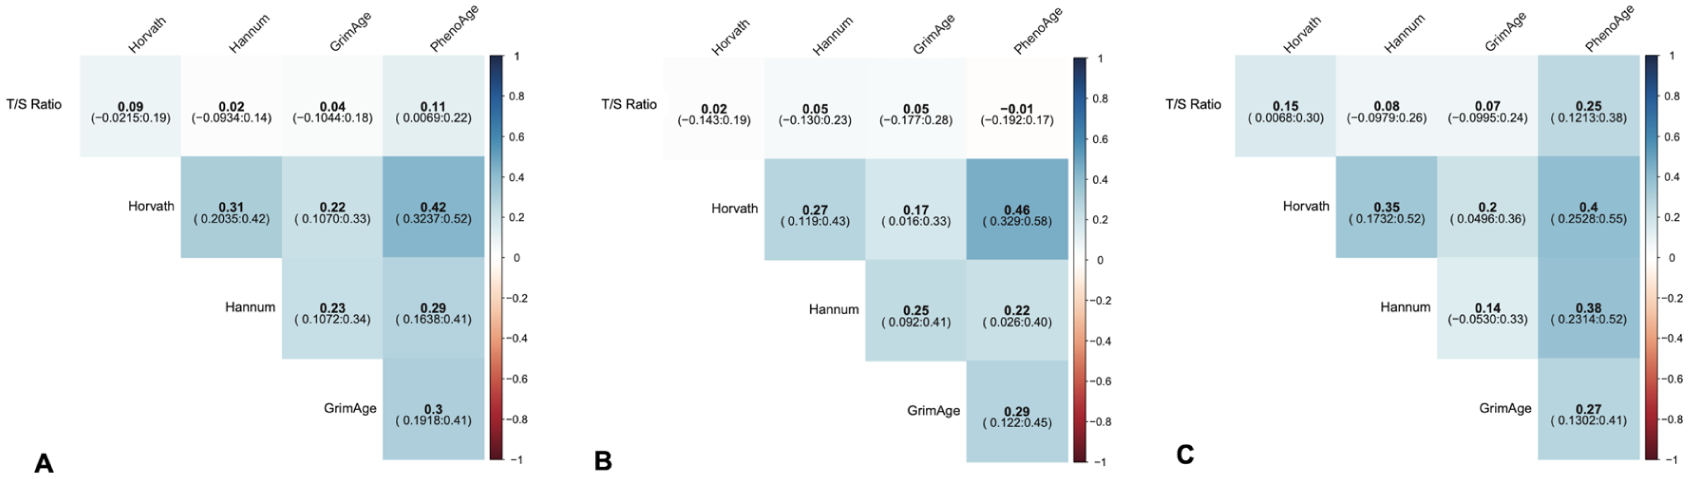
Non-imputed MANOVA correlations between epigenetic clocks and telomere length (TL) ratio for: (a) pooled group, (b) POMS group, and (c) control group.
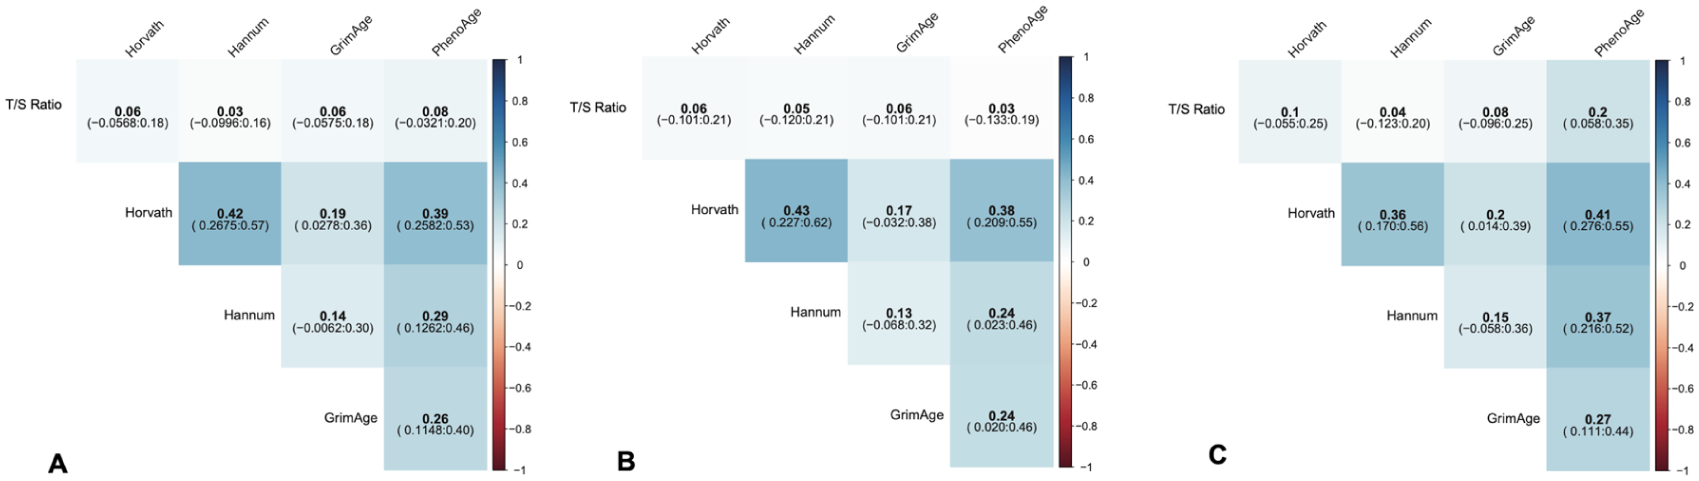
Imputed MANOVA correlations between epigenetic clocks and telomere length (TL) ratio for: (a) pooled cohort, (b) POMS group, and (c) control group.
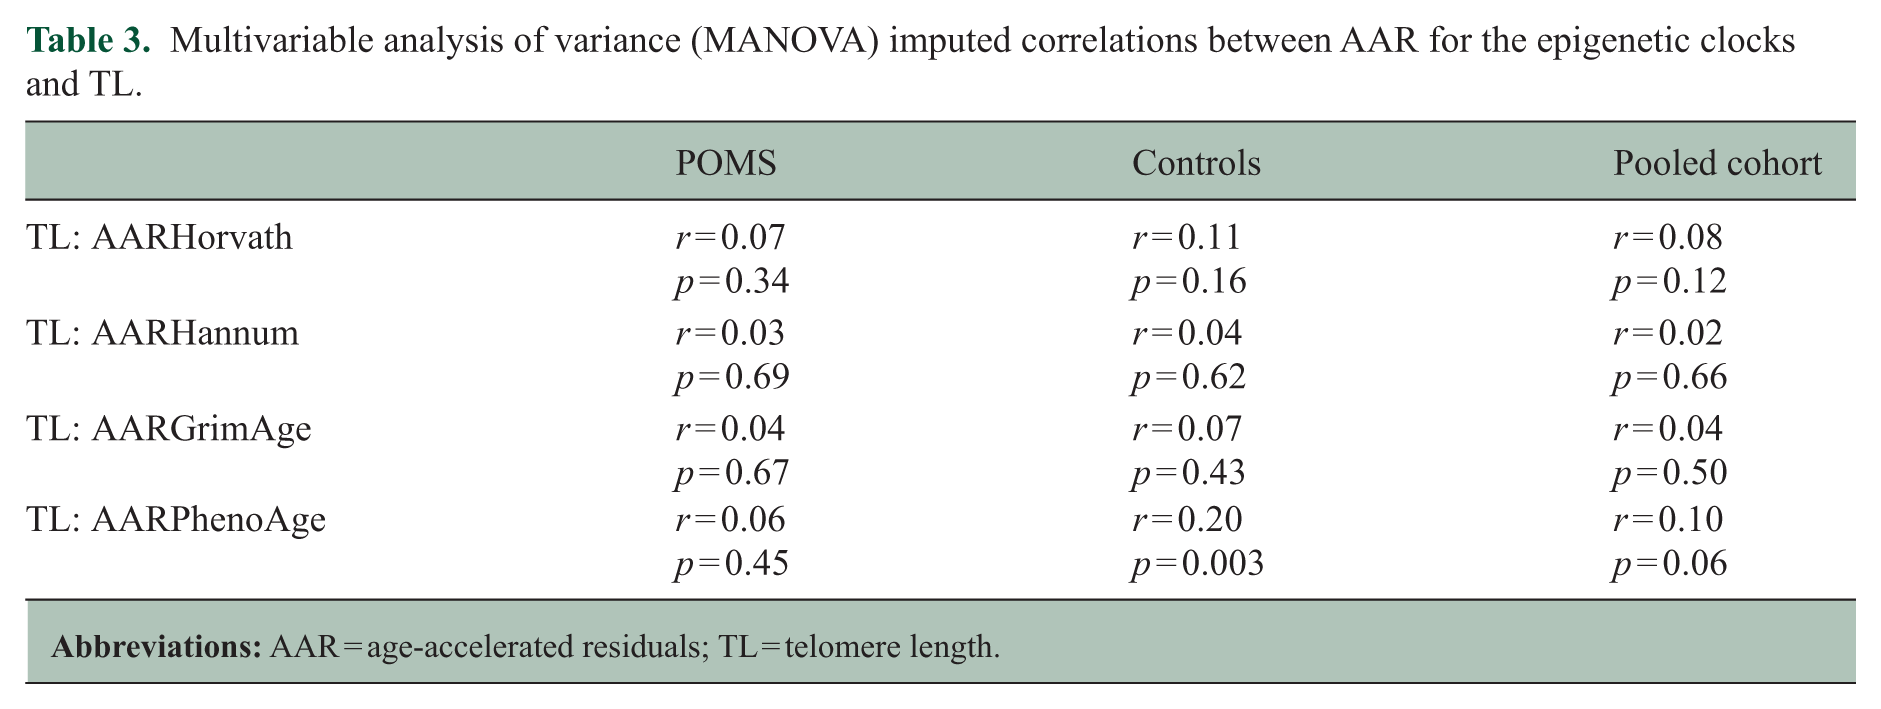
In the secondary analysis, we assessed the correlation between TL and the AAR for each epigenetic clock and did not find evidence for correlation in the pooled results (Table 3). As an exploratory analysis, we assessed the correlation between the epigenetic estimation of TL (DNAmTL) and directly assayed TL (T/S ratio) and the four epigenetic clocks (Figure 3). There was no correlation between DNAmTL and TL (r = −0.08, p = 0.05), but there was a moderate correlation between DNAmTL and the various epigenetic clocks, with the correlation coefficients ranging from r = −0.16 to −0.36 (all p-values < 0.05). It should be noted that the correlation estimates between TL and the DNAm age clocks are slightly different in this analysis because DNAmTL was included in the imputation model for this analysis, while it was not included in the primary analysis. However, in both the primary, secondary, and exploratory analyses, TL (T/S ratio) is only minimally correlated with the other biomarkers of interest.
Multivariable analysis of variance (MANOVA) imputed correlations between AAR for the epigenetic clocks and TL.
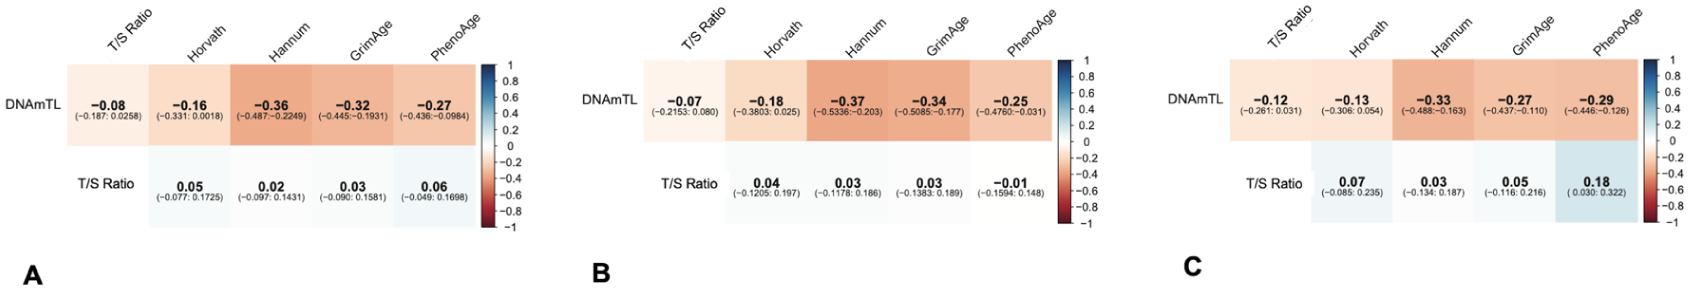
Imputed MANOVA correlations between epigenetic estimation for telomere length (DNAmTL), epigenetic clocks, and telomere length (TL) ratio for: (a) pooled cohort, (b) POMS group, and (c) control group.
Stratified analyses of correlation between epigenetic clocks and TL for POMS and control groups
In the primary stratified analysis, there was no significant correlation between epigenetic clocks and TL when analyzing POMS cases separately. In the POMS group, the correlation coefficient between TL and epigenetic clocks ranged from r = −0.01 to 0.05 for the non-imputed analysis (Figure 1(b)) and r = 0.03 to 0.06 after multiple imputation (Figure 2(b)). In the control group, we observed no significant correlations between TL and Hanum and GrimAge clocks. However, there was a modest correlation between TL and the Horvath and PhenoAge clocks. The non-imputed correlation between TL and Horvath was r = 0.15 (p = 0.04), and the correlation between TL and PhenoAge was r = 0.25 (p = 0.0002; Figure 1(c)). The imputed correlations were r = 0.1 (p = 0.2) for TL:Horvath and r = 0.2 (p = 0.06) for TL:PhenoAge (Figure 2(c)). There were moderate to strong correlations among the different epigenetic clocks in the stratified POMS and control groups in the non-imputed (Figure 1) and imputed analyses (Figure 2). On secondary analysis for correlations between TL and the DNAm age AARs, we did not find any correlation in the MS or control groups (Table 3). We also did not find substantial correlations between DNAmTL and TL or DNAmTL and the various DNAm age clocks in the MS or control groups (Figure 3(b) and (c)).
Discussion
While we found correlations among the four epigenetic clocks, we did not find overlapping information between epigenetic age estimates and directly measured TL, suggesting that these biomarkers are capturing different aspects of biological aging in MS. Similar results were observed in both univariate and multivariable analyses, adjusting for sex, race, ethnicity, health covariates, and socioeconomic status. There were modest correlations between TL and some epigenetic clock age estimates in the control group, but no correlation even in the control group between AAR and TL. There were no significant differences between the non-imputed and imputed analyses in the pooled or stratified analyses. Our results suggest that while the correlations between these biomarkers are overall weak, there may be some differences between the POMS and control groups.
Several studies in healthy adult populations have shown weak to no correlation between DNAm age and TL, despite each correlating with chronological age.30 –32 A cross-sectional study using a large sample of peripheral blood mononuclear cells from healthy adult donors found that while the epigenetic clocks strongly correlated with chronological age, there were only modest correlations between healthspan clocks and TL. 31 This aligns with our results showing modest correlation between healthspan clocks and TL in the control group only. The Berlin Aging Study also found a strong correlation between DNAm and chronological age, but showed a weak negative association (β = −0.002, p = 0.01) between DNAm and TL after adjusting for age, sex, alcohol, and smoking. 32 In a longitudinal study of elderly adults from two Scottish birth cohorts, the Hannum DNAm and TL were both associated with chronological age in similar magnitudes, but there was no association between Hannum DNAm and TL. 30 The study also suggested that DNAm and TL may be measuring different aging processes since one standard deviation increase in epigenetic age had a 22% increase in mortality risk, independent of TL. 30
Chronological age is an important consideration when interpreting aging biomarkers, and observations from adult populations may not fully translate to the pediatric population. Our data expectedly show strong correlations between DNAm and DNAmTL with chronological age, whereas TL had a weak correlation with chronological age. The former observation is expected, given that the computational algorithms to derive DNAm and DNAmTL by the various epigenetic clocks use chronological age to make these biological age estimates.11,31 In contrast, TL is a direct assay without computational modeling or use of a participant’s chronological age in deriving the measurement. In the pediatric population, substantial TL attrition has been reported between the time of birth and four years of age, with less change occurring in non-diseased individuals between 4 and 23 years old. 7 In a meta-analysis of TL and chronological age pooling data from studies in healthy individuals and those with specific chronic diseases, the authors found that although telomere shortening is associated with chronological age across the human lifespan, TL shortens with aging in a non-linear fashion. 33 Independent of sex and health status, telomere attrition rate was more rapid around age 18 years and gradually slows until it stabilizes at age 50. 33 In a large population study from Kaiser Permanente with undifferentiated healthy and diseased individuals, TL had an expected negative correlation with chronological age until 75 years of age. 34 After 75 years, longer telomeres are associated with older age, potentially due to longer survival. 34 These findings suggest that while birthdate age is inversely related to TL, a substantial proportion of TL variability is influenced by other genetic, environmental, and health-related changes.
Identifying biomarkers to measure aging in MS is instrumental in developing targeted treatments against the deleterious effects of biological aging and measuring treatment response. However, curating peripheral biomarkers to capture the aging process across the lifespan can be challenging, and not all classical aging markers may be reliable as routine clinical measures. For example, while the cellular senescence marker p16INK4a showed promise in mouse models in specific cell subtypes, its measurement from human peripheral blood mononuclear cells as a biological age marker has proven to be more difficult. While it was found to be associated with other aging-related diseases such as Alzheimer’s disease, type 2 diabetes, heart disease, and chronic kidney disease, the peripheral expression of p16INK4a was not clearly associated with chronological age or disease progression in a modest sample of adult MS participants. 35 Aging biomarkers need not only capture associations with disease state in humans but also be measurable in a reliable tissue source. Evaluating the impact of DMTs on aging marker measurements is also important given the current era of early treatment with lymphocyte-depleting therapies in pediatric- and adult-onset MS.
DNAm and TL as complementary peripheral aging markers may be powerful tools in evaluating the impact on biological aging from various biological, environmental, and socioeconomic influences in patients living with MS. Prior epidemiological studies on risk factors for MS already demonstrate a complex relationship between disease manifestations and influences from environmental, gene–environment, and gene–gene interactions.2,36 –38 Outside the context of MS, a longitudinal study evaluating TL at birth, 4 years, and 23 years showed that TL at birth was the strongest predictor of later-life TL. 7 Interestingly, participants from mothers with longer TL demonstrated slower telomere attrition later in life. 7 While the sample size is modest, it is interesting that TL may be influenced by gene-environmental effects prior to birth. In a study from the same POMS parent cohort as this study from the US Network of Pediatric MS Centers, perinatal and later childhood exposures to household toxins and insecticides were associated with increased risk for POMS with interactive effects from specific genetic polymorphisms.36,39 These early toxic exposures may act through a deleterious impact on biological aging. Environmental exposures and associated socioeconomic factors have been reported to be associated with DNAm age in non-MS populations. In a cross-sectional study of two longitudinal diverse cohorts from large metropolitan areas in the United States, DNAm was associated with measures of traffic-related air pollution and variables associated with structural racism (born in Jim Crow state and economic residential segregation). 40 The impact of racial and structural disparities on autoimmune disease outcomes, including MS, is well described. 41 Evaluating TL and DNAm through the lens of social determinants of health is an important consideration for future studies on the role of biological aging in MS.
This work highlights a few key concepts. First, although both DNAm and TL show accelerated aging in POMS participants,9,15 the observed lack of significant correlations between DNAm and TL implies that biological aging is a complex process that may not be fully captured by a singular biomarker. Second, while the POMS samples exhibited no correlations between DNAm and TL, there were modest correlations between TL and some epigenetic clock age estimates in the control group, suggesting that MS as a disease state may impact these correlations. Finally, unlike the published validation data for DNAmTL as an epigenetic estimate for TL, there was minimal correlation between the DNAmTL and directly measured T/S ratios in our study. It is important to note that DNAmTL was trained on adult population datasets using 140 CpG sites from measured leukocyte TLs and validated in other predominantly adult and elderly population datasets. 21 Thus, its generalizability in the pediatric population requires more rigorous study.
Limitations of this study include the lack of ancestral diversity in the participant sample, which reduces the generalizability of the results. In this study, we used existing DNA methylation data from POMS patients that, in a parent study, were limited to white ancestry to reduce confounding from population substructure. In future work, we aim to evaluate aging markers in a more diverse sample to investigate the effects of genetic ancestry and the social constructs of race and ethnicity. Both DNAm and TL were measured from DNA extracted from whole blood. It is possible that correlations may differ among aging markings when extracted from specific cell types. The cross-sectional design limits the causal inference for the observed lack of correlation between these biomarkers. Nevertheless, the results are still informative for future prospective work in aging biomarkers and offer a cautionary tale to not use these biomarkers interchangeably.
Strengths of this work include leveraging a well-characterized sample of participants with POMS with short disease duration, and a study design examining the correlation of these aging biomarkers in cases and controls in both pooled and stratified analyses. This is a relatively large cohort of POMS participants, given its rarity compared to adult-onset MS. Our models were adjusted for potential key confounders, including BMI, tobacco exposure, and socioeconomic factors that were captured in the parent study. The inherent nature of studying the pediatric population removes additional confounders of accumulated normal aging effects and allows better ascertainment of MS-related changes. There were minimal comorbidities in the study participants, making this an attractive population to study disease-specific biological aging effects. For POMS specifically, over half of the participants were treatment-naïve, and only a small percentage were exposed to high-efficacy DMTs, consistent with the treatment landscape during the period of study recruitment. The small proportion of POMS participants on lymphocyte-depleting treatment minimized potential confounding or mediating effects of depleting aged cells.
Overall, our results suggest that DNAm and TL are capturing complementary, non-overlapping aging processes, and multiple markers of biological aging may be required to model the complexities of aging in MS. Future studies evaluating biomarkers of aging in pediatric- and adult-onset MS should include a diverse patient population that represents variations in genetic architecture among different ethnic and racial groups, longitudinal design to follow clinical phenotypes over time, and more granular measurements of environmental, social, and structural disparities that directly and indirectly influence these biomarkers.
Footnotes
Acknowledgements
Samples were collected by the US Network of Pediatric MS Centers. We appreciate the contributions of the participants and their families.
Data availability
Anonymized data may be made available by request from a qualified investigator.
Declaration of Conflicting Interests
The authors declared no potential conflicts of interest with respect to the research, authorship, and/or publication of this article.
Funding
The authors disclosed receipt of the following financial support for the research, authorship, and/or publication of this article: Grant funding was provided by the National MS Society (RG-2207-39976, RG-1611-26299) and the National Institute of Health (5K12NS098482, R01NS071463).
Ethical Considerations
This study was approved by the Institutional Review Board for Environmental and Genetic Risk Factors for Pediatric MS study from the US Network of Pediatric MS Centers (R01NS071463, PI Waubant).
Consent to Participate
Participants were consented under the Environmental and Genetic Risk Factors for Pediatric MS study from the US Network of Pediatric MS Centers.
Consent for Publication
Not applicable.