
Abstract
Background:
Financial toxicity (FT) and the social determinants of health (SDOH) remain underexplored in neuromyelitis optica spectrum disorder (NMOSD).
Objective:
To characterize FT in NMOSD and examine sociodemographic and clinical features.
Methods:
We conducted a convenience-sampled, cross-sectional, anonymous survey (08/2024–03/2025) of 124 U.S. adults. The COmprehensive Score for financial Toxicity (COST) was used to measure FT (lower COST = higher FT).
Results:
Seventy-five percent had a COST < 25 points, consistent with FT. In multivariable analysis, a higher attack frequency was associated with a 1.20-point lower COST score (95% confidence interval [CI] –1.90, –0.50), and each one-unit increase in disability, as measured by the Patient-Determined Disease Steps, was associated with a 0.80-point lower COST (95% CI –1.40, –0.20). Non-White race was associated with a 3.50-point lower COST (95% CI –5.80, –1.20), and double-seronegative antibody status with a 2.80-point lower COST (95% CI –5.00, –0.60). Mediation analysis suggested the effects of disability and race on FT are partially attributable to income.
In exploratory models with attack count as the outcome, each one-point higher COST (lower FT) was associated with a 0.043-attack decrease (95% CI –0.081, –0.005).
Conclusions:
Financial toxicity is highly prevalent in NMOSD and associated with key clinical and sociodemographic features. There is a need for comprehensive NMOSD care models that address financial strain.
Keywords
Introduction
Neuromyelitis optica spectrum disorder (NMOSD) is a rare, autoimmune disease of the central nervous system characterized by recurrent inflammation of the optic nerves and spinal cord, often leading to blindness or paralysis.1,2 Approximately 1 in every 118,000 people in the United States lives with NMOSD, totaling ~22,000 Americans as of 2022, with a disproportionate disease burden among women and individuals identifying as Black or Asian.3–5
Although the clinical features and immunopathology of NMOSD are increasingly better defined, the broader social and financial contexts in which patients experience and manage the disease remain underexplored. 6 Social determinants of health (SDOH)—the conditions in which people are born, live, work, and seek care—are widely recognized as significant contributors to health outcomes across multiple chronic illnesses.7–11 According to the U.S. Department of Health and Human Services’ Healthy People 2030 initiative, SDOH encompass five domains: economic stability, education access and quality, healthcare access and quality, neighborhood and built environment, and social and community context. 12 Although well established, these structural drivers have not been examined in depth in NMOSD.6,13–15
One of the most tangible and patient-centered manifestations of these structural drivers is financial toxicity (FT). Defined as the personal financial strain and psychological burden associated with the cost of medical care, FT is well recognized in people with cancer, with studies finding FT can reduce medication adherence, delay clinical care, and erode quality of life.16–19 FT is commonly assessed using validated patient-reported outcomes, including the COmprehensive Score for financial Toxicity (COST), which captures both the material hardship (e.g. debt, out-of-pocket costs) and emotional distress (e.g. anxiety, cost-related worry) associated with managing chronic illness.20–22 While FT is now being examined in other chronic illnesses, including MS,23,24–26 it has not been thoroughly explored in NMOSD.
Literature does suggest that NMOSD generally carries a substantial economic burden—patients incur far higher hospitalization, emergency department, and prescription costs than matched controls, and relapses further drive utilization and expense. 27 In adults, significant employment loss and slowed income growth are documented. 28 Place-based disadvantage may exacerbate these vulnerabilities. In pediatric NMOSD, public insurance and neighborhood deprivation predict greater disability and relapse rates, 5 while adult studies using the Area Deprivation Index (ADI) show varying degrees of clinical impact.29–32 Studies have not yet applied the Centers for Disease Control and Prevention and Agency for Toxic Substances and Disease Registry (CDC/ATSDR) Social Vulnerability Index (SVI), a ZIP code–level, relative vulnerability ranking, comprised of 16 census variables across socioeconomic, household, minority/language, and housing/transportation themes.33,34
Given evidence that both individual-level financial strain and neighborhood disadvantage affect chronic disease outcomes, we conducted a national survey of U.S. adults with NMOSD to characterize the prevalence and demographic associations of FT and to explore whether FT, the SVI, and the ADI are associated with clinical burden (attack frequency and disability).
Materials and methods
Supplemental FT-related questions were adapted from prior work on cost-related nonadherence, debt, coping strategies, and subjective distress.15,21 The survey was piloted by the authors with a focus group of adults with NMOSD from diverse socioeconomic and geographic backgrounds. Participants reviewed a survey draft and provided feedback on clarity, relevance, and question burden. Revisions were incorporated following thematic analysis. Our full survey instrument included 91 items across demographic and clinical characteristics, healthcare access, SDOH, and financial hardship (Supplemental eAppendix 1: Survey Instrument).
The COST Score is obtained using an 11-question instrument that uses a 5-point Likert-type scale (0–4 points), with negatively worded items reverse-scored and responses summed to yield a total score (range: 0–44 points). 20 Lower scores reflect greater financial strain. Based on validated cutoffs, COST scores were categorized as follows: severe FT (⩽ 13 points), moderate FT (14–19 points), mild FT (20–24 points), and low/no FT (⩾ 25 points). 21 Patient mobility and disability were evaluated using the Patient-Determined Disease Steps (PDDS) scale, a validated nine-point self-report measure (0 = no disability to 8 = bed bound) that correlates strongly with the neurologist-administered Expanded Disability Status Scale (EDSS). 36 Household income was analyzed relative to 2025 U.S. Federal Poverty Line thresholds. 37
We assessed neighborhood-level disadvantage using two publicly available, ZIP code–linked indices. The ADI, developed by the U.S. Health Resources & Services Administration and refined by the Census Block Group at the University of Wisconsin, is a composite census block–group measure of socioeconomic disadvantage, incorporating 17 indicators—income, education, employment, housing quality, and more—and provides a national ranking from 1 (least deprived) to 100 (most deprived).29,30 The CDC/ATSDR SVI evaluates community resilience to external stresses by aggregating 16 census variables across four themes: (1) socioeconomic status; (2) household composition & disability; (3) minority status & English proficiency; and (4) housing type & transportation, yielding percentile scores from 0 (least vulnerable) to 1 (most vulnerable). 33 For both indices, participants in areas ⩾75th national percentile were classified as living in high deprivation or high vulnerability, in alignment with national benchmarks. 34
Following descriptive analyses, we fit sequential linear regression models in three steps to examine factors associated with COST score. First, we ran univariate regressions for candidate factors (age, gender, race, PDDS score, attack count, AQP4 + status, spinal-cord dysfunction, blindness, treatment count, etc.) and retained those with p < 0.20 for inclusion in the stepwise construction of multivariable models. Second, we screened the retained variables for collinearity (variance inflation factor > 5 exclusionary) and incremental fit (ΔAIC > 2). We then constructed a multivariable model using these screened factors. Finally, we conducted a 3-step mediation analysis to test whether household income buffered the relationship between key predictors and COST score. For each predictor, we: 1) regressed income on the predictor to see if the predictor was associated with income, 2) regressed COST on both the predictor and income to see if income had an effect on COST while controlling for the predictor, 3) calculated the indirect effect by multiplying the effect of the predictor on income by the effect of income on COST. This allowed for estimating how much of a predictor’s effect on COST may be attributable to its association with income.
All models were complete-case analyses without imputation (n = 124 for clinical/demographic models; n = 112 when income was included), and missing data were minimal.
We also evaluated socioeconomic associations with NMOSD disease burden using multivariable regressions with (1) number of NMOSD disease attacks, and (2) PDDS as two separate dependent variables in two separate multivariable models. Explanatory variables in these models included COST, ADI, SVI, and demographic covariates. To characterize whether clinical severity differed significantly across demographic characteristics, we used independent-samples t-tests. All statistical analyses were conducted using R Studio (v2022.07.1) with a preset level of significance of α = 0.05.
Results
A total of 124 participants were included in the final analysis, representing 42 U.S. states and the District of Columbia (Supplemental eAppendix 3). A flow diagram outlining participant enrollment is provided in Supplemental eAppendix 2.
The final analyzed sample included 87 female, 36 male, and 1 gender-fluid participant; 63% identified as White, 22% as Black or African American, 3% as Asian, and 12% as another race (Table 1). Seventy-nine percent were AQP4 + and 21% were double seronegative. The average age at NMOSD diagnosis was 37.1 years, and the average disease duration was 4.5 years. Patients reported an average two-year delay from first attack to NMOSD diagnosis. The mean number of reported attacks since diagnosis was 2.0 (standard deviation (SD: 1.5)). Visual loss was reported as monocular in 38% and binocular in 25% of participants. Seventy-three percent experienced spinal-cord dysfunction, and 31% required unilateral or bilateral walking assistance.
Participant demographics and clinical characteristics.
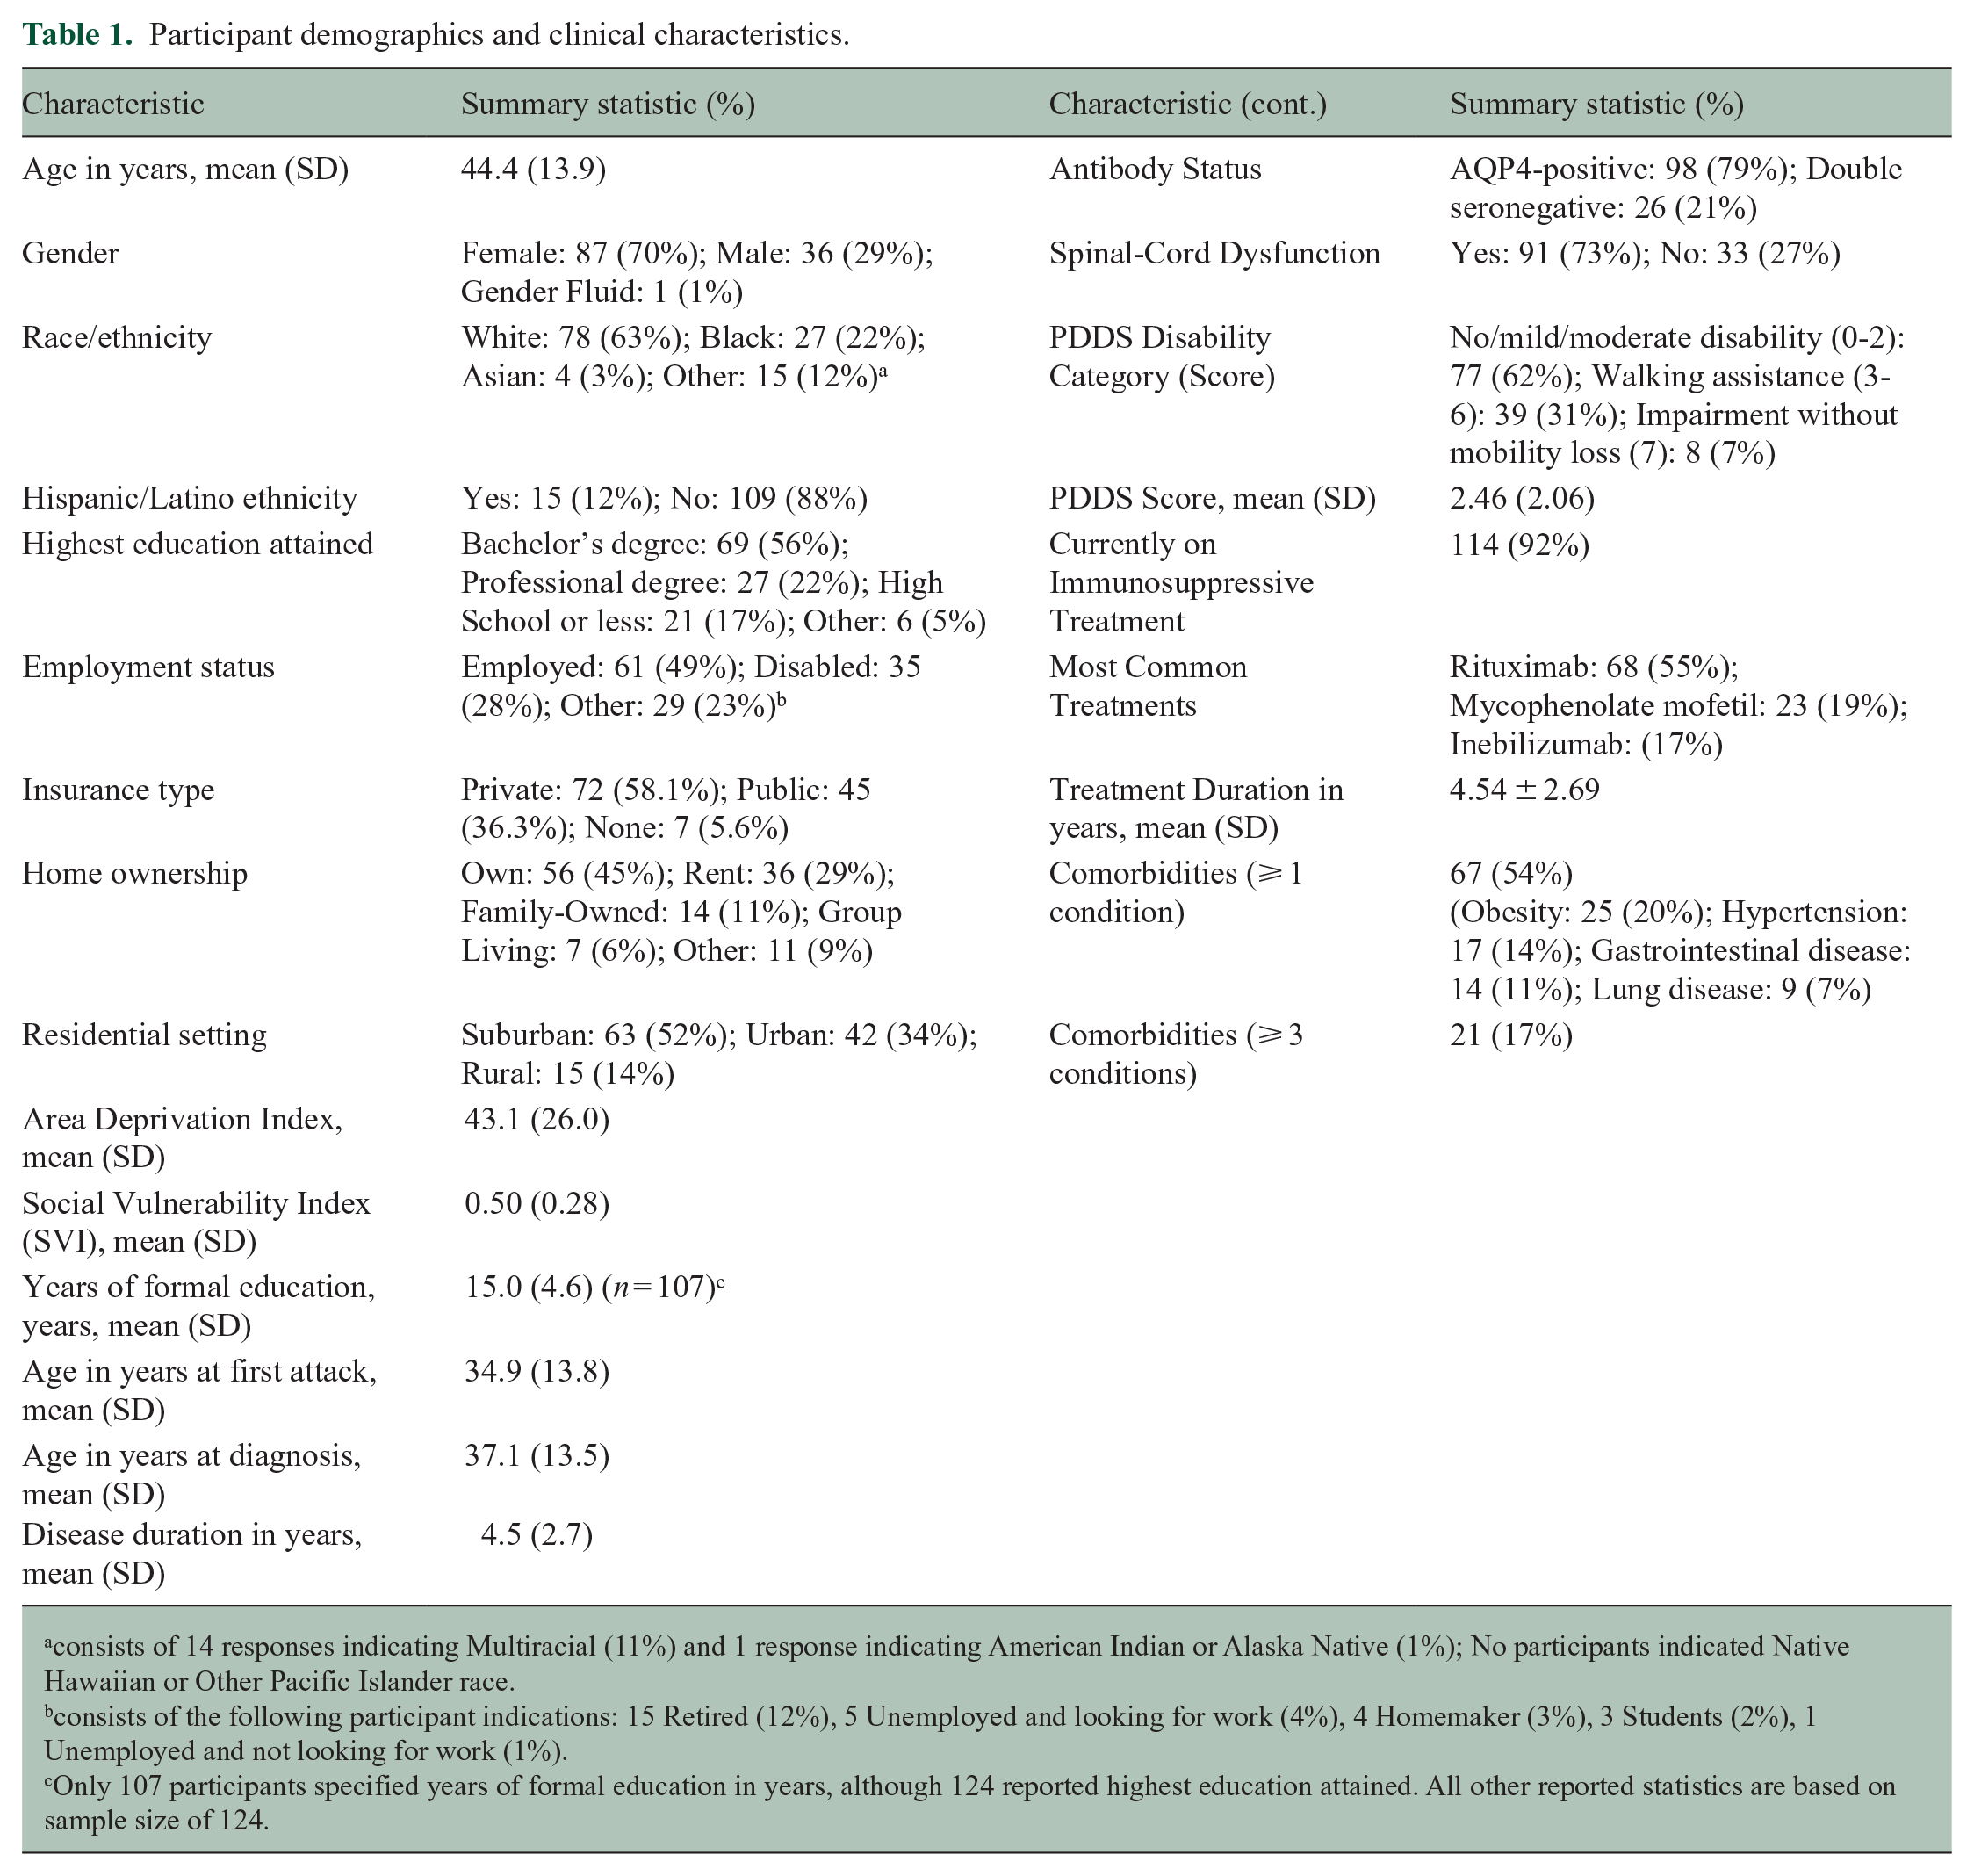
consists of 14 responses indicating Multiracial (11%) and 1 response indicating American Indian or Alaska Native (1%); No participants indicated Native Hawaiian or Other Pacific Islander race.
consists of the following participant indications: 15 Retired (12%), 5 Unemployed and looking for work (4%), 4 Homemaker (3%), 3 Students (2%), 1 Unemployed and not looking for work (1%).
Only 107 participants specified years of formal education in years, although 124 reported highest education attained. All other reported statistics are based on sample size of 124.
Educational attainment was high, with a mean of 15 years of formal schooling and 77% attaining a Bachelor’s degree or higher. Forty-nine percent were employed at the time of the survey. 52%, 34%, and 14% of participants resided in suburban, urban, and rural settings, respectively. Median PDDS score was 2 (25th percentile: 1, 75th percentile: 4). Participants reported 174 NMOSD specific treatments (i.e. more than one therapy occurred in 21%), with the most highly prevalent DMTs being rituximab (68%), mycophenolate mofetil (23%), inebilizumab (21%), and the rest detailed in Supplemental eAppendix 4.
Annual household income was reported by 112 participants: 17% of those participants reported incomes < 150% of the 2025 U.S. Federal Poverty Line (Table 2). 37 The median household income was 65,000 USD (IQR: 25th percentile: $42,000, 75th percentile: $92,750), with a median household size of 2 people (IQR: 25th percentile: 2, 75th percentile: 3). On average, participants spent 13% of their household income on NMOSD-related costs. A quarter (25%) reported taking loans or refinancing their homes to cover NMOSD treatment expenses. Seventy-two percent reported anxiety related to treatment costs, 54% reported cost-related depression, and 52% reduced spending on necessities. Thirty-six percent (n = 45) skipped a dose of medication or did not fill a prescription, 72% of whom cited cost as the reason (Table 2).
Supplemental socioeconomic indicators and healthcare access metrics.
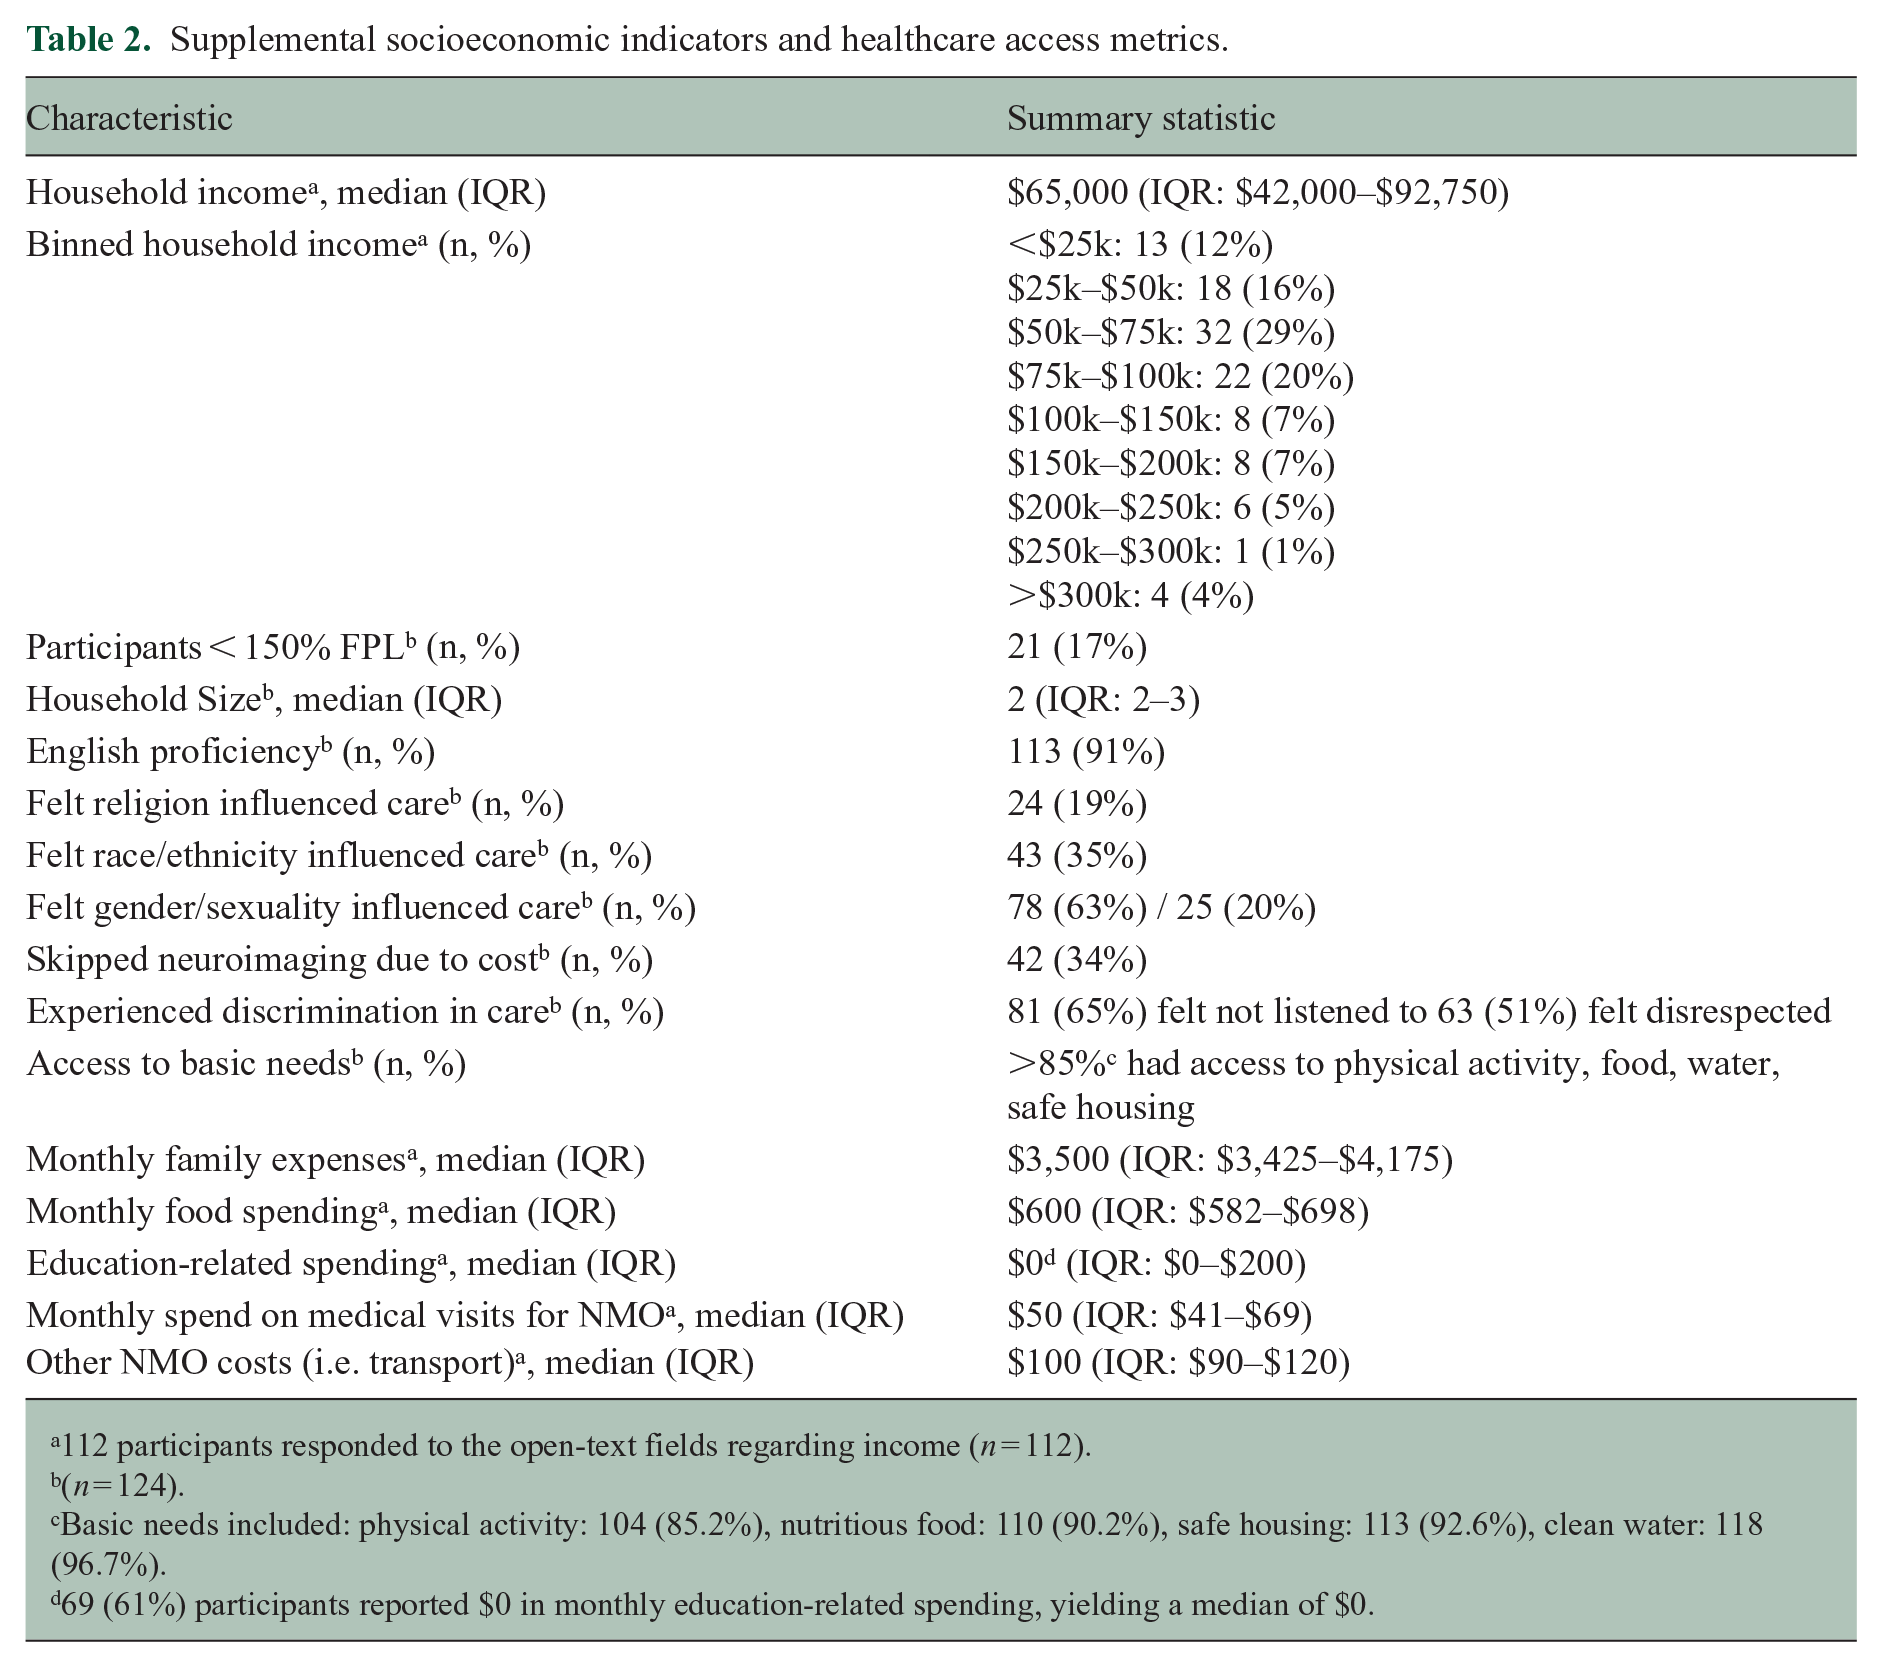
112 participants responded to the open-text fields regarding income (n = 112).
(n = 124).
Basic needs included: physical activity: 104 (85.2%), nutritious food: 110 (90.2%), safe housing: 113 (92.6%), clean water: 118 (96.7%).
69 (61%) participants reported $0 in monthly education-related spending, yielding a median of $0.
The COST score ranged from 1 to 43, with a median of 19 points (25th percentile: 14, 75th percentile: 27). Based on validated thresholds, 25% experienced severe FT (COST ⩽ 13), 28% moderate FT (14–19), 22% mild FT (20–24), and 25% low or no FT (⩾25) (Table 2).
ZIP-code–linked area-level data revealed that the average ADI national rank was 43.1 (SD: 26.0), and the mean SVI score was 0.50 (SD: 0.28) (Table 3). Based on CDC thresholds, 16% of participants lived in high-SVI ZIP codes (SVI ⩾ 0.75), and 23% resided in neighborhoods ranked in the top quartile for ADI (⩾ 75th percentile). 34
Financial toxicity, cost-related coping, and income indicators.
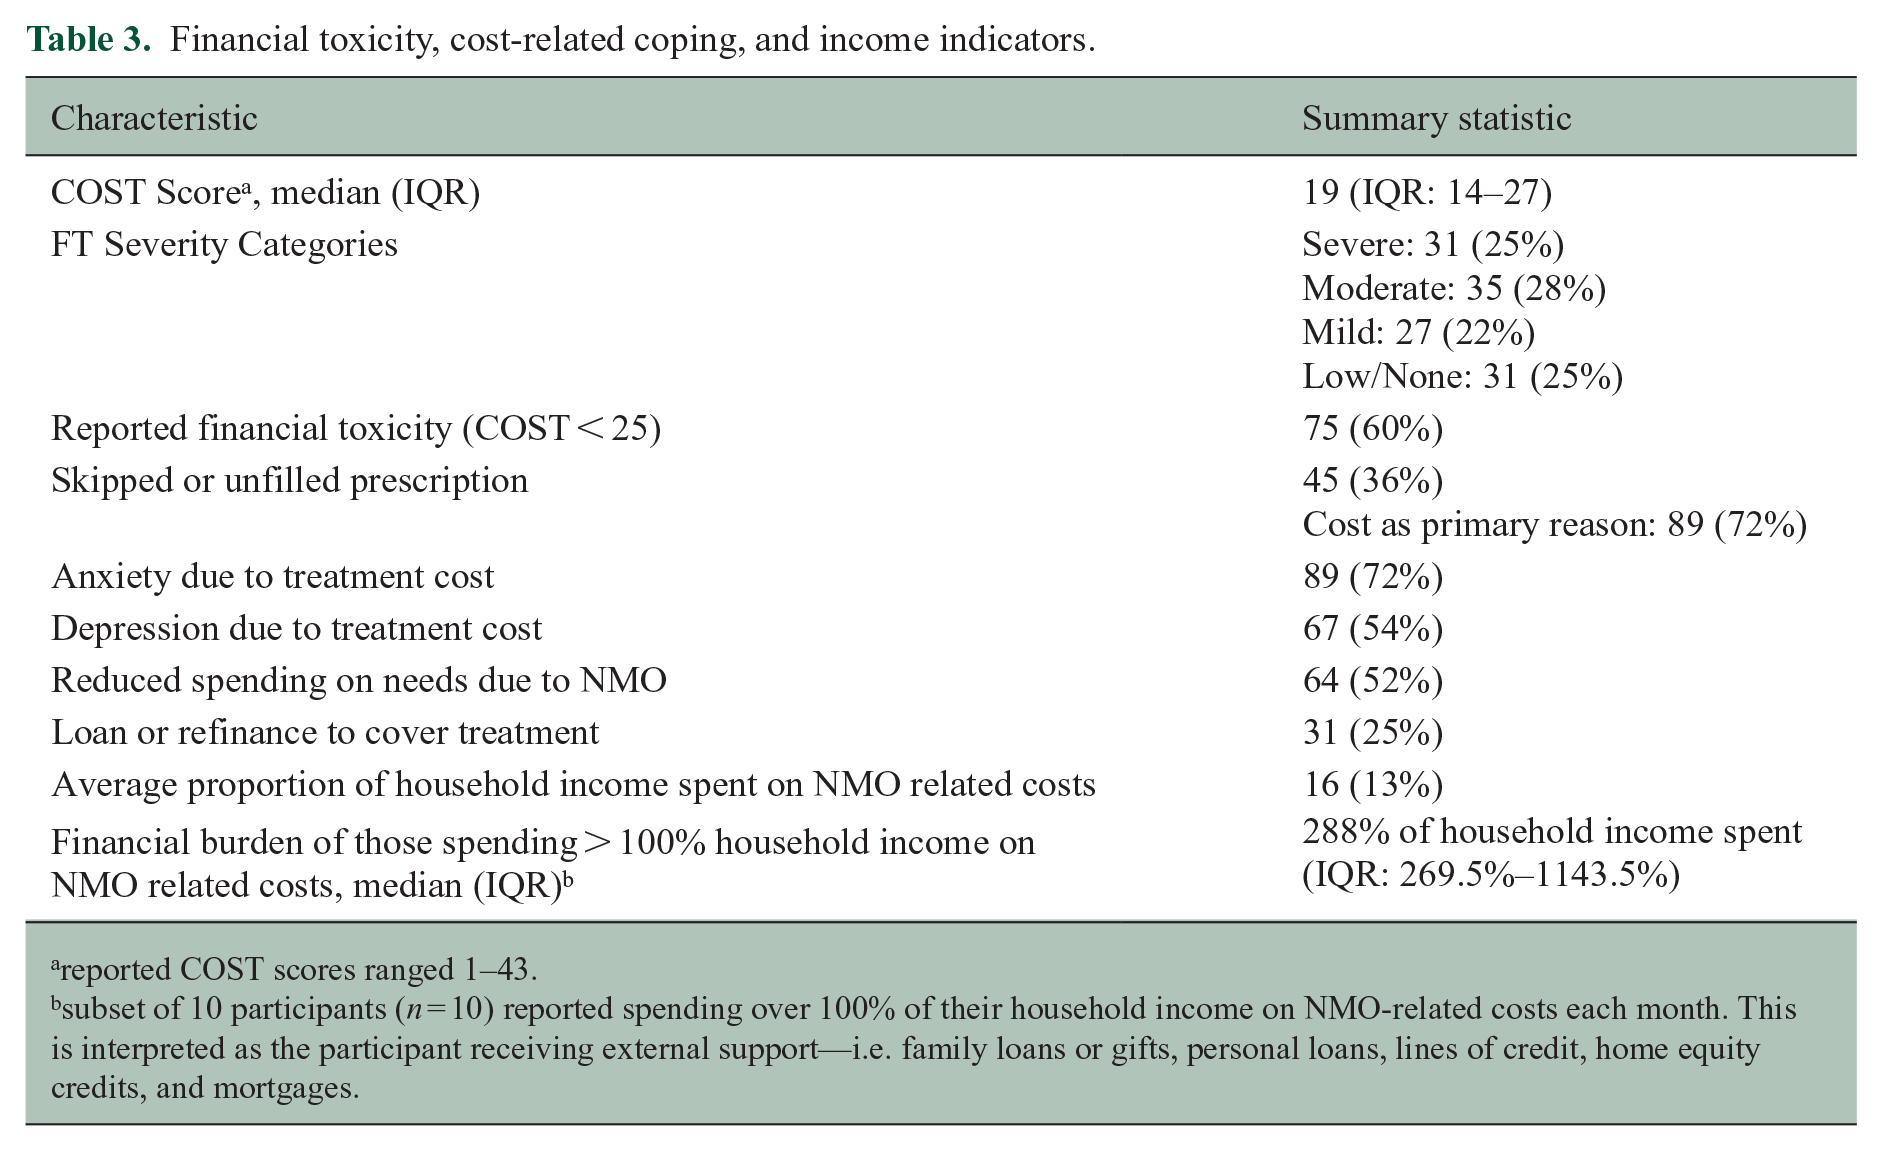
reported COST scores ranged 1–43.
subset of 10 participants (n = 10) reported spending over 100% of their household income on NMO-related costs each month. This is interpreted as the participant receiving external support—i.e. family loans or gifts, personal loans, lines of credit, home equity credits, and mortgages.
Model 1 (univariate screening) tested each factor separately; variables with p < 0.20 included number of attacks, PDDS score, AQP4 + status, White race, insurance, and employment, but only attack count, PDDS score, AQP4 + status, and White race were retained for inclusion in multivariable Model 2 (Table 4). As shown in Supplemental eAppendix 5, both employment (VIF = 5.89–5.95, ΔAIC < 2) and public insurance (VIF = 6.34, ΔAIC = 1.49) exhibited substantial collinearity with income and yielded minimal incremental fit improvement; therefore, they were excluded from the final multivariable models to preserve parsimony.
Univariate screening and multivariable linear regression models for financial toxicity (COST score).
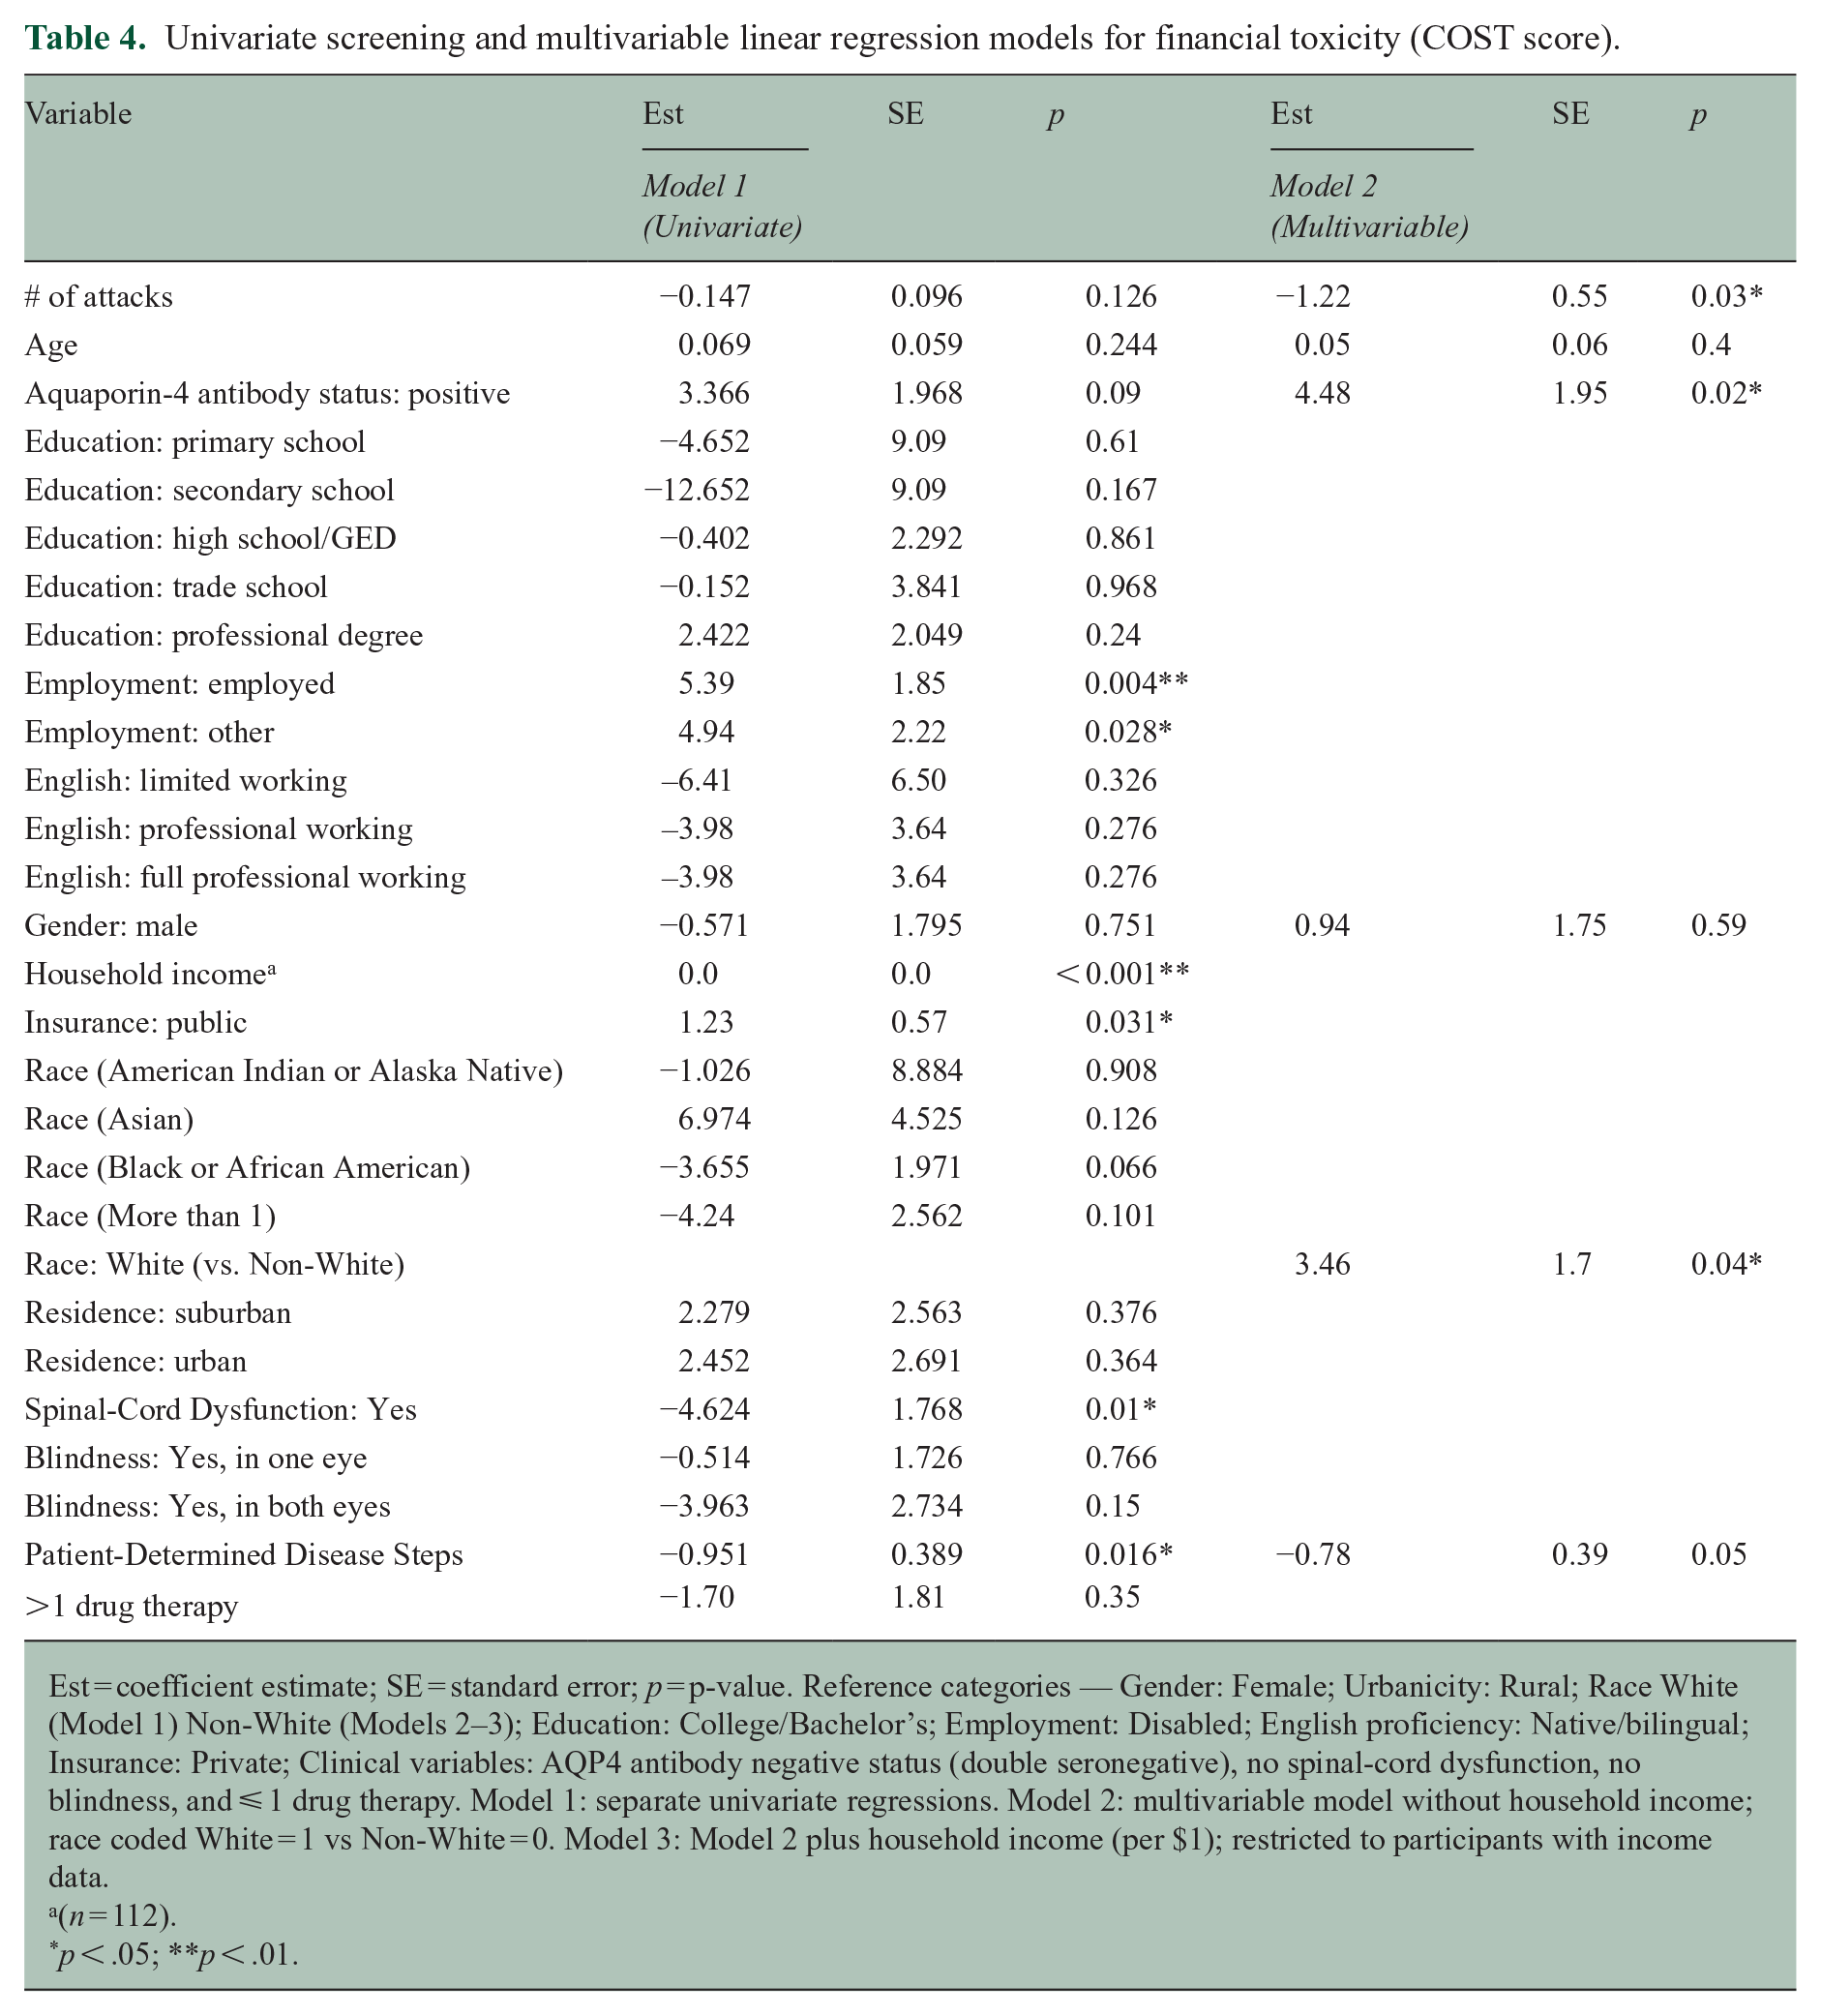
Est = coefficient estimate; SE = standard error; p = p-value. Reference categories — Gender: Female; Urbanicity: Rural; Race White (Model 1) Non-White (Models 2–3); Education: College/Bachelor’s; Employment: Disabled; English proficiency: Native/bilingual; Insurance: Private; Clinical variables: AQP4 antibody negative status (double seronegative), no spinal-cord dysfunction, no blindness, and ⩽ 1 drug therapy. Model 1: separate univariate regressions. Model 2: multivariable model without household income; race coded White = 1 vs Non-White = 0. Model 3: Model 2 plus household income (per $1); restricted to participants with income data.
(n = 112).
p < .05; **p < .01.
In a multivariable model excluding income (Model 2, Table 4), White race (β = 3.46, SE 1.70, p = 0.044) and AQP4 + status (β = 4.48, SE 1.95, p = 0.023) were associated with higher COST scores (lower FT), whereas greater attack burden (β =-1.22, SE 0.55, p = 0.030) and worse mobility by PDDS (β =-0.78, SE 0.39, p = 0.050) were associated with lower COST scores (greater FT).
Mediation analysis revealed income to be a mediator of PDDS and Race. PDDS was associated with COST in part through its impact on income, with a significant indirect effect (β =-0.47, SE = 0.21, p = 0.025), suggesting that greater disability may lead to lower income, which in turn contributes to greater FT (Table 5). Race demonstrated a significant indirect effect via income (β =-0.01, SE = 0.05, p = 0.029), indicating that racial disparities in COST may be partially explained by differences in household income. Conversely, no significant path of mediation was observed for attack burden (β =-0.01, SE = 0.05, p = 0.812) or AQP4 + status (β = 1.54, SE = 0.87, p = 0.073).
Mediation analysis summary table (with standard errors).
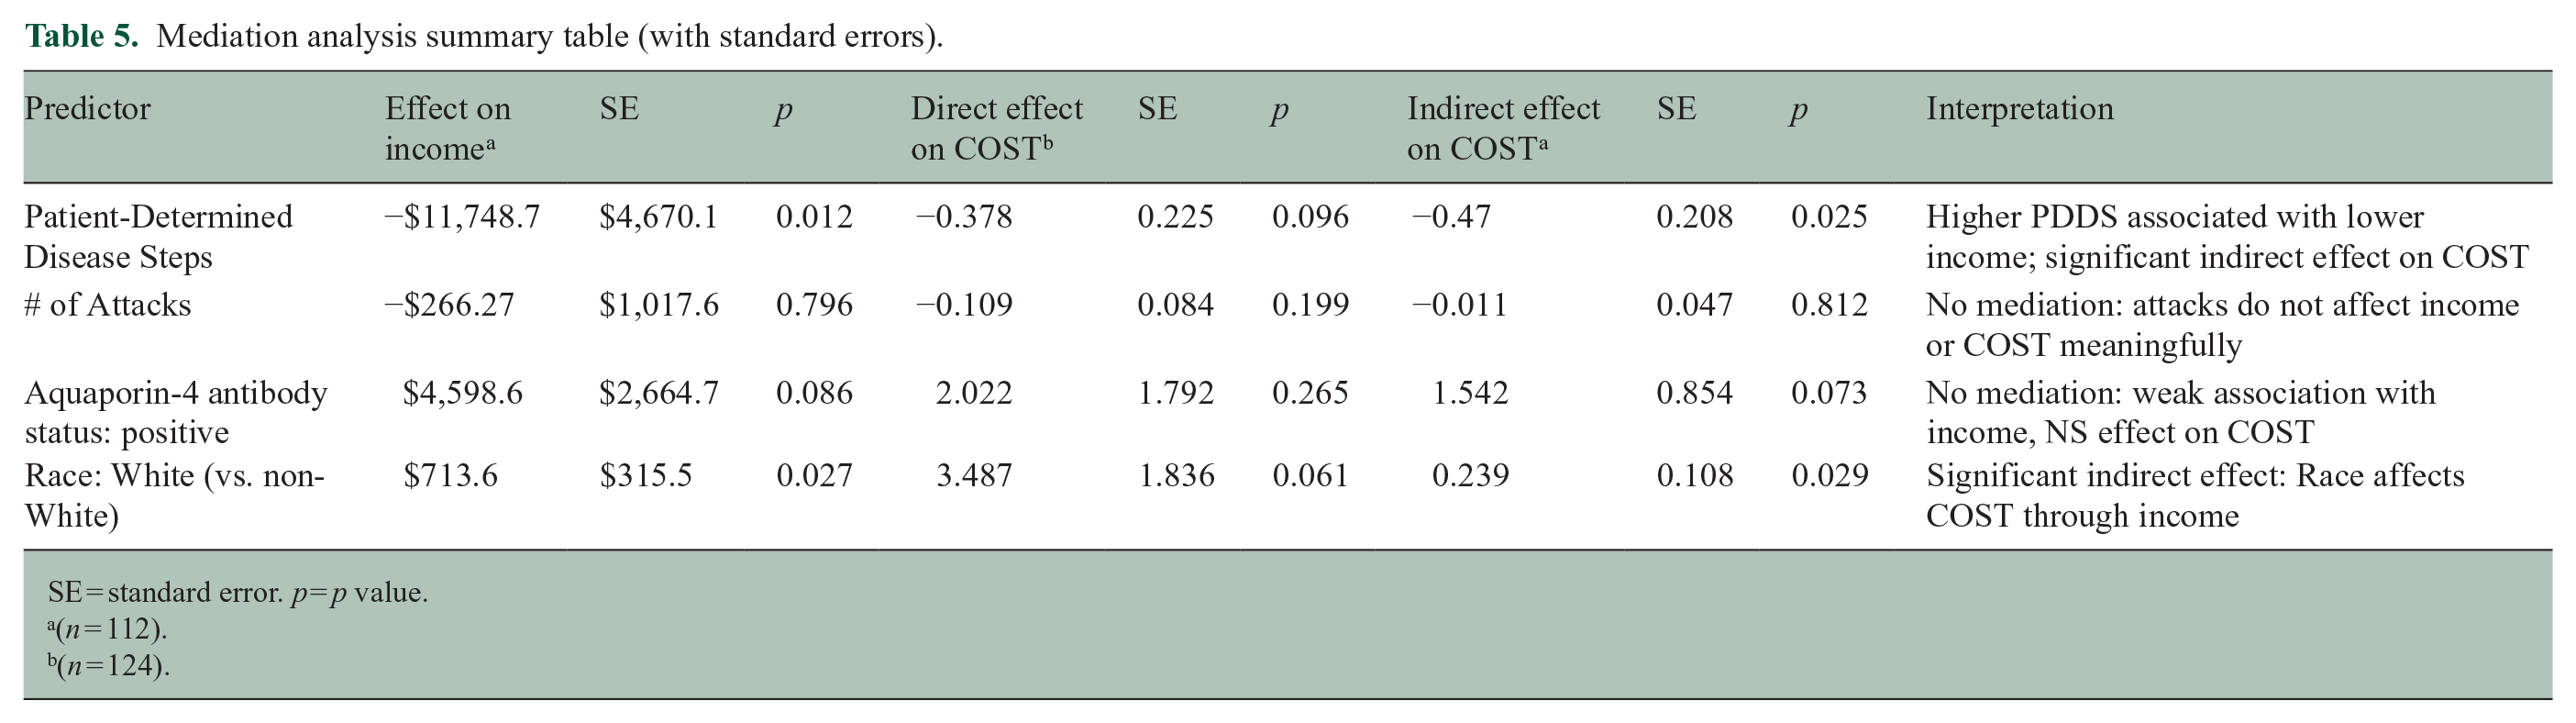
SE = standard error. p = p value.
(n = 112).
(n = 124).
In a separate model, examining predictors of disease burden, COST score was associated with higher attack count (β = −0.043 per point, SE 0.02, p = 0.029) after adjusting for age, gender, race, income, and ADI, but was not associated with PDDS (Supplemental eAppendix 6, 7). Neither ADI nor SVI reached statistical significance in any model. Among SVI sub-indices, the socioeconomic theme showed the strongest (although still statistically insignificant) correlation with FT. Notably, there was no difference between White and non-White participants’ mean attack count (2.0 ± 1.2 vs 2.3 ± 1.5; t = 0.42, p = 0.67) or mean PDDS score (2.1 ± 1.8 vs 2.4 ± 2.1; t = 0.33, p = 0.74). Similarly, female and male participants showed no differences in mean attack count (t = 0.25, p = 0.80) or PDDS (t = 0.40, p = 0.69), and age was not associated with mean attack count (r = 0.05, p = 0.60) or PDDS (r = 0.06, p = 0.55).
Discussion
In this national, convenience sample of adults living with NMOSD in the United States, FT was both prevalent and patterned along key clinical, demographic, and socioeconomic dimensions. The mean COST score was 19, with over half of patients experiencing moderate-to-severe FT. The FT observed in our NMOSD sample parallels that of a multiple sclerosis cohort (mean COST 17) 22 and is lower than in the oncology validation cohort (mean COST 22.3 and 21.6) from which our thresholds were derived, 21 suggesting a comparable toxicity burden across these cases of chronic disease. Among all variables examined, household income exhibited the strongest association with FT. Income mediated the effects of PDDS and race on FT, further highlighting income as a pathway through which structural and clinical disparities may compound FT, consistent with findings in cancer and autoimmune disease research correlating lower income to worse disease burden.22,38,39
While prior work has described NMOSD-related costs from insurance claims data, this study used patient-reported outcome measures to assess cost-related strain more directly. With lower household income remaining consistently associated with higher FT, regardless of clinical and demographic controls, financial vulnerability is underscored as a meaningful axis of disease burden to be considered.
Some participants reported NMOSD-related costs exceeding their reported household income, indicating potential catastrophic health expenditure. 40 By established definitions, catastrophic health spending occurs when out-of-pocket expenses exceed 40% of a household’s capacity to pay, after accounting for basic needs. 40 Although these outlier cases were excluded from proportional income analyses, they highlight the extreme financial burden some people living with NMOSD face. The patterns of cost-related coping described in this sample—including skipping medications, refinancing a home, and reducing essential spending—raise further concern for downstream impacts on NMOSD care adherence and long-term health outcomes.
Exploratory analyses further suggested that FT may not only be a consequence of disease burden but also a potential predictor. In models adjusting for age, gender, race, household income, and area deprivation, lower COST scores were independently associated with a higher number of NMOSD attacks. This bidirectional relationship, while preliminary, warrants further exploration. As one possible explanation, it may reflect the cumulative impact of financial strain on timely treatment access, medication adherence, and disease management behaviors.
Neither ADI nor SVI showed statistically significant associations with FT or clinical outcomes in this study, although ADI was associated more closely across models. These findings contribute to the recognition that vulnerability indices for disease-specific contexts may need to be refined, particularly in rare diseases where existing metrics may incompletely capture the patient-level experience. 41
Treatment patterns in the sample were diverse. Most were treated with rituximab, with others taking inebilizumab or mycophenolate mofetil, and overall reflect a combination of Food and Drug Administration (FDA)-approved and off-label medications. Some respondents took multiple therapies. While not the focus of multivariable models, these treatment patterns—alongside socioeconomic factors—may intersect with affordability and access in clinically meaningful ways. Future studies could examine how payor coverage, immunosuppressive drug choice, and prescription drug exclusions shape financial burden in NMOSD.
This study should be interpreted in light of its limitations. Participants were enrolled in English only. Our sample was mostly White (63%) or Black/African American (22%), with smaller proportions of Asian (3%) and other racial groups (12%)—including mixed raced participants and a single American Indian/Alaska Native—despite high NMOSD incidence among Asian and Black populations; 3 this limited racial diversity may constrain the applicability of our findings across all demographic subgroups.
The study is also survey-based, which may introduce response bias. Self-reported data may be subject to recall error, especially for attack count or treatment history. Twelve participants did not report their income. Open-ended fields introduced challenges in standardizing comorbidities and drug therapy data, and the cross-sectional design precludes causal inference. The COST instrument, though validated in other disease areas, has not yet been specifically validated in NMOSD. Nonetheless, the study’s strengths include its national reach, use of a validated FT measure, focus group–informed survey design, and integration of both patient-reported outcomes and structural indices.
The generalizability of our study results is unknown. Overall, the median household income among our participants was $65,000 USD/y (mean $83,587 USD) which is similar but less than the national median household income in the United States ($80,610 USD, 2023). 42 Approximately two-thirds (65.6%) 43 of all Americans receive private health insurance, similarly seen in our sample (58.1%).
A cross-sectional, 17-center, German study 44 of 212 patients (121 AQP4+, 25 double seronegative, 46 MOGAD) was performed (2017–2019), finding the mean total annual cost of illness per capita was 70, 297 USD (95% CI 60,445, 80,586). Overall, participants were 94% White and had a higher overall level of disability (median EDSS 3.5). That study notably preceded the approval of the four U.S. FDA- disease modifying therapies for NMOSD which are overall expensive. Among our participants, more than half reported at least one comorbidity—most commonly diabetes, hypertension, or pulmonary disease—which may confound the interpretation of FT, as financial strain could additionally stem from non–NMOSD medical expenses. It is possible that people with higher FT and more SDOH chose to respond to a survey about SDOH in NMOSD; however, it is also likely the poorest segment of people living with NMOSD remain undiagnosed, out of regular neurological care, outside of patient foundation listservs, do not speak English, or are outside of most US health systems and their accompanying research endeavors.
This work aims to expand the methodological toolkit available to NMOSD research, introduce NMOSD patient-centered socioeconomic metrics such as COST, and provide foundational data for SDOH and its intersection with clinical risk profiles in NMOSD patients. While FT may reflect downstream effects of disease severity, financial strain—and its consequences on health seeking behaviors—may also contribute to the NMOSD disease course through mechanisms such as delayed care or suboptimal treatment adherence. Addressing FT in NMOSD will require attention to patient income and mitigating support systems, in addition to clinical factors, and may benefit from models of care that explicitly integrate financial risk into treatment planning and public health policy.
Supplemental Material
sj-docx-1-msj-10.1177_13524585251365139 – Supplemental material for Characterizing financial toxicity among people living with neuromyelitis optica spectrum disorder
Supplemental material, sj-docx-1-msj-10.1177_13524585251365139 for Characterizing financial toxicity among people living with neuromyelitis optica spectrum disorder by Justin B Hill, Maya L Mastick, Horacio Chiong-Rivero, Elena Grebenciucova and Farrah J Mateen in Multiple Sclerosis Journal
Supplemental Material
sj-docx-2-msj-10.1177_13524585251365139 – Supplemental material for Characterizing financial toxicity among people living with neuromyelitis optica spectrum disorder
Supplemental material, sj-docx-2-msj-10.1177_13524585251365139 for Characterizing financial toxicity among people living with neuromyelitis optica spectrum disorder by Justin B Hill, Maya L Mastick, Horacio Chiong-Rivero, Elena Grebenciucova and Farrah J Mateen in Multiple Sclerosis Journal
Supplemental Material
sj-docx-3-msj-10.1177_13524585251365139 – Supplemental material for Characterizing financial toxicity among people living with neuromyelitis optica spectrum disorder
Supplemental material, sj-docx-3-msj-10.1177_13524585251365139 for Characterizing financial toxicity among people living with neuromyelitis optica spectrum disorder by Justin B Hill, Maya L Mastick, Horacio Chiong-Rivero, Elena Grebenciucova and Farrah J Mateen in Multiple Sclerosis Journal
Supplemental Material
sj-docx-4-msj-10.1177_13524585251365139 – Supplemental material for Characterizing financial toxicity among people living with neuromyelitis optica spectrum disorder
Supplemental material, sj-docx-4-msj-10.1177_13524585251365139 for Characterizing financial toxicity among people living with neuromyelitis optica spectrum disorder by Justin B Hill, Maya L Mastick, Horacio Chiong-Rivero, Elena Grebenciucova and Farrah J Mateen in Multiple Sclerosis Journal
Supplemental Material
sj-docx-5-msj-10.1177_13524585251365139 – Supplemental material for Characterizing financial toxicity among people living with neuromyelitis optica spectrum disorder
Supplemental material, sj-docx-5-msj-10.1177_13524585251365139 for Characterizing financial toxicity among people living with neuromyelitis optica spectrum disorder by Justin B Hill, Maya L Mastick, Horacio Chiong-Rivero, Elena Grebenciucova and Farrah J Mateen in Multiple Sclerosis Journal
Supplemental Material
sj-docx-6-msj-10.1177_13524585251365139 – Supplemental material for Characterizing financial toxicity among people living with neuromyelitis optica spectrum disorder
Supplemental material, sj-docx-6-msj-10.1177_13524585251365139 for Characterizing financial toxicity among people living with neuromyelitis optica spectrum disorder by Justin B Hill, Maya L Mastick, Horacio Chiong-Rivero, Elena Grebenciucova and Farrah J Mateen in Multiple Sclerosis Journal
Supplemental Material
sj-tiff-10-msj-10.1177_13524585251365139 – Supplemental material for Characterizing financial toxicity among people living with neuromyelitis optica spectrum disorder
Supplemental material, sj-tiff-10-msj-10.1177_13524585251365139 for Characterizing financial toxicity among people living with neuromyelitis optica spectrum disorder by Justin B Hill, Maya L Mastick, Horacio Chiong-Rivero, Elena Grebenciucova and Farrah J Mateen in Multiple Sclerosis Journal
Supplemental Material
sj-tiff-11-msj-10.1177_13524585251365139 – Supplemental material for Characterizing financial toxicity among people living with neuromyelitis optica spectrum disorder
Supplemental material, sj-tiff-11-msj-10.1177_13524585251365139 for Characterizing financial toxicity among people living with neuromyelitis optica spectrum disorder by Justin B Hill, Maya L Mastick, Horacio Chiong-Rivero, Elena Grebenciucova and Farrah J Mateen in Multiple Sclerosis Journal
Supplemental Material
sj-tiff-7-msj-10.1177_13524585251365139 – Supplemental material for Characterizing financial toxicity among people living with neuromyelitis optica spectrum disorder
Supplemental material, sj-tiff-7-msj-10.1177_13524585251365139 for Characterizing financial toxicity among people living with neuromyelitis optica spectrum disorder by Justin B Hill, Maya L Mastick, Horacio Chiong-Rivero, Elena Grebenciucova and Farrah J Mateen in Multiple Sclerosis Journal
Supplemental Material
sj-tiff-8-msj-10.1177_13524585251365139 – Supplemental material for Characterizing financial toxicity among people living with neuromyelitis optica spectrum disorder
Supplemental material, sj-tiff-8-msj-10.1177_13524585251365139 for Characterizing financial toxicity among people living with neuromyelitis optica spectrum disorder by Justin B Hill, Maya L Mastick, Horacio Chiong-Rivero, Elena Grebenciucova and Farrah J Mateen in Multiple Sclerosis Journal
Supplemental Material
sj-tiff-9-msj-10.1177_13524585251365139 – Supplemental material for Characterizing financial toxicity among people living with neuromyelitis optica spectrum disorder
Supplemental material, sj-tiff-9-msj-10.1177_13524585251365139 for Characterizing financial toxicity among people living with neuromyelitis optica spectrum disorder by Justin B Hill, Maya L Mastick, Horacio Chiong-Rivero, Elena Grebenciucova and Farrah J Mateen in Multiple Sclerosis Journal
Footnotes
Acknowledgements
The authors thank The Sumaira Foundation for NMOSD and The Guthy-Jackson Charitable Foundation for their support in disseminating our study information to their respective communities.
Consent to Participate
Each participant provided written informed consent prior to enrollment.
Consent for Publication
Informed written consent to publication was provided by participants and study staff.
Data Availability Statement
While not publicly available due to privacy and ethical considerations, the de-identified data that support the findings of this study are available upon request and with appropriate institutional approvals.
Declaration of Conflicting Interests
The authors declared the following potential conflicts of interest with respect to the research, authorship, and/or publication of this article: F.J.M. has received research funding from Bristol-Myers Squibb, EMD Serono, Genentech, Horizon Therapeutics, Novartis, and TG Therapeutics, and has consulted for Alexion, EMD Serono, Genentech, and Horizon Therapeutics, all unrelated to this work.
Funding
The authors disclosed receipt of the following financial support for the research, authorship, and/or publication of this article: Investigator-initiated grant from Amgen.
Ethical Considerations
This study was approved by the Institutional Review Board at the Massachusetts General Brigham hospitals.
Supplemental Material
Supplemental material for this article is available online.
References
Supplementary Material
Please find the following supplemental material available below.
For Open Access articles published under a Creative Commons License, all supplemental material carries the same license as the article it is associated with.
For non-Open Access articles published, all supplemental material carries a non-exclusive license, and permission requests for re-use of supplemental material or any part of supplemental material shall be sent directly to the copyright owner as specified in the copyright notice associated with the article.