
Abstract
Background:
Serum neurofilament light chain (sNfL) and glial fibrillary acidic protein (GFAP) are emerging biomarkers of axonal damage and astrocytic activation. The value of sNfL and GFAP in predicting retinal layer thinning remains underexplored.
Objectives:
To evaluate the association between sNfL and GFAP levels and retinal layer thinning.
Methods:
This prospective observational study included people with relapsing MS (pwMS) newly initiated on a disease-modifying therapy (DMT). Optical coherence tomography (OCT) scans were conducted 3–6 months after DMT initiation and at 12-month intervals measuring peripapillary retinal nerve fibre layer (pRNFL) and ganglion cell-inner plexiform layer (GCIPL) thickness. sNfL and GFAP levels were measured at baseline and after 6 months (M6) using single-molecule array (Simoa®) technology.
Results:
A total of 116 pwMS (mean age 34.5 years [SD 8.6]), 73.3% female) were included. GFAP z-scores at M6 showed the strongest association with annualized loss of pRNFL (aLpRNFL: b = −0.24; 95% confidence interval [CI] −0.27, −0.21, p < 0.001) and GCIPL (aLGCIPL: b = −0.15; 95% CI: −0.18, −0.12, p < 0.001). Moreover, pwMS with low sNfL but high GFAP levels at M6 showed the most pronounced retinal layer thinning (aLpRNFL: −0.8%/year [1.1], aLGCIPL: −0.8%/year [0.9]; both p < 0.001).
Conclusions:
High GFAP levels – more than sNfL levels – are associated with retinal layer thinning in relapsing MS.
Keywords
Introduction
The current concept of multiple sclerosis (MS) pathophysiology encompasses a complex, overlapping continuum of inflammatory and neurodegenerative processes, with early neuroaxonal damage, albeit often clinically silent, mainly determining long-term prognosis. 1 Optical coherence tomography (OCT), a non-invasive, cost-effective and reproducible imaging modality, has emerged valuable for detecting MS-associated neuroaxonal damage. In particular, thinning of the inner retinal layers, for example, peripapillary retinal nerve fibre layer (pRNFL) and the ganglion cell-inner plexiform layer (GCIPL), has shown strong utility in assessing neuroaxonal damage and predicting future disability accumulation in people with MS (pwMS).2,3
In parallel, serum neurofilament light chain (sNfL) and glial fibrillary acidic protein (GFAP) have emerged as promising biomarkers of disease activity and progression. Released into the cerebrospinal fluid (CSF) and subsequently the bloodstream following neuroaxonal injury, sNfL, a structural protein of axonal cytoskeleton, serves as a sensitive but unspecific marker of axonal damage. 4 GFAP, an intermediate filament found in astrocytes, is thought to reflect astrocyte activation and has been increasingly recognized as a predictor of progression independent of relapse activity (PIRA). 5 Notably, combining both measurements has shown the strongest predictive value for future disability worsening. 5 While sNfL has been linked to OCT-based markers of neuroaxonal damage,6,7 the relationship between GFAP levels and OCT metrics remains underexplored. 8 Moreover, a combination of elevated sNfL levels and reduced GCIPL thickness has been associated with a higher risk of subsequent failure to maintain no evidence of disease activity (NEDA-3), 9 suggesting they capture complementary pathophysiological mechanisms not fully reflected by sNfL alone.
This study aimed to evaluate whether sNfL and GFAP levels are associated with retinal thinning, and whether these biomarkers contribute independently or synergistically to this process.
Methods
Patients and definitions
From an ongoing prospective observational study conducted at the Department of Neurology, Medical University of Vienna, we included people diagnosed with relapsing MS (pwMS) according to 2017 McDonald criteria, who were newly initiated on a disease-modifying therapy (DMT).10,11 Inclusion criteria comprised: (1) availability of an OCT scan within 3–6 months after DMT start (rebaseline), (2) at least one follow-up OCT with a minimum interval of 12 months after rebaseline, (3) availability of a serum sample at both baseline (M0) and after 6 months (M6), and (4) continuous adherence to the DMT during follow-up (Figure 1). The selection process based on the inclusion and exclusion criteria is shown in Figure 2.
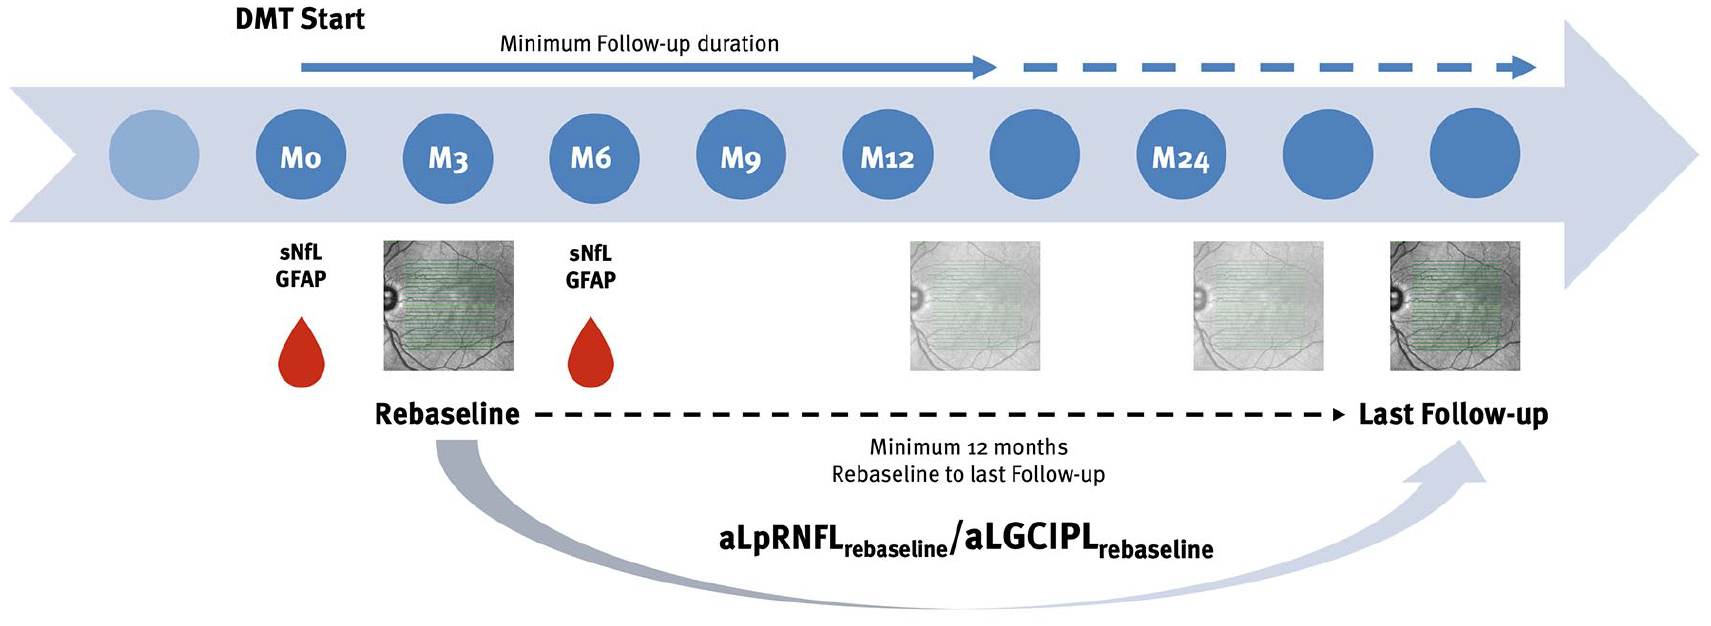
Overview of the study design.
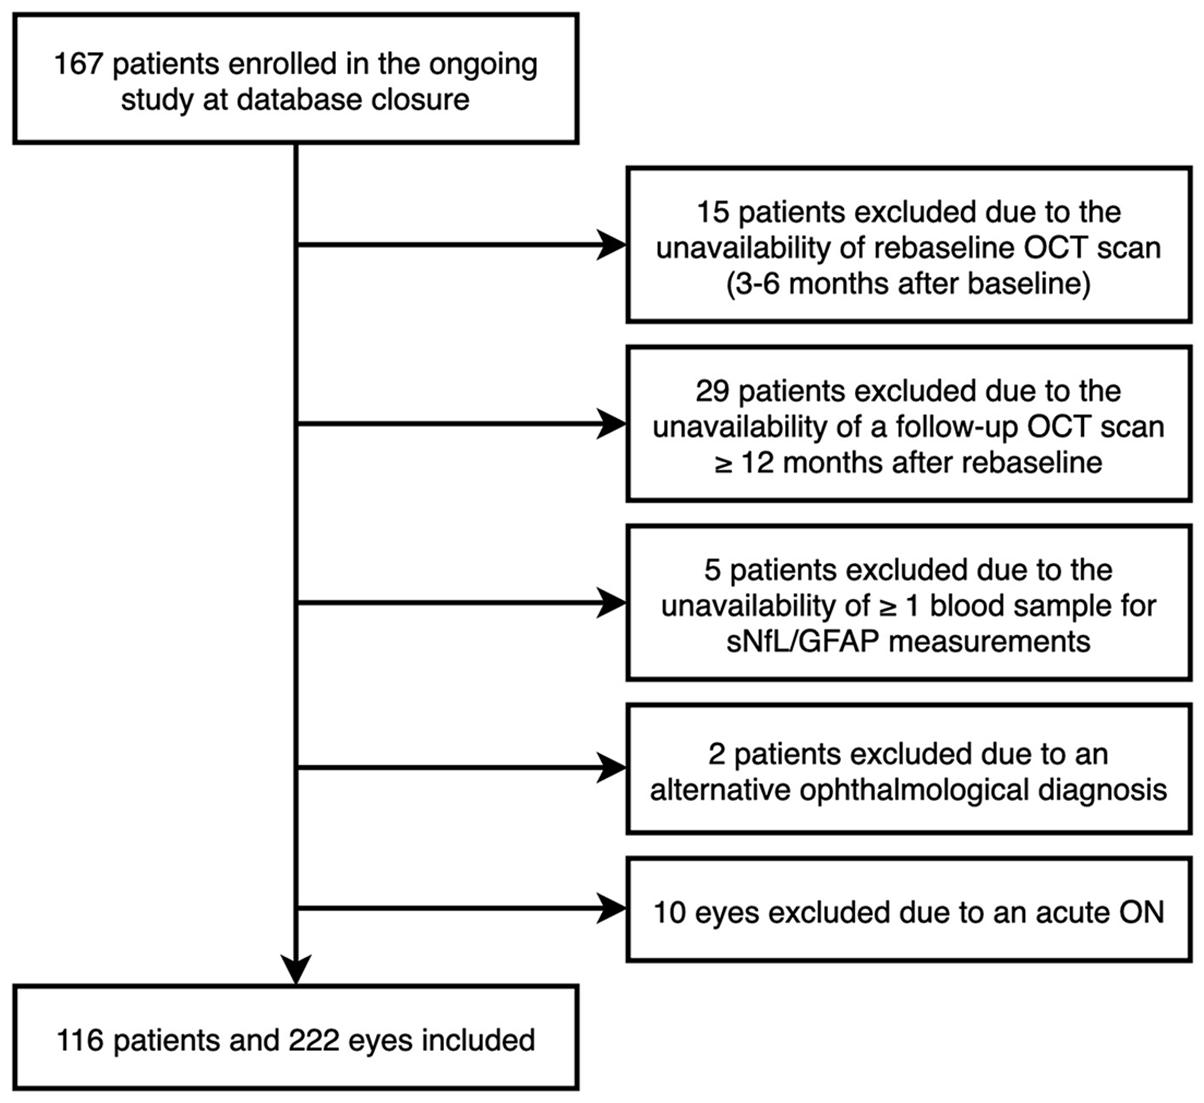
Flow chart of patients’ selection based on the inclusion and exclusion criteria.
Data on Expanded Disability Status Scale (EDSS) and relapses were obtained at baseline and at every clinical visit at 3-month intervals during the observation period. 12 A relapse was defined as patient-reported symptoms and objectively confirmed neurological signs typical of an acute CNS inflammatory demyelinating event with duration of at least 24 hours in the absence of fever or infection and separated from the last relapse by at least 30 days. 13 PIRA was defined as a confirmed EDSS increase (⩾1.5/1.0/0.5 points from baseline score of 0/1.0–5.5/⩾6.0 points) with no clinical attack in the 30 days before or after the EDSS increase and confirmed after 6 months.14,15
The patients’ DMT status was classified as following: (1) ‘moderate-efficacy DMT (ME-DMT)’ defined as pwMS receiving either interferon-beta preparations, glatiramer acetate, dimethyl fumarate, or teriflunomide; or (2) ‘high-efficacy DMT (HE-DMT)’ defined as pwMS receiving either natalizumab, fingolimod, siponimod, ponesimod, ozanimod, alemtuzumab, cladribine, ocrelizumab, ofatumumab, or rituximab.
Optical coherence tomography
OCT imaging was performed by experienced neuro-ophthalmologists at the Department of Ophthalmology and Optometry using the same spectral-domain OCT (Spectralis OCT, Heidelberg Engineering, Heidelberg, Germany; software Heidelberg eye explorer software version 5.4.8.0) without pupil dilatation in a dark room on both eyes of each patient. For pRNFL measurement, a custom 12°(3.4 mm) ring scan centred on the optic nerve head was used (1536 A-scans, automatic real-time tracking [ART]: 100 averaged frames). 16 For GCIPL measurement, a 20°× 20 macular volume scan (512 A-scans, 25 B-scans, vertical alignment, ART: 16 averaged frames) centred on the macula was performed. GCIPL thickness was defined as the mean layer thickness of the four inner and outer quadrants of the circular grid centred around the foveola corresponding to the 3 and 6 mm rings as defined by the Early Treatment Diabetic Retinopathy Study, excluding the central 1 mm diameter zone from the volumetric scan. 17 Image processing was conducted semi-automatically using the built-in proprietary software with manual correction of obvious errors. All examinations were checked for sufficient quality using OSCAR-IB criteria. 18 OCT scans that lacked macula scan or did not fulfil OSCAR-IB criteria were excluded from the final analysis.
pRNFL and GCIPL thicknesses were calculated as the mean of the values for both eyes. PwMS with a history of unilateral ON < 6 months before baseline were excluded from the study. Eyes with a history of ON ⩾6 months before baseline or an inter-eye difference (IED) suggestive of subclinical ON (⩾5 µm/5% pRNFL-IED and/or ⩾4 µm/4% GCIPL-IED) were eligible for inclusion.19,20 Eyes suffering ON during the observation period were excluded from the study and only the values of eyes without ON during the observation period were used for calculation of retinal thinning. Similarly, eyes suffering subclinical ON (⩾5 µm/5% pRNFL-IED and/or ⩾4 µm/4% GCIPL-IED) during the course of the study was excluded. 20 In this way, all parameters used for statistical analyses are not underlying inter-eye interactions. Annualized loss of pRNFL and GCIPL (aLpRNFL, aLGCIPL) were calculated by individual linear regression models as the slope of the regression line best fitted to all measurements over the observation period. PwMS with diagnoses of ophthalmologic (i.e. myopia greater than −4 diopters, optic disc drusen, glaucoma), neurologic, or drug-related causes of retinal damage not attributable to MS were excluded. The investigators performing the OCT were blinded to clinical parameters and vice versa. The quantitative OCT study results were reported using the revised Advised Protocol for OCT Study Terminology and Elements (APOSTEL 2.0) recommendations. 21
SNfL and GFAP levels
sNfL and GFAP measurements were performed by an investigator blinded to clinical and OCT results. After thawing the samples for 60 minutes, the multiplex assay was performed according to the manufacturer’s instructions and protocol using the Simoa Neurology 2 Plex B assay kits, calibrators, and consumables in the Simoa SR-X Analyzer (Quanterix, Lexington, MA, USA). Briefly, duplicate calibrators and controls, and single samples were equilibrated to room temperature and dispensed in 96-well plates. Subsequently, incubation with detectors and paramagnetic bead solutions was performed according to the kit instructions. Washing and incubation were undertaken in the Simoa microplate incubator and washer. Sample readout and concentration analysis were executed on the Quanterix SR-X Analyzer as previously desribed. 22 Standardized z-scores for sNfL and GFAP, adjusted for age and body mass index, as well as sex in the case of GFAP were calculated. 23
Standard protocol approvals, registrations, patient consents, and reporting
The study was approved by the ethics committee of the Medical University Vienna (ethical approval number: 1378/2020). Written informed consent was obtained from all study participants. This study adheres to the reporting guidelines outlined within the ‘Strengthening the Reporting of Observational Studies in Epidemiology’ (STROBE) Statement.
Data availability statement
Data supporting the findings of this study are available from the corresponding author upon reasonable request by a qualified researcher and upon approval by the data-clearing committee of the Medical University of Vienna.
Statistics
Statistical analysis was performed using SPSS 26.0 (SPSS Inc, Chicago, IL, USA). Categorical variables were expressed in frequencies and percentages, continuous variables as mean and standard deviation (SD) or median and range or interquartile range (IQR) as appropriate. Continuous variables were tested for normal distribution by the Kolmogorov–Smirnov test with Lilliefors correction. Statistical analyses were conducted using various cut-off values for sNfL and GFAP z-scores to evaluate their association with retinal thinning. A cut-off value of ⩾1.5, that is, above the 93rd percentile, was set to define pwMS with high sNfL and high GFAP, striking a balance between the underlying data distribution and clinical relevance. Intraindividual variability of fluid biomarkers was quantified using the within-subject coefficient of variation (CV).
Multivariate linear stepwise mixed-effects regression models were fitted with OCT parameters (aLpRNFL, aLGCIPL) as dependent variables and sNfL and GFAP z-scores at each timepoint as well as the change in sNfL and GFAP z-scores from baseline to 6 months (M6–M0) as independent variables, adjusted for age, sex, disease duration, EDSS at baseline, DMT group and relapse within 90 days before and after each time point. In the subsequent step, all significant variables were incorporated into a single model to assess potential interactions and evaluate their independent effects.
Regression models were checked for collinearity by variance inflation factor (VIF) excluding all variables if the VIF was >2.0, corresponding to an R2 of 0.50. Missing values were handled by multiple (20 times) imputation using the missing not at random (MNAR) approach with pooling of estimates according to Rubin’s rules. 24 A sensitivity analysis was conducted by (1) excluding all imputed data to assess the potential impact of missing values on results and (2) excluding eyes with a history of ON.
The significance level was set at a two-sided p value <0.05. All multiple analyses were corrected using the Bonferroni method.
Results
Of 167 pwMS enrolled in the original study by December 12, 2023, 116 pwMS were eligible for the analysis. Serum was available in 111/116 and 101/116 pwMS at baseline and M6, respectively. Characteristics of the study cohort are given in Table 1 and did not differ from the cohort in the original study (Supplemental Table 1). Mean sNfL and GFAP levels did not change significantly during the observation period, but showed high intraindividual variability (sNfL: mean difference 0.86 [SD 1.41], CV 163%; GFAP: mean difference 0.10 [1.39], CV 1435%) (Figure 3). History of ON was evenly distributed across all groups irrespective of sNfL and GFAP levels (p = 0.825). Sensitivity analyses regarding missing values did not show a significant effect on our results. During a median interval of 28 (range 12–48) months, PIRA was observed in 7 (6.0%) pwMS.
Demographic and clinical characteristics of the study cohort at baseline.
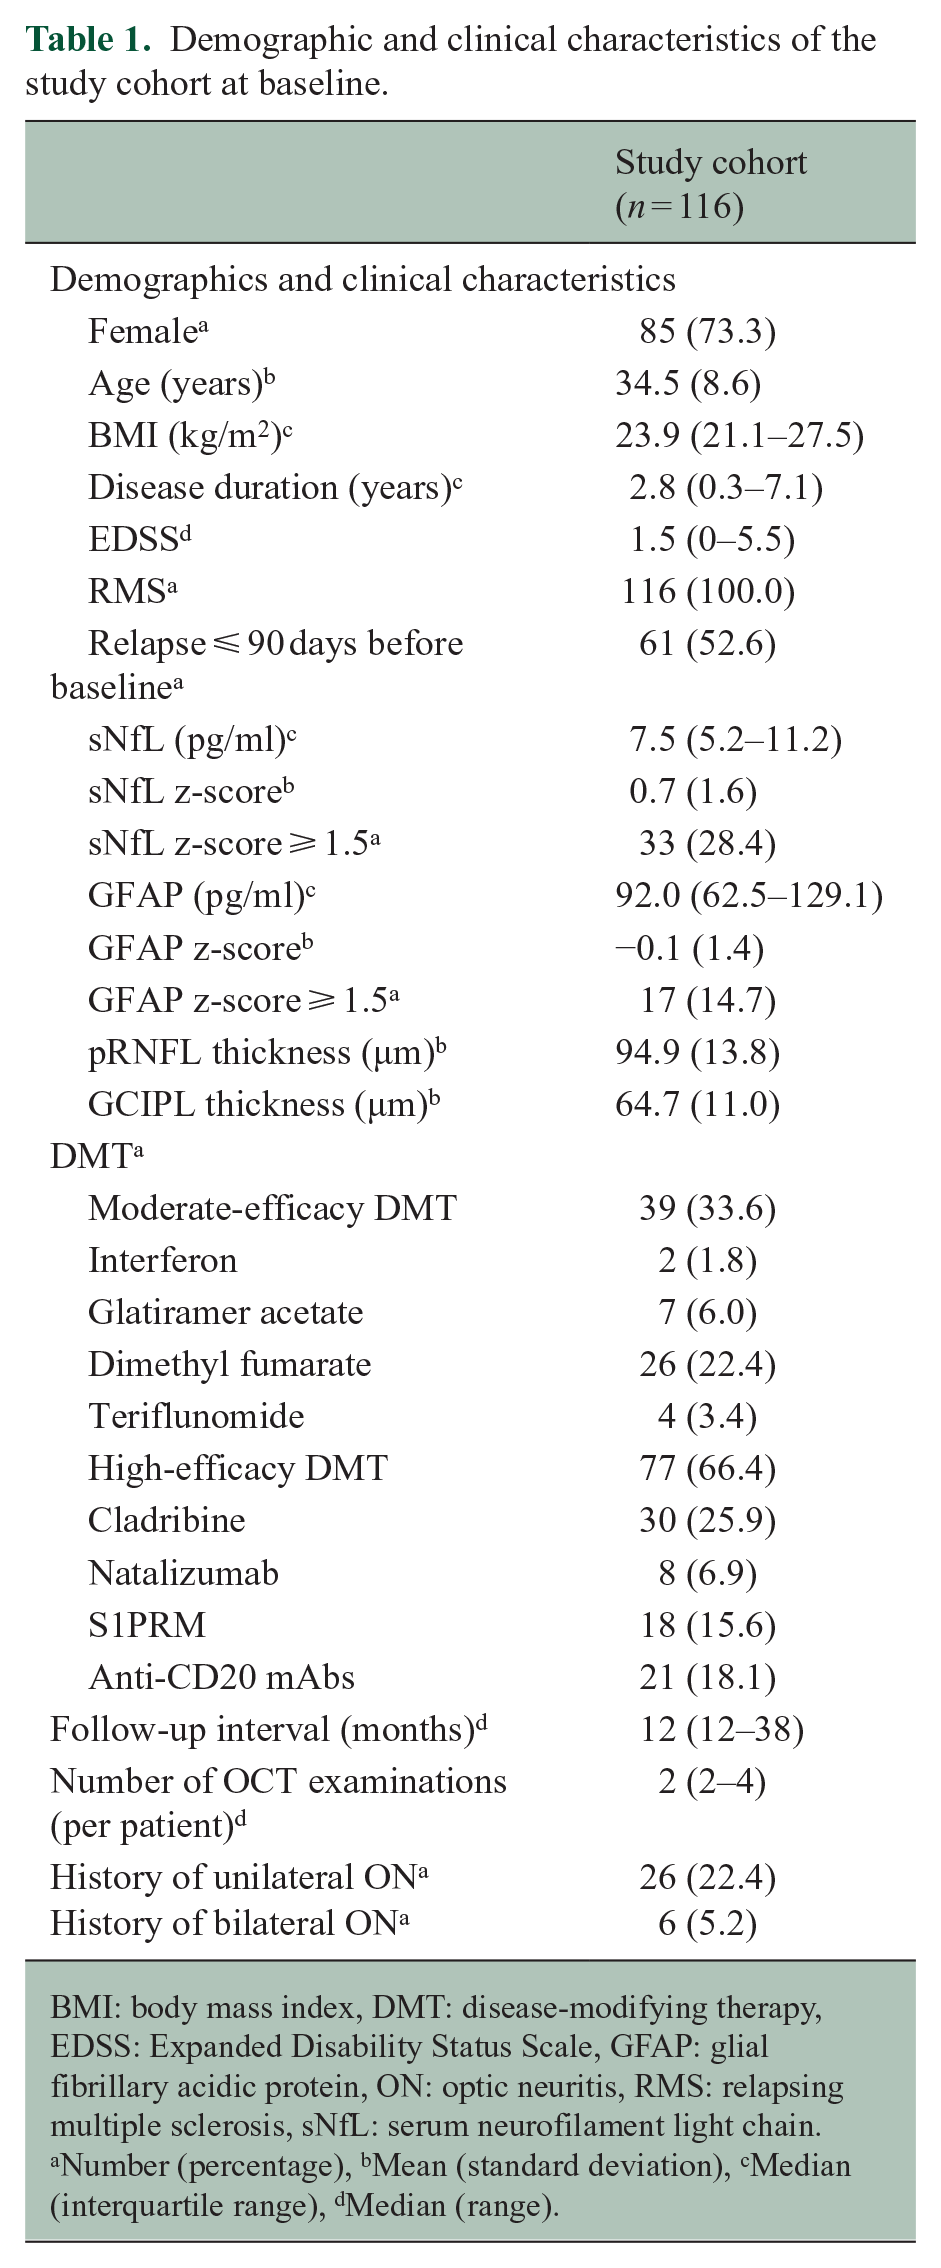
BMI: body mass index, DMT: disease-modifying therapy, EDSS: Expanded Disability Status Scale, GFAP: glial fibrillary acidic protein, ON: optic neuritis, RMS: relapsing multiple sclerosis, sNfL: serum neurofilament light chain.
Number (percentage), bMean (standard deviation), cMedian (interquartile range), dMedian (range).
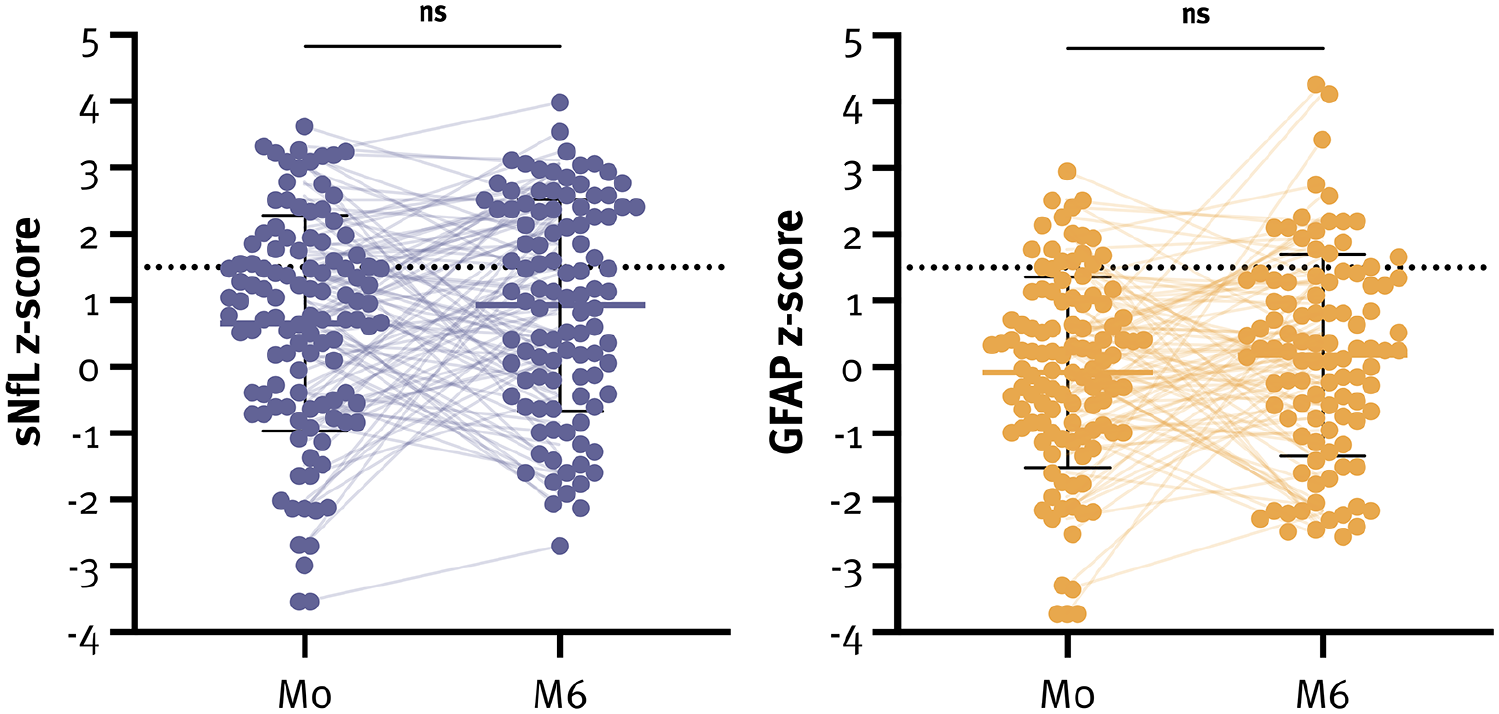
sNfL and GFAP z-scores at both timepoints.
Association of serum biomarkers with inner retinal layer thickness
At baseline, mean pRNFL and GCIPL thickness were 94.9 µm (13.8) and 64.7 µm (11.0), respectively. Univariately, sNfL z-scores at baseline correlated with pRNFL (rs = −0.06, p = 0.002) and GCIPL thickness (rs = −0.16, p < 0.001), whereas sNfL z-scores at M6 only correlated with pRNFL thickness (rs = −0.10, p < 0.001). Similarly, GFAP z-scores at baseline correlated with both pRNFL (rs = −0.05, p = 0.017) and GCIPL thickness (rs = −0.08, p < 0.001), whereas GFAP z-scores at M6 only correlated with pRNFL thickness (rs = −0.15, p < 0.001).
PwMS with high sNfL z-scores at baseline had significantly lower GCIPL (64.9µm [9.3] vs 68.5µm [7.7]; p = 0.026) but not pRNFL thickness (96.3µm [12.5] vs 97.6µm [12.9]; p = 0.579). Similarly, pwMS with high GFAP z-scores at baseline showed some trend towards lower GCIPL (63.1µm [8.7] vs 66.4µm [9.2]; p = 0.083) but not pRNFL thickness (94.6µm [15.2] vs 97.1µm [12.4]; p = 0.468). The lowest pRNFL and GCIPL thicknesses were observed in pwMS with low sNfL and high GFAP z-scores (Figure 4).
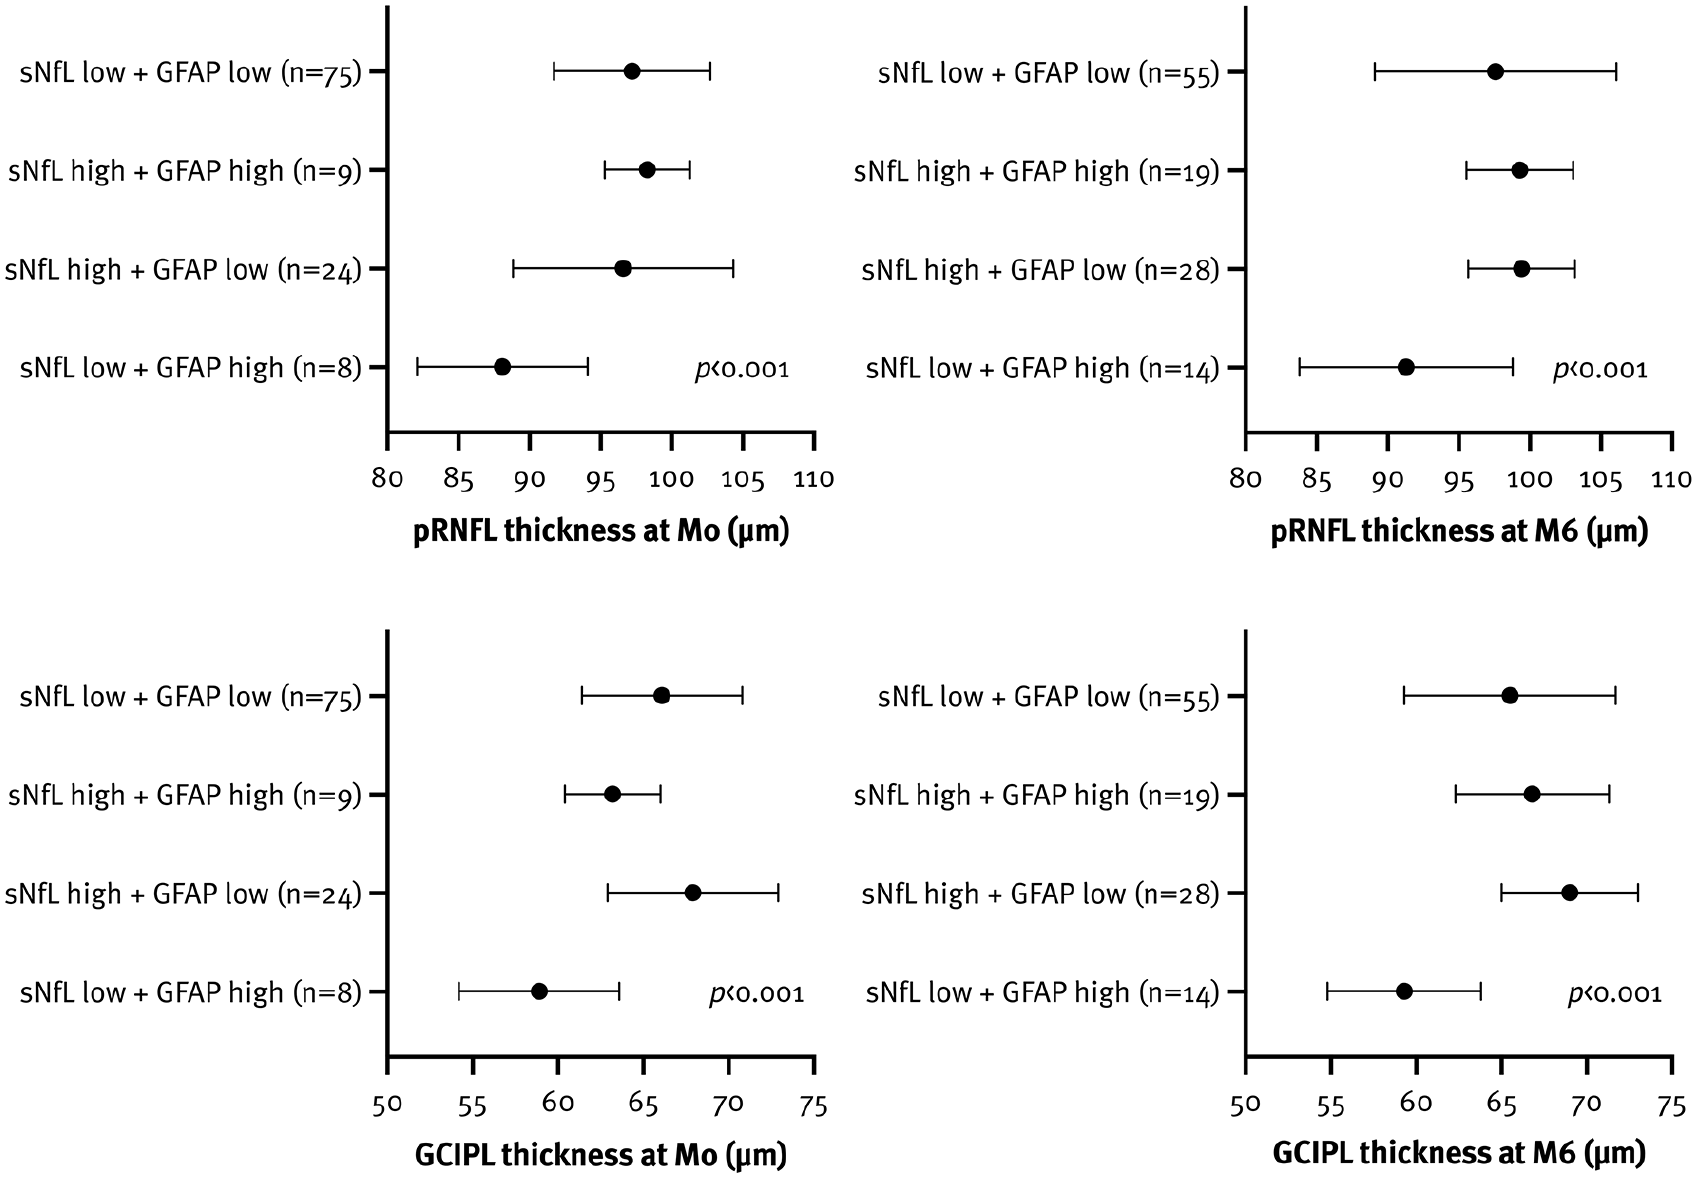
Association between inner retinal layer thickness and sNfL and GFAP z-scores (⩾ 1.5 indicating high levels) at both timepoints.
In contrast, no significant differences in pRNFL and GCIPL thickness were observed between pwMS with high versus low sNfL z-scores at M6. However, pwMS with high GFAP z-scores at M6 showed some trend towards lower pRNFL (93.1µm [16.1] vs 98.2µm [11.1]; p = 0.075) and GCIPL thickness (62.5µm [11.1] vs 66.7µm [11.1]; p = 0.077). Again, the lowest pRNFL and GCIPL thicknesses at baseline were recorded in pwMS with low sNfL and high GFAP z-scores at M6 (Figure 4, Supplemental Table 2).
In a multivariate model, both pRNFL (b = −0.34; 95% CI −0.67, −0.02; p = 0.04) and GCIPL thickness (b = −0.39; 95% CI −0.65, −0.12; p = 0.004) were associated with GFAP but not sNfL z-scores at baseline. The association between pRNFL thickness and sNfL and GFAP z-scores was even more pronounced at M6 (sNfL: b = –1.39; 95% CI −1.68, –1.11; GFAP: b = –1.08; 95% CI −1.38, −0.78; both p < 0.001) (Supplemental Table 3). Notably, when both biomarkers were incorporated into a single model, only the GFAP z-score at M6 remained significantly associated with retinal thickness (pRNFL: b = –1.50; 95% CI −1.86, –1.14; GCIPL: b = −0.89; 95% CI −1.29, −0.49; both p < 0.001).
Association of serum biomarkers with inner retinal thinning
Overall, mean aLpRNFL and aLGCIPL were −0.1 %/year (1.1) and −0.1 %/year (0.9), respectively. Univariately, aLpRNFL and aLGCIPL correlated with sNfL z-scores at M6 (aLpRNFL: rs = −0.26, aLGCIPL: rs = −0.18; both p < 0.001) and the change in sNfL z-score (aLpRNFL: rs = −0.25, aLGCIPL: rs = −0.18; both p < 0.001), but not with sNfL z-scores at baseline. PwMS with high sNfL z-scores at M6 had significantly higher aLpRNFL (−0.5 %/year [1.2] vs 0.1 %/year [1.2]) and aLGCIPL (−0.4 %/year [1.0] vs 0.0 %/year [1.1]; both p < 0.001) compared to pwMS with low sNfL z-scores. In multivariate models, the sNfL z-scores at M6 were associated with aLpRNFL (b = −0.19; 95% CI −0.22, −0.16; p < 0.001) and aLGCIPL (b = −0.15; 95% CI −0.18, −0.12; p < 0.001) (Figure 5). An increase in the sNfL z-score by one unit was associated with higher aLpRNFL (0.15 %/year) and aLGCIPL (0.11 %/year) (Supplemental Table 3).
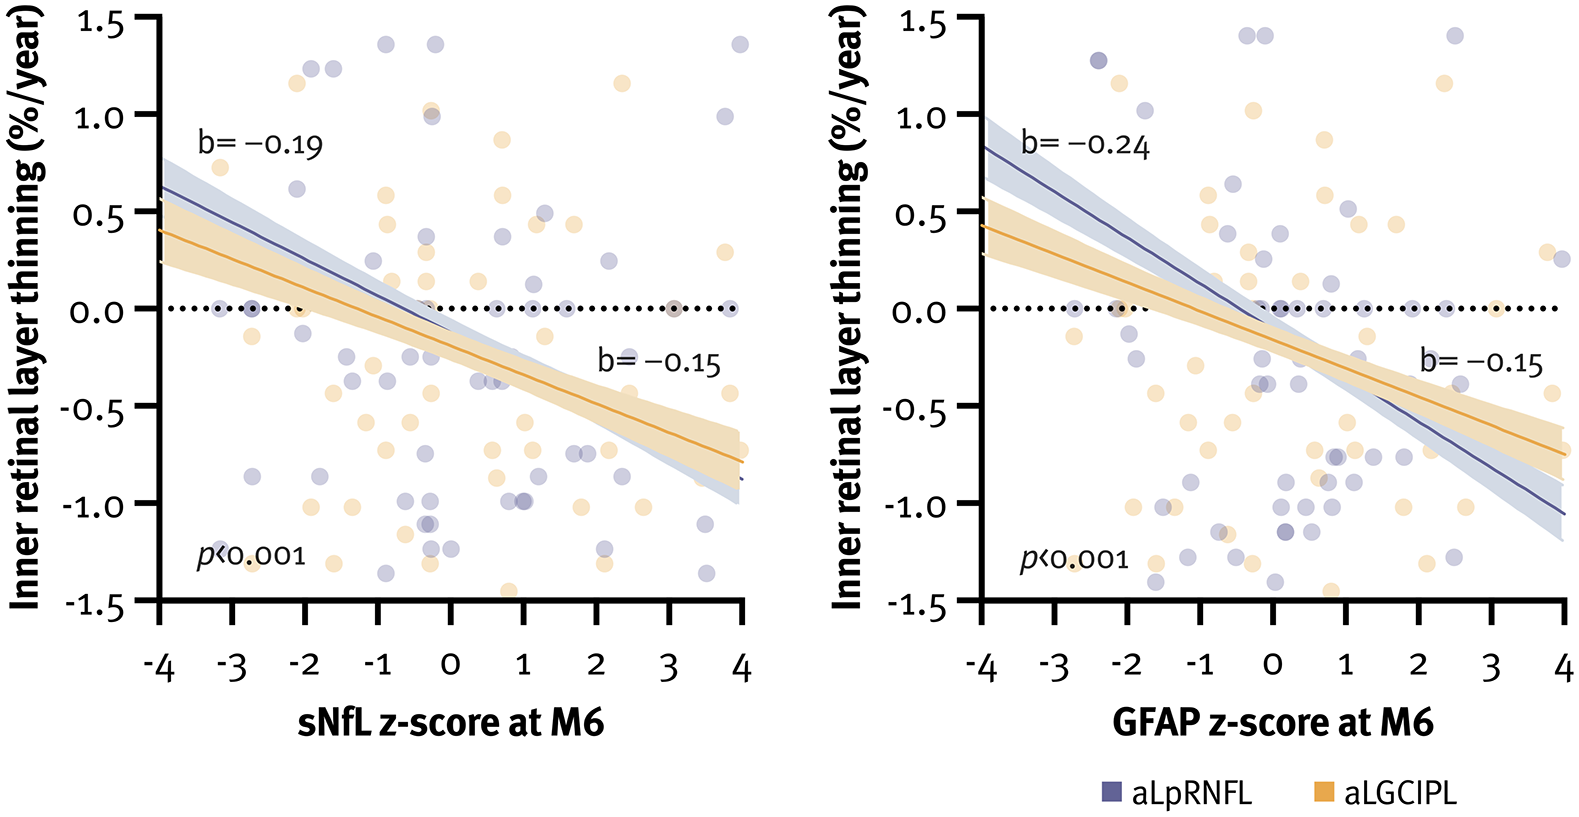
Association between sNfL and GFAP z-scores at M6 and inner retinal layer thinning.
In contrast, aLpRNFL exhibited significant correlation with GFAP z-scores at both baseline (rs = −0.06, p = 0.002) and M6 (rs = −0.30, p < 0.001) as well as with the change in GFAP z-score (rs = −0.29, p < 0.001). Conversely, aLGCIPL only correlated with GFAP z-scores at M6 (rs = −0.21, p < 0.001) and the change in GFAP z-score (rs = −0.20, p < 0.001). PwMS with high GFAP z-scores at M6 exhibited significantly higher aLpRNFL (−0.5%/year [0.9] vs −0.1%/year [1.2]) and aLGCIPL (−0.6%/year [1.0] vs −0.1%/year [1.1]; both p < 0.001). In multivariate models, GFAP z-scores at M6 were associated with aLpRNFL (b = −0.24; 95% CI −0.27, −0.21; both p < 0.001) and aLGCIPL (b = −0.15; 95% CI −0.18, −0.12; both p < 0.001) (Figure 5). An increase in the GFAP z-score by one unit was associated with higher aLpRNFL (0.18%/year) and aLGCIPL (0.11%/year) (Supplemental Table 3).
When both biomarkers were incorporated into a single model, GFAP z-score at M6 showed the strongest association with aLpRNFL and aLGCIPL, explaining up to 13.9% of their variance (Supplemental Table 3). Moreover, pwMS with low sNfL but high GFAP levels at M6 showed the most pronounced retinal thinning (Figure 6). A sensitivity analysis excluding eyes with a history of ON did not significantly alter the overall results or the impact of individual variables.
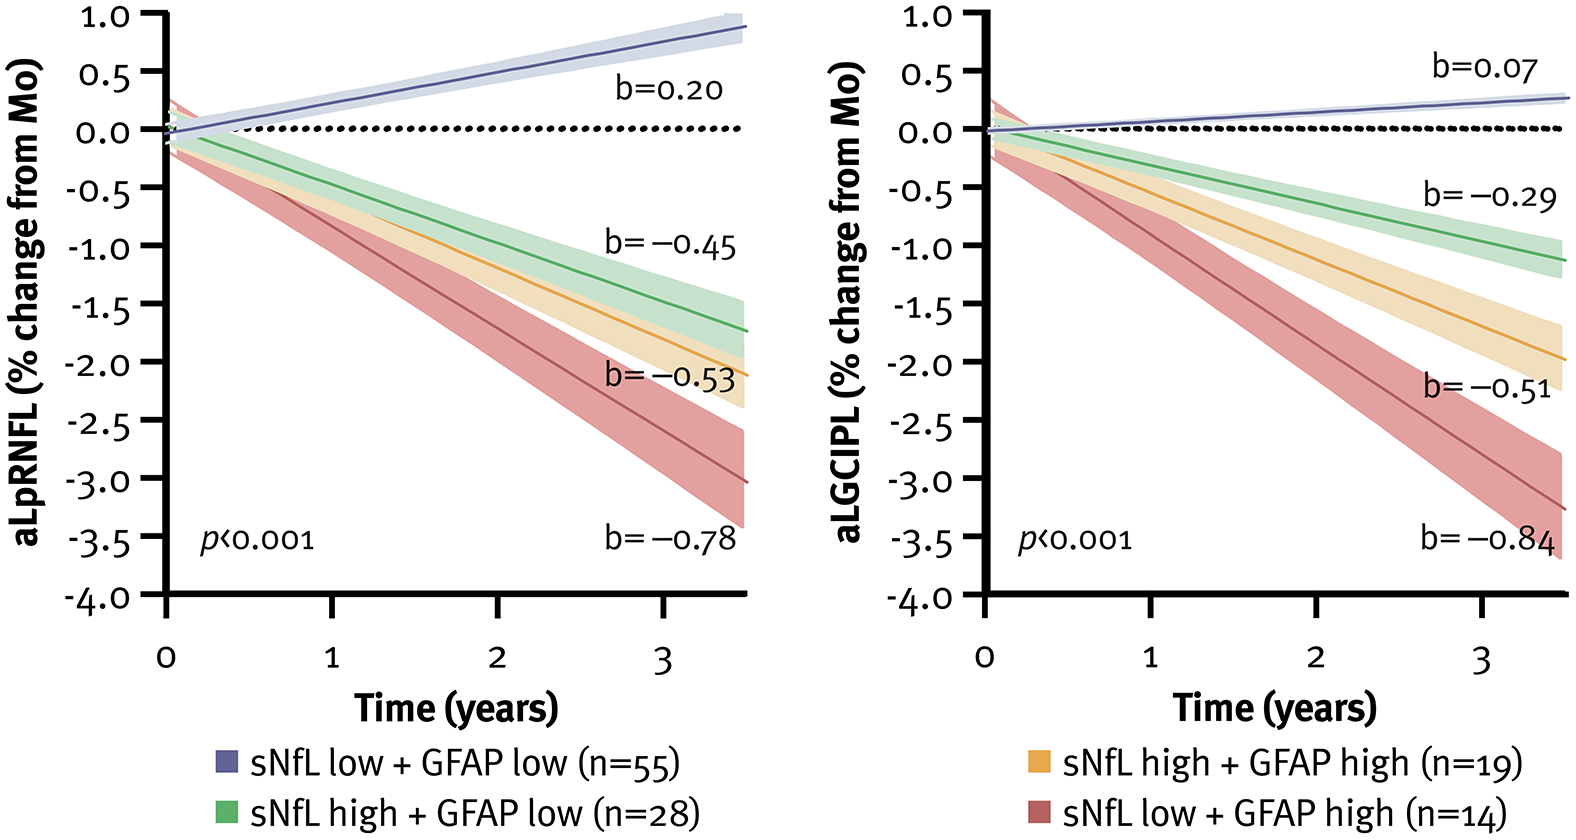
Inner retinal layer thinning according to sNfL and GFAP levels at M6, with z-score ⩾ 1.5 defined as high. aLGCIPL: annualized loss of ganglion cell-inner plexiform layer, aLpRNFL: annualized loss of peripapillary retinal nerve fibre layer, GFAP: glial fibrillary acidic protein, sNfL: serum neurofilament light chain.
Discussion
This study investigated the association between sNfL and GFAP levels, and retinal atrophy, that is, neuroaxonal damage in relapsing MS. Our findings demonstrate that both biomarkers, particularly high GFAP levels following DMT initiation, are associated with more pronounced retinal thinning.
Recently, sNfL and GFAP have emerged as fluid biomarkers reflecting axonal damage and astroglial activation.25,26 While sNfL is a well-established marker of treatment response in active MS, 27 its capacity to predict disease progression, especially when acute inflammatory is suppressed by HE-DMT, remains limited. 28 In contrast, GFAP levels have been associated with microstructural damage in the normal-appearing white matter, potentially capturing smouldering disease incompletely reflected by sNfL levels. 29 In our study, both biomarkers accounted for up to 13.9% of the variance in retinal thinning, corroborating previous findings that a substantial proportion of neuroaxonal loss remains unreflected by sNfL levels alone.6,30
In line with this, baseline sNfL and GFAP levels before DMT initiation did not correspond to neuroaxonal loss in pwMS and may not, by itself, indicate a worse prognosis, especially as they are also dependent on concurrent clinical or radiological disease activity. By approximately 6 months post-treatment initiation, such acute activity is expected to be largely suppressed by effective DMT – and if not to carry much more predictive value. 31 Persistently elevated levels after DMT initiation, may thus indicate suboptimal treatment response, resulting in accelerated retinal thinning. However, its utility predicting PIRA remains limited. 32
In contrast, elevated GFAP levels have been associated with PIRA, 33 underscoring the role of compartmentalized inflammation as a key driver of smouldering MS. 34 Unlike sNfL, the impact of DMT on GFAP levels has been less consistent. 26 In our study, GFAP levels after DMT initiation showed the strongest association with retinal thinning, particularly in pwMS who exhibited low sNfL but high GFAP levels, underscoring the potential of GFAP as a biomarker in advanced, non-active disease stages. Our data reinforce sNfL as a reliable biomarker of focal inflammatory activity, yet insufficient to fully capture the pathology driving long-term disease progression. In contrast, GFAP appears less affected by acute disease activity, highlighting its potential as a robust marker of disease progression. Interestingly, patients with elevated sNfL and GFAP levels did not exhibit substantially greater retinal thinning compared to those with elevated GFAP levels alone, indicating that additional sNfL signal may reflect noise introduced by other nonspecific pathophysiological processes. Nonetheless, larger studies are warranted to substantiate these interpretations and clarify their clinical implications.
The strengths of our study lie in its longitudinal design with biannual sNfL and GFAP measurements in a well-characterized cohort, and the use of established z-scores to adjust for covariates, addressing a key limitation identified in previous research. Moreover, implementing the rebaseline concept by performing the first OCT scan 3–6 months after treatment initiation allowed for evaluation of treatment effects on retinal thinning. 35 Notably, the latter appears significantly lower under HE-DMT, suggesting that OCT can effectively differentiate the extent of subclinical neuroaxonal degeneration under treatment. 36
Nonetheless, several limitations warrant consideration. The relatively small sample size and missing data introduced a number of potential biases, partially mitigated by data imputation and sensitivity analyses. Non-randomized, unblinded treatment allocation raises the possibility of indication bias. OCT scans were performed at variable intervals, which was partially addressed by using linear regression models, though this may not accurately reflect the non-linear trajectory of retinal thinning, which appears most pronounced early in the disease but decelerates over time, reaching a plateau with longer disease duration. 37 Importantly, the paradoxical retinal ‘thickening’ observed in pwMS with low sNfL and GFAP levels reflects statistical noise within the expected measurement error rather than a biological phenomenon. Although the rebaseline approach accounted for treatment effects, variability within the 3- to 6-month window may have inadvertently introduced potential bias. Also, while the associations of serum biomarkers with pRNFL and GCIPL thinning differed in strength and significance, these results were derived from separate regression models and should not be interpreted as a direct comparison between the two retinal layers; rather, the variability may reflect methodological factors or statistical fluctuation, and does not necessarily indicate a true difference in biological sensitivity.
Furthermore, retinal atrophy is not MS-specific and may results from comorbidities such as glaucoma or diabetic retinopathy, limiting the generalizability of our findings. Moreover, magnetic resonance imaging (MRI) parameters of disease activity, which could potentially impact sNfL and GFAP measurements, were insufficiently standardized for inclusion. Finally, the relatively short follow-up limits interpretation of our results to mid-term prognosis, as evidenced by the low rate of PIRA. Since sNfL and GFAP levels explained only a portion of the variability in retinal thinning, other contributing factors remain to be identified. The sample size also limited exploration of biomarker trajectories – e.g. those with persistently high sNfL and GFAP levels and those with initially low levels but a significant increase over time – which may help identify more aggressive disease phenotypes.
In conclusion, both sNfL and GFAP levels are associated with retinal thinning in pwMS, reinforcing their value as biomarkers of neuroaxonal damage. Notably, the stronger predictive value of GFAP levels suggests its superiority as a prognostic tool, particularly in forecasting retinal thinning as a marker of disease progression. Future large-scale, multicentric studies integrating both biomarkers will be essential for enhancing the accuracy of mid- to long-term disease trajectory prediction.
Supplemental Material
sj-docx-1-msj-10.1177_13524585251360972 – Supplemental material for Serum neurofilament light chain and glial fibrillary acidic protein levels are associated with inner retinal layer thinning in multiple sclerosis
Supplemental material, sj-docx-1-msj-10.1177_13524585251360972 for Serum neurofilament light chain and glial fibrillary acidic protein levels are associated with inner retinal layer thinning in multiple sclerosis by Nik Krajnc, Markus Ponleitner, Fabian Föttinger, Fritz Leutmezer, Stefan Macher, Tobias Monschein, Paulus Rommer, Barbara Kornek, Christiane Schmied, Karin Zebenholzer, Gudrun Zulehner, Tobias Zrzavy, Thomas Berger, Berthold Pemp and Gabriel Bsteh in Multiple Sclerosis Journal
Footnotes
Author contribution
Declaration of Conflicting Interests
The author(s) declared the following potential conflicts of interest with respect to the research, authorship and/or publication of this article:
Funding
The author(s) disclosed receipt of the following financial support for the research, authorship and/or publication of this article: This study was partially funded by the Austrian MS Research Society.
ORCID iDs
Supplemental Material
Supplemental material for this article is available online.
References
Supplementary Material
Please find the following supplemental material available below.
For Open Access articles published under a Creative Commons License, all supplemental material carries the same license as the article it is associated with.
For non-Open Access articles published, all supplemental material carries a non-exclusive license, and permission requests for re-use of supplemental material or any part of supplemental material shall be sent directly to the copyright owner as specified in the copyright notice associated with the article.