
Abstract
Background:
The understanding of disease pathophysiology is pivotal for tailored treatments. The spatial distribution of brain damage relies on the regional antigen expression and the local balance of susceptibility and protective elements.
Objective:
As proof-of-concept, we investigated the spatial association between brain damage and gene expression in aquaporin-4-IgG-positive neuromyelitis optica spectrum disorder (AQP4 + NMOSD).
Methods:
In this multicenter cross-sectional study, 90 AQP4 + NMOSD patients and 94 age-matched healthy controls underwent a brain magnetic resonance imaging (MRI). We used T2-hyperintense lesion probability maps and white/gray matter atrophy as proxies of inflammation and neurodegeneration. The association with the expression of 266 candidate genes was obtained with the Multimodal Environment for Neuroimaging and Genomic Analysis platform. A functional-enrichment analysis investigated overrepresented biological processes.
Results:
In AQP4 + NMOSD, T2-hyperintense lesions were mainly periventricular; atrophy mostly involved the visual pathway. The expression of AQP4 and complement (C4a and C5) was associated with both inflammation and neurodegeneration. Complement activation and regulation/uptake of the insulin-like growth factor were the most relevant enriched pathways. Nonspecific pathways related to DNA synthesis and repair were associated with brain atrophy.
Conclusions:
Quantitative MRI and gene expression atlas identified the key elements of AQP4 + NMOSD pathophysiology. This analysis could help in understanding the pathophysiology of antibody-mediated autoimmune disorders.
Introduction
As demonstrated in aquaporin-4 (AQP4)-IgG positive neuromyelitis optica spectrum disorder (AQP4 + NMOSD), knowledge of the pathophysiology of autoimmune neurological conditions is the most important step for the development of tailored treatments.1,2
Summarizing, a pro-inflammatory environment and the peripheral loss of self-tolerance lead to the production of autoreactive IgGs by plasmablasts. These antibodies enter the central nervous system (CNS) and bind to the AQP4 water channel expressed on the astrocytes end-feet, where they elicit the classical pathway of the complement cascade with primary astrocytes’ damage. Collateral local recruitment of granulocytes determines secondary injury to the bystander tissues. 3
This model was proven by the extraordinary success of the phase III randomized clinical trials of drugs targeting AQP4 + NMOSD pathophysiological pillars: inflammation (i.e. interleukin-6 (IL-6) receptor inhibitors),4,5 antibody production (i.e. anti-CD19), 6 and complement (i.e. complement inhibitors).7,8
Antibody-associated autoimmune conditions target antigens with a different expression across CNS regions. Spatial distribution of damage is likely dependent on both regional antigen expression and local balance between protective and susceptibility factors. Preclinical studies demonstrated that AQP4 expression in tissues defines the susceptibility to AQP4 + NMOSD-related damage. In fact, the expression of the AQP4 messenger RNA and proteins are significantly higher in the optic nerve and spinal cord, 9 which are the main targets of the disease. Similarly, magnetic resonance imaging (MRI) studies showed that focal brain lesions typically locate at areas with high AQP4 expression, such as the periependymal lying and the area postrema. 10 Atrophy has been reported as well, 11 but less is known about the drivers of neurodegeneration in AQP4 + NMOSD.
Transcriptomic atlases enclosing quantitative gene expression at different brain locations such as the Allen Human Brain Atlas (AHBA), 12 are currently available. They can be linked to the Montreal National Institute space (MNI), the standard reference for MRI, through novel computational tools such as the Multimodal Environment for Neuroimaging and Genomic Analysis (MENGA) platform. 13
Nowadays, new technologies are speeding up antibody discovery, but the understanding of the underlying pathophysiology and consequent identification of therapeutic targets is challenging.
In this study, we tried to establish whether the joint application of quantitative MRI and human brain gene expression atlases can underpin key elements of disease pathogenesis through the analysis of damage localization. Given the knowledge of its pathophysiology, we used AQP4 + NMOSD as a proof-of-concept disorder. In this analysis, CNS damage caused by inflammation and neurodegeneration were represented by T2-hyperintense lesions and regional atrophy, respectively.
Materials and methods
Participants
We included brain MRI scans from 80 consecutive AQP4 + NMOSD patients enrolled in our research protocol. Patients were diagnosed according to the 2015 diagnostic criteria 14 (AQP4-IgG tested using a cell-based assay) 14 and were clinically stable for at least 1 month before the MRI acquisition. A total of 94 age- and scanner-matched healthy controls (HC) were also included.
Two European centers were involved: Milan (92 subjects: 40 AQP4 + NMOSD and 52 HC) and Belgrade (82 subjects: 40 AQP4 + NMOSD and 42 HC). HC were recruited among research or hospital personnel, students, friends, and acquaintances. By definition, they did not have any major health condition, including neurological disorders. Additional exclusion criteria for all participants, as per our protocol, were alcohol or drug abuse, history of head trauma, psychiatric comorbidities, and contraindications to MRI. On the day of the MRI acquisition, patients underwent a neurological examination, including the assessment of the Expanded Disability Status Scale (EDSS) 15 and history collection.
MRI acquisition protocol
Using two 3.0T scanners (Milan: Ingenia CX and Intera Philips Medical Systems) and a 1.5T scanner (Belgrade: Achieva Philips Medical System), the following brain sequences were collected from all subjects in a single session:
T2-weighted images: axial dual-echo turbo spin-echo (TSE; Intera scanner in Milan and Belgrade) or sagittal 3D fluid attenuated inversion recovery (FLAIR; Ingenia CX scanner in Milan);
3D T1-weighted images: axial 3D T1-weighted fast gradient-echo (Intera scanner in Milan), axial 3D T1-weighted turbo field echo (Belgrade), and sagittal 3D T1-weighted magnetization-prepared rapid gradient-echo (Ingenia scanner in Milan).
Details of the MRI protocols are available in Table 1.
Detailed description of the standardized MRI protocol at each participating center and scanner.
3D: three-dimensional; FFE: fast field echo; FLAIR: fluid attenuated inversion recovery; MPRAGE: magnetization prepared rapid gradient echo; T: tesla; T1-w: T1-weighted sequences; T2-w: T2-weighted sequences; TE: echo time; TFE: turbo field echo; TI: inversion time; TR: relaxation time; TSE: turbo spin-echo.
MRI analysis
Conventional MRI analysis
Focal T2-hyperintense white matter lesions were segmented on T2-weighted images using a fully automated approach based on two 3D patch-wise convolutional neural networks 16 (Milan, Ingenia scanner) or a local thresholding segmentation technique (Jim 8.0 Xinapse System Ltd.; Milan, Intera scanner, and Belgrade) to obtain lesion masks and volumes. Head-size normalized volumes of the brain, gray matter, and white matter were measured after T1-hypointense lesion refilling using the FSL SIENAx software. 17
T2-hyperintense lesion probability map in AQP4 + NMOSD patients
By exploiting the transformation matrix of the voxel-based morphometry (VBM) (refer to the “VBM” section for further details), we coregistered the single-subject T2-lesion masks to the standard space, obtaining a lesion probability map (i.e. 0%–100% probability of a voxel of being involved by a lesion). Since this specific analysis only included the subgroup of AQP4 + NMOSD patients with brain lesions, and the lesion volume in AQP4 + NMOSD is usually moderate, the lesion mask of the right hemisphere was mirrored on the left hemisphere to strengthen statistical power (i.e. if corresponding voxels on the two hemispheres were involved by a lesion, the probability of having a lesion in that voxel was calculated as the sum of both probabilities). The choice of the left hemisphere was driven by the fact that most of the AHBA donors were sampled only in the left hemisphere.
VBM analysis
VBM analysis was used to identify regions of significant gray matter and white matter atrophy in AQP4 + NMOSD patients compared with HC. The opposite contrast was also performed as negative control.
3D T1-weighted images were segmented using the Segmentation tool available in SPM12 and normalized through the Diffeomorphic Anatomical Registration using Exponentiated Lie Algebra (DARTEL) registration method. 18 Gray and white matter maps were modulated and smoothed (3D 8-mm Gaussian kernel). Between-group comparisons were run with a two-factor (i.e. AQP4 + NMOSD and HC) and three-level (i.e. scanners) ANOVA, with age, sex, and the SIENAX-derived V-scaling factor as covariates; p values < 0.001 were considered significant.
Spatial associations between image-derived maps and gene expression
Brain-wide gene expression profiles were obtained from the AHBA, which provides gene expression data for more than 20,000 genes from about 3700 spatially distinct tissue samples obtained from six neurotypical adult brains. 12 We preselected disease-specific genes of interest using the Open Target Platform and the search term: “Neuromyelitis optica” (https://platform.opentargets.org/disease/) 19 and obtained a list of 266 candidate genes (Table 2) included in both the AHBA database and the MENGA platform (see below).
List of candidate genes analyzed in the study with the overall association score (i.e. degree of association with AQP4 + NMOSD according to the Open Target Platform).
To investigate the spatial association between imaging-derived maps (i.e. T2-hyperintense lesion probability map and the VBM-derived T-maps of gray and white matter atrophy) and candidate gene expression, we used the MENGA platform 13 following published guidelines. 20
To reduce variability and ensure reproducibility 20 the transcriptomic data from the AHBA database underwent the following steps:
Representative probe selection to index expression for a gene: one probe was collected as representative of a specific gene transcript for all donors; 71% of genes in the AHBA were measured with at least two probes. Thus, probe selection was performed by evaluating the distribution of the expression values and the one with the most symmetric and least skewed profile was selected to avoid the nonlinearity effect on the microarray measures. 13
Normalization of the expression measure by inter-individual differences (https://github.com/BMHLab/AHBAprocessing): to address donor-specific effects and remove the inter-individual differences in expression measure, each gene expression value was normalized across brain regions separately in each donor to reflect its relative expression across different brain regions. Then, Z-score normalization was obtained as follows

where
Image maps in the MNI space were then resampled into the AHBA coordinates, separately for each donor, to obtain image-to-sample spatial correspondence according to MNI coordinates of each sample provided by the AHBA. Image data were normalized to z-scores and each image sample was estimated as the average of the voxels within a 3D window of a specified size (here set to 5 mm) centered on the MNI coordinates of the genomic sample.
Spatial association between imaging and genomic data were then assessed with MENGA platform using a weighted multiple regression, with the directionality of the imaging-genomic data correlation provided as well.
The chance likelihood, a measure of cross-correlation reliability, was estimated as 13

where
Thus, smaller values of the chance likelihood denote a higher reliability of the obtained results. In this work, we set a cut-off < 0.05 likelihood to assess significant spatial associations between brain damage and gene expression.
Enrichment analysis. To better understand functionalities, we performed a functional-enrichment analysis according to the Reactome pathway database 21 using the g:Profiler platform (https://biit.cs.ut.ee/gprofiler/gost). 22 Briefly, the list of the genes significantly associated with the different types of structural damage was used as input to the platform, which identifies overrepresented biological processes through an over-representation analysis (threshold: 5–2500 genes per enriched pathway). Only significant results at Bonferroni-corrected threshold (p < 0.05) were retained. The Cytoscape software version 3.9.0 was used to visualize the interactions between the enriched pathways. 23
Statistical analysis
Demographic, clinical, and conventional MRI variables were compared with Mann–Whitney U-test or independent samples t-test (quantitative variables, based on normality assumption) or Pearson’s Chi-square test (categorical variables).
Results
Demographic, clinical, and conventional MRI features of the study population
AQP4 + NMOSD patients and HC had similar age, but female sex was more common in patients, as per disease epidemiology. The proportion of participants acquired on each scanner was balanced in between patients and HC. AQP4 + NMOSD patients had whole brain and gray matter atrophy (Table 3).
Demographic, clinical, and conventional MRI features of the study population. Quantitative variables are presented as mean (standard deviation) or median (interquartile range), according to the normality assumption; categorical variables are presented as frequency (percentage). If not otherwise specified, p values refer to Mann–Whitney U-test (quantitative variables) or Pearson’s Chi-square test (categorical variables).
AQP4 + NMOSD: aquaporin-4-IgG-positive neuromyelitis optica spectrum disorder; EDSS: expanded disability status scale; HC: healthy controls; SD: standard deviation; IQR: interquartile range.
Bold is for significant values.
Independent sample t-test.
Only patients with a history of optic neuritis.
T2-hyperintense lesion probability map
Brain T2-hyperintense lesions were detected in 59/80 patients (74%) and were mainly located in the periventricular white matter. Additional locations were the subcortical white matter, corpus callosum, and the periaqueductal gray (Figure 1).
Spatial location of T2-hyperintense lesions, gray matter atrophy, and white matter atrophy in AQP4 + NMOSD patients. Atrophy T maps refer to age-, sex-, scanner-, and V-scaling-adjusted full factorial models (AQP4 + NMOSD vs HC, p < 0.001). Numbers refer to the z coordinates according to the MNI system.
Gray and white matter atrophy—VBM
Compared with HC, AQP4 + NMOSD patients had significant white matter atrophy selectively involving the optic tracts, bilaterally (Figure 1). Gray matter atrophy was significant in the visual cortex (lingual gyrus, calcarine fissure), insula, prefrontal cortex (orbitofrontal gyrus), and lateral geniculate nuclei of the thalami (Figure 1). No voxels of significant atrophy were found in HC compared with AQP4 + NMOSD patients.
Spatial association between gene expression and brain damage in AQP4 + NMOSD patients
Since white matter atrophy selectively involved the optic tracts, which are not sampled in the AHBA, the VBM-derived map of white matter atrophy was not included in this analysis, which therefore, was run on the T2-hyperintense lesion probability maps and the VBM-derived map of gray matter atrophy only. Significant associations are reported in Figure 2.
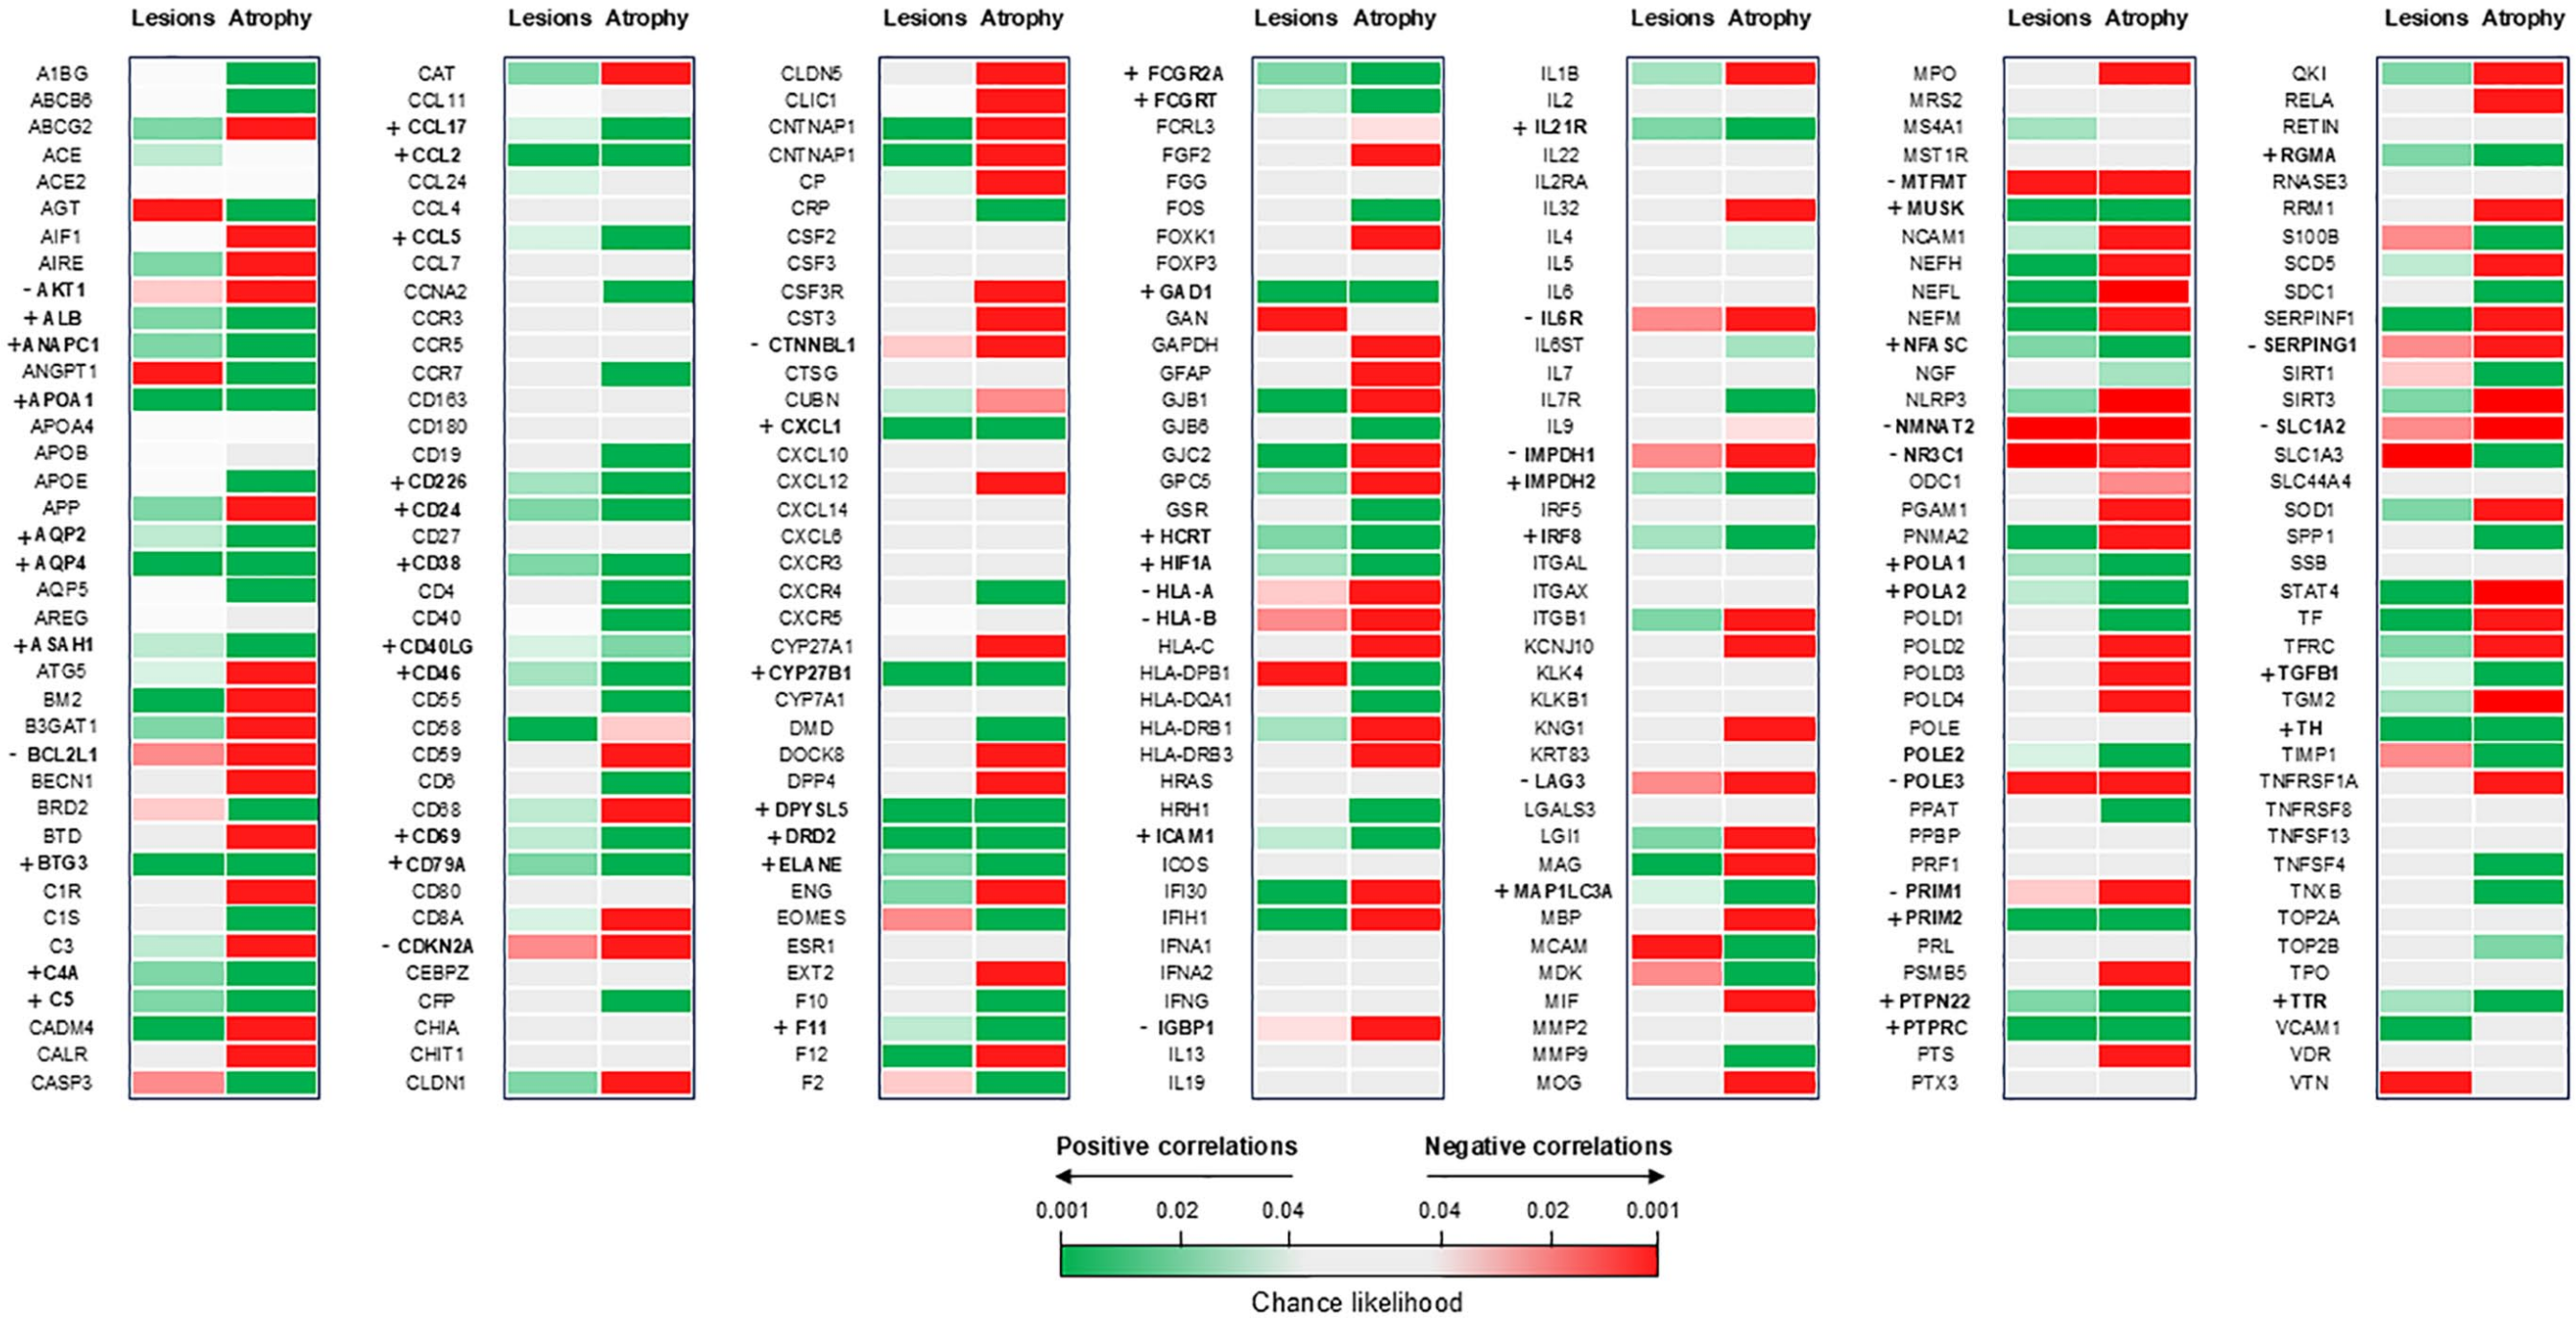
Heatmap of spatial association between gene expression, T2-hyperintense lesions, and gray matter atrophy in AQP4 + NMOSD patients. Positive correlations (i.e. the highest the expression of the gene, the highest the probability of a focal lesion/T value of gray matter atrophy) are color-coded green, while negative correlations (i.e. the highest the expression of the gene, the lowest the probability of a focal lesion/T value of gray matter atrophy) are color-coded red. Nonsignificant correlations are light gray. Genes positively correlated with both lesions and gray matter atrophy are shown in bold and indicated by a+; genes negative correlated with both lesions and gray matter atrophy are shown in bold and indicated by a-.
Both T2-hyperintense lesions and gray matter atrophy were positively associated with AQP4 expression. When analyzing the targets of the Food and Drug Administration (FDA)-approved treatments for AQP4 + NMOSD, we found that a higher expression of complement factors (i.e. C5 and C4a) was also associated with both T2-hyperintense lesions and gray matter atrophy. CD19 expression was positively associated with gray matter atrophy, while components of the IL6 pathway showed mixed or nonsignificant associations.
A few genes resulted negatively associated with both T2-hyperintense lesions and atrophy, including some involved in immune system/complement inhibition (e.g. LAG3, SERPING1) and axonal survival (e.g. NMNAT2).
Gene enrichment analysis
Overall, the enrichment analysis disclosed a limited number of enriched biological processes spatially associated with the presence of T2-hyperintense lesions (Figure 3), while gray matter atrophy was associated with a high number of biological processes, mainly related to DNA synthesis and repair (Figure 4).
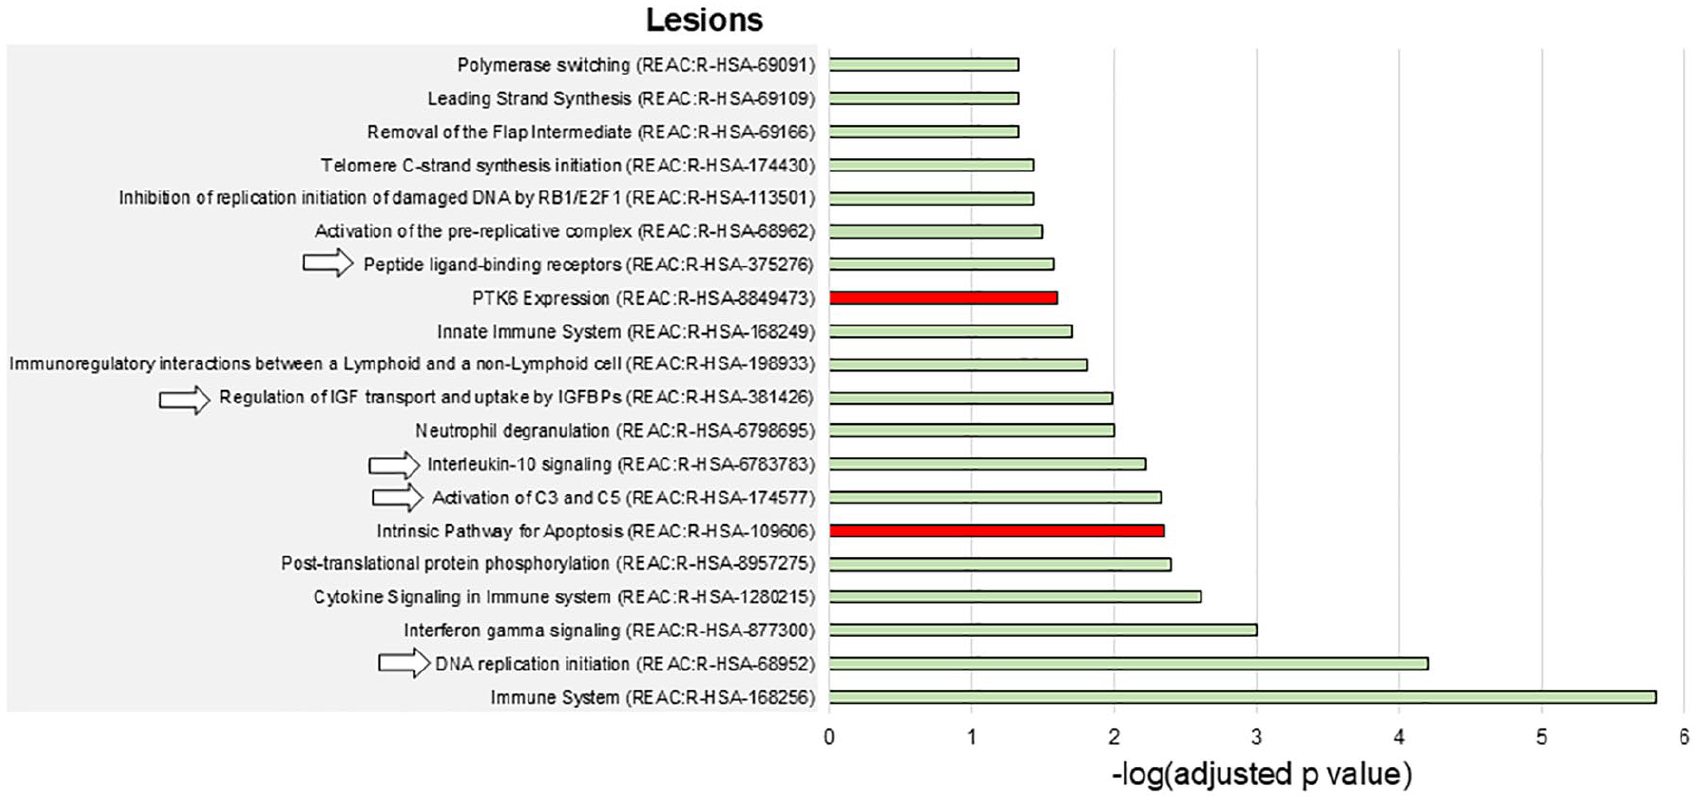
Enriched biological pathways associated with T2-hyperintense lesions in AQP4 + NMOSD. The barcharts show the enriched biological pathways positively (green bars) or negatively (red bars) associated with T2-hyperintense lesions in AQP4 + NMOSD. Numbers on the x axes are -log(Bonferroni-adjusted p values) of the enrichment analysis. The pathways indicated by arrows are also positively associated with the presence of gray matter atrophy. None of the pathways negatively associated with T2-hyperintense lesions was also negatively associated with gray matter atrophy.
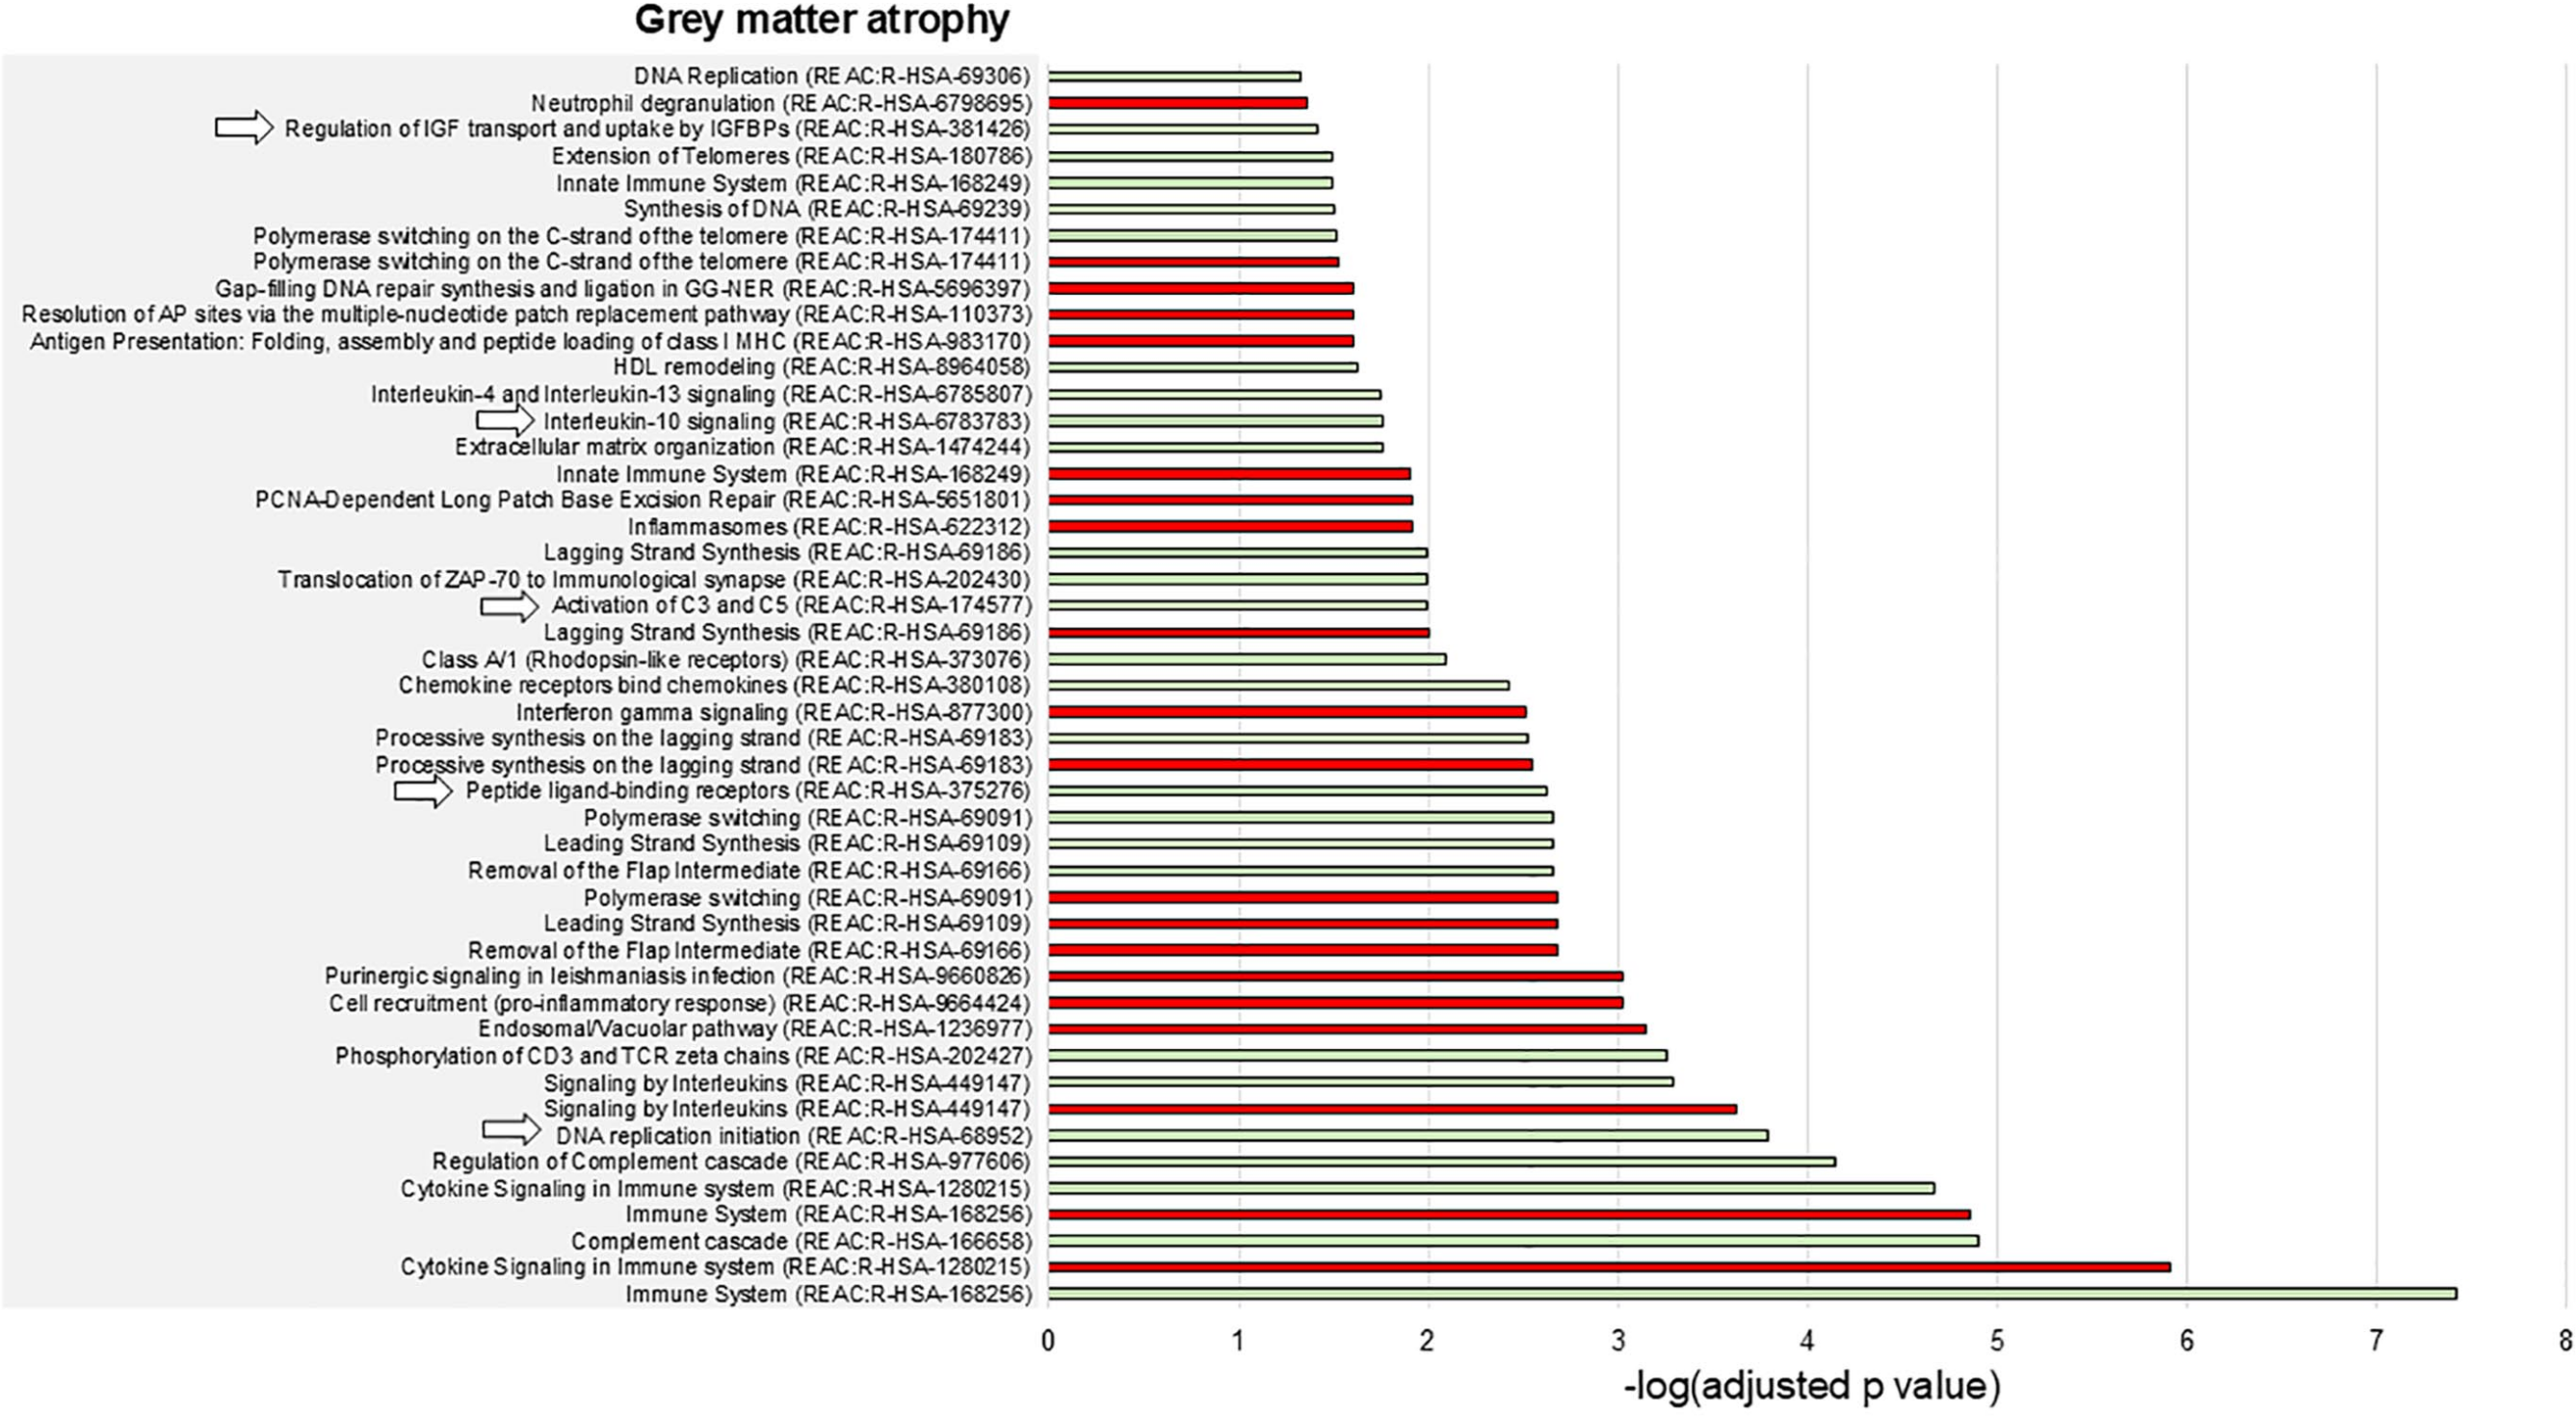
Enriched biological pathways associated with gray matter atrophy in AQP4 + NMOSD. The barcharts show the enriched biological pathways positively (green bars) or negatively (red bars) associated with gray matter atrophy in AQP4 + NMOSD. Numbers on the x axes are -log(Bonferroni-adjusted p values) of the enrichment analysis. The pathways indicated by arrows are also positively associated with the presence of T2-hyperintense lesions. None of the pathways negatively associated with gray matter atrophy was also negatively associated with T2-hyperintense lesions.
Complement activation, the regulation of IGF and uptake by IGFBPs, and IL10 signaling were positively associated with both T2-hyperintense lesions and gray matter atrophy (Figures 3 and 4). Broader processes (i.e. DNA replication initiation and the response to peptide-ligand binding receptors) showed a positive association with both types of damage as well.
The network of the enriched biological processes disclosed four main clusters: pathways within (1) the immune system, (2) mechanisms of DNA synthesis and repair, (3) processes of peptide-ligand binding and chemokines, and (4) regulation of the insulin-like growth factor (IGF) transport and uptake by insulin-like growth factor binding proteins (IGFBPs; Figure 5).
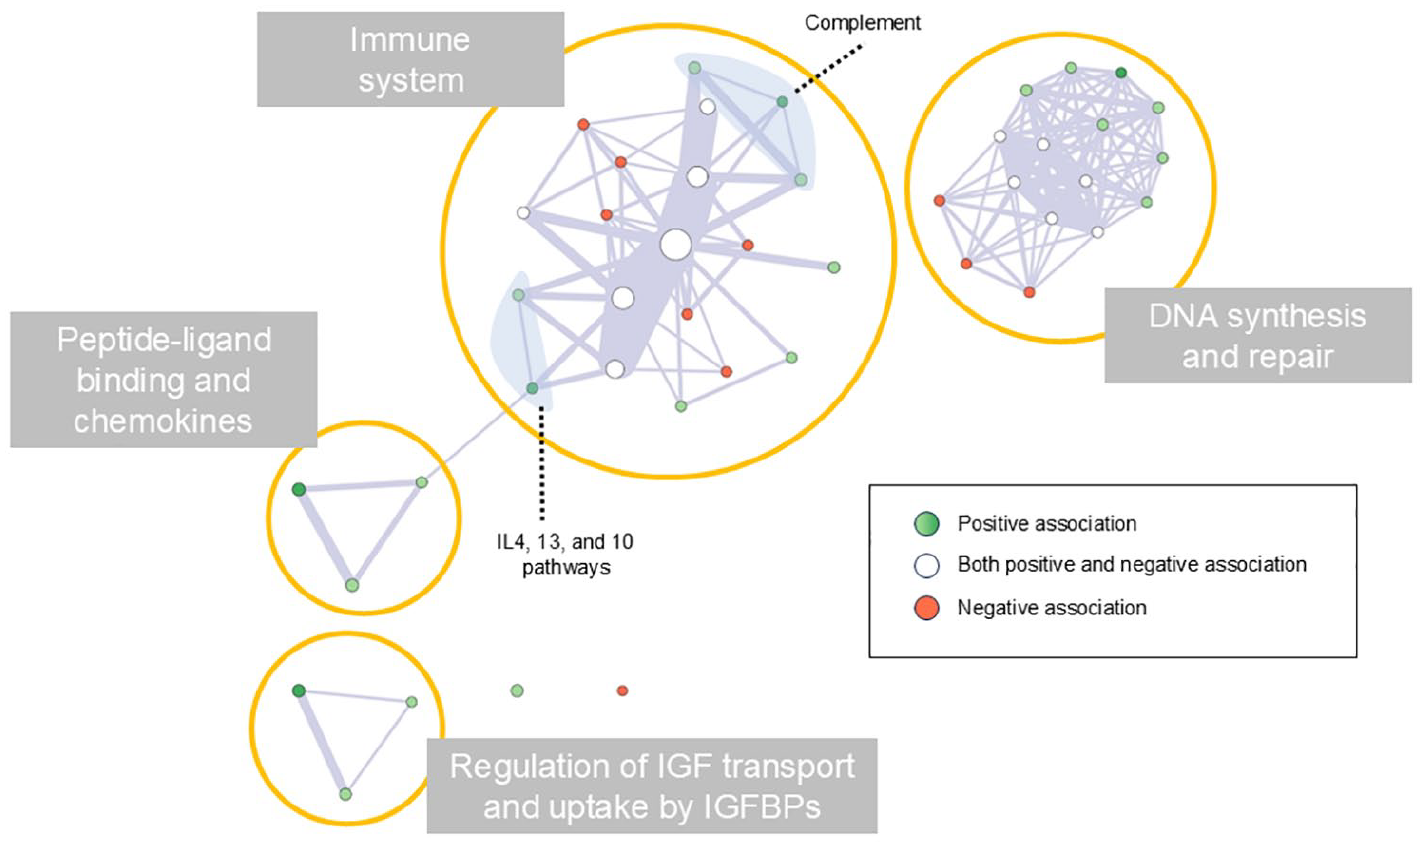
Network of the enriched biological pathways involved in brain damage of AQP4 + NMOSD. Each node represents one of the enriched biological pathways, and their size represents the size of the pathway. Edge width represents the number of genes shared by connected pathways. Green nodes indicate enriched pathways positively associated with the development of brain damage (dark green indicates the pathways involved in both T2-hyperintense lesions and gray matter atrophy formation). Red nodes indicate enriched pathways negatively associated with the development of brain damage. White nodes indicate enriched pathways showing both positive and negative associations with brain damage.
Discussion
The understanding of disease pathogenesis is a pivotal step for the identification of tailored treatment strategies. In this proof-of-concept study, we used a joint methodology merging quantitative measures of brain damage and the a-priori mapping of gene expression in the human brain to assess in-vivo correlates of AQP4 + NMOSD, an autoimmune neurological disorder of known pathophysiology.
Our results confirmed the key role of AQP4 expression for the presence of brain lesions and atrophy, but were also able to identify the relevant biological pathways, including the activation of the complement cascade, the regulation of IGF and uptake by IGFBPs, and IL-4, -13, and -10 signaling.
The activation of the complement cascade and the recruitment of granulocytes at the site of damage were already identified as key steps of AQP4 + NMOSD pathophysiology, as demonstrated in pathology, 2 explaining the spatial association with eosinophils chemoattractants such as IL-4 and IL-13. Neutrophil degranulation was associated with lesion formation as well.
Treatments inhibiting the complement cascade, such as eculizumab and ravulizumab, are highly effective in AQP4 + NMOSD,7,24 and our results confirm the central role of complement in the development of brain damage. As expected, results were less explanatory when considering targets of treatments acting outside the CNS, such as IL-6 and CD19. This approach merges local brain transcriptomic and the topography of brain damage. Therefore, it is not suitable for analyzing dynamic phenomena or effector pathways occurring outside the CNS. Along this line, it is important to mention that neuroinflammation and tissue damage as well as tissue healing are able to trigger changes in tissue gene expression.25,26 Such changes cannot be underpinned by our methodology due to its cross-sectional nature and to the use of a static atlas of gene expression derived from healthy donors, where these changes are not expected.
In addition, the MRI scans of our patients were acquired during disease remission. Recent studies demonstrated that about 5% of brain lesions completely resolve and almost invariably reduce in size after acute AQP4 + NMOSD attacks. 27 Therefore, we might have missed associations with acute inflammatory lesions.
We also found a significant spatial association between IL-10 signaling and brain damage, but the literature on this topic is controversial. Despite the classical interpretation of IL-10 as an anti-inflammatory molecule, the recent SARS-CoV-2 pandemic has questioned this hypothesis showing that high IL-10 levels were associated with a more severe disease course. 28
Brain damage was also associated with the regulation of IGF transport and uptake by IGPBPs. This process was not previously investigated in AQP4 + NMOSD, but experimental data highlighted that IGF dysregulation (i.e. reduction) fuels autoimmunity through T reg unbalance, 29 and hampers remyelination. 30 Astrocytes produce IGF in response to brain injury. 31 Therefore, this protective mechanism might be deficient in AQP4 + NMOSD.
In general, the biological processes colocalizing with brain lesions (i.e. a proxy of focal inflammatory damage) were specific of AQP4 + NMOSD pathogenesis. In contrast, gray matter atrophy (i.e. a proxy of neurodegenerative damage) was associated with many pathways, often nonspecific and sometimes with unexpected directions. In our cohort, (where most patients had prior history of optic neuritis) brain atrophy mainly involved structures within the visual pathways such as the optic tracts and the occipital cortex, supporting the secondary nature of this phenomenon. Such distribution overlaps in the large majority of studies (including multicentric studies) exploring this aspect in AQP4 + NMOSD, supporting its generalizability. 11 Therefore, although the presence of AQP4 and the consequent trigger of the complement cascade might determine the development of local atrophy as well, similarly to what was observed in the spinal cord, 32 our interpretation is that this type of imaging analysis is not suitable for the study of secondary mechanisms of damage, because their localization is better explained by the anatomy of functional pathways (such as the visual pathway) rather than by local tissue gene expression.
Finally, a few potentially protective genes, emerged. Among them, those exerting a negative effect on immune pathways activation, such as the T-cell inhibitor lymphocyte activation gene 3 (LAG3) and the complement inhibitor serpin family G member 1 (SERPING1) seem particularly promising. LAG3 is a key warrantor of immuno-tolerance, to the point that inhibitory monoclonal antibodies are currently approved for cancer immunotherapy. 33 The gene SERPING1 encodes the C1 esterase inhibitor, which inhibits both the classical and lectin complement pathways. Its mutations are associated with hereditary angioedema, highlighting its central role in complement pathways regulation. 34 Another interesting gene is the nicotinamide mononucleotide adenylyltransferase 2 (NMNAT2), which localizes in axons and inhibits wallerian degeneration. A recent study has proved it as a potential therapeutic target against retinal ganglion cell neurodegeneration. 35 However, future research is needed to support their potential therapeutic role in AQP4 + NMOSD.
Moving to the main limitations of the study, we acknowledge the cross-sectional design and the abovementioned nuisance effect of lesion resolution. Unfortunately, biological samples of patients were unavailable at our facility, hence a biological confirmation of this approach is lacking. However, our approach was able to identify complement activation as one of the most relevant biological processes associated with brain damage in AQP4 + NMOSD, which was never shown before.
Overall, we believe that the importance of this study is not to be found in the results per se, but in its translational potential. AQP4 + NMOSD represents a unique research scenario where the pathogenetic element and pathophysiology are already known and proven by the efficacy of tailored treatments. Therefore, it can be used as a research model, where confirmatory results support its application to other autoimmune disorders.
Future investigations will clarify the translational power of this approach, possibly integrating results with patients’ genotyping, the measurement of serum or cerebrospinal fluid (CSF) cytokines, and biomarkers of neuronal loss.
Supplemental Material
sj-docx-1-msj-10.1177_13524585241307154 – Supplemental material for Use of brain MRI and gene expression atlases to reconstruct the pathophysiology of autoimmune neurological disorders: The proof-of-concept of NMOSD
Supplemental material, sj-docx-1-msj-10.1177_13524585241307154 for Use of brain MRI and gene expression atlases to reconstruct the pathophysiology of autoimmune neurological disorders: The proof-of-concept of NMOSD by Laura Cacciaguerra, Loredana Storelli, Elisabetta Pagani, Paolo Preziosa, Sharlota Mesaros, Vittorio Martinelli, Lucia Moiola, Marta Radaelli, Jovana Ivanovic, Olivera Tamas, Jelena Drulovic, Massimo Filippi and Maria A Rocca in Multiple Sclerosis Journal
Footnotes
Author Contributions
L.C., L.S., and E.P. were responsible for the study concept, data analysis, statistical analysis, and drafting/revising the manuscript. P.P. was responsible for drafting/revising the manuscript. S.M., V.M., L.M., M.R., J.I., O.T., and J.D. were responsible for patient recruitment, clinical assessment, and drafting/revising the manuscript. M.F. and M.A.R. were responsible for the study concept and drafting/revising the manuscript. All authors have approved the final version of the manuscript.
Data Availability Statement
The anonymized dataset used and analyzed in the current study is available from the corresponding author upon reasonable request.
Declaration of Conflicting Interests
The author(s) declared the following potential conflicts of interest with respect to the research, authorship, and/or publication of this article: L.C. received speaker and consultant honoraria from ACCMED, Roche, BMS Celgene, and Sanofi. L.S. received grants and contracts from FISM—Fondazione Italiana Sclerosi Multipla—within a fellowship program (cod. 2019/BR/009) and received speakers’ honoraria from Biogen. E.P. received speaker honoraria from Biogen Idec. P.P. received speaker honoraria from Roche, Biogen, Novartis, Merck Serono, Bristol-Myers Squibb, Genzyme, Horizon, and Sanofi; he received research support from the Italian Ministry of Health and Fondazione Italiana Sclerosi Multipla. S.M. has been an advisor or speaker for Medis, Merck, Teva, Hemofarm, and Roche. V.M. received honoraria for consulting services or speaking activity from Biogen, Merck, Novartis, TEVA, Almirall, and Sanofi. L.M. received compensation for speaking activities, and/or consulting services from Merck, Biogen, Novartis, Roche, Sanofi, and TEVA. M.R. reports no disclosures. J.I. reports no disclosures. O.T. has been a speaker for Medis, Merck, Teva, Hemofarm, Novartis, and Roche. J.D. has been an advisor or speaker for Bayer HealthCare, Sanofi-Genzyme, Medis, Merck, Teva, Novartis, Biogen, Hemofarm, and Roche. M.F. is Editor-in-Chief of the Journal of Neurology, Associate Editor of Human Brain Mapping, Neurological Sciences, and Radiology; he received compensation for consulting services from Alexion, Almirall, Biogen, Merck, Novartis, Roche, and Sanofi; speaking activities from Bayer, Biogen, Celgene, Chiesi Italia SpA, Eli Lilly, Genzyme, Janssen, Merck-Serono, Neopharmed Gentili, Novartis, Novo Nordisk, Roche, Sanofi, Takeda, and TEVA; participation in Advisory Boards for Alexion, Biogen, Bristol-Myers Squibb, Merck, Novartis, Roche, Sanofi, Sanofi-Aventis, Sanofi-Genzyme, and Takeda; scientific direction of educational events for Biogen, Merck, Roche, Celgene, Bristol-Myers Squibb, Lilly, Novartis, Sanofi-Genzyme; he receives research support from Biogen Idec, Merck-Serono, Novartis, Roche, the Italian Ministry of Health, the Italian Ministry of University and Research, and Fondazione Italiana Sclerosi Multipla. M.A.R. received consulting fees from Biogen, Bristol Myers Squibb, Eli Lilly, and Janssen, Roche; and speaker honoraria from AstraZeneca, Biogen, Bristol Myers Squibb, Bromatech, Celgene, Genzyme, Horizon Therapeutics Italy, Merck Serono SpA, Novartis, Roche, Sanofi, and Teva. She receives research support from the MS Society of Canada, the Italian Ministry of Health, the Italian Ministry of University and Research, and Fondazione Italiana Sclerosi Multipla. She is Associate Editor for Multiple Sclerosis and Related Disorders.
Funding
The author(s) disclosed receipt of the following financial support for the research, authorship, and/or publication of this article: This study was supported, in part, by the Ministry of Science, Republic of Serbia (Project No. 175031).
Ethical Considerations
Ethical approval was received from the local ethical standards committee of each participating center (Protocol ID: “Common Dataset” and “Not-MS” at IRCCS San Raffaele Scientific Institute, Milan, Italy; Project 175031 at University of Belgrade, Belgrade, Serbia).
Consent to Participate
Written informed consent was obtained from all participants at the time of data acquisition according to the Declaration of Helsinki.
Supplemental material
Supplemental material for this article is available online.
References
Supplementary Material
Please find the following supplemental material available below.
For Open Access articles published under a Creative Commons License, all supplemental material carries the same license as the article it is associated with.
For non-Open Access articles published, all supplemental material carries a non-exclusive license, and permission requests for re-use of supplemental material or any part of supplemental material shall be sent directly to the copyright owner as specified in the copyright notice associated with the article.