
Abstract
Background:
The precuneus is involved in cognition and depression; static functional connectivity (SFC) abnormalities of this region have been observed in neuromyelitis optica spectrum disorders (NMOSD). Time-varying functional connectivity (TVC) underpins dynamic variations of brain connectivity.
Objective:
The aim of this study was to explore precuneus SFC and TVC in NMOSD patients and their associations with neuropsychological features.
Methods:
This retrospective study includes 27 NMOSD patients and 30 matched healthy controls undergoing resting state functional magnetic resonance imaging (MRI) and a neuropsychological evaluation of cognitive performance and depressive symptoms. A sliding-window correlation analysis using bilateral precuneus as seed region assessed TVC, which was quantified by the standard deviation of connectivity across windows. Mean connectivity indicated SFC.
Results:
Compared to controls, patients had reduced SFC between precuneus, temporal lobe, putamen and cerebellum, and reduced TVC between precuneus and prefronto-parietal-temporo-occipital cortices and caudate. Patients also had increased intra-precuneal TVC and increased TVC between the precuneus and the temporal cortex. More severe depressive symptoms correlated with increased TVC between the precuneus and the temporal lobe; worse cognitive performance mainly correlated with higher TVC between the precuneus and the parietal lobe.
Conclusion:
TVC rather than SFC of the precuneus correlates with NMOSD neuropsychological features; different TVC abnormalities underlie depressive symptoms and cognitive impairment.
Keywords
Introduction
Neuromyelitis optica spectrum disorder (NMOSD) is an autoimmune disease caused by an autoantibody targeting the aquaporin-4 water channel on astrocytes, with consequent astrocyte damage and secondary demyelination. 1 Although the main clinical manifestations are recurrent optic neuritis, myelitis and area postrema syndrome, 1 the high prevalence of depressive symptoms and multi-domain cognitive impairment (CI) in NMOSD is gathering clinical attention since their underlying substrates are yet to be clarified.2,3
Several magnetic resonance imaging (MRI) studies suggested a contribution of the precuneus, an associative cortex involved in highly integrated cognitive tasks, 4 in the development of cognitive abnormalities in NMOSD.5–8 Functional MRI (fMRI) investigations showed that NMOSD patients have increased resting state (RS) functional connectivity (FC) of the precuneus within the default mode network and the working memory network compared to healthy subjects,7,8 which correlated with better performance in terms of attention/information processing speed (IPS) and executive functions, suggesting an adaptive role of these functional changes to preserve cognitive efficiency. 8
However, precuneal damage has been associated with cognitive deficits in several neurological disorders. For instance, in patients with Alzheimer’s disease or mild CI, glucose hypometabolism in the precuneus precedes the involvement of the parietotemporal cortices and the development of atrophy. 9 Similarly, precuneus functional or structural abnormalities were associated with CI in patients with stroke, 10 Parkinson’s disease 11 and multiple sclerosis (MS). 12
Functional changes in precuneal connectivity seem to be relevant for the development of depression as well, as increased FC between the precuneus and the prefrontal and temporo-parietal cortices was detected in treatment-naïve depressed patients and was restored after antidepressant treatment start. 13
RS FC abnormalities in NMOSD have been investigated so far using a static FC (SFC) approach. SFC assumes that FC is stationary across the entire fMRI acquisition and reflects the architecture of stable brain functional connections (i.e. networks). However, there is growing evidence that the analysis of variability of RS FC within small temporal segments is complemental to the static approach since it might underpin fast inter- and intra-network cross-talk and coordination. 14 Dynamic FC, also known as time-varying connectivity (TVC), can be measured by performing a seed region correlation analysis over short segments of RS fMRI time series and calculating the standard deviation (SD) of FC over these so-called ‘sliding windows’. 15
TVC was already investigated in other inflammatory neurological disorders, such as MS, where it detected changes in brain functional reorganization since the earlier phases of the disease, 16 underlined the existence of heterogeneous patterns of connectivity at different disease stages (i.e. relapsing–remitting vs progressive MS) 17 and showed that slower inter-network connectivity 18 and inefficient maintenance of stable intra-network connections 17 contributed to CI.
Here, we hypothesize that patients with NMOSD might have abnormal RS FC of the precuneus in terms of both SFC and TVC, and that, based on the experience in other neurological disorders, these alterations could be associated with CI and depressive symptoms. To test this, we investigated SFC and TVC of the precuneus at RS, and their correlations with cognitive performance and depressive symptoms in NMOSD patients.
Materials and methods
Standard protocol approvals, registration and patient consent
Approval was received from the local ethical standards committee on human experimentation. Written informed consent was obtained from all participants prior to enrolment.
Subjects
This retrospective study included 27 right-handed patients and 30 age-, sex- and education-matched right-handed healthy controls (HC) enrolled between February 2012 and August 2015. Patients satisfied the 2015 International Panel diagnostic criteria for aquaporin-4 seropositive NMOSD diagnosis. 1 All patients were evaluated during the remission phase of the disease (i.e. at least 1 month apart acute relapses, intravenous steroid administration and treatment changes). Overall, 25 NMOSD patients and all HC were included in our previous study by Savoldi et al., investigating SFC abnormalities in the main cognitive networks of NMOSD patients and their associations with neuropsychological performances. 8 For all participants, exclusion criteria were history of drug or alcohol abuse, head trauma, other neurological/psychiatric conditions, a formal diagnosis of major depressive disorder and any contraindication to MRI.
Clinical and neuropsychological assessment
On the same day of the MRI acquisition, patients underwent a neurological evaluation including the Expanded Disability Status Scale (EDSS) 19 assessment and a neuropsychological examination.
Verbal learning (VL) was tested with the Selective Reminding Test and its subsections (long-term storage, consistent long-term retrieval and delayed recall tests); 20 visuospatial learning (VSL) was assessed with the 10/36 Spatial Recall Test and its delayed recall; 20 attention/IPS were evaluated through the Symbol Digit Modalities Test and the Paced Auditory Serial Addition Test-2 and Paced Auditory Serial Addition Test-3; 20 verbal fluency (VF) was examined with the phonemic and semantic fluency tests. 21
For each test, a grading system dependent on the number of SDs below normative values was applied. Grade 0 corresponded to scores ⩾ normative values; Grade 1 to scores at 1 or between 0 and 1 SDs below normative values; Grade 2 to scores at 2 or between 1 and 2 SDs below normative values and so on. 22 Grades of each test were summed up to provide global and domain-specific indexes of CI (the higher the index, the worse the impairment): 22 CI index, VL index, VSL index, IPS index and VF index. Patients with at least two abnormal tests (performance below the fifth percentile of the normative sample) in different domains were considered cognitively impaired. 23
To investigate subclinical depressive symptoms, subjects were administered the Beck Depression Inventory-II (BDI), 24 which quantifies the intensity of depressive symptoms (a score ⩾ 10 corresponding to at least mild depression symptoms).24,25
MRI acquisition
All participants underwent a 3.0 T brain MRI scan (Philips Intera, Best, The Netherlands), following a standardized protocol: (1) T2*-weighted single-shot echo-planar imaging sequence for RS fMRI acquisition (repetition time (TR) = 3000 ms; echo time (TE) = 35 ms; flip angle (FA) = 90°; matrix = 128 × 128; field of view (FOV) = 240 × 240 mm 2 ; 30 4-mm thick slices; total acquired images = 200); (2) dual-echo turbo spin-echo (TR = 2599 ms; TE = 16/80 ms; FA = 90°; matrix = 256 × 256; FOV = 240 × 240 mm 2 ; 44 3-mm thick slices) and (3) three-dimensional (3D) T1-weighted fast field echo (TR = 25 ms; TE = 4.6 ms; FA = 30°; matrix = 256 × 256; FOV = 230 × 230 mm 2 ; 220 0.8-mm thick slices). RS fMRI scan positioning included the whole cerebellum/pons regions, and RS fMRI acquisition required about 10 minutes. During acquisition, subjects were asked to keep their eyes closed, remain motionless and not to focus on specific thoughts. A questionnaire was administered immediately after the MRI session to ensure participants had not fallen asleep during scanning.
Structural MRI analysis
Brain T2-hyperintense and T1-hypointense lesions were segmented using a local thresholding segmentation technique (Jim 7; Xinapse Systems Ltd, Colchester, UK), and T2- and T1-lesion volumes were calculated. After T1-hypointense lesion refilling, normalized brain volume, white matter volume and grey matter volume were measured using the FSL SIENAX software. 26
RS FC analysis
Images preprocessing
The main preprocessing steps were performed using SPM12 and REST software (http://resting-fmri.sourceforge.net/). After discarding the first two timepoints, RS fMRI scans were rigid body realigned to the mean of each session. After rigid registration to the lesion-filled 3D T1-weighted scan, RS fMRI images were non-linearly normalized to the Montreal Neurological Institute template. Linear detrending and band-pass filtering (0.01–0.08 Hz) were performed to partially remove low-frequency drifts and high-frequency physiological noise. The six motion parameters estimated by SPM12, along with the mean white matter and ventricular cerebrospinal fluid signals (extracted from 2-mm eroded masks to be conservative), were regressed to minimize non-neuronal sources of synchrony between RS fMRI time series and motion-related artefacts. Finally, smoothing was performed using a 3D 6-mm isotropic Gaussian kernel.
SFC and TVC analysis
A mask of the bilateral precuneus was obtained by merging the left and right precuneus masks in the WFU PickAtlas toolbox (http://fmri.wfubmc.edu/software/PickAtlas). Using a rectangular window of 22 × TR time points (convolved with a Gaussian of σ = 3 × TR and shifted along the fMRI time series in steps of 1 × TR, as previously suggested), 18 FC between the precuneus and any other voxel of the brain was calculated, and r-to-z Fisher transformed. This allowed obtaining a series of 178 RS FC maps of the precuneus across the whole fMRI session.
SFC of the precuneus was assessed by producing a mean map of FC across all sliding windows.17,18 The SD of the FC map across all windows was chosen as a measure of TVC.17,27
Statistical analysis
Between-group comparisons of demographic, neuropsychological and structural MRI variables were performed using two-sample t-test/non-parametric Mann–Whitney U-test, according to normality assumption. Categorical variables, including frequency of mild depressive symptoms between cognitively impaired and preserved patients, were compared by Pearson’s chi-squared test. Finally, the median test for independent samples with Fisher’s exact test and Bonferroni correction for post hoc comparisons was used to compare depressive and cognitive scores among NMOSD patients, grouped according to the presence/absence of depression and/or CI (SPSS software, version 23.0).
Voxel-wise comparisons of RS SFC and TVC of the precuneus between HC and NMOSD patients were performed using SPM12 and age- and sex-adjusted full factorial models. Given the exploratory design of the study, voxel-wise results of between-group comparisons were tested at p < 0.001 (uncorrected, cluster extent threshold kE = 10 voxels). Using such cluster-forming threshold, we also identified results surviving at p < 0.05, cluster-wise family-wise error (FWE) corrected for multiple comparisons. 28
In NMOSD patients, we extracted average z-scores of abnormal RS SFC and TVC from clusters surviving family-wise-error threshold using REX (www.nitrc.org/projects/rex). These z-scores were used in bivariate correlation analyses to assess the association of functional abnormalities with BDI scores and cognitive indexes in all patients.
Multiple linear regression models were then used to identify the set of SFC and TVC z-scores independently associated with CI indices and BDI, using a stepwise variable selection (p = 0.10 for entry and p = 0.05 to remain in the multivariate model). Demographic variables, such as age and sex, were not included because they were already used to obtain the functional z-scores. The proportion of variance explained by each model was expressed by the R 2 index.
Data availability
The dataset used and analysed during the current study are available from the corresponding author on reasonable request.
Results
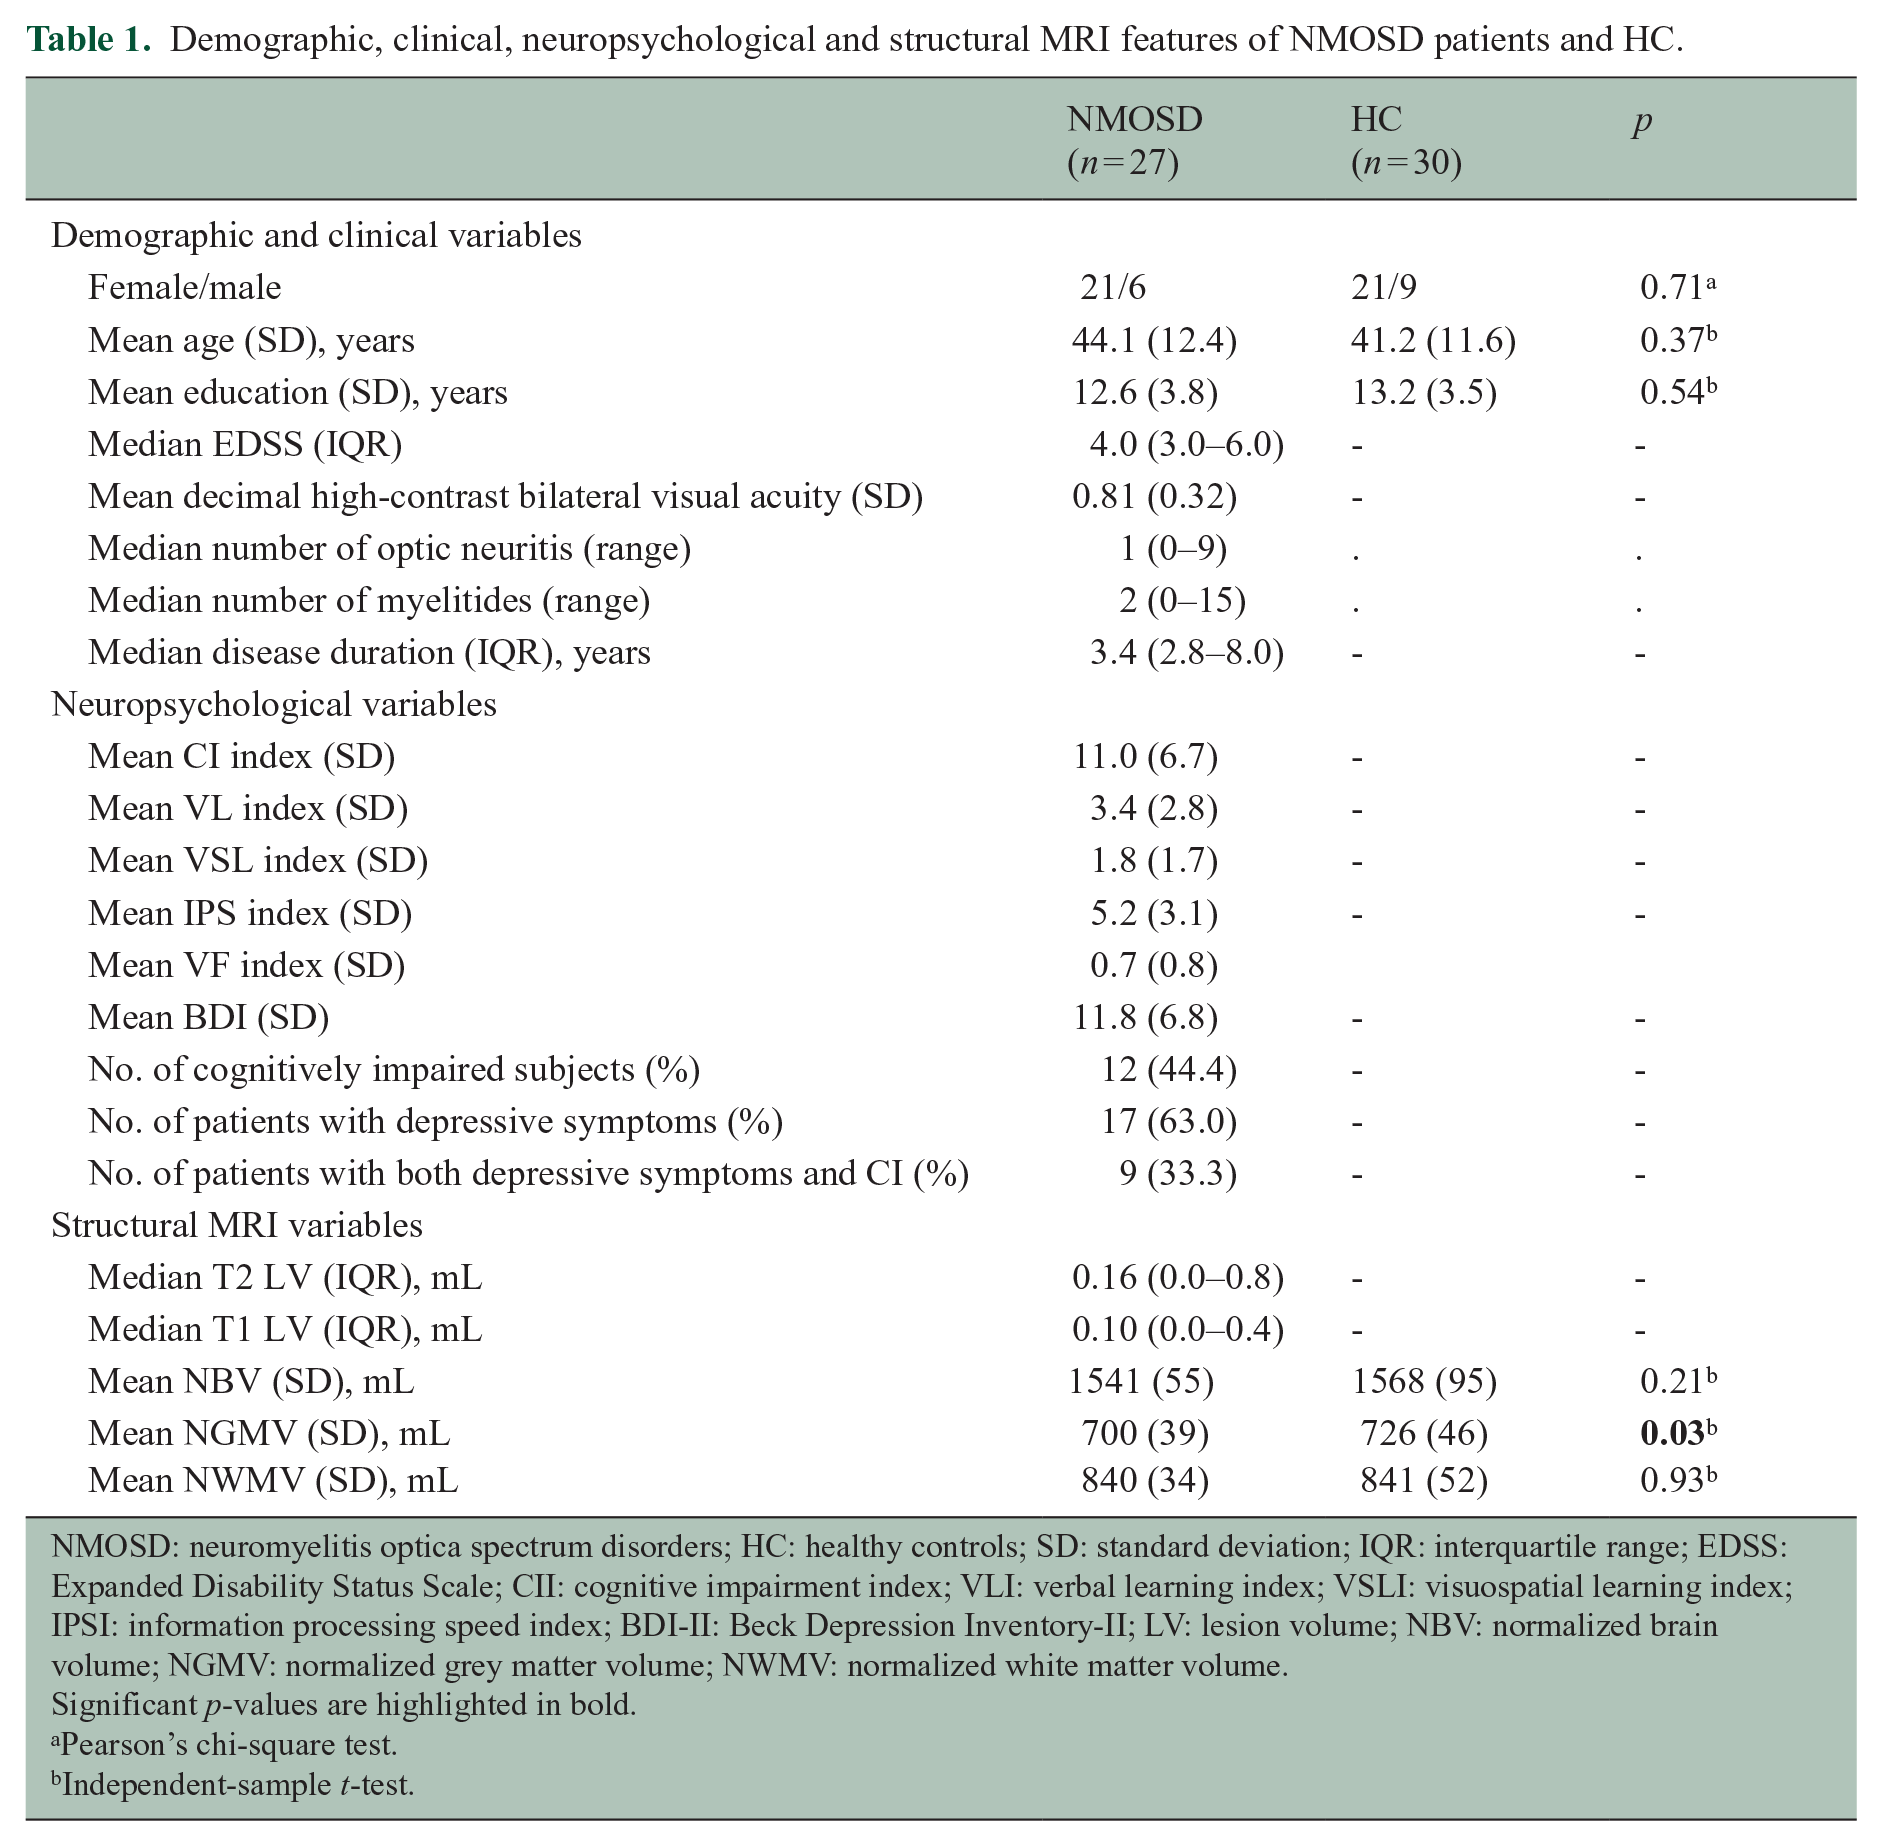
Clinical, neuropsychological and structural MRI findings (Table 1)
Overall, 27 NMOSD patients (mean age, 44 ± 12 years; 21 women) and 30 HC (mean age 41 ± 12 years, 21 women) were evaluated. CI was observed in 12 patients (44.4%) and depressive symptoms in 17 patients (63.0%). Concomitant CI and depressive symptoms were detected in 9 patients (33.3%), isolated depressive symptoms were present in 8 patients (29.6%) and isolated CI was present in 3 patients (11.1%). Frequency of depression was not different between cognitively impaired and preserved patients (p = 0.25). The median test for independent samples showed a significant difference in terms of median values of BDI score (p = 0.001), CII (p = 0.01) and IPS index (p < 0.001) among patients divided according to the presence of CI/depressive symptoms, in combination or alone. However, patients with both CI and depressive symptoms did not show worse cognitive performance or more severe depressive symptoms compared to those with CI or depression alone (Figure 1).
Demographic, clinical, neuropsychological and structural MRI features of NMOSD patients and HC.
NMOSD: neuromyelitis optica spectrum disorders; HC: healthy controls; SD: standard deviation; IQR: interquartile range; EDSS: Expanded Disability Status Scale; CII: cognitive impairment index; VLI: verbal learning index; VSLI: visuospatial learning index; IPSI: information processing speed index; BDI-II: Beck Depression Inventory-II; LV: lesion volume; NBV: normalized brain volume; NGMV: normalized grey matter volume; NWMV: normalized white matter volume.
Significant p-values are highlighted in bold.
Pearson’s chi-square test.
Independent-sample t-test.
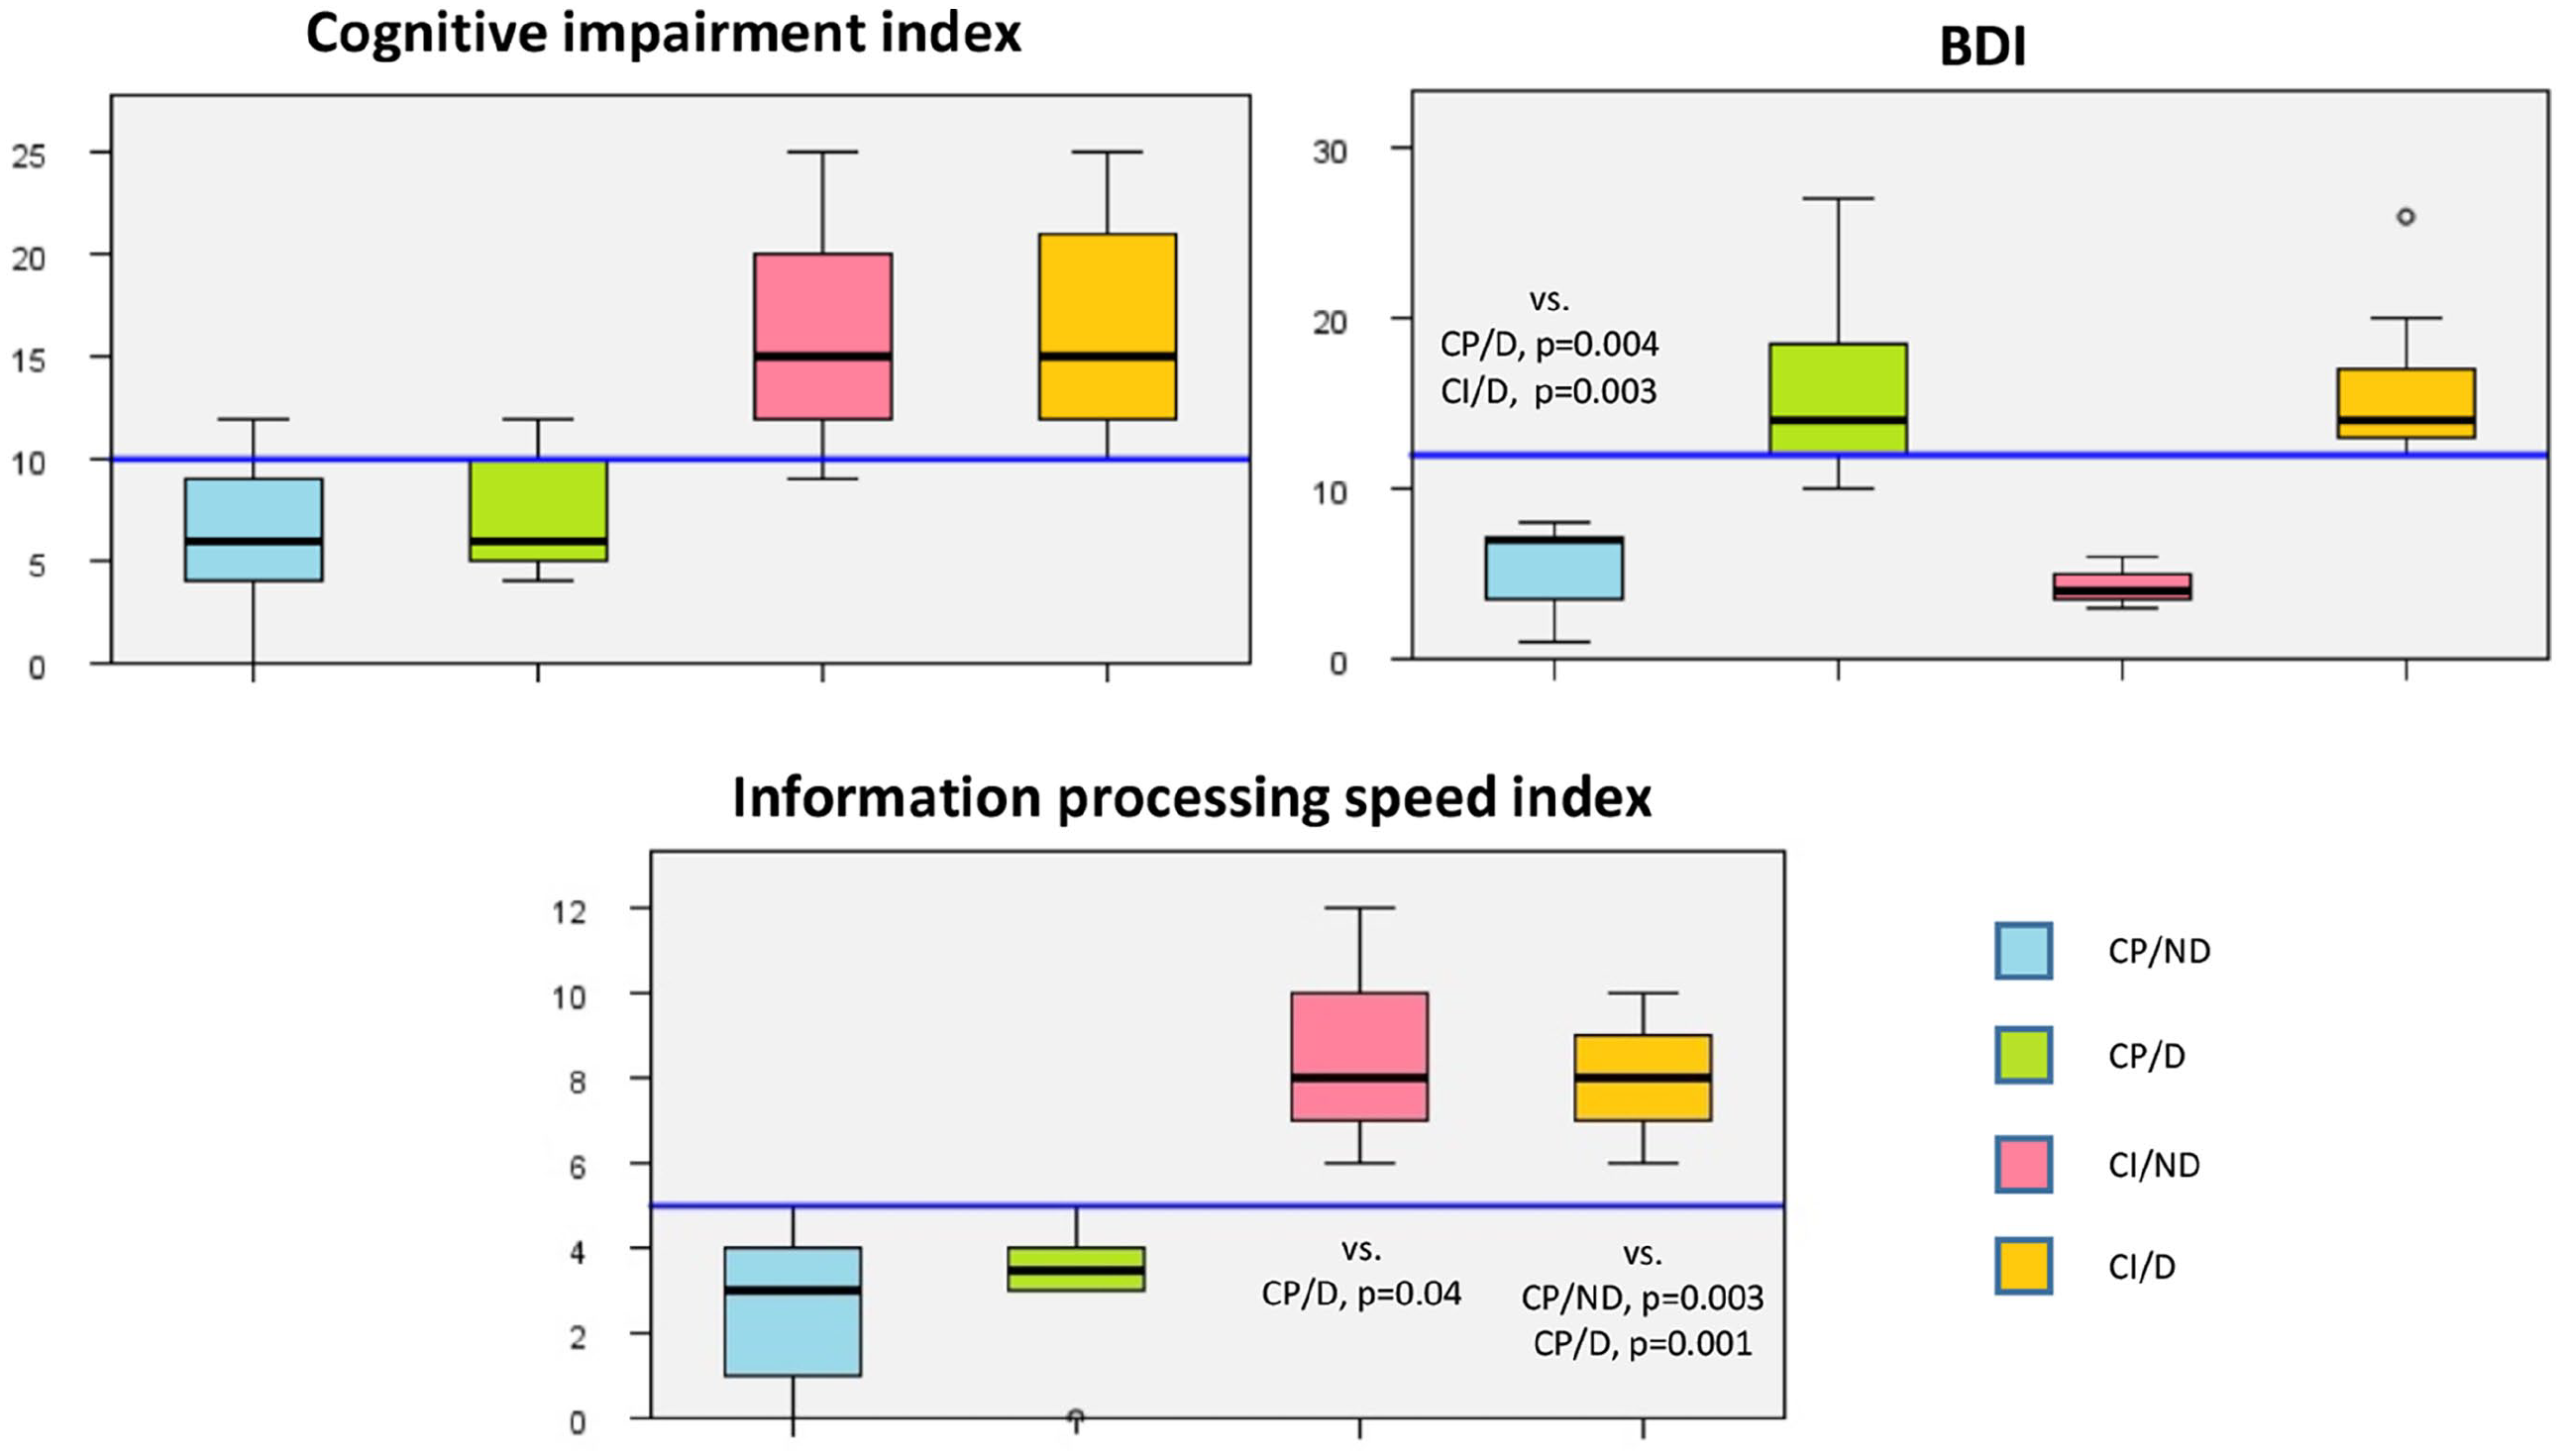
Distribution of BDI scores, CI index and IPS index among patients’ groups.
Structural MRI variables were similar between patients and HC, except for lower normalized grey matter volume in patients.
Voxel-wise between-group comparisons of RS FC of the precuneus
SFC analysis (Figure 2 and Table 2)
Compared to HC, NMOSD patients had decreased SFC between the precuneus and the right middle temporal gyrus, bilateral putamen and right cerebellum (crus I).
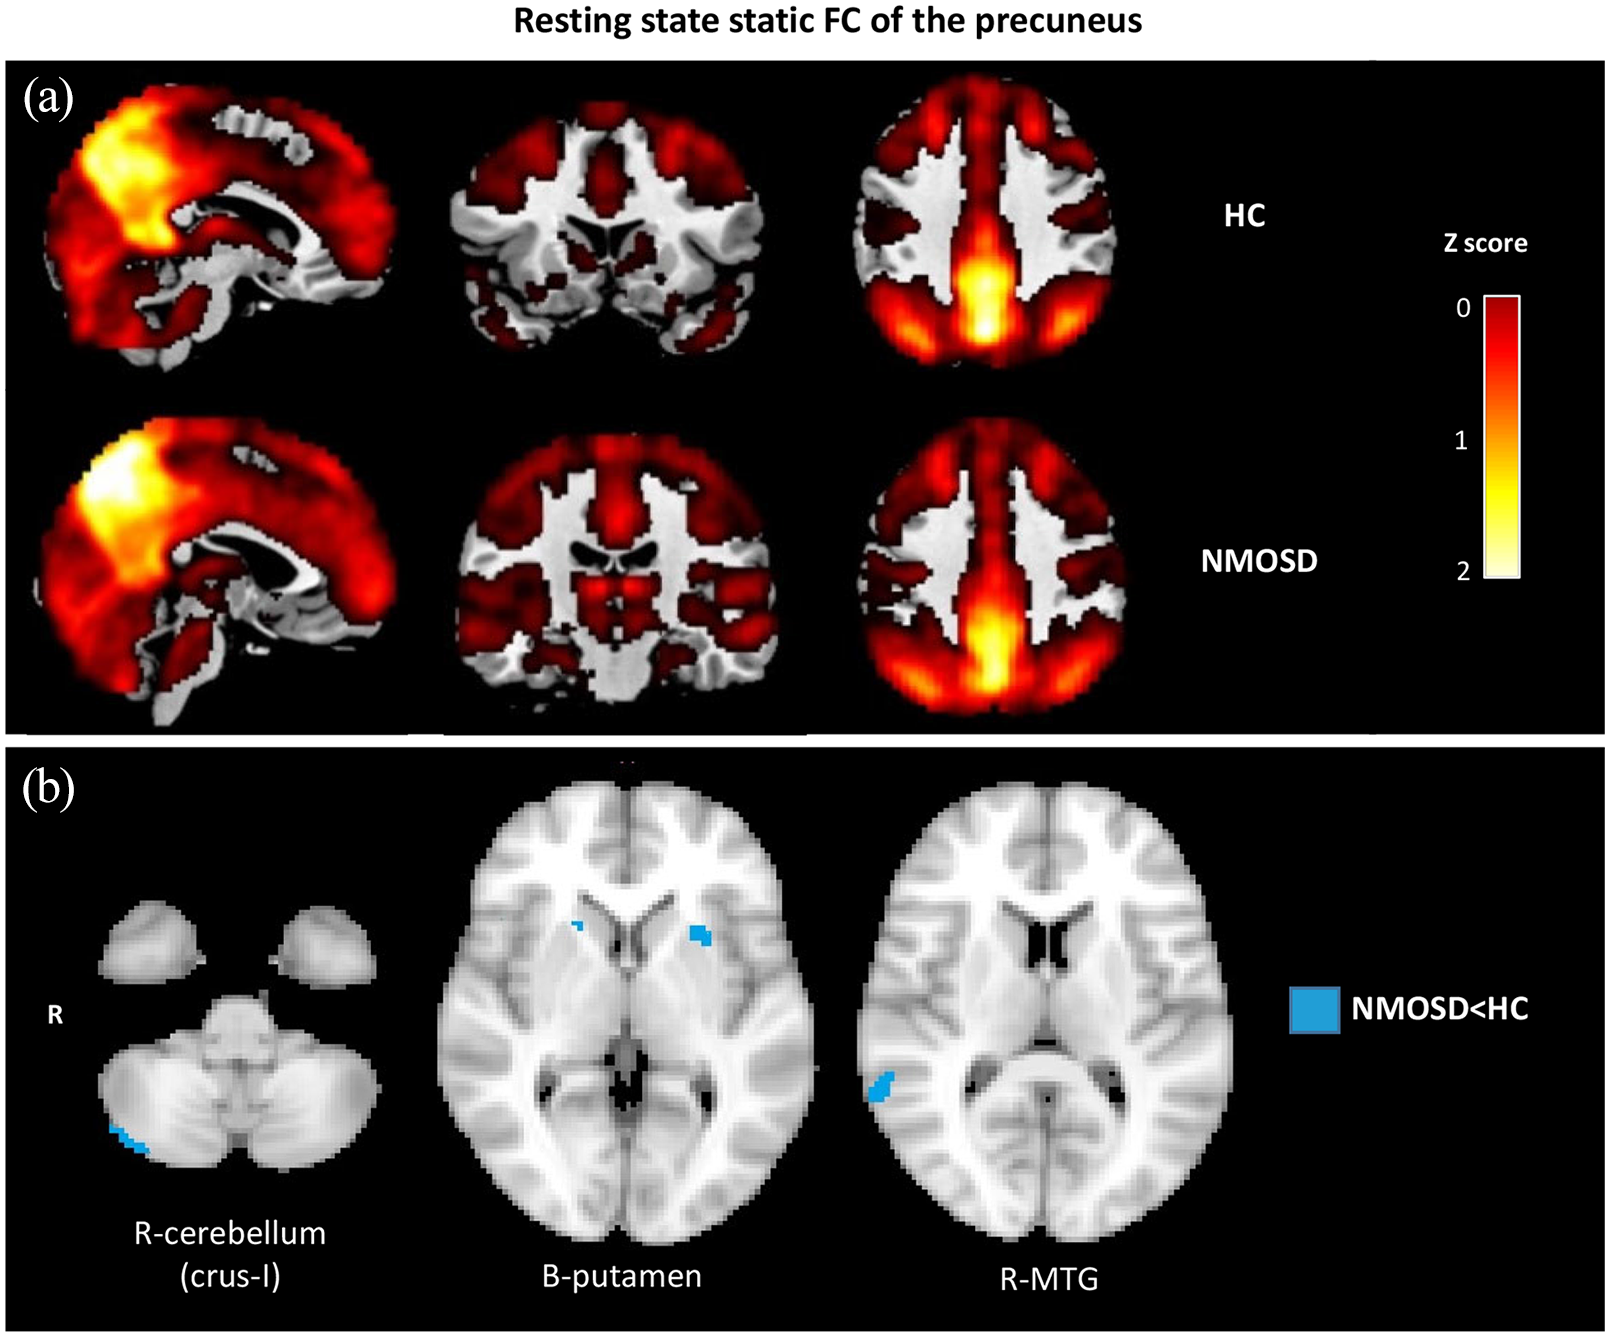
Resting state static functional connectivity of the precuneus. (a) Static resting state functional connectivity (TVC) of the precuneus across windows in healthy controls (HC) and neuromyelitis optica spectrum disorder (NMOSD) patients. (b) Voxel-wise comparisons of SFC of the precuneus between NMOSD and HC (age- and sex-adjusted full factorial models; only results surviving at p < 0.05, clusterwise FWE corrected are retained).
Clusters of abnormal RS SFC of the precuneus between HC and NMOSD patients (p < 0.001 uncorrected, cluster extent threshold kE = 10).
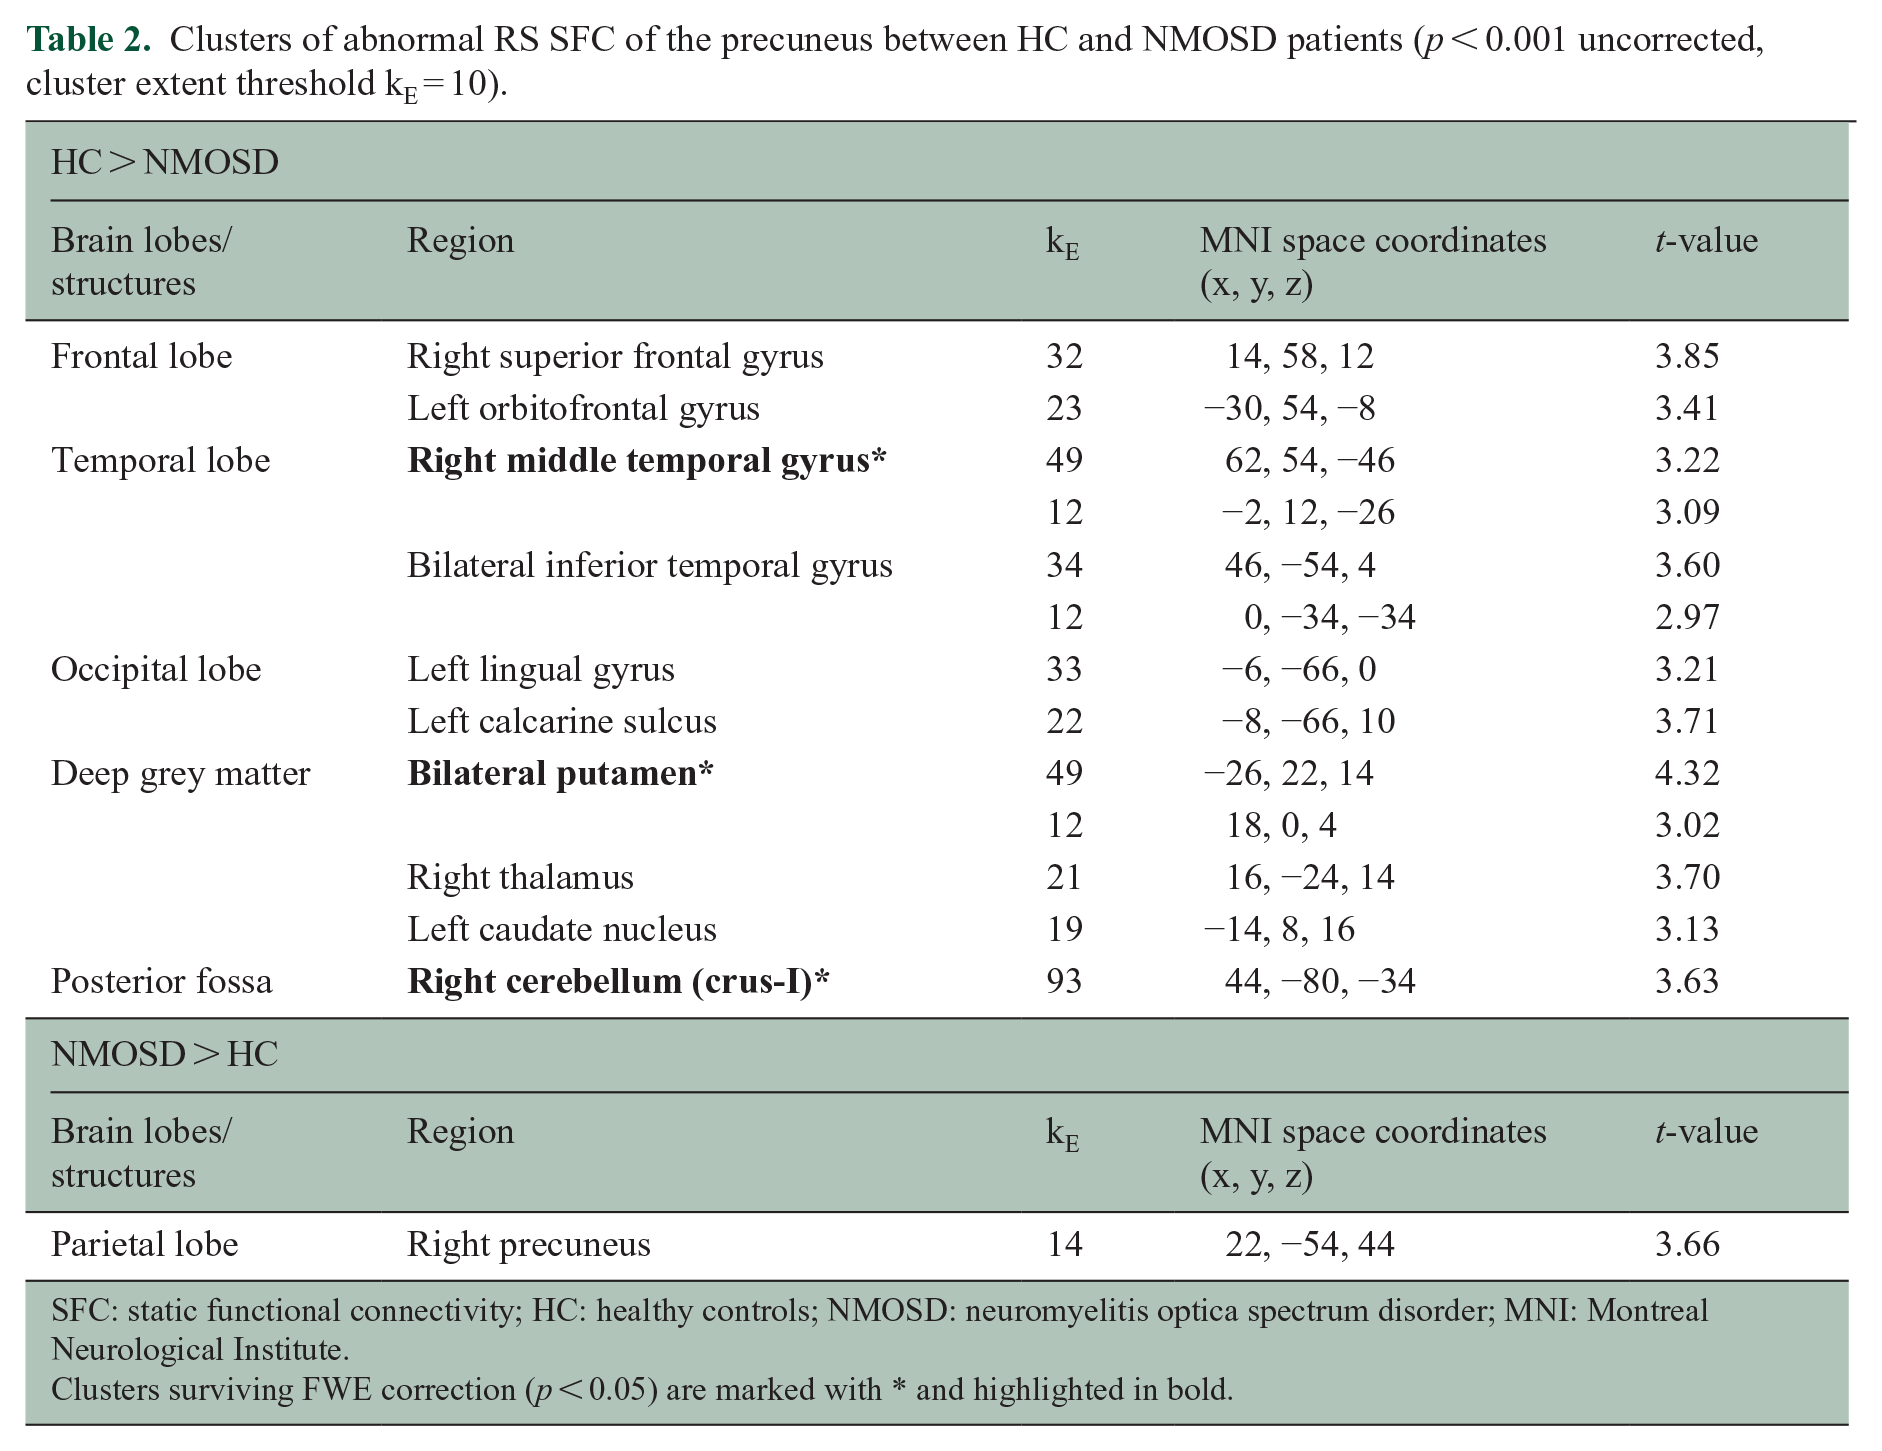
SFC: static functional connectivity; HC: healthy controls; NMOSD: neuromyelitis optica spectrum disorder; MNI: Montreal Neurological Institute.
Clusters surviving FWE correction (p < 0.05) are marked with * and highlighted in bold.
TVC analysis (Figure 3 and Table 3)
Compared to HC, NMOSD patients exhibited a widespread decrease in the TVC between the precuneus and the frontal lobes (especially the prefrontal cortex, including bilateral rectus gyrus and left olfactory bulb), parietal lobe (right postcentral gyrus), temporal lobe (bilateral superior temporal gyrus), occipital lobes (left inferior occipital gyrus and bilateral lingual gyrus), and deep grey matter (bilateral caudate nuclei). Patients also had increased intra-precuneal TVC and increased TVC between the precuneus and the left middle temporal gyrus.
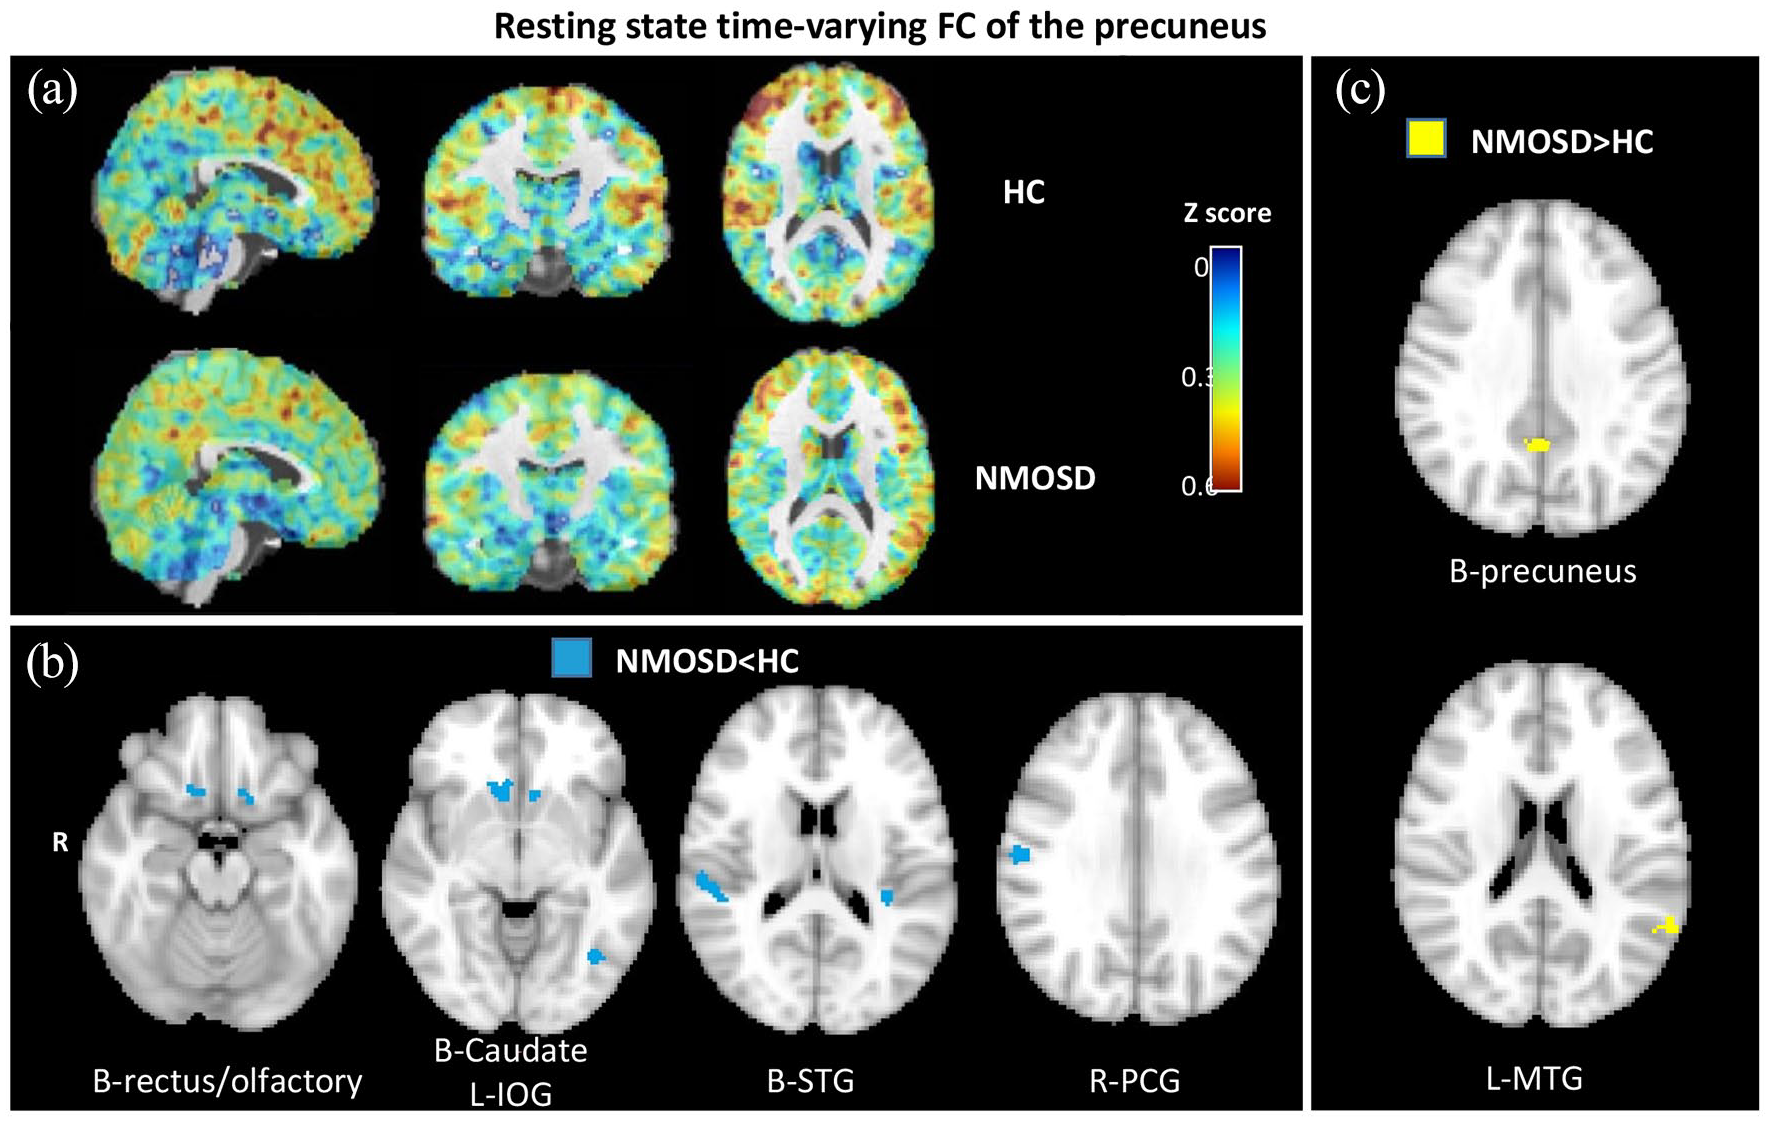
Resting state time-varying functional connectivity of the precuneus. (a) Time-varying resting state functional connectivity (TVC) of the precuneus across windows in healthy controls (HC) and neuromyelitis optica spectrum disorder (NMOSD) patients. Panel B: voxel-wise comparisons of TVC of the precuneus between NMOSD and HC (NMOSD < HC, age- and sex-adjusted full factorial models; only results surviving at p < 0.05, clusterwise FWE corrected are retained). (b) Voxel-wise comparisons of TVC of the precuneus between NMOSD and HC (NMOSD > HC, age- and sex-adjusted full factorial models; only results surviving at p < 0.05, clusterwise FWE corrected, are retained).
Clusters of abnormal time-varying RS functional connectivity (TVC) between HC and NMOSD patients (p < 0.001 uncorrected, cluster extent threshold kE = 10).
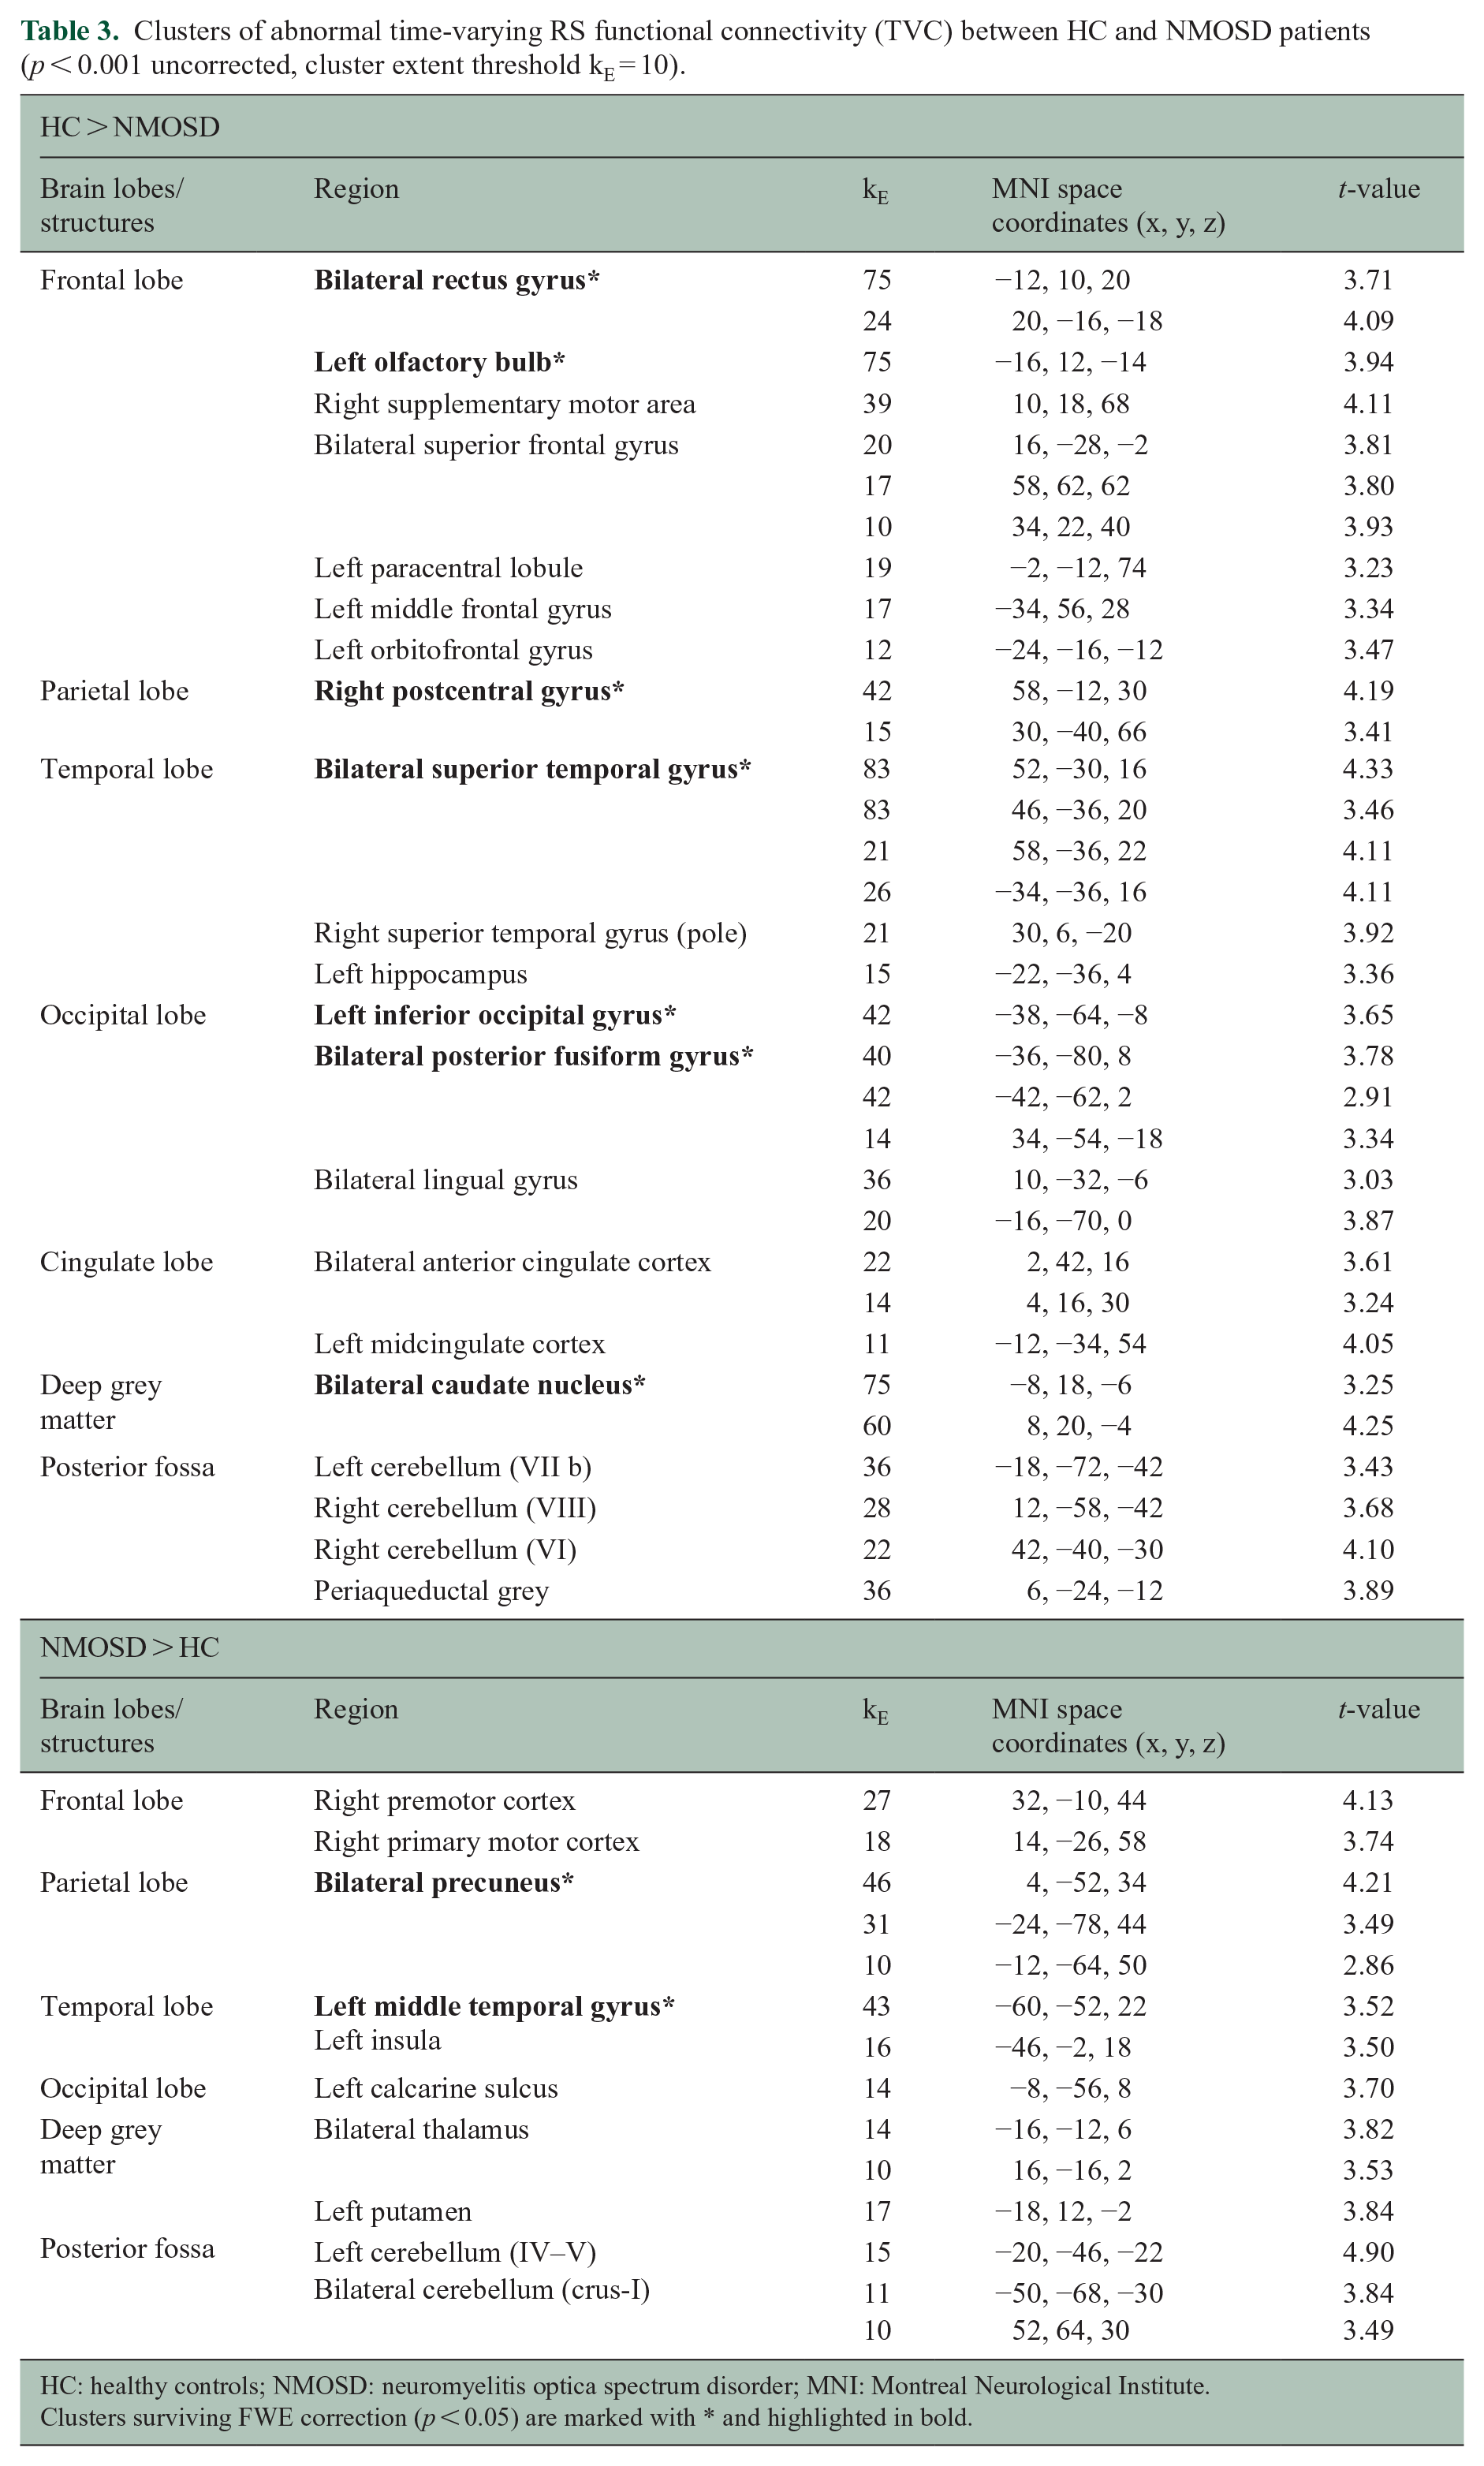
HC: healthy controls; NMOSD: neuromyelitis optica spectrum disorder; MNI: Montreal Neurological Institute.
Clusters surviving FWE correction (p < 0.05) are marked with * and highlighted in bold.
Correlation analysis and regression models in NMOSD patients (Tables 4 and 5)
Bivariate Pearson’s correlations between neuropsychological variables and RS static and TVC of the precuneus (z-scores) in patients with NMOSD.
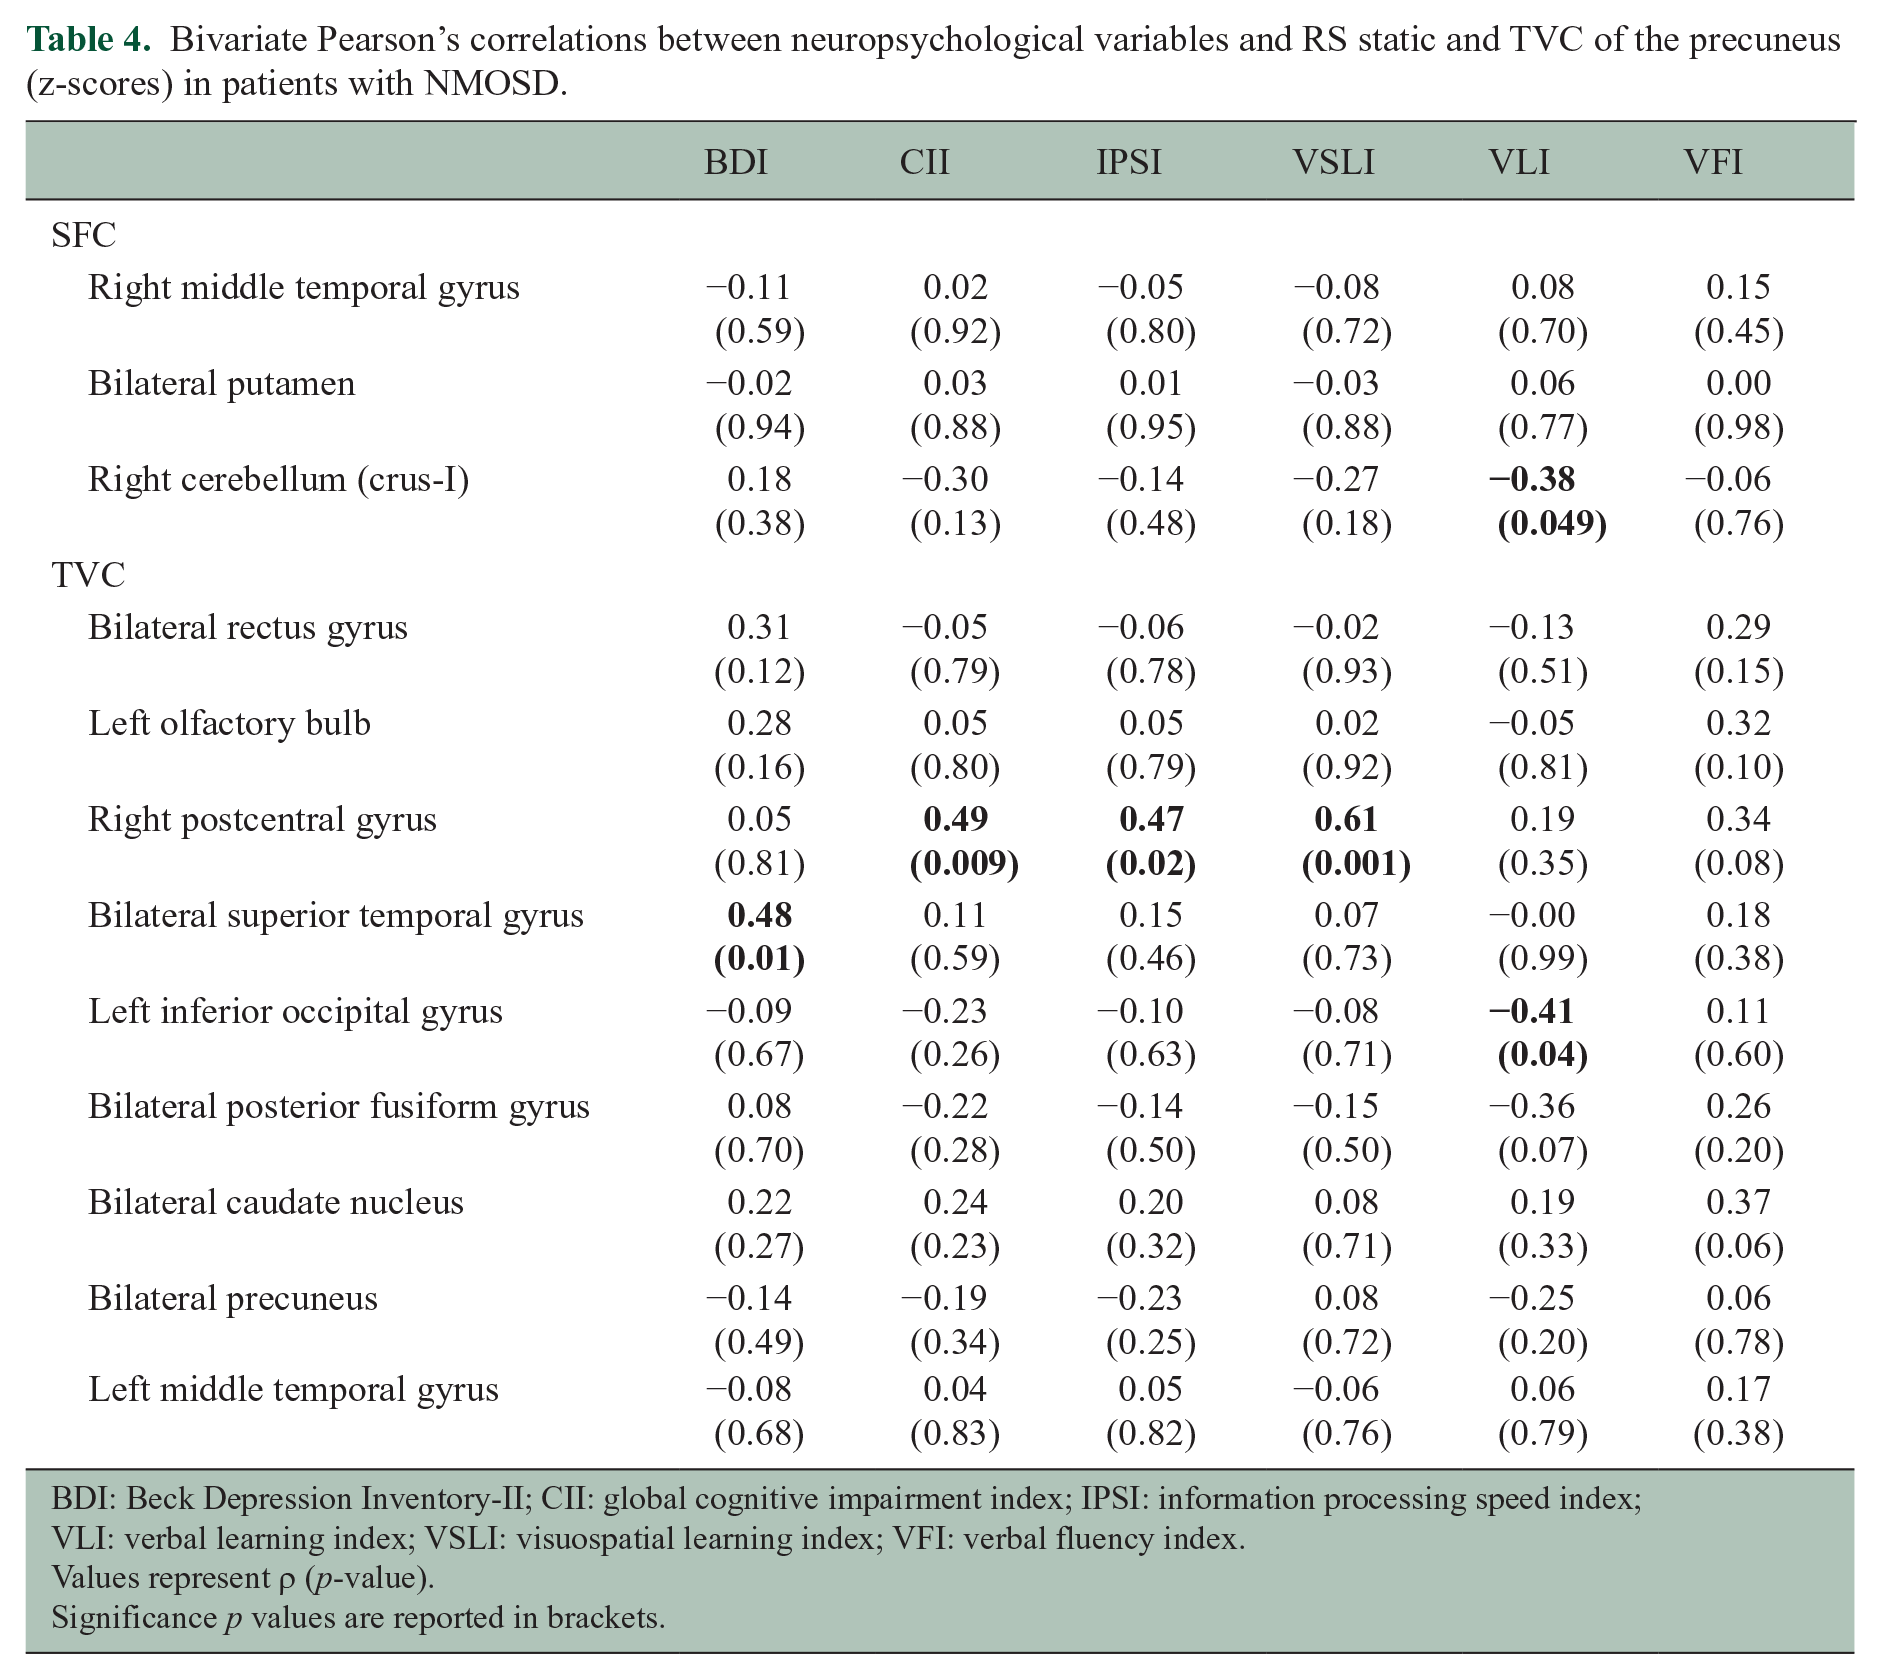
BDI: Beck Depression Inventory-II; CII: global cognitive impairment index; IPSI: information processing speed index; VLI: verbal learning index; VSLI: visuospatial learning index; VFI: verbal fluency index.
Values represent ρ (p-value).
Significance p values are reported in brackets.
Linear regression models between neuropsychological variables and TVC of the precuneus (z-scores) in patients with NMOSD.
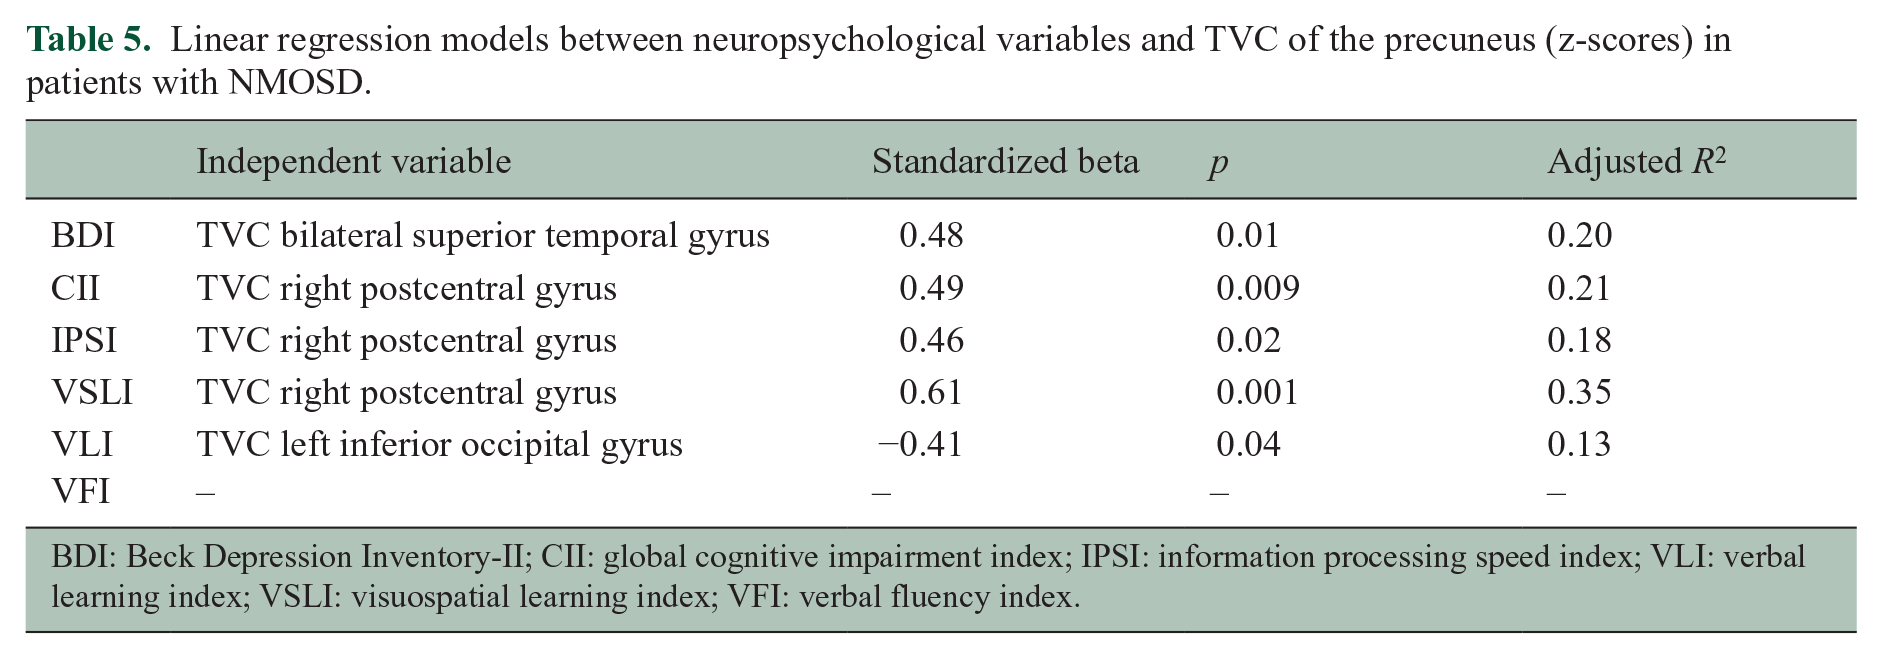
BDI: Beck Depression Inventory-II; CII: global cognitive impairment index; IPSI: information processing speed index; VLI: verbal learning index; VSLI: visuospatial learning index; VFI: verbal fluency index.
Depressive symptoms (Table 4)
No correlations were found between abnormal SFC and BDI scores. Higher BDI scores correlated with increased TVC between the precuneus and the superior temporal gyrus, bilaterally.
Cognitive performance (Table 4)
Higher VL index correlated with decreased SFC between the precuneus and the right cerebellar crus-I. Increased TVC between the precuneus and the right postcentral gyrus correlated with higher CI index, IPS index and VSL index. Decreased TVC between the precuneus and the left inferior occipital gyrus correlated with higher VL index.
In the multivariate linear regression analysis, a higher TVC between the precuneus and the bilateral superior temporal gyrus was the only variable retained as independent predictor of a higher BDI score. Higher CI index, IPS index and VSL index were independently associated with a higher TVC between the precuneus and the right postcentral gyrus, while a higher VL index was independently predicted by decreased TVC between the precuneus and the left inferior occipital gyrus. No predictors of VF-index were identified (Table 5).
Discussion
We explored static and time-varying RS FC of the precuneus in patients with NMOSD, and their associations with depressive symptoms and cognitive performance. Compared to HC, NMOSD patients had a few clusters of reduced SFC between the precuneus, the temporo-cerebellar cortices and the putamen, and a diffuse TVC reduction with the prefronto-parieto-temporo-occipital cortices and caudate nuclei, together with increased TVC within the precuneus and between the precuneus and the temporal lobe. More severe depressive symptoms were associated with increased TVC between the precuneus and temporal cortex, while worse cognitive performance was associated with higher TVC between the precuneus and the parietal cortex and, to a lesser extent, the occipital lobe.
These results suggest that TVC is more sensitive than SFC to detect brain functional reorganization in patients with NMOSD, and that it better contributes to explain cognitive and mood abnormalities. Although a concomitant evaluation of static and time-varying connectivity was never performed before in this disease, former studies suggested that TVC can underpin functional changes since the earliest stages of both inflammatory and degenerative neurological disorders. 15 For instance, patients with clinically isolated syndrome suggestive of MS showed an initial decrease in TVC within the brain network involved by the first demyelinating attack, followed by a progressive increase in TVC over the next 2 years 16 and TVC was more sensitive than SFC in identifying MS patients with very mild disability (i.e. EDSS ⩾ 2). 29 Similarly, compared with HC, patients with early mild CI were characterized by increased TVC. 30
These observations suggest that TVC could be sensitive to functional changes associated with neurological conditions characterized by mild or absent structural damage (i.e. early stages) or in the presence of only mild clinical symptoms. This might explain why TVC abnormalities exceeded those of SFC in patients with NMOSD, where structural MRI abnormalities are usually milder than those observed in other neuroinflammatory conditions, such as MS.
In NMOSD, a higher burden of depressive symptoms correlated with higher TVC between the precuneus and the superior temporal gyrus, suggesting an adaptive role of its reduced dynamism in these patients. This aligns with another work, which found that the deactivation of the superior temporal gyrus was one of the physiological mechanisms contrasting a constant emotional arousal in HC compared to depressed subjects. The superior temporal gyrus is involved in social cognition, 31 and functional abnormalities of this region were detected in patients with major depressive disorder. 32 Interestingly enough, atrophy of the superior temporal gyrus was found since the earliest phases of depression; 33 therefore, it is reasonable to speculate that functional changes might be evident even earlier and be sensitive to mild symptoms, such as in our cohort.
When we explored correlations between RS FC of the precuneus and cognitive functions, higher TVC in the postcentral gyrus and lower TVC in the inferior occipital gyrus was correlated with worse cognitive performance. Although this might seem surprising, the contribution of the sensorimotor system to cognition aligns with the emerging evidence that motor and cognitive functions are interrelated as shown in MS patients with concomitant involvement of physical and cognitive disability but also in patients with Alzheimer’s disease.34,35 Our hypothesis is that the increased TVC in the sensorimotor system, which occurs after the demyelinating attack in NMOSD (possibly as an attempt of adaptive functional reorganization, as shown in other disorders) 17 might interfere with the cognitive processes intermingled with the motor functions. Conversely, the involvement of the occipital cortex in high-cognitive functions was already described in blind people, 36 suggesting that a similar phenomenon of cross-modal plasticity might occur in neurological disorders characterized by severe visual loss, such as NMOSD. Although not selected by the final predicted model, we also found that lower SFC in the cerebellar crus-I correlated with poorer performance at the VL task, supporting the evidence that posterior cerebellar regions are involved in non-motor functions including language and verbal working memory, due to their connections with the prefrontal cortex. 37
In a previous study using network RS FC analysis, we found that patients with higher SFC in the precuneus within the default mode network and working memory network had better cognitive performance. 8 In the current work, which uses a seed-based approach with the precuneus as seed region, we detected a higher intra-precuneal TVC in NMOSD patients, which did not correlate with cognitive scores. In contrast, TVC between the precuneus and parieto-occipital and cerebellar regions was relevant, suggesting that dynamism of long-range precuneus RS FC rather than the functional activity of the precuneus itself acts as a modulator of cognitive processes.
Finally, in line with our clinical data, where a clear association between depressive symptoms and CI was not found, precuneal TVC seems to be involved in both these neuropsychological features, but through different circuits, involving the temporal lobe for depressive symptoms and the parieto-occipital and cerebellar regions for cognition.
Moving to limitations, we must acknowledge the cross-sectional retrospective design and the small sample-size since the former prevented an evaluation of SFC and TVC abnormalities over time and the latter might have hindered subtle effects on brain functional reorganization associated with the disease or with its neuropsychological features. In addition, our RS fMRI acquisitions were performed using a relatively long TR, possibly introducing aliasing effects in our data and not complete removal of physiological noise artefacts, leading to an underestimation of between-group TVC differences. Also, enrolled HC did not undergo an extensive neuropsychological evaluation; so, we could not assess whether cognitive and depression scores were correlated with TVC in HC. Finally, we cannot exclude an ‘a priori’ sample bias since we focused on the seed-based FC of the precuneus only, and functional changes in other functionally unrelated regions might be associated with depressive symptoms and worse cognitive performance as well. However, since the analysis of TVC is still novel and the interpretation of findings is challenging, we preferred to start this pilot study with a seed-based approach applied to a seed region which has an established centrality in the RS FC of the main cognitive networks, including the default mode network and the parietal memory network.
Future studies should include NMOSD patients with a secondary diagnosis of major depressive disorders since we expect that TVC abnormalities would be more evident than in our cohort and will clarify whether these functional abnormalities are specific of NMOSD or only the epiphenomenon of depression.
To conclude, our findings suggest that NMOSD patients have both static and time-varying abnormalities in the RS FC of precuneus, but TVC changes are more diffuse and better explain neuropsychological features. Different patterns of TVC contribute to depressive symptoms and cognition, the first through the connections with the temporal lobe, and the latter mainly involving the parieto-occipital areas.
Supplemental Material
sj-doc-1-msj-10.1177_13524585221107125 – Supplemental material for Time-varying connectivity of the precuneus and its association with cognition and depressive symptoms in neuromyelitis optica: A pilot MRI study
Supplemental material, sj-doc-1-msj-10.1177_13524585221107125 for Time-varying connectivity of the precuneus and its association with cognition and depressive symptoms in neuromyelitis optica: A pilot MRI study by Laura Cacciaguerra, Damiano Mistri, Paola Valsasina, Vittorio Martinelli, Massimo Filippi and Maria A Rocca in Multiple Sclerosis Journal
Supplemental Material
sj-docx-2-msj-10.1177_13524585221107125 – Supplemental material for Time-varying connectivity of the precuneus and its association with cognition and depressive symptoms in neuromyelitis optica: A pilot MRI study
Supplemental material, sj-docx-2-msj-10.1177_13524585221107125 for Time-varying connectivity of the precuneus and its association with cognition and depressive symptoms in neuromyelitis optica: A pilot MRI study by Laura Cacciaguerra, Damiano Mistri, Paola Valsasina, Vittorio Martinelli, Massimo Filippi and Maria A Rocca in Multiple Sclerosis Journal
Footnotes
Author Contributions
L.C., D.M. and P.V. contributed in data analysis; L.C. and P.V. contributed in statistical analysis; V.M. contributed in patient recruitment and clinical assessment; M.F. and M.A.R. contributed in study concept; M.A.R. contributed in MRI data analysis. All authors contributed in drafting/revising the manuscript.
Declaration of Conflicting Interests
The author(s) declared the following potential conflicts of interest with respect to the research, authorship, and/or publication of this article: L.C. received speaker and consultant honoraria from ACCMED, Roche, BMS Celgene and Sanofi. D.M. reports no disclosures. P.V. received speaker honoraria from ACCMED. V.M. received honoraria for consulting services or speaking activity from Biogen, Merck, Novartis, TEVA, Almirall and Sanofi. M.F. is an Editor-in-Chief of the Journal of Neurology, Associate Editor of Human Brain Mapping, Associate Editor of Radiology and Associate Editor of Neurological Sciences; received compensation for consulting services and/or speaking activities from Almirall, Alexion, Bayer, Biogen, Celgene, Eli Lilly, Genzyme, Merck Serono, Novartis, Roche, Sanofi, Takeda and Teva Pharmaceutical Industries and receives research support from Biogen Idec, Merck Serono, Novartis, Roche, Teva Pharmaceutical Industries, Italian Ministry of Health, Fondazione Italiana Sclerosi Multipla and ARiSLA (Fondazione Italiana di Ricerca per la SLA). M.A.R. received speaker honoraria from Bayer, Biogen, Bristol Myers Squibb, Celgene, Genzyme, Merck Serono, Novartis, Roche and Teva and receives research support from the MS Society of Canada and Fondazione Italiana Sclerosi Multipla.
Funding
The author(s) received no financial support for the research, authorship, and/or publication of this article.
Supplemental Material
Supplemental material for this article is available online.
References
Supplementary Material
Please find the following supplemental material available below.
For Open Access articles published under a Creative Commons License, all supplemental material carries the same license as the article it is associated with.
For non-Open Access articles published, all supplemental material carries a non-exclusive license, and permission requests for re-use of supplemental material or any part of supplemental material shall be sent directly to the copyright owner as specified in the copyright notice associated with the article.