
Abstract
Background:
In the OPTIMUM trial in patients with relapsing MS, treatment differences in annualized relapse rate (ARR, 0.088) and change in fatigue at week 108 (3.57 points, measured using the Fatigue Symptoms and Impacts Questionnaire–Relapsing Multiple Sclerosis, symptom domain (FSIQ-RMS-S)) favored ponesimod over teriflunomide. However, the importance of the fatigue outcome to patients was unclear.
Objective:
To assess the importance of the OPTIMUM FSIQ-RMS-S results using data from an MS discrete choice experiment (DCE).
Methods:
The DCE included components to correlate levels of physical and cognitive fatigue with FSIQ-RMS-S scores. Changes in relapses/year and time to MS progression equivalent to the treatment difference in fatigue in OPTIMUM were determined for similar fatigue levels as mean baseline fatigue in OPTIMUM.
Results:
DCE participants would accept 0.06 more relapses/year or a 0.15–0.17 year decrease in time to MS progression for a 3.57-point difference in physical fatigue on the FSIQ-RMS-S. To improve cognitive fatigue by 3.57-points on the FSIQ-RMS-S, DCE participants would accept 0.09–0.10 more relapses/year or a 0.24–0.28 year decrease in time to MS progression.
Conclusion:
MS patients would accept 0.06 more relapses/year to change their fatigue by a similar magnitude as the between-treatment difference observed in the OPTIMUM trial.
Keywords
Introduction
Fatigue occurs in about 80% of people with multiple scleroris (MS)1,2 and affects health-related quality of life (HRQoL), daily activities, and work productivity.3,4 It is often present at disease onset and tends to worsen as disability progresses.5,6 Challenging the notion that disability progression is the most important treatment goal in MS, there is evidence that fatigue may be just as important to MS patients as physical disability.4,7
The phase III OPTIMUM trial (NCT02425644) 8 compared the sphingosine 1-phosphate (S1P) receptor modulator ponesimod 20 mg versus teriflunomide 14 mg in relapsing remitting MS (RRMS) and secondary progressive MS (SPMS). The primary outcome was the annualized relapse rate (ARR) at week 108. Secondary efficacy outcomes included change in fatigue.
In OPTIMUM, fatigue was assessed using the Fatigue Symptoms and Impacts Questionnaire–Relapsing Multiple Sclerosis (FSIQ-RMS). The FSIQ-RMS9,10 was developed in accordance with Food and Drug Administration (FDA) guidance 11 to address limitations of existing MS-specific patient-reported outcome (PRO) fatigue instruments in RMS. It comprises a symptom domain (FSIQ-RMS-S) and an impact domain (FSIQ-RMS-I). OPTIMUM was its first application in a pivotal trial. Compared to teriflunomide, there was a significant difference in change in FSIQ-RMS-S score in favor of ponesimod. 8
Although improving fatigue is a key goal of MS management, it can be difficult to place changes in fatigue scores into a clinical context. One way to overcome this problem is to leverage data from stated preference studies such as discrete choice experiments (DCEs), which quantify the relative importance of different outcomes to patients. The current study aimed to understand the clinical relevance of the difference in fatigue scores between ponesimod and teriflunomide in the OPTIMUM trial. This was achieved by combining data from OPTIMUM and from a recent DCE 12 to determine the number of relapses per year and the change in time to MS progression that patients regarded as equal in importance as the treatment difference in fatigue observed in OPTIMUM. This equivalent relapse rate was contextualized by comparing it to the treatment difference in OPTIMUM.
Materials and methods
DCE
This analysis used data from a web-based DCE that assessed treatment preferences of adults with active RMS, including clinically isolated syndrome (CIS), RRMS, or active SPMS (currently under review at Multiple Sclerosis Journal—Experimental, Translational and Clinical). 12 The DCE was conducted in the United States, United Kingdom, Poland, and Russia. Here, we describe additional analyses based on that DCE.
DCE attributes included cognitive fatigue, physical fatigue, number of relapses within 2 years, and time to MS disease progression. The DCE estimated the maximum acceptable change in annual relapses and maximum acceptable change in time to MS progression that patients would accept for changes in cognitive and physical fatigue. The maximum acceptable increase in annual relapses was the change in ARR that MS patients would regard as equally as important as a given change in cognitive or physical fatigue.
After an interim analysis using DCE data for the first 201 participants, two components were added to the DCE survey to enable the results to be applied to OPTIMUM: a fatigue level “mapping” task and the FSIQ-RMS-S. Attribute levels were updated (Supplemental Methods). The updated survey was then administered to the remaining DCE participants (n = 616).
FSIQ-RMS-S
The FSIQ-RMS-S consists of seven items that assess fatigue-related symptoms in the previous 24 hours. 10 The items are physical tiredness, mental tiredness, physical weakness, energy, feeling worn out, feeling sleepy, and feeling worn out while at rest. Respondents are asked to rate each item on an 11-point numerical rating scale (NRS) from 0 (no symptoms) to 10 (highest level of symptoms). Scores for individual items are summed to give an FSIQ-RMS-S score of 0–70, which is then rescaled to range from 0 to 100. A higher FSIQ-RMS-S score indicates more severe fatigue.
Fatigue level mapping
In the DCE, physical fatigue and cognitive fatigue were both measured on a 4-point scale: “no difficulty,” “a little difficulty,” “moderate difficulty,” and “quite a bit of difficulty.” In the fatigue level mapping task, DCE participants were presented with three of these attribute levels for physical fatigue (“a little difficulty,” “moderate difficulty,” and “quite a bit of difficulty”) and were instructed to assign numeric ratings to each level on an 11-point NRS similar to the one used in the FSIQ-RMS-S (Supplemental Figure 1). The low and high anchors on this NRS were denoted as “no difficulty” and “extremely difficult” to align them with the 0 and 10 anchors on the FSIQ-RMS-S NRS.
The mean numeric ratings from the DCE participants who completed the mapping task were used to assign a score on the FSIQ-RMS-S scale for each of the three fatigue levels (“a little difficulty,” “moderate difficulty,” and “quite a bit of difficulty”). Physical fatigue and cognitive fatigue were mapped separately to the FSIQ-RMS-S. Because the FSIQ-RMS-S includes seven items, this approach required that the FSIQ-RMS-S be unidimensional (i.e. that most of its variance be described by a single underlying factor). During its development, unidimensionality of the FSIQ-RMS-S was demonstrated in confirmatory factor and Rasch analyses. 10
Linearity of the mapping was tested by fitting a linear function to the mapped FSIQ-RMS-S values and calculating the coefficient of determination (R2). Linearity was defined as R2 > 0.90.
Maximum acceptable increase in relapses/year and maximum acceptable decrease in time to MS progression
The DCE data were used to estimate the maximum acceptable increases in annual relapses and maximum acceptable decreases in time to MS progression that patients would be willing to accept for changes in DCE cognitive and physical fatigue levels. The treatment difference in least-square (LS) mean FSIQ-RMS-S score change from baseline to week 108 in OPTIMUM was then calculated as a proportion of the difference in FSIQ-RMS-S scores corresponding to an improvement in fatigue level in the DCE. Finally, values were calculated for maximum acceptable increase in annual relapses and maximum acceptable decrease in time to MS progression corresponding to the treatment difference in LS mean FSIQ-RMS-S score change in OPTIMUM (Figure 1, Supplemental Methods). Separate analyses were done for cognitive and physical fatigue. The analyses were repeated for each level of fatigue (“a little difficulty,” “moderate difficulty,” and “quite a bit of difficulty”), as well as for the average of all fatigue levels. “No difficulty” was excluded from the analyses because it was the least severe fatigue level included in the DCE, making it impossible to elicit patient preferences for improvements in fatigue from “no difficulty.” To test whether level of fatigue had an effect on patient preferences, an interacted multinomial logit model was used (Supplemental Methods).
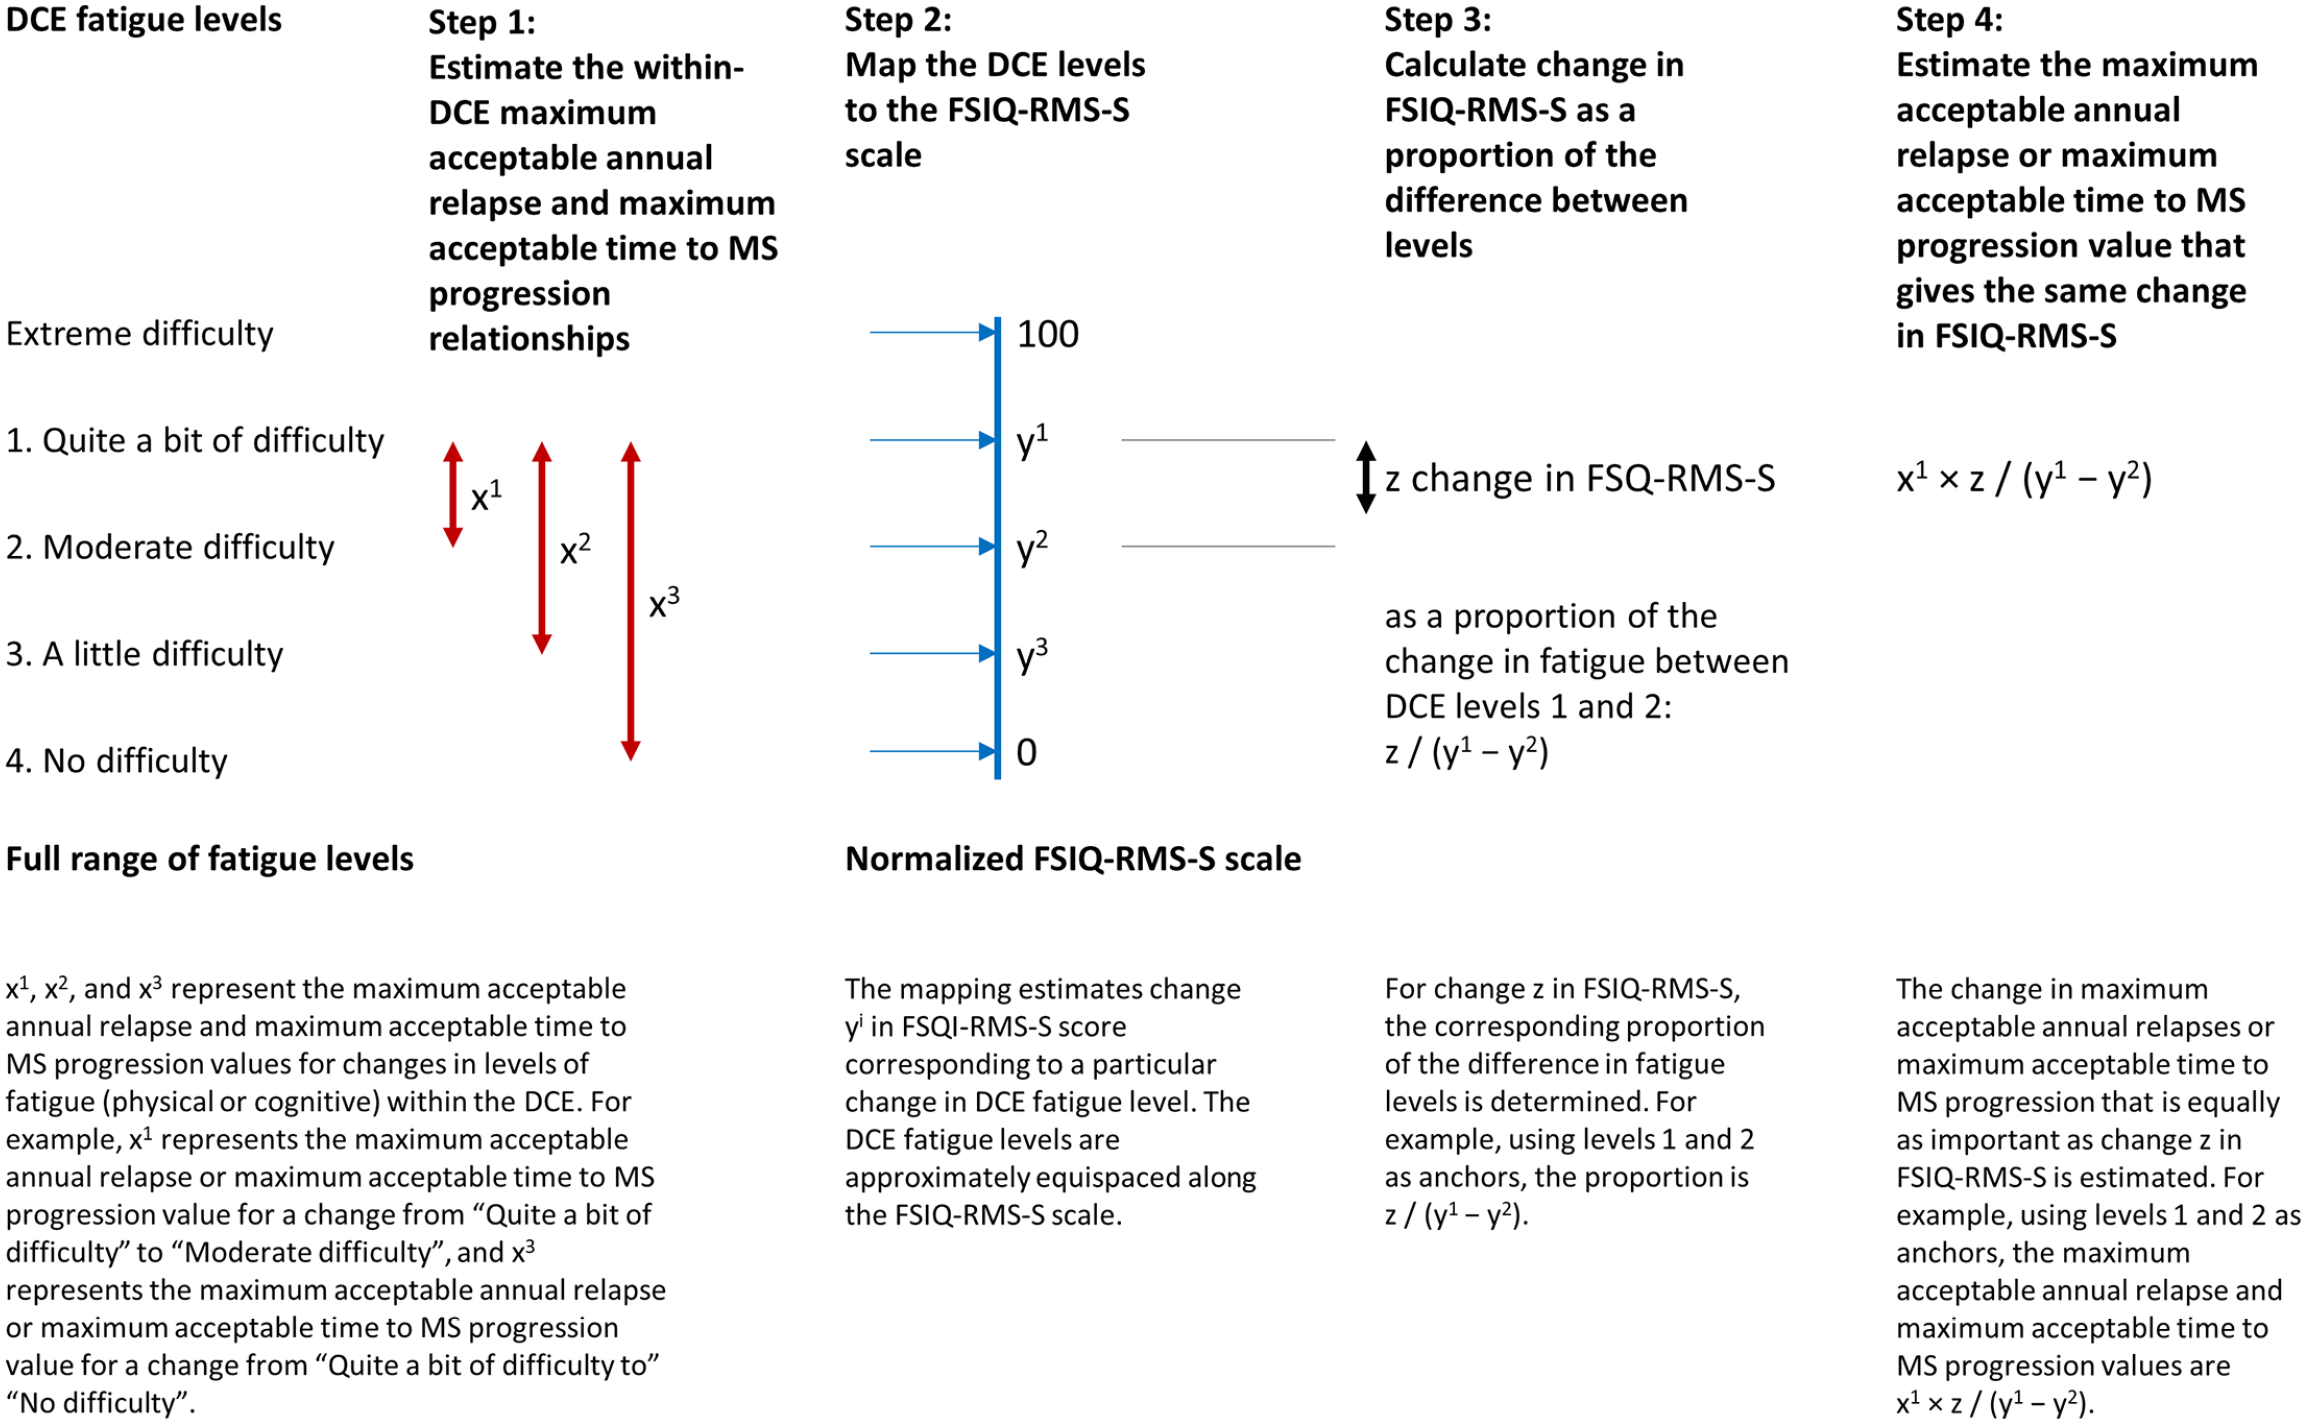
Calculation of maximal acceptable annual relapses and maximum acceptable time to MS progression.
Comparison to ARR in OPTIMUM
To assess the importance of the between-treatment difference in FSIQ-RMS-S relative to the between-treatment difference in ARR in OPTIMUM, the values for maximum acceptable increase in annual relapses derived from the DCE were compared to the ARR results from OPTIMUM. In the main comparison, ARR in OPTIMUM was derived from confirmed relapses. A sensitivity analysis was also conducted in which the ARR in OPTIMUM was derived from both confirmed and unconfirmed relapses to reflect different severities of relapses.
Results
DCE participants versus patients in OPTIMUM
Patients in OPTIMUM (ponesimod 20 mg n = 567, teriflunomide 14 mg n = 566) and DCE participants (N = 817) were generally similar on race and employment status (Table 1). However, compared to the OPTIMUM patients, mean age was approximately 5 years higher for the DCE participants and the proportion of females was also higher. The DCE sample further included a greater proportion of people from North America, and some DCE participants (1.5%) had CIS, an MS subtype not represented in the OPTIMUM sample.
Demographic and disease characteristics of participants in the DCE and patients in the OPTIMUM trial.
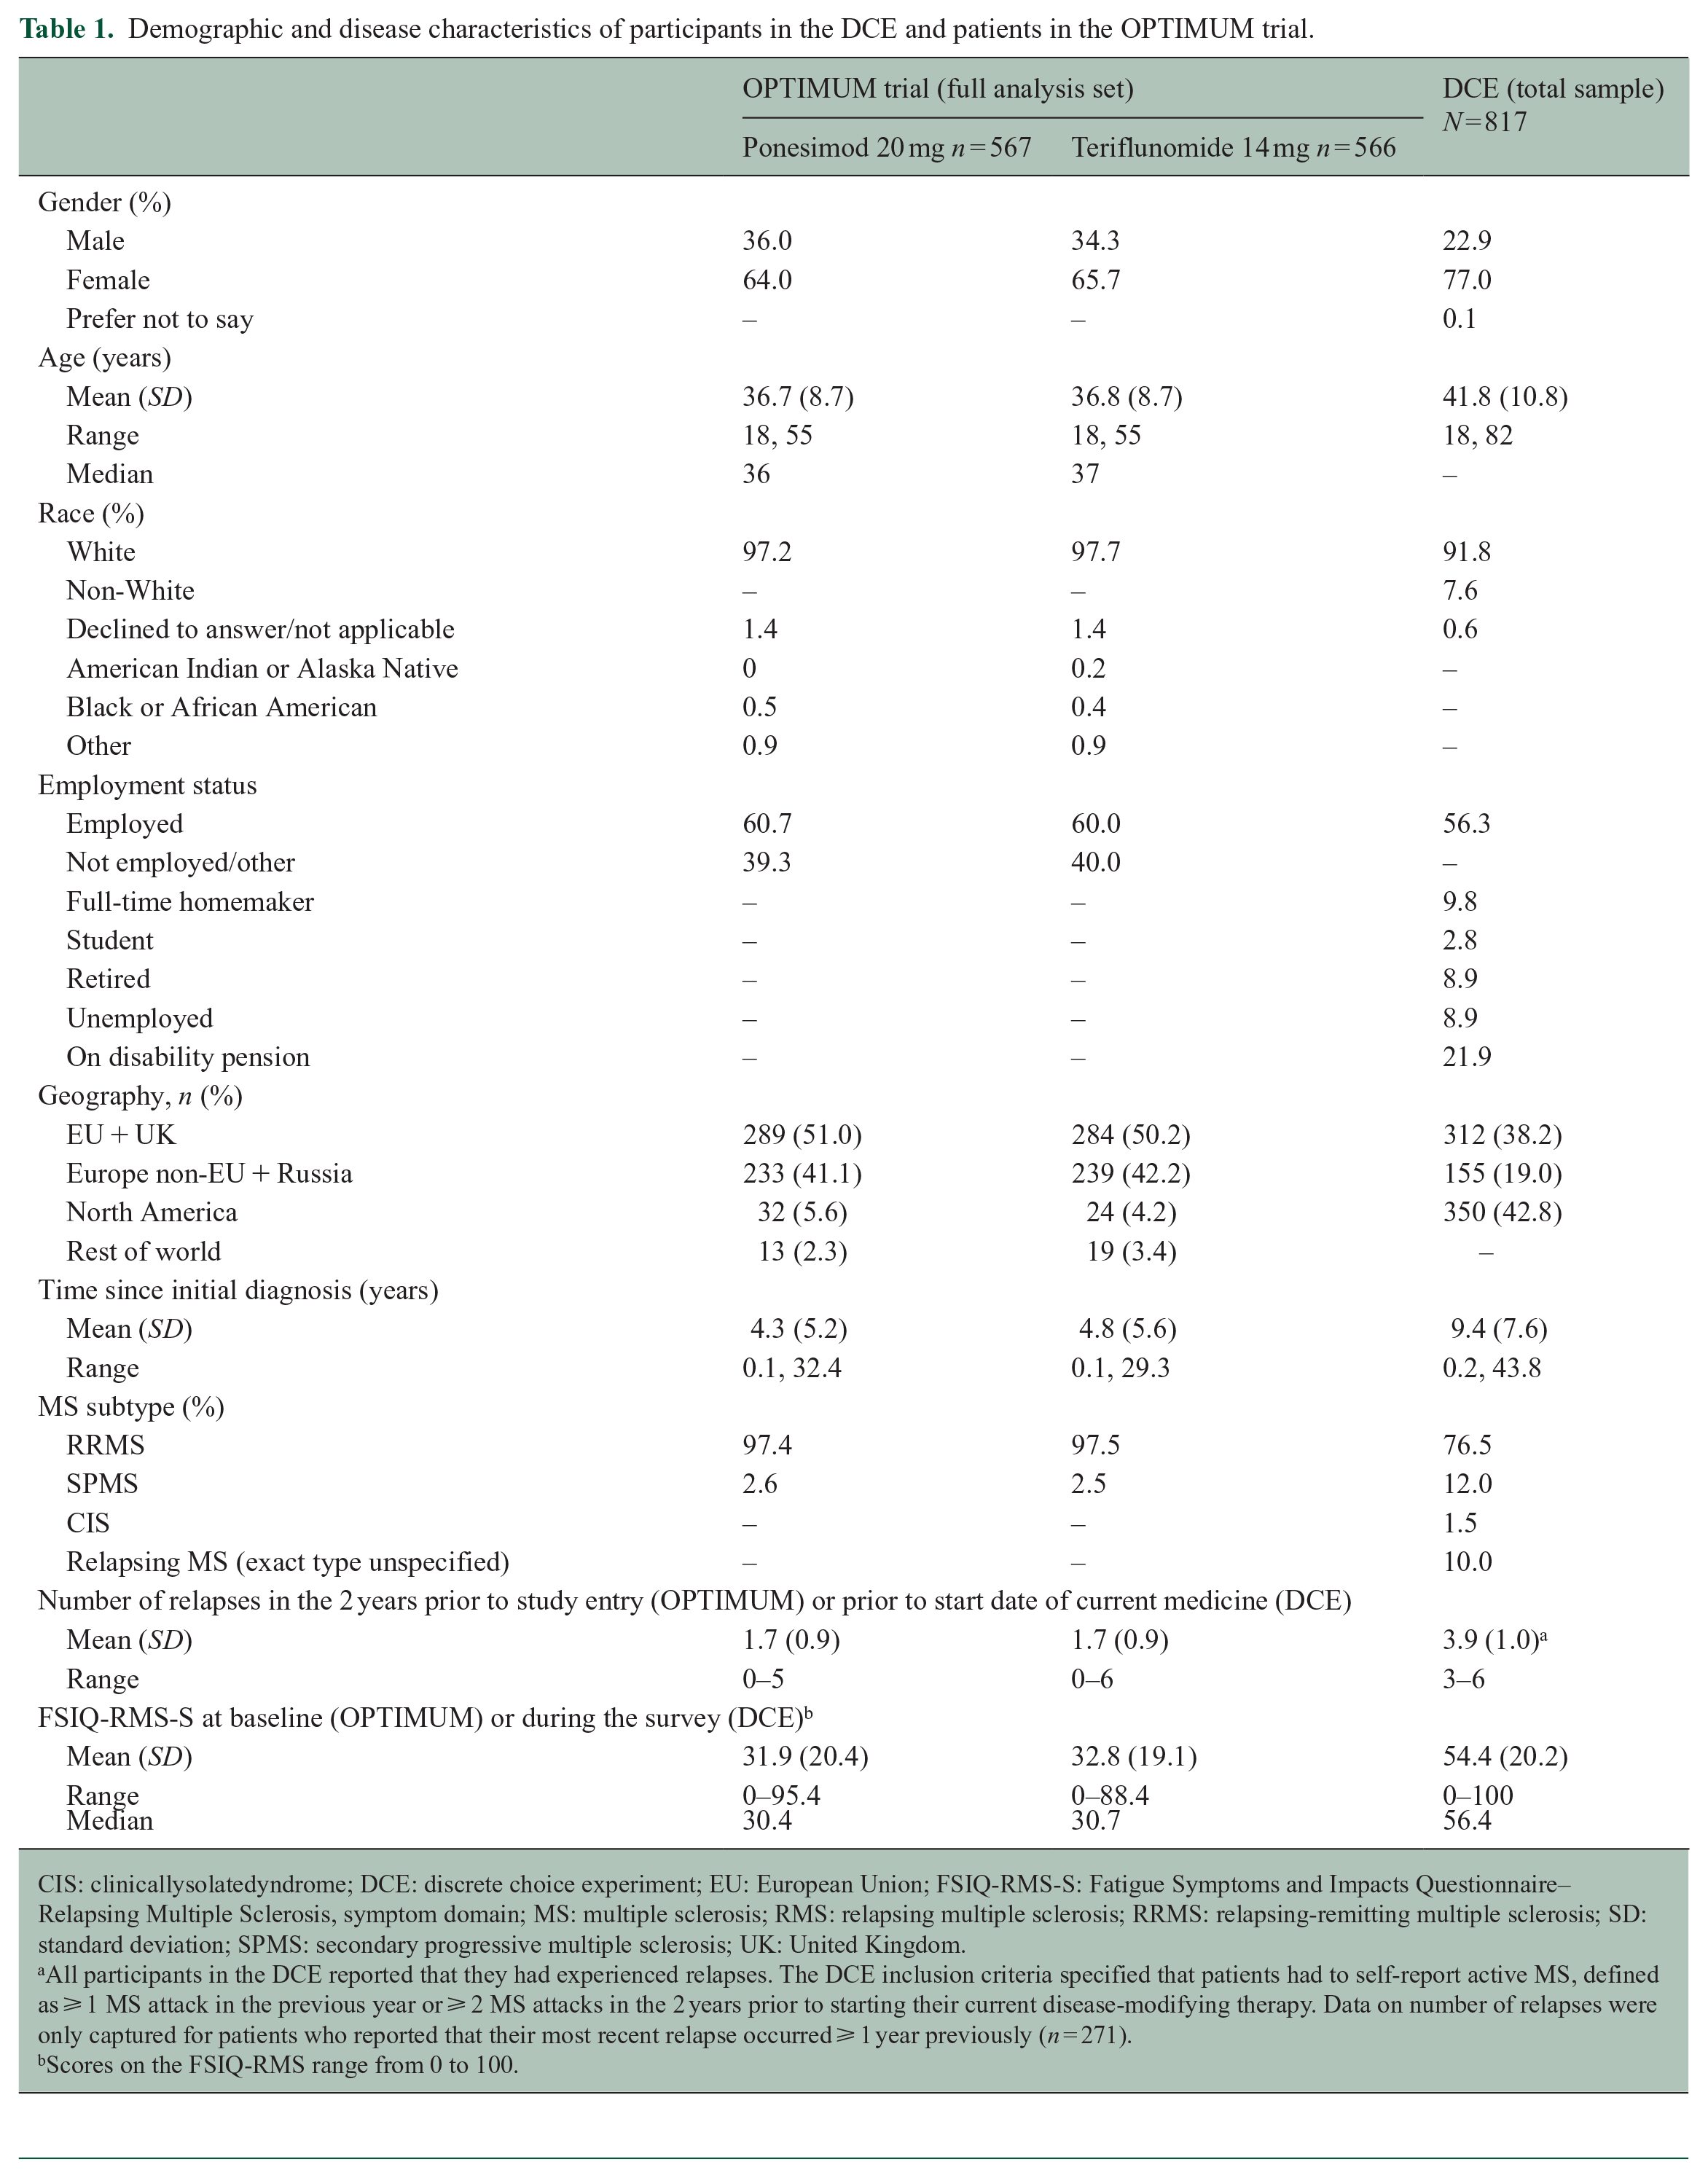
CIS: clinicallysolatedyndrome; DCE: discrete choice experiment; EU: European Union; FSIQ-RMS-S: Fatigue Symptoms and Impacts Questionnaire–Relapsing Multiple Sclerosis, symptom domain; MS: multiple sclerosis; RMS: relapsing multiple sclerosis; RRMS: relapsing-remitting multiple sclerosis; SD: standard deviation; SPMS: secondary progressive multiple sclerosis; UK: United Kingdom.
All participants in the DCE reported that they had experienced relapses. The DCE inclusion criteria specified that patients had to self-report active MS, defined as ⩾ 1 MS attack in the previous year or ⩾ 2 MS attacks in the 2 years prior to starting their current disease-modifying therapy. Data on number of relapses were only captured for patients who reported that their most recent relapse occurred ⩾ 1 year previously (n = 271).
Scores on the FSIQ-RMS range from 0 to 100.
The most important difference between the DCE and OPTIMUM samples is that DCE participants reported a greater level of baseline fatigue (Supplemental Figure 2), with a mean FSIQ-RMS-S score of 54.4 for DCE participants versus 31.9 for OPTIMUM patients treated with ponesimod and 32.8 for OPTIMUM patients treated with teriflunomide (Table 1). This may be a reflection of the longer mean time since diagnosis in the DCE participants (9.4 years) than in the OPTIMUM patients (4.3 years for ponesimod and 4.8 years for teriflunomide). Also, DCE participants had more active disease than the OPTIMUM sample (mean 3.9 vs 1.7 relapses in the previous 2 years).
FSIQ-RMS-S versus DCE fatigue level mapping
Participants’ responses to the mapping task are summarized in units of FSIQ-RMS-S score in Table 2. The mean (standard deviation (SD)) FSIQ-RMS-S scores corresponding to the different DCE physical fatigue levels were 21.3 (12.4) for “a little difficulty,” 51.5 (10.6) for “moderate difficulty,” and 83.7 (13.5) for “quite a bit of difficulty.” Mean FSIQ-RMS-S score for the DCE fatigue levels were similar between countries.
DCE/FSIQ-RMS-S mapping task.
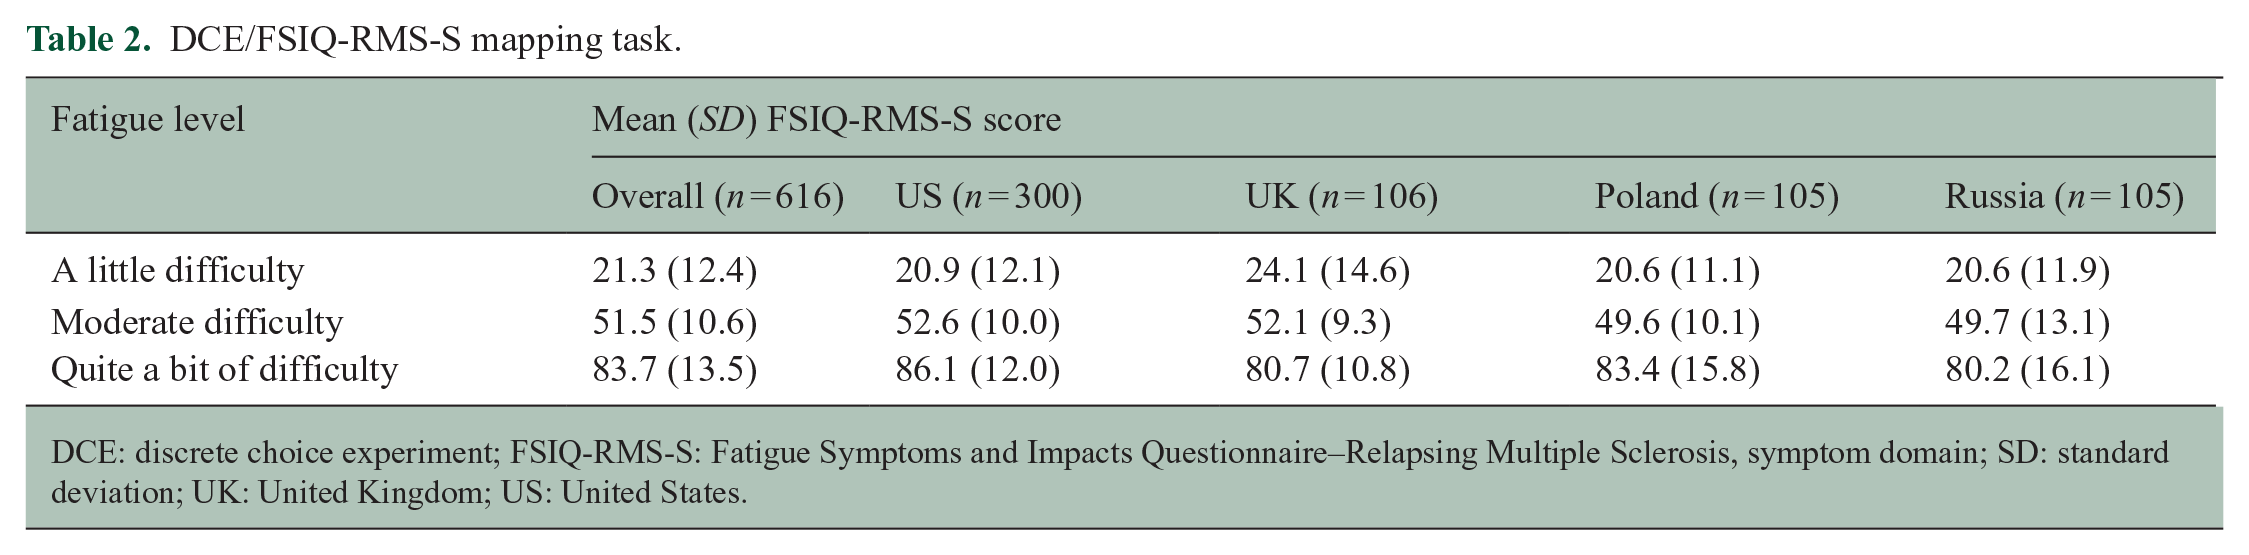
DCE: discrete choice experiment; FSIQ-RMS-S: Fatigue Symptoms and Impacts Questionnaire–Relapsing Multiple Sclerosis, symptom domain; SD: standard deviation; UK: United Kingdom; US: United States.
The mapping between DCE physical fatigue levels and the FSIQ-RMS-S scale was linear (R2 = 0.99), indicating that the DCE levels were evenly spaced along the scale used for the FSIQ-RMS-S. Based on the linearity of the mapping, FSIQ-RMS-S scores of 25 for “a little difficulty,” 50 for “moderate difficulty,” and 75 for “quite a bit of difficulty” (Table 3) were used to estimate maximum acceptable annual relapses and maximum acceptable decrease in time to MS progression (Figure 1).
Maximum acceptable increase in annual relapses and maximum acceptable decrease in time to MS progression for a 3.57-point improvement in FSIQ-RMS-S score.
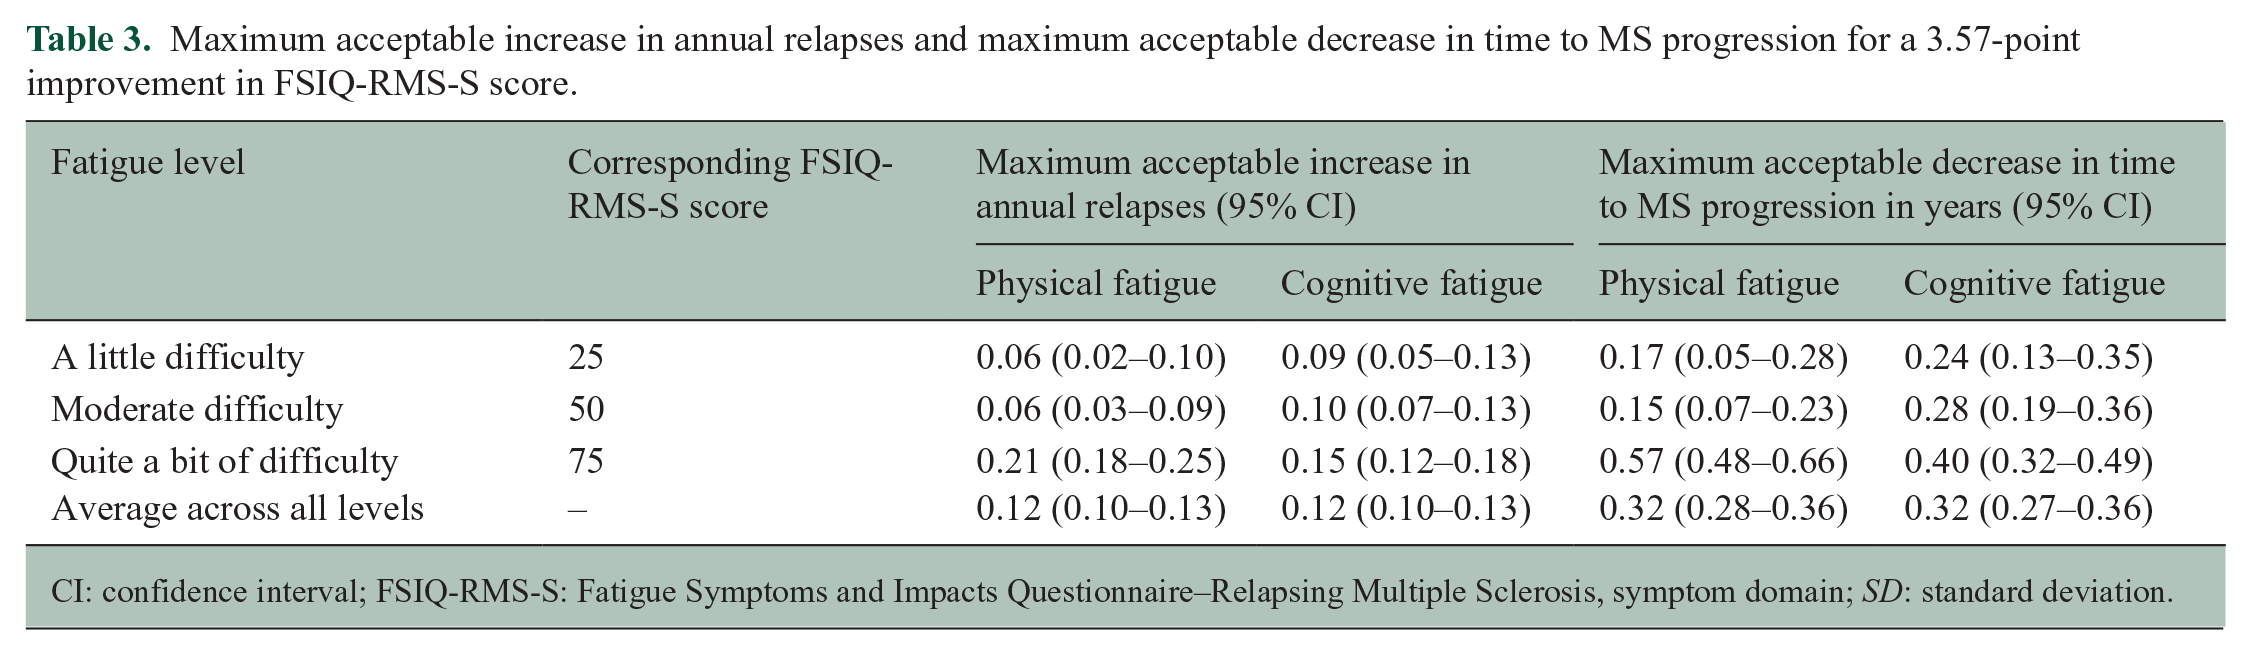
CI: confidence interval; FSIQ-RMS-S: Fatigue Symptoms and Impacts Questionnaire–Relapsing Multiple Sclerosis, symptom domain; SD: standard deviation.
Maximum acceptable increase in relapses/year in OPTIMUM
The treatment difference in FSIQ-RMS-S LS mean change from baseline to week 108 in OPTIMUM was 3.57-points, with the ponesimod arm showing little change from baseline and the teriflunomide arm showing an increase in fatigue. 8
In exchange for a 3.57-point change in FSIQ-RMS-S score, MS patients would be willing to accept an increase in relapse rate, the size of which depended on the level of fatigue. Using physical fatigue as the DCE analog for FSIQ-RMS-S, on average across the three physical fatigue levels (excluding “no difficulty,” for which improvement in fatigue is not possible), a 3.57-point change in FSIQ-RMS-S score was equal in importance to an increase of 0.12 (95% confidence interval (CI) 0.10–0.13) relapses/year (Table 3). For lower levels of physical fatigue (“a little difficulty”), which is representative of the patients in OPTIMUM at baseline, 8 the corresponding increase was 0.06 (95% CI 0.02–0.10) relapses/year. The results for moderate levels of fatigue “moderate difficulty” were similar at 0.06 (95% CI 0.03–0.09) relapses/year. For higher levels of physical fatigue (“quite a bit of difficulty”), the corresponding increase in relapse rate was 0.21 (95% CI 0.18–0.25) relapses/year.
Using cognitive fatigue as the analog for FSIQ-RMS-S, on average across the three cognitive fatigue levels, a 3.57-point change in FSIQ-RMS-S was also equal in importance to an increase of 0.12 (95% CI 0.10–0.13) relapses/year (Table 3). For lower levels of cognitive fatigue (“a little difficulty”), the corresponding increase was 0.09 (95% CI 0.05–0.13) relapses/year. The result was similar at 0.10 (95% CI 0.07–0.13) relapses/year for the level of “moderate difficulty” and higher at 0.15 (95% CI 0.12–0.18) relapses/year for a cognitive fatigue level of “quite a bit of difficulty.”
Maximum acceptable decrease in time to MS progression in OPTIMUM
On average, across all levels of physical fatigue, participants would accept a 0.32 year (95% CI 0.28–0.36) decrease in time to MS progression for a 3.57-point change in FSIQ-RMS-S score (Table 3). Similarly, across all levels of cognitive fatigue, participants would accept a 0.32 year (95% CI 0.27–0.36) decrease in time to MS progression for a 3.57-point change in FSIQ-RMS-S. As the severity of physical and cognitive fatigue increased, participants would be willing to accept a larger decrease in time to MS progression for a 3.57-point reduction in FSIQ-RMS-S.
Interacted multinomial logit model
The interaction model showed that participants’ current FSIQ-RMS-S level significantly affected importance of changes in fatigue, showing that the maximum acceptable increase in relapses/year and maximum acceptable decrease in time to MS progression (Table 3) would be lower when considered by participants with higher current FSIQ-RMS-S and higher when considered by participants with lower current FSIQ-RMS-S (Supplemental Table 1).
Comparison to the primary efficacy endpoint in the OPTIMUM study
To place the maximum acceptable increases in annual relapse values in context, we compared them to the ARR results from OPTIMUM. In OPTIMUM, mean baseline FSIQ-RMS-S scores were 31.9 in the ponesimod arm and 32.8 in the teriflunomide arm. These values fall between the DCE fatigue levels of “a little difficulty” (FSIQ-RMS-S = 25) and “moderate difficulty” (FSIQ-RMS-S = 50). For these baseline levels of fatigue, the maximum acceptable annual relapse values for “a little bit of difficulty” and “moderate difficulty” were 0.06 to 0.10, depending on whether physical or cognitive fatigue was used as the analog (Table 3). The treatment difference in ARR in OPTIMUM based on confirmed relapses was 0.088 (95% CI 0.137–0.040). The treatment difference in ARR based on both confirmed and unconfirmed relapses was 0.099 (95% CI 0.053–0.146). Both treatment differences in ARR significantly favor ponesimod compared to teriflunomide. The magnitudes of the treatment differences in ARR are similar to the maximum acceptable increases in relapses/year for fatigue levels of “a little difficulty” or “moderate difficulty.”
Discussion
To our knowledge, this is the first study to use patient preference data to quantitatively compare scores on a fatigue PRO instrument for treatment outcomes in a clinical trial. Using the treatment difference in fatigue observed in OPTIMUM and data derived from a DCE on MS treatments, we estimated that, for physical and cognitive fatigue, fatigue levels similar to those of patients in OPTIMUM at baseline would equate to participants accepting an average of 0.06 to 0.10 more relapses per year or a 0.15 to 0.28 year decrease in time to MS progression to achieve the 3.57-point difference in FSIQ-RMS-S score change seen in OPTIMUM. The relapse values are similar to the treatment differences in ARR of 0.088 (confirmed relapses) and 0.099 (confirmed and unconfirmed relapses) in OPTIMUM, which suggests that patients would regard the improvement in ARR caused by ponesimod compared to teriflunomide as equal in importance to the difference in change in fatigue caused by ponesimod compared to teriflunomide. This consistency helps offset the absence of data regarding relapse severity in the DCE population. For a fatigue level of “quite a bit of difficulty,” participants would be willing to accept larger increases in relapse rate and decreases in time to MS progression to reduce fatigue.
Overall, the importance of the 3.57-point FSIQ-RMS-S change, and hence maximum acceptable increases in relapses/year and maximum acceptable decrease in time to MS progression, increases with the baseline level of fatigue. However, the interaction model showed that those with currently higher levels of FSIQ-RMS-S would put less importance on the 3.57-unit FSIQ-RMS-S change. This suggests that those accustomed to chronic fatigue are less willing to accept changes in ARR or time to MS progression, similar to an observation that MS patients with greater disability are less accepting of treatment-related risks. 13
The questions in the DCE did not specify a starting level of fatigue, nor a direction for the change. Therefore, the DCE did not elicit preference data under the assumption that fatigue would improve or worsen. The results can be interpreted as reflecting either an improvement in fatigue or the prevention of worsening of fatigue, an important consideration since OPTIMUM showed prevention of worsening of fatigue with ponesimod, rather than improvement.
Several phase III RMS trials have included fatigue PROs as outcomes. In the TENERE, 14 TEMSO, 15 and TOWER 16 trials of teriflunomide in adults with RMS, fatigue was captured using the Fatigue Impact Scale (FIS). In the TEMSO trial, patients reported only small changes from baseline in FIS, with no significant differences among treatment arms. 15 In the TOWER trial, a greater increase in fatigue with placebo compared with teriflunomide 14 mg was determined by analysis of covariance (ANCOVA), but not in a mixed model for repeated-measures analysis. No difference in fatigue between placebo and teriflunomide 7 mg was observed. 16
Among pivotal trials of S1P receptor modulators, fatigue was only assessed using the Modified Fatigue Impact Scale (mFIS) in the TRANSFORMS 17 and FREEDOMS II 18 trials of fingolimod. OPTIMUM is the first trial of an S1P receptor modulator to implement a measure of fatigue as a pre-specified secondary endpoint using a validated disease-specific fatigue PRO.
Interpretation of the present findings should consider the limitations of the preference study and the general approach. Participants in the DCE reported greater fatigue than the OPTIMUM patients did at baseline, which may have skewed the estimation of numbers of additional relapses and decreases in time to MS progression participants would be willing to accept. However, we calculated maximum acceptable increase in annual relapses and maximum acceptable decrease in time to MS progression for different baseline fatigue categories, thus adjusting for that difference. The DCE did not assess severity of relapses. If those relapses were more severe than in OPTIMUM, the DCE results could place greater value on a change in fatigue. Therefore, additional analysis using all relapses from OPTIMUM effectively assesses less severe relapses to mitigate this concern.
In addition, the linear results from the mapping task may reflect simplification by responders (i.e. placing fatigue categories equidistantly on the NRS) rather than true linearity. However, the results for the DCE sample overall (all fatigue levels) had little dependence on this linearity, suggesting that even if this linearity reflects a simplification by responders, it is of limited impact. A further limitation is the lack of an “extreme difficulty” level for the fatigue attributes in the DCE. This meant that the values for maximum acceptable increase in annual relapses and maximum acceptable decrease in time to MS progression averaged across different baseline fatigue levels did not cover the full range of fatigue severities represented on the FSIQ-RMS-S scale. Finally, fatigue is a multi-dimensional, complex construct. In reducing it to simpler elements, even with the unidimensionality of the FSIQ-RMS-S, we may have over-simplified it.
In summary, MS patients would regard the change in fatigue caused by ponesimod compared to teriflunomide as similar in importance to the change in ARR caused by ponesimod compared to teriflunomide and would accept decreases in time to MS progression for a change in fatigue equal to the 3.57-point change in OPTIMUM. These observations highlight the level of disruption caused by fatigue and the importance of fatigue treatment to people living with MS.
Supplemental Material
sj-docx-1-msj-10.1177_13524585221140270 – Supplemental material for The relevance of fatigue to relapse rate in multiple sclerosis: Applying patient preference data to the OPTIMUM trial
Supplemental material, sj-docx-1-msj-10.1177_13524585221140270 for The relevance of fatigue to relapse rate in multiple sclerosis: Applying patient preference data to the OPTIMUM trial by Robert J Fox, Tommi Tervonen, Andrea Phillips-Beyer, Tatiana Sidorenko, Neli Boyanova, Anne Brooks, Brian Hennessy, Carol Jamieson and Bennett Levitan in Multiple Sclerosis Journal
Footnotes
Acknowledgements
We would like to thank Holly Richendrfer, PhD, and Stephen Gilliver, PhD, of Evidera for their medical writing assistance, and Nicolas Krucien of Evidera for assistance with the analyses. We also thank Antoine Stos, of Janssen Research & Development, who consulted with us on the statistics from the OPTIMUM trial. and Carol Jamieson of Janssen Research & Development, who assisted with the FSIQ-RMS analyses.
Declaration of Conflicting Interests
The author(s) declared the following potential conflicts of interest with respect to the research, authorship, and/or publication of this article: TT and AB are former employees of Evidera, which was paid by Actelion Pharmaceuticals Ltd, now a Janssen Pharmaceutical Company of Johnson & Johnson, for work on this study. TS, NB, and BH are employees of Actelion Pharmaceuticals Ltd, a Janssen Pharmaceutical company of Johnson & Johnson and may hold stock in Johnson & Johnson. BL and CJ are employees of Janssen Research and Development, LLC. BL, CJ, and NB are stockholders in Johnson & Johnson, and BL and NB have a portfolio that at times includes other pharmaceutical and health care–related companies. APB is a director of Innovus Consulting Ltd and holds a stock portfolio that at times includes pharmaceutical and health care–related companies. RF has received personal consulting fees from AB Science, Biogen, Celgene, EMD Serono, Genentech, Genzyme, Greenwich Biosciences, Immunic, Janssen, Novartis, Sanofi, and TG Therapeutics. RF has served on advisory committees for AB Science, Biogen, Genzyme, Immunic, Janssen, Novartis, Sanofi, and TG Therapeutics, and received clinical trial contract and research grant funding from Biogen, Novartis, and Sanofi.
Funding
The author(s) disclosed receipt of the following financial support for the research, authorship, and/or publication of this article: The study was funded by Actelion Pharmaceuticals Ltd, which is now a Janssen Pharmaceutical Company of Johnson & Johnson.
Research Ethics and Patient Consent
The DCE study was approved by the institutional review board (IRB) Ethical & Independent (E&I) Review Services (Ref No. 18156).
Research Data
Data are available from the corresponding authors upon reasonable request.
Writing Assistance
Writing assistance was provided by Holly Richendrfer, PhD, and Stephen Gilliver, PhD, of Evidera and was paid for by Actelion Pharmaceuticals Ltd, which is now a Janssen Pharmaceutical Company of Johnson & Johnson.
Supplemental material
Supplemental material for this article is available online.
References
Supplementary Material
Please find the following supplemental material available below.
For Open Access articles published under a Creative Commons License, all supplemental material carries the same license as the article it is associated with.
For non-Open Access articles published, all supplemental material carries a non-exclusive license, and permission requests for re-use of supplemental material or any part of supplemental material shall be sent directly to the copyright owner as specified in the copyright notice associated with the article.