
Abstract
Objective:
To investigate glial and neuronal biomarkers in cerebrospinal fluid (CSF) samples from patients with relapsing–remitting multiple sclerosis (RRMS) and clinically isolated syndrome (CIS) suggestive of multiple sclerosis (MS), and to evaluate their ability to predict conversion from CIS to clinically definite MS (CDMS) and also disability progression in MS.
Methods:
CSF levels of neurofilament light protein (NFL), t-tau, p-tau, glial fibrillary acidic protein (GFAP), S-100B, human chitinase 3-like 1 protein (YKL-40), monocyte chemoattractant protein-1 (MCP-1), α-sAPP and β-sAPP; and Aβ38, Aβ40 and Aβ42, were analyzed in 109 CIS patients and 192 RRMS patients. The mean follow-up time of these 301 patients was 11.7 ± 6.4 years.
Results:
High levels of NFL were associated with early conversion from CIS to CDMS (hazard ratio (HR) with 95% confidence interval (CI): 2.69 (1.75 – 4.15); p < 0.0001). High levels of YKL-40 and GFAP were associated with earlier progression in the Expanded Disability Status Scale (EDSS), score 3: YKL-40 (HR (95% CI): 2.78 (1.48 – 5.23); p = 0.001) and GFAP (HR (95% CI): 1.83 (1.01 – 3.35); p = 0.04). High levels of YKL-40 were associated with earlier progression to EDSS 6 (HR (95% CI): 4.57 (1.01 – 20.83); p = 0.05).
Conclusions:
CSF levels of NFL in CIS patients are an independent prognostic marker for conversion to CDMS. Whereas, CSF levels of YKL-40 and GFAP are independent prognostic markers for disability progression in MS.
Keywords
Introduction
Multiple sclerosis (MS) is considered an autoimmune disease of the central nervous system (CNS), presenting with unpredictable clinical relapses and remissions and/or by disability progression over time. 1 The pathology of MS is characterized by an inflammatory reaction in close relationship with diffuse neurodegenerative processes. 2 There is evidence suggesting that astroglial activation and axonal damage are both present in the early stages of the disease.3–6 Histopathological studies show that reactive astrocytes in acute lesions release chemokines that activate microglia and increase the permeability of the blood-brain barrier, which allow the migration of macrophages and T lymphocytes into the CNS parenchyma.7,8 Hence, astroglial activation could be an important trigger of the immune system cascade that ends in neuronal injury, inflammatory demyelination and axonal degeneration. 9 On the other hand, in chronic lesions, damaged astrocytes participate in gliotic scar formation 10 ; therefore astroglia, together with axonal damage, may be involved in neurodegeneration, 11 the major cause of neurological disability and clinical progression of MS. 12
The aim of our study was to investigate glial and neuronal biomarkers in cerebrospinal fluid (CSF) samples from patients with relapsing–remitting forms of MS (RRMS) and to test for their ability to predict conversion from clinically-isolated syndrome (CIS) to clinically-definite MS (CDMS); and also, disability progression in MS. Therefore, we analyzed biomarkers related to axonal damage, such as neurofilament light protein (NFL) 5 ; neuronal injury, such as the total-tau (t-tau) and tau phosphorylated at threonine 181(p-tau) 13 ; glial activation markers as the human chitinase 3-like 1 protein (YKL-40) and monocyte chemoattractant protein (MCP-1)4,8; astrocytic damage or astrogliosis as glial fibrillary acidic protein (GFAP) and S-100B protein (S100B)3,14; and amyloid metabolism, such as α-cleaved soluble amyloid-precursor protein (α-sAPP), β-cleaved soluble amyloid-precursor protein (β-sAPP), and the 38-, 40- and 42-amino acid long fragments of amyloid β (Aβ38, Aβ40 and Aβ42, respectively).15,16
Materials and methods
The study was approved by the ethics committee of Bellvitge University Hospital, L’Hospitalet de Llobregat, Spain and informed consent was obtained from all patients.
Study participants and clinical assessments
We analyzed a total of 301 samples matched with clinical data from patients recruited and prospectively followed at the MS Unit, Department of Neurology, Bellvitge University Hospital. All clinical data were entered into the European Database for Multiple Sclerosis (EDMUS). 17 Data were sequentially updated at follow-up visits, by a trained neurologist. We included patients at the time point when their CIS or MS diagnosis was made. CIS was defined as the first neurological event suggestive of MS. Definite MS was diagnosed according to the Poser 18 and McDonald 19 criteria, as appropriate.18–20
All patients underwent magnetic resonance imaging (MRI) studies. Patients were classified as having clinically-definite RRMS (n = 192) and CIS (n = 109), according to the disease course at the time of lumbar puncture (LP). Relapse was defined as having signs of neurological dysfunction lasting more than 24 hours. 19 For inclusion into the relapsing group, the first signs of relapse had to have started within 1 month of sampling. Clinical manifestations at MS onset or during relapse were classified as long-tract disorders, brainstem affection, myelitis or optic neuritis, according to neurological signs and MRI studies. The neurological deficits were scored using the Expanded Disability Status Scale (EDSS). 21 Disability endpoints were considered as the EDSS score that was stable for at least 1 year. We estimated disease duration from the onset of the first neurological symptoms. At the last clinical follow-up, patients were classified into four groups, according to their disease course: CIS, CIS converters to RRMS, RRMS and RRMS converters to secondary progressive multiple sclerosis (SPMS).
CSF sampling
We obtained all CSF samples from the Bellvitge Biomedical Research Institute (IDIBELL), CSF Biobank MS Unit collection in Bellvitge University Hospital. This biobank contains coded CSF samples from patients having undergone diagnostic lumbar punctures at the Department of Neurology, in the course of routine diagnostic measures. We obtained CSF samples from around the time of the first neurological examination at our MS Unit. CSF was collected in glass tubes and immediately analyzed for their cell count, protein concentration and IgG oligoclonal bands (OCB). For banking, we stored 1-ml aliquot samples in polypropylene tubes at – 80ºC, until analysis. Our samples were collected between 1997 and 2008, and their clinical assessment ranged from May 1997 to November 2011. All the samples analyzed were thawed only once. Our study samples were coded and analyzed by board-certified laboratory technicians, in a blinded fashion.
CSF analyses
We analyzed the concentrations of NFL in CSF using the UmanDiagnostics NFlight® assay (UmanDiagnostics, Umea, Sweden), as was previously described. 22 The assay is a solid-phase sandwich enzyme-linked immunoassay (ELISA), with no known cross-reactivity with other brain antigens. The detection limit was 31 ng/L. The respective intra- and inter-assay coefficients of variation (CV) were < 6% and < 9%, respectively. GFAP was measured using a previously-described in-house ELISA procedure. 23 The detection limit of the GFAP assay was 32 ng/L. The respective intra- and inter-assay CV were 4% and 8%. CSF levels of S100B were measured using the Modular system® and the S-100B reagent kit (Roche Diagnostics, Basel, Switzerland). Its intra- and inter-assay CV were below 3%.
We analyzed t-tau and p-tau with INNOTEST® (Innogenetics, Gent, Belgium). The respective detection limits were 60 pg/mL and 15.6 pg/mL. Intra- and inter-assay CV were below 10%.
We analyzed YKL-40 with a Quantikine® ELISA (R&D Systems, Minneapolis, MN, USA). We diluted CSF samples 1:100 in this analysis. The detection limit was 8.15 pg/mL. The respective intra- and inter-assay CV were 4.7% and 6.9%. We analyzed MCP-1, α-sAPP, β-sAPP, Aβ38, Aβ40, and Aβ42 assays with the MSD MultiarrayTM 96-well immunoassay (Meso Scale Discovery, Gaithersburg, MD, USA). The detection limits were 4.2 pg/mL for MCP-1, 120 pg/mL for α-sAPP, 52 pg/mL for β-sAPP, 5 pg/mL for Aβ38, 5 pg/mL for Aβ40, and 4 pg/mL for Aβ42. Intra- and inter-assay CV were below 10%. The samples with levels below the detection limit were assigned the detection limit value.
Statistics
We described continuous variables by their mean and standard deviation (m(SD)), or median and interquartile range (IQR), depending on their distribution, and their categorical variables by numbers and percentages. Frequency distributions were examined using binominal and χ2 contingency tests. Differences between groups were analyzed with the Kruskal-Wallis test, followed by pairwise post-hoc comparisons, using the Mann-Whitney U test. A p value ≤ 0.05 was considered significant. The p values of post-hoc comparisons were adjusted using the Bonferroni (Holms) correction.
We evaluated the time to CDMS in the CIS group, and the time to disability endpoints in relapsing-remitting forms of MS groups (CIS and RRMS). We used the median biomarker level as a cut-off to classify patients into two groups: Those with high levels and those with low levels. We categorized by age at first symptoms, age at LP, disease duration and EDSS, using as cut-offs the median of each variable. For univariate analysis, we used the Kaplan-Meier estimator to assess our patients’ survival: Univariate analysis included gender, age at first symptoms, age at LP, disease duration at LP, EDSS at LP, the OCB, storage time and the 12 CSF biomarkers. We considered p values ≤ 0.1 for inclusion in the multivariate analysis. For the multivariate analysis, we used a Cox Hazard regression model to find the independent risk variables for time conversion to CDMS, and the period of time to reach EDSS 3 and EDSS 6. We prepared univariate and multivariate statistical analyses using Statistical Package for the Social Sciences 20.0 package (SPSS, Chicago, IL, USA).
Results
Patient demographics are shown in Table 1. Baseline biomarker levels are shown in Table 2. Table 3 shows the correlations between baseline biomarker levels and demographic characteristics. We included a total of 301 subjects (65% women). The mean age at first symptoms of MS was 29.7 ± 9.2 years, while the mean age at LP was 33.8 ± 9.3 years. On average, patients were followed for 11.7 ± 6.4 years: 68 patients reached EDSS 3 and 19 patients reached EDSS 6. The CIS patients presented with long tract (42.2%), brainstem (22.9%), myelitis (11%) and optic neuritis (23.9%) disorders. The mean follow-up time was 8.5 ± 3.1 years for the CIS converters, and 6.1 ± 2.6 years for the non-converters. At the end of the follow-up period, 94.5% had converted to CDMS.
Demographics and clinical characteristics of MS patients.
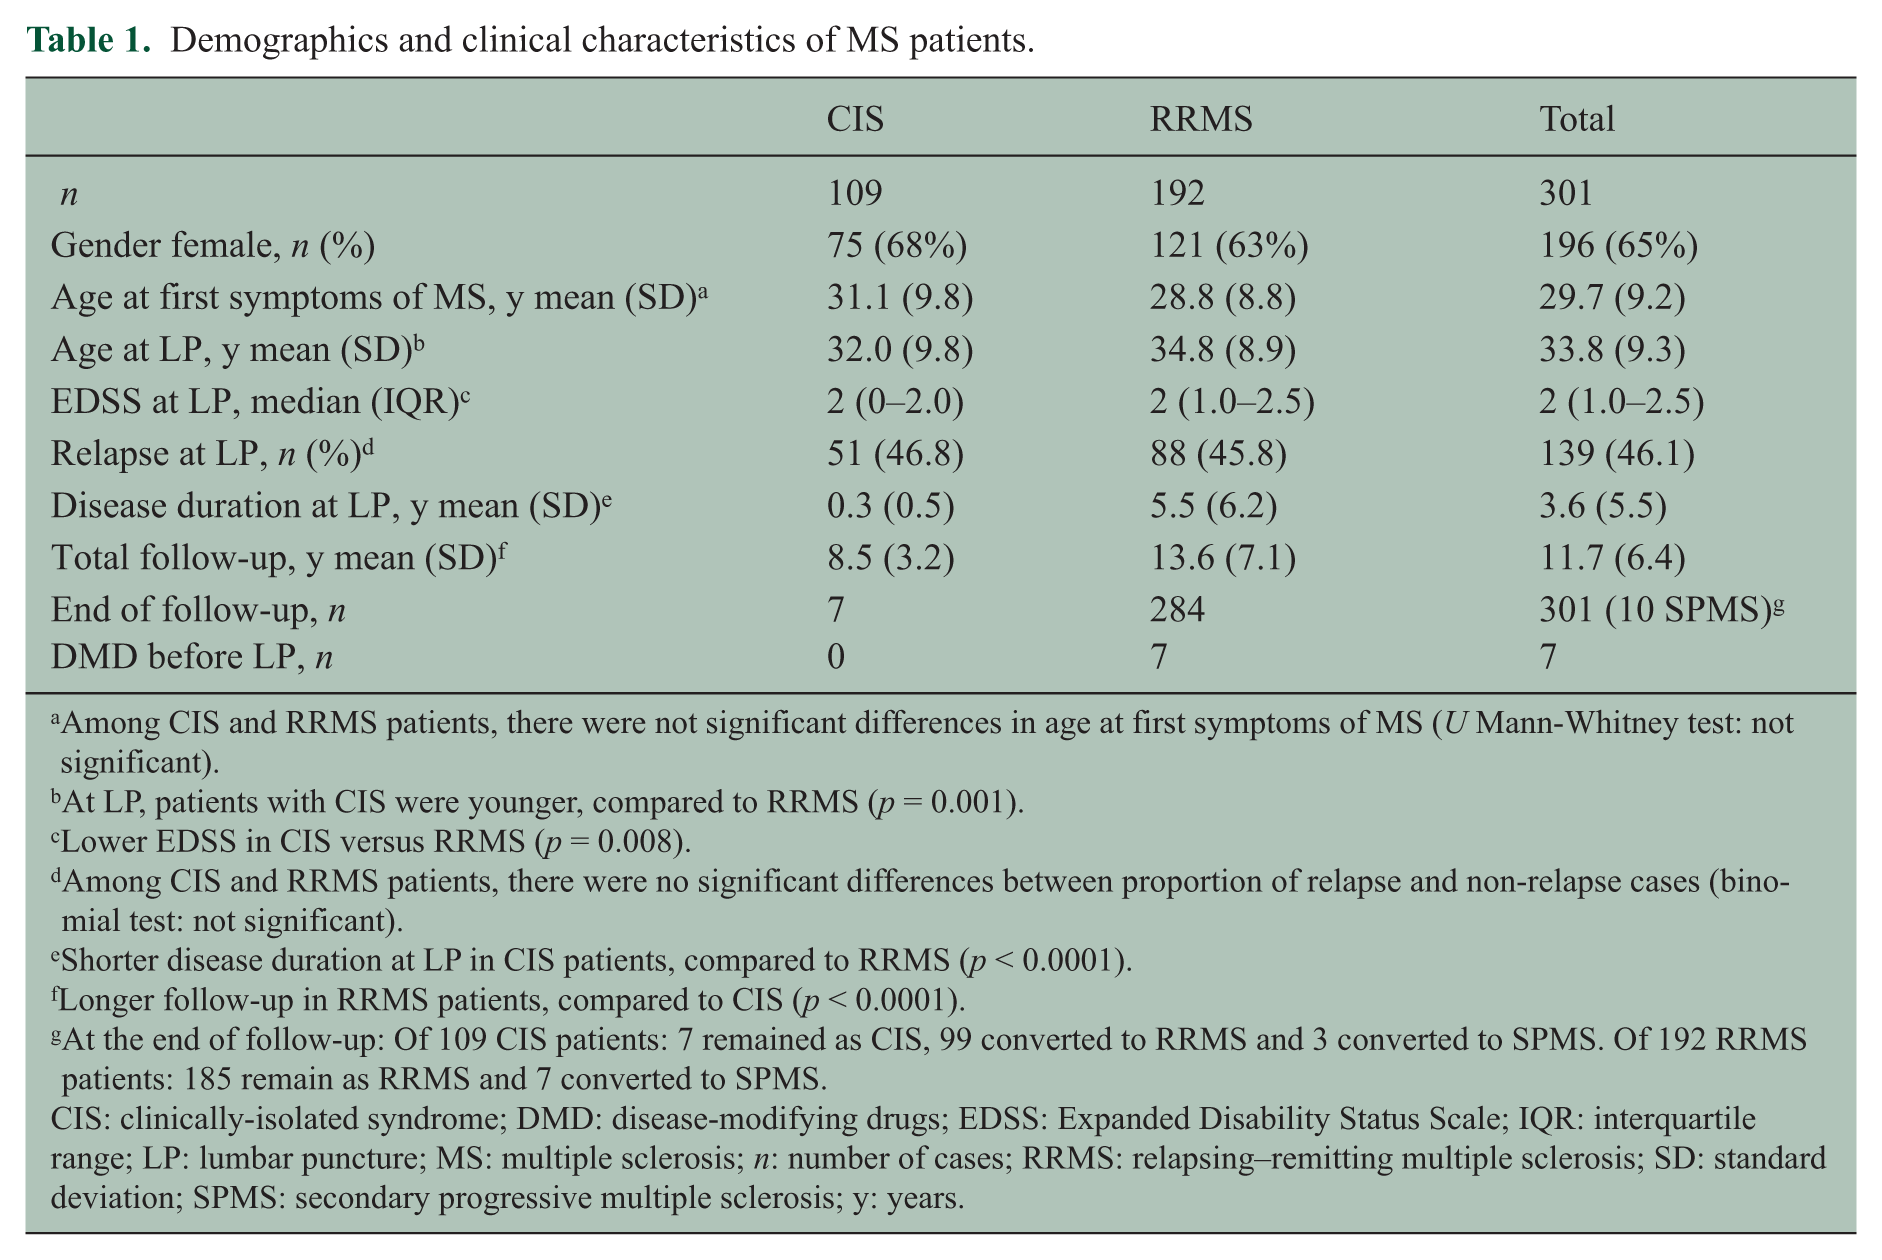
Among CIS and RRMS patients, there were not significant differences in age at first symptoms of MS (U Mann-Whitney test: not significant).
At LP, patients with CIS were younger, compared to RRMS (p = 0.001).
Lower EDSS in CIS versus RRMS (p = 0.008).
Among CIS and RRMS patients, there were no significant differences between proportion of relapse and non-relapse cases (binomial test: not significant).
Shorter disease duration at LP in CIS patients, compared to RRMS (p < 0.0001).
Longer follow-up in RRMS patients, compared to CIS (p < 0.0001).
At the end of follow-up: Of 109 CIS patients: 7 remained as CIS, 99 converted to RRMS and 3 converted to SPMS. Of 192 RRMS patients: 185 remain as RRMS and 7 converted to SPMS.
CIS: clinically-isolated syndrome; DMD: disease-modifying drugs; EDSS: Expanded Disability Status Scale; IQR: interquartile range; LP: lumbar puncture; MS: multiple sclerosis; n: number of cases; RRMS: relapsing–remitting multiple sclerosis; SD: standard deviation; SPMS: secondary progressive multiple sclerosis; y: years.
CSF biomarker levels at baseline.
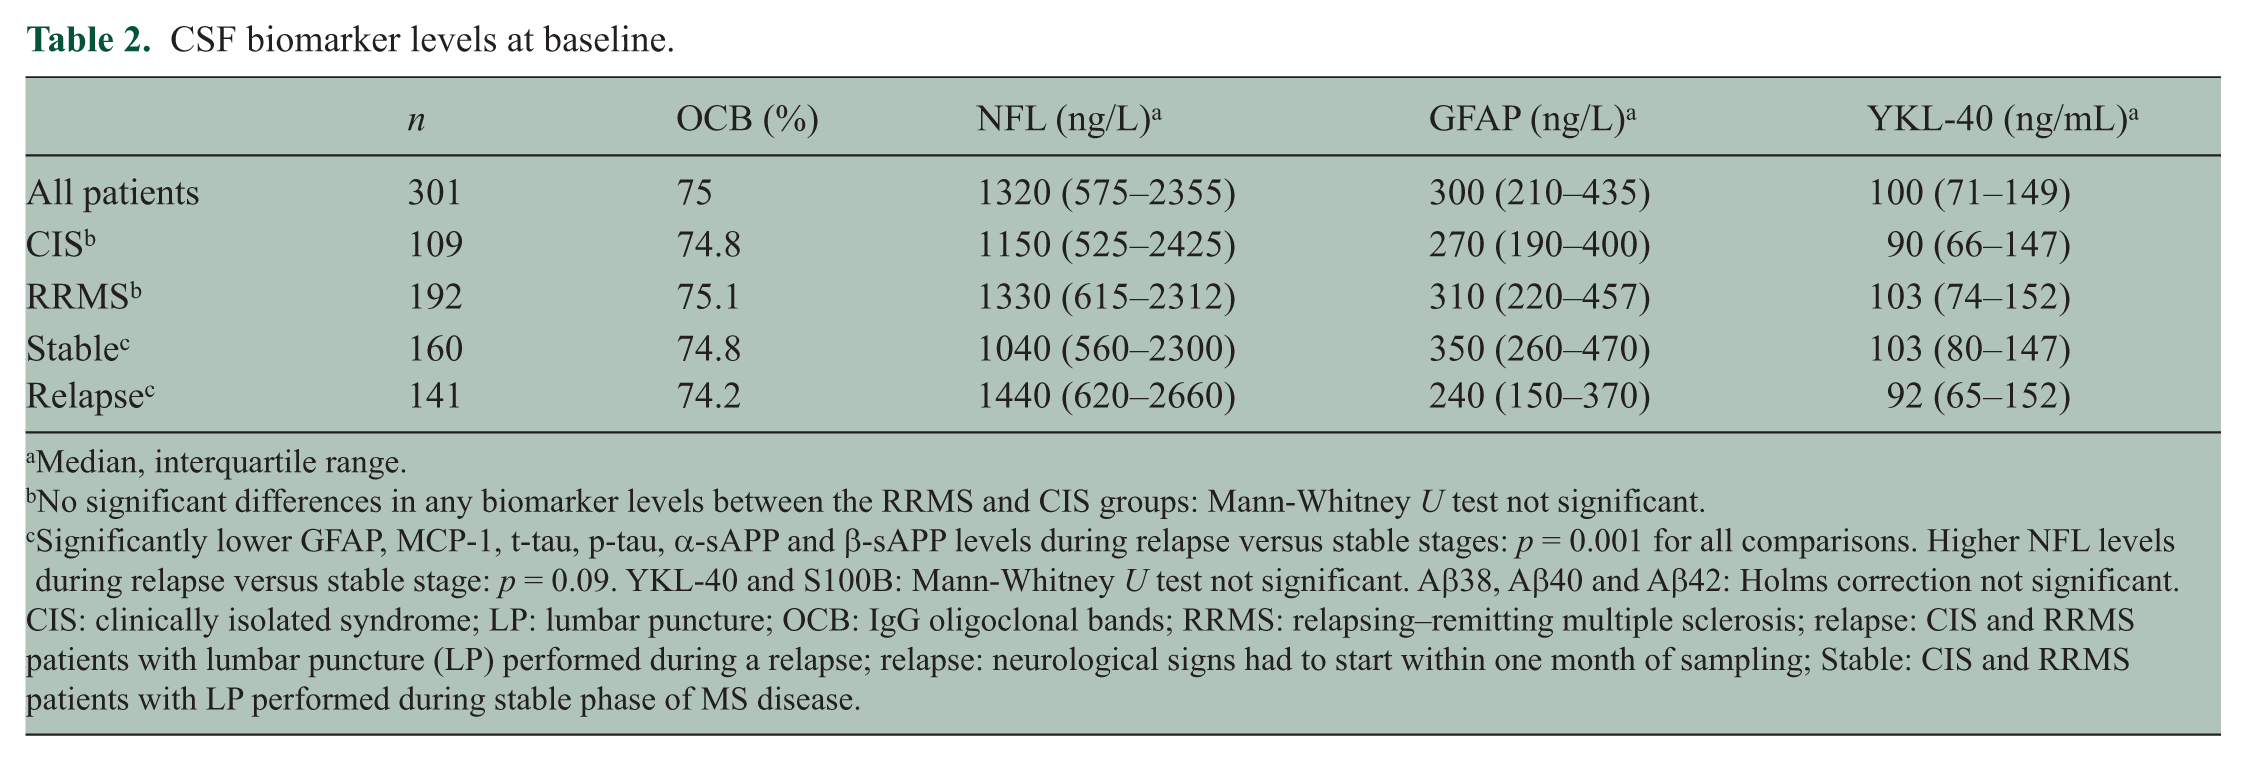
Median, interquartile range.
No significant differences in any biomarker levels between the RRMS and CIS groups: Mann-Whitney U test not significant.
Significantly lower GFAP, MCP-1, t-tau, p-tau, α-sAPP and β-sAPP levels during relapse versus stable stages: p = 0.001 for all comparisons. Higher NFL levels during relapse versus stable stage: p = 0.09. YKL-40 and S100B: Mann-Whitney U test not significant. Aβ38, Aβ40 and Aβ42: Holms correction not significant.
CIS: clinically isolated syndrome; LP: lumbar puncture; OCB: IgG oligoclonal bands; RRMS: relapsing–remitting multiple sclerosis; relapse: CIS and RRMS patients with lumbar puncture (LP) performed during a relapse; relapse: neurological signs had to start within one month of sampling; Stable: CIS and RRMS patients with LP performed during stable phase of MS disease.
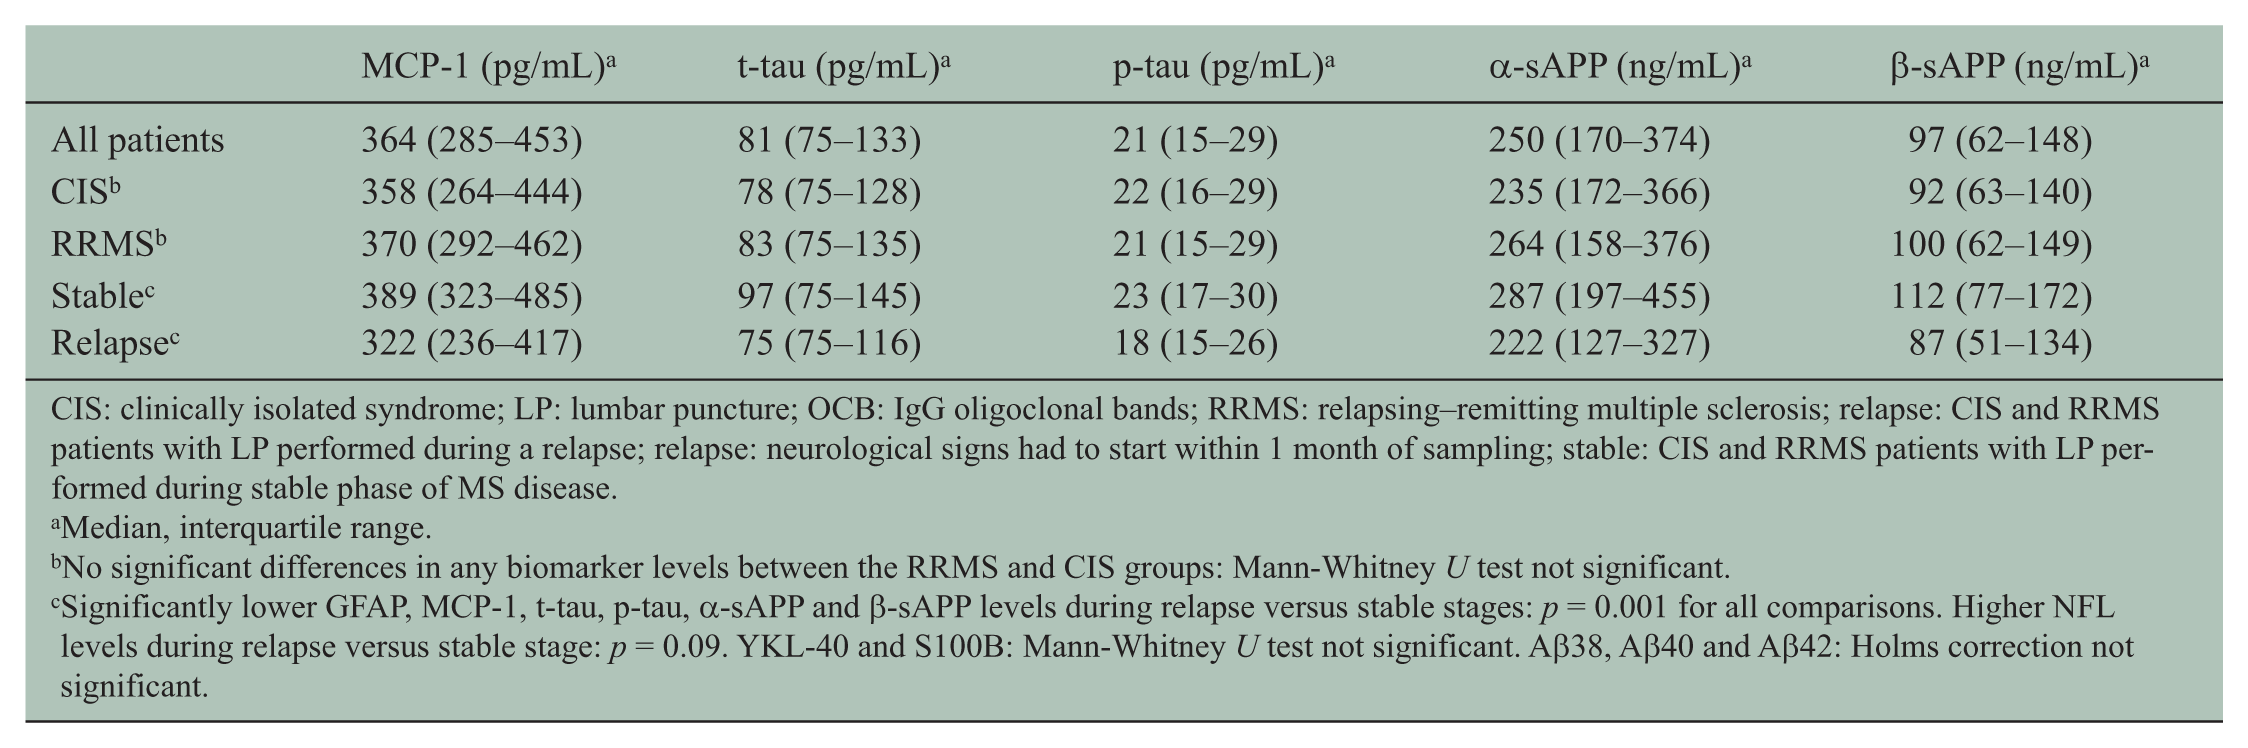
CIS: clinically isolated syndrome; LP: lumbar puncture; OCB: IgG oligoclonal bands; RRMS: relapsing–remitting multiple sclerosis; relapse: CIS and RRMS patients with LP performed during a relapse; relapse: neurological signs had to start within 1 month of sampling; stable: CIS and RRMS patients with LP performed during stable phase of MS disease.
Median, interquartile range.
No significant differences in any biomarker levels between the RRMS and CIS groups: Mann-Whitney U test not significant.
Significantly lower GFAP, MCP-1, t-tau, p-tau, α-sAPP and β-sAPP levels during relapse versus stable stages: p = 0.001 for all comparisons. Higher NFL levels during relapse versus stable stage: p = 0.09. YKL-40 and S100B: Mann-Whitney U test not significant. Aβ38, Aβ40 and Aβ42: Holms correction not significant.
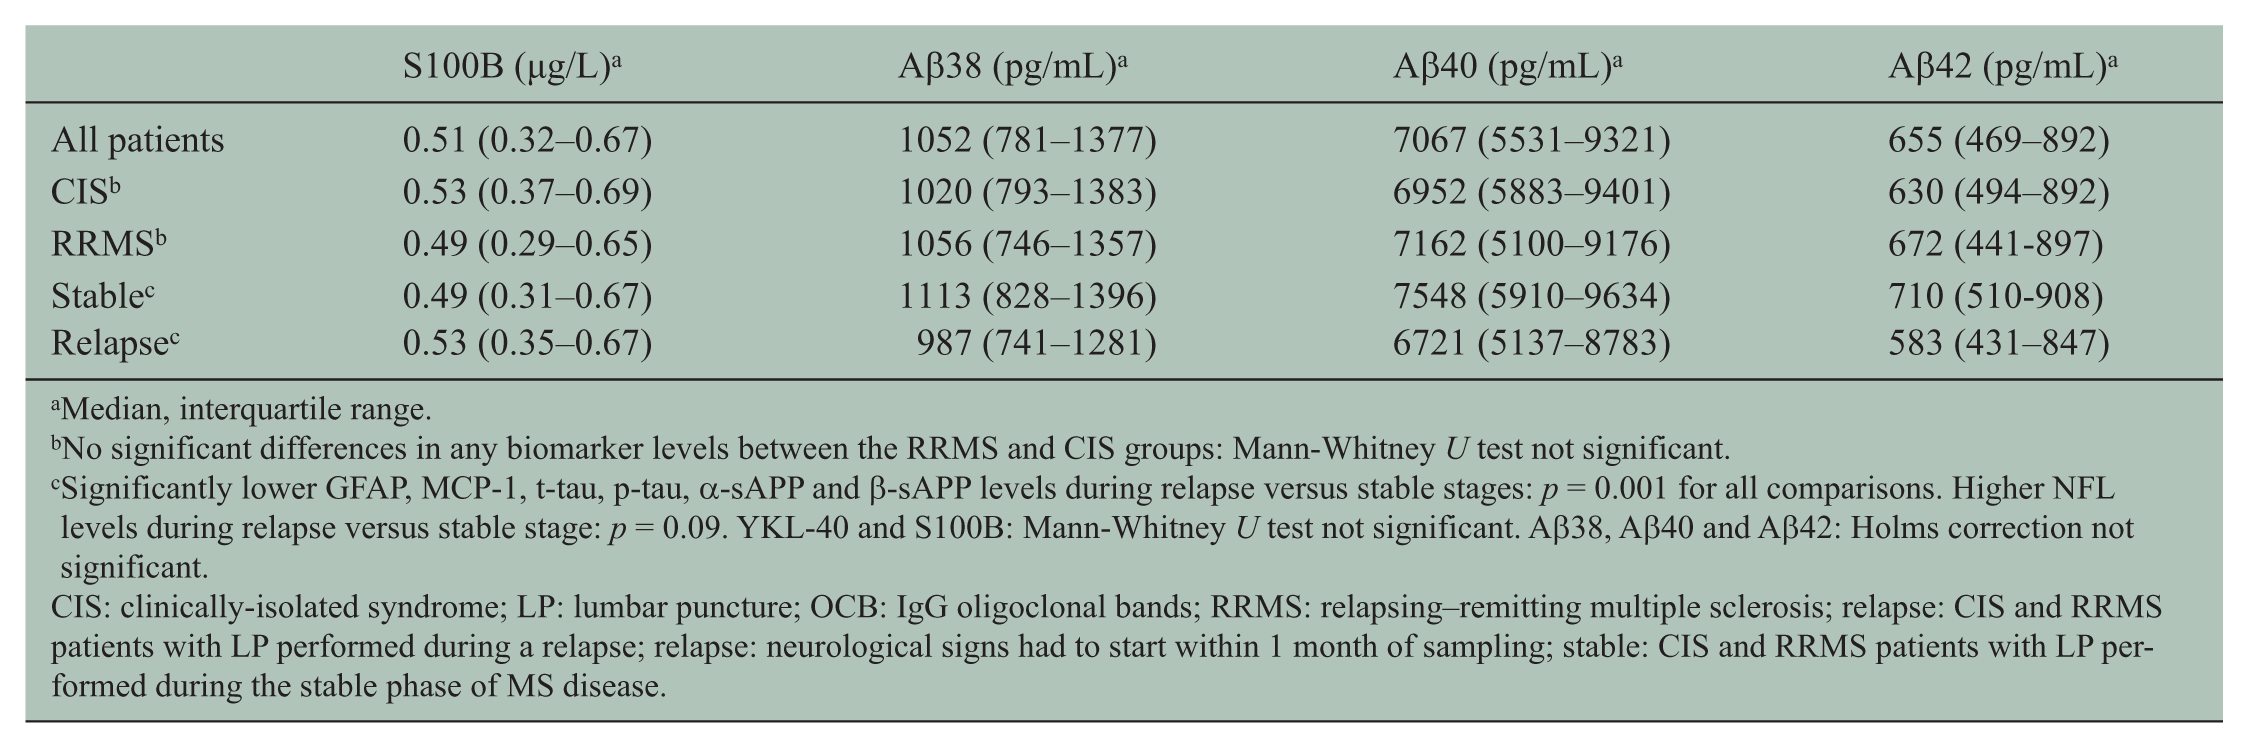
CIS: clinically-isolated syndrome; LP: lumbar puncture; OCB: IgG oligoclonal bands; RRMS: relapsing–remitting multiple sclerosis; relapse: CIS and RRMS patients with LP performed during a relapse; relapse: neurological signs had to start within 1 month of sampling; stable: CIS and RRMS patients with LP performed during the stable phase of MS disease.
Demographics and biomarker levels.
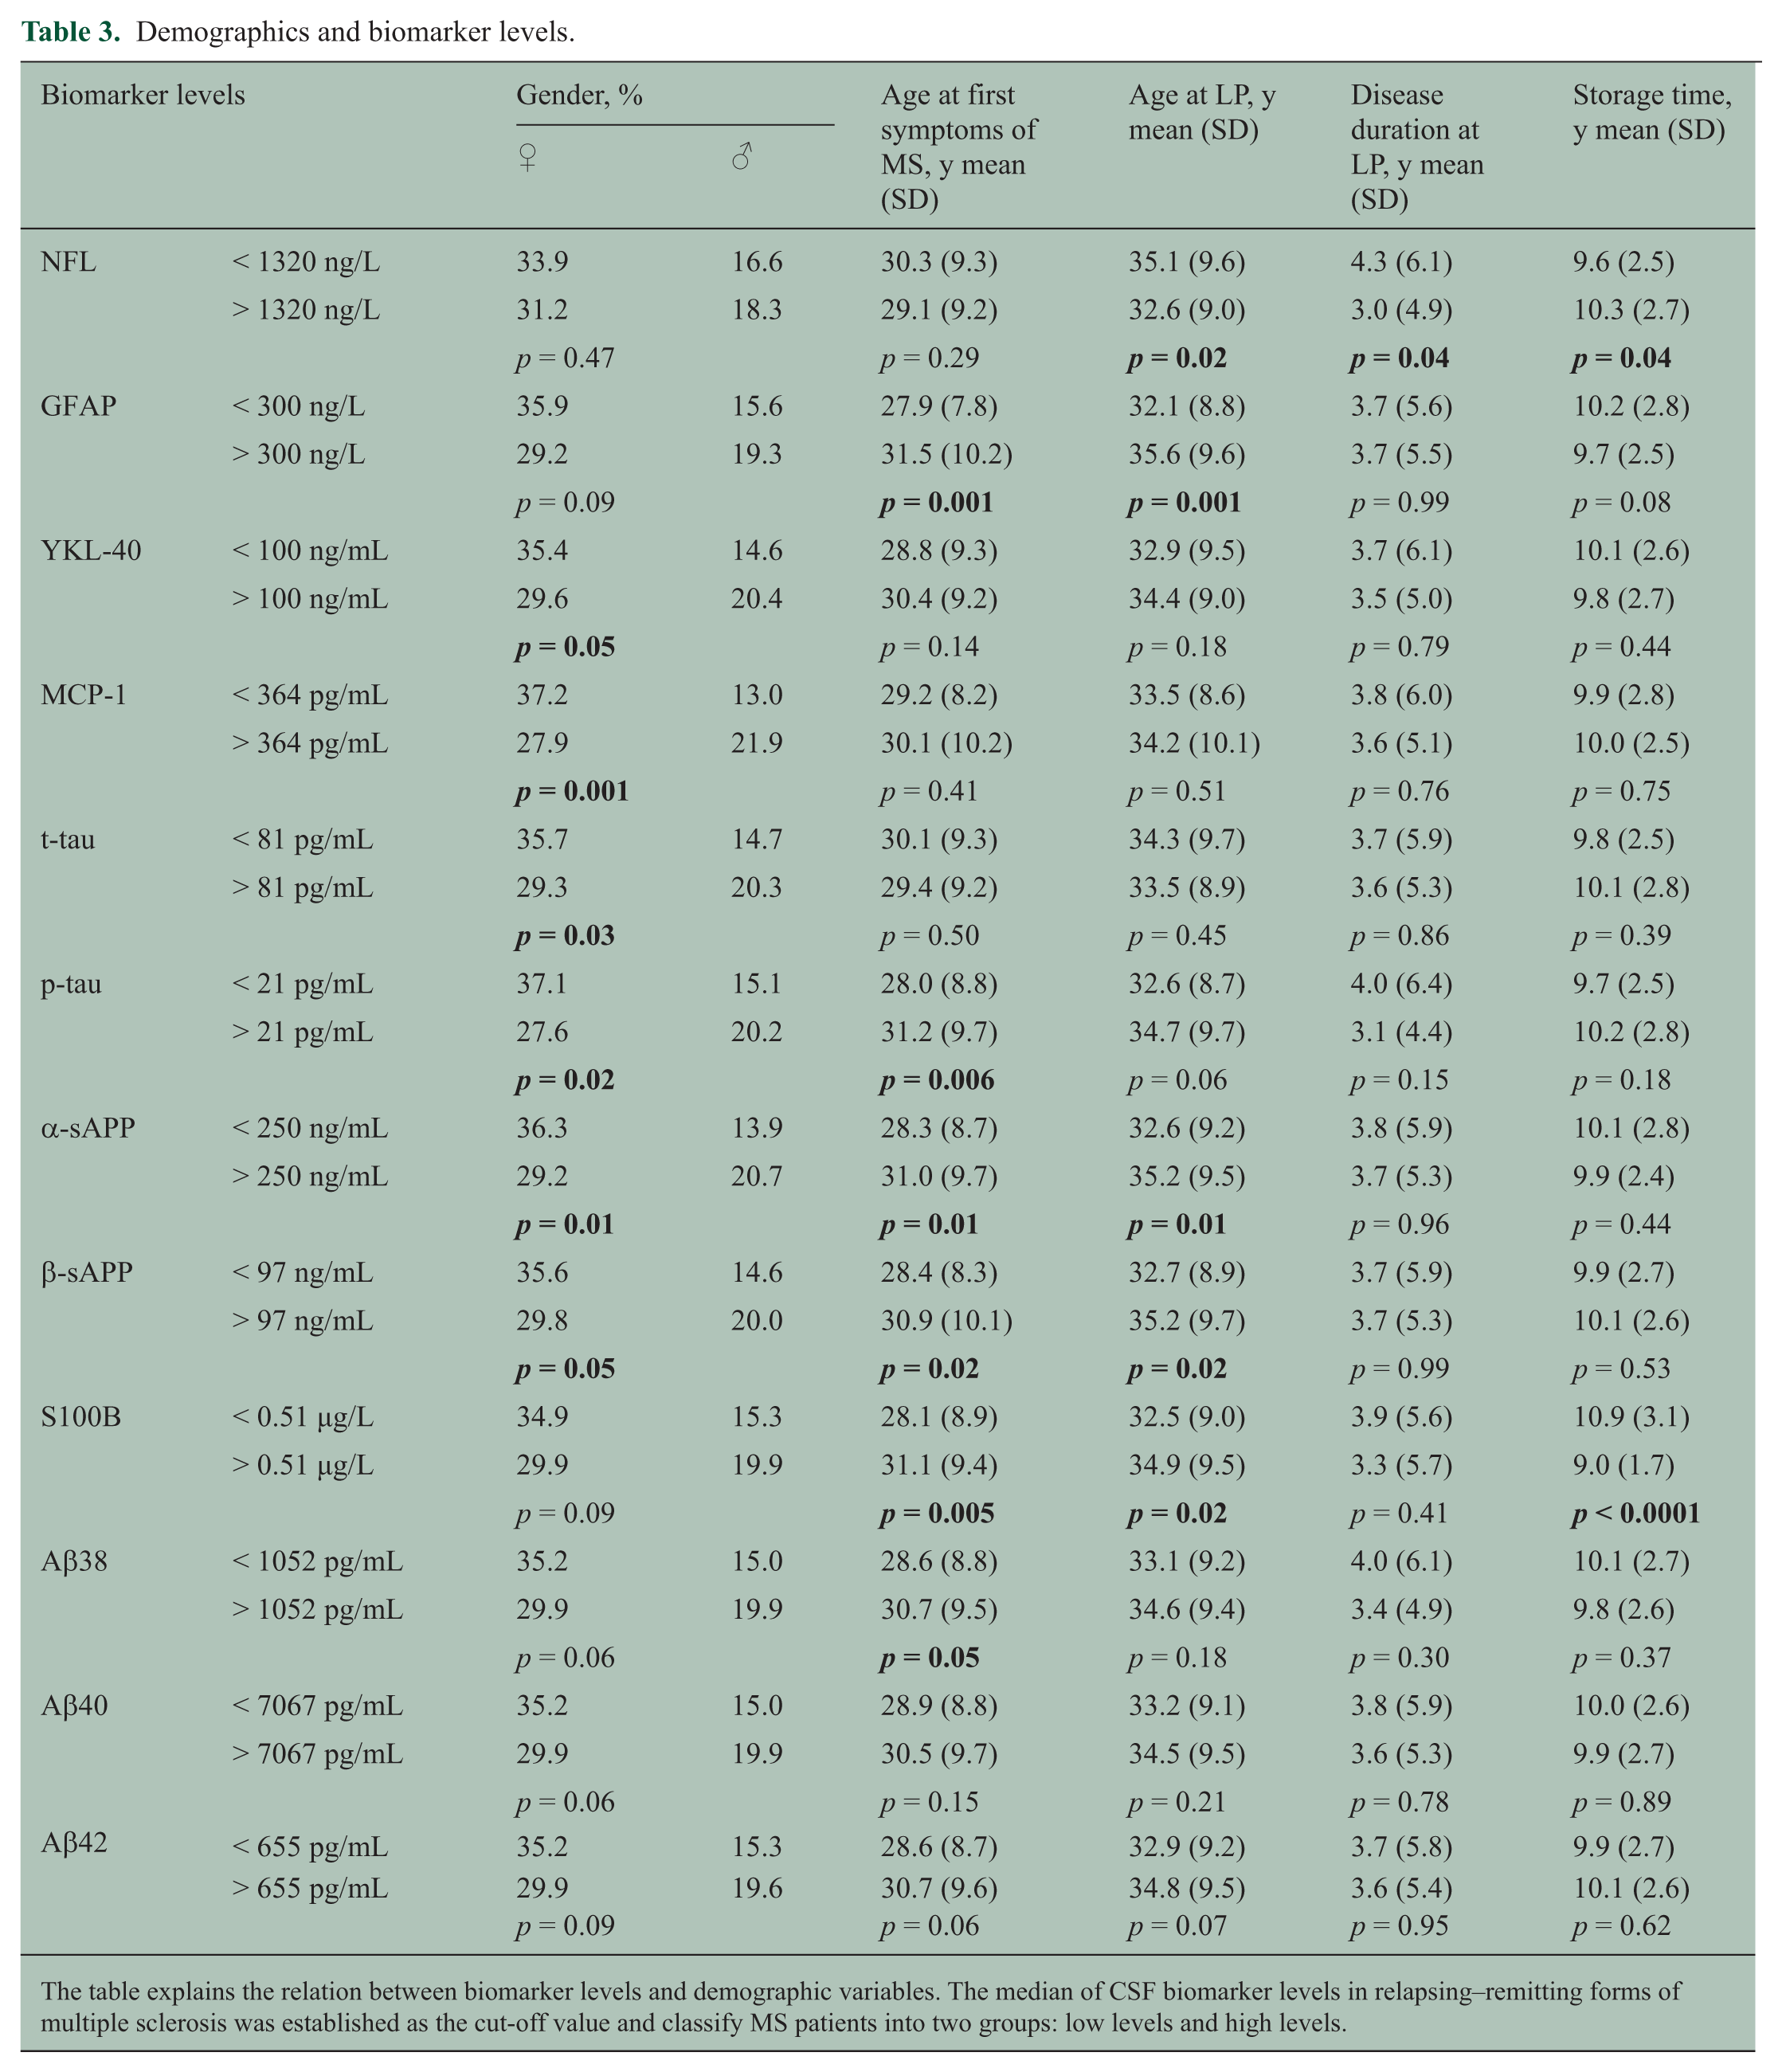
The table explains the relation between biomarker levels and demographic variables. The median of CSF biomarker levels in relapsing–remitting forms of multiple sclerosis was established as the cut-off value and classify MS patients into two groups: low levels and high levels.
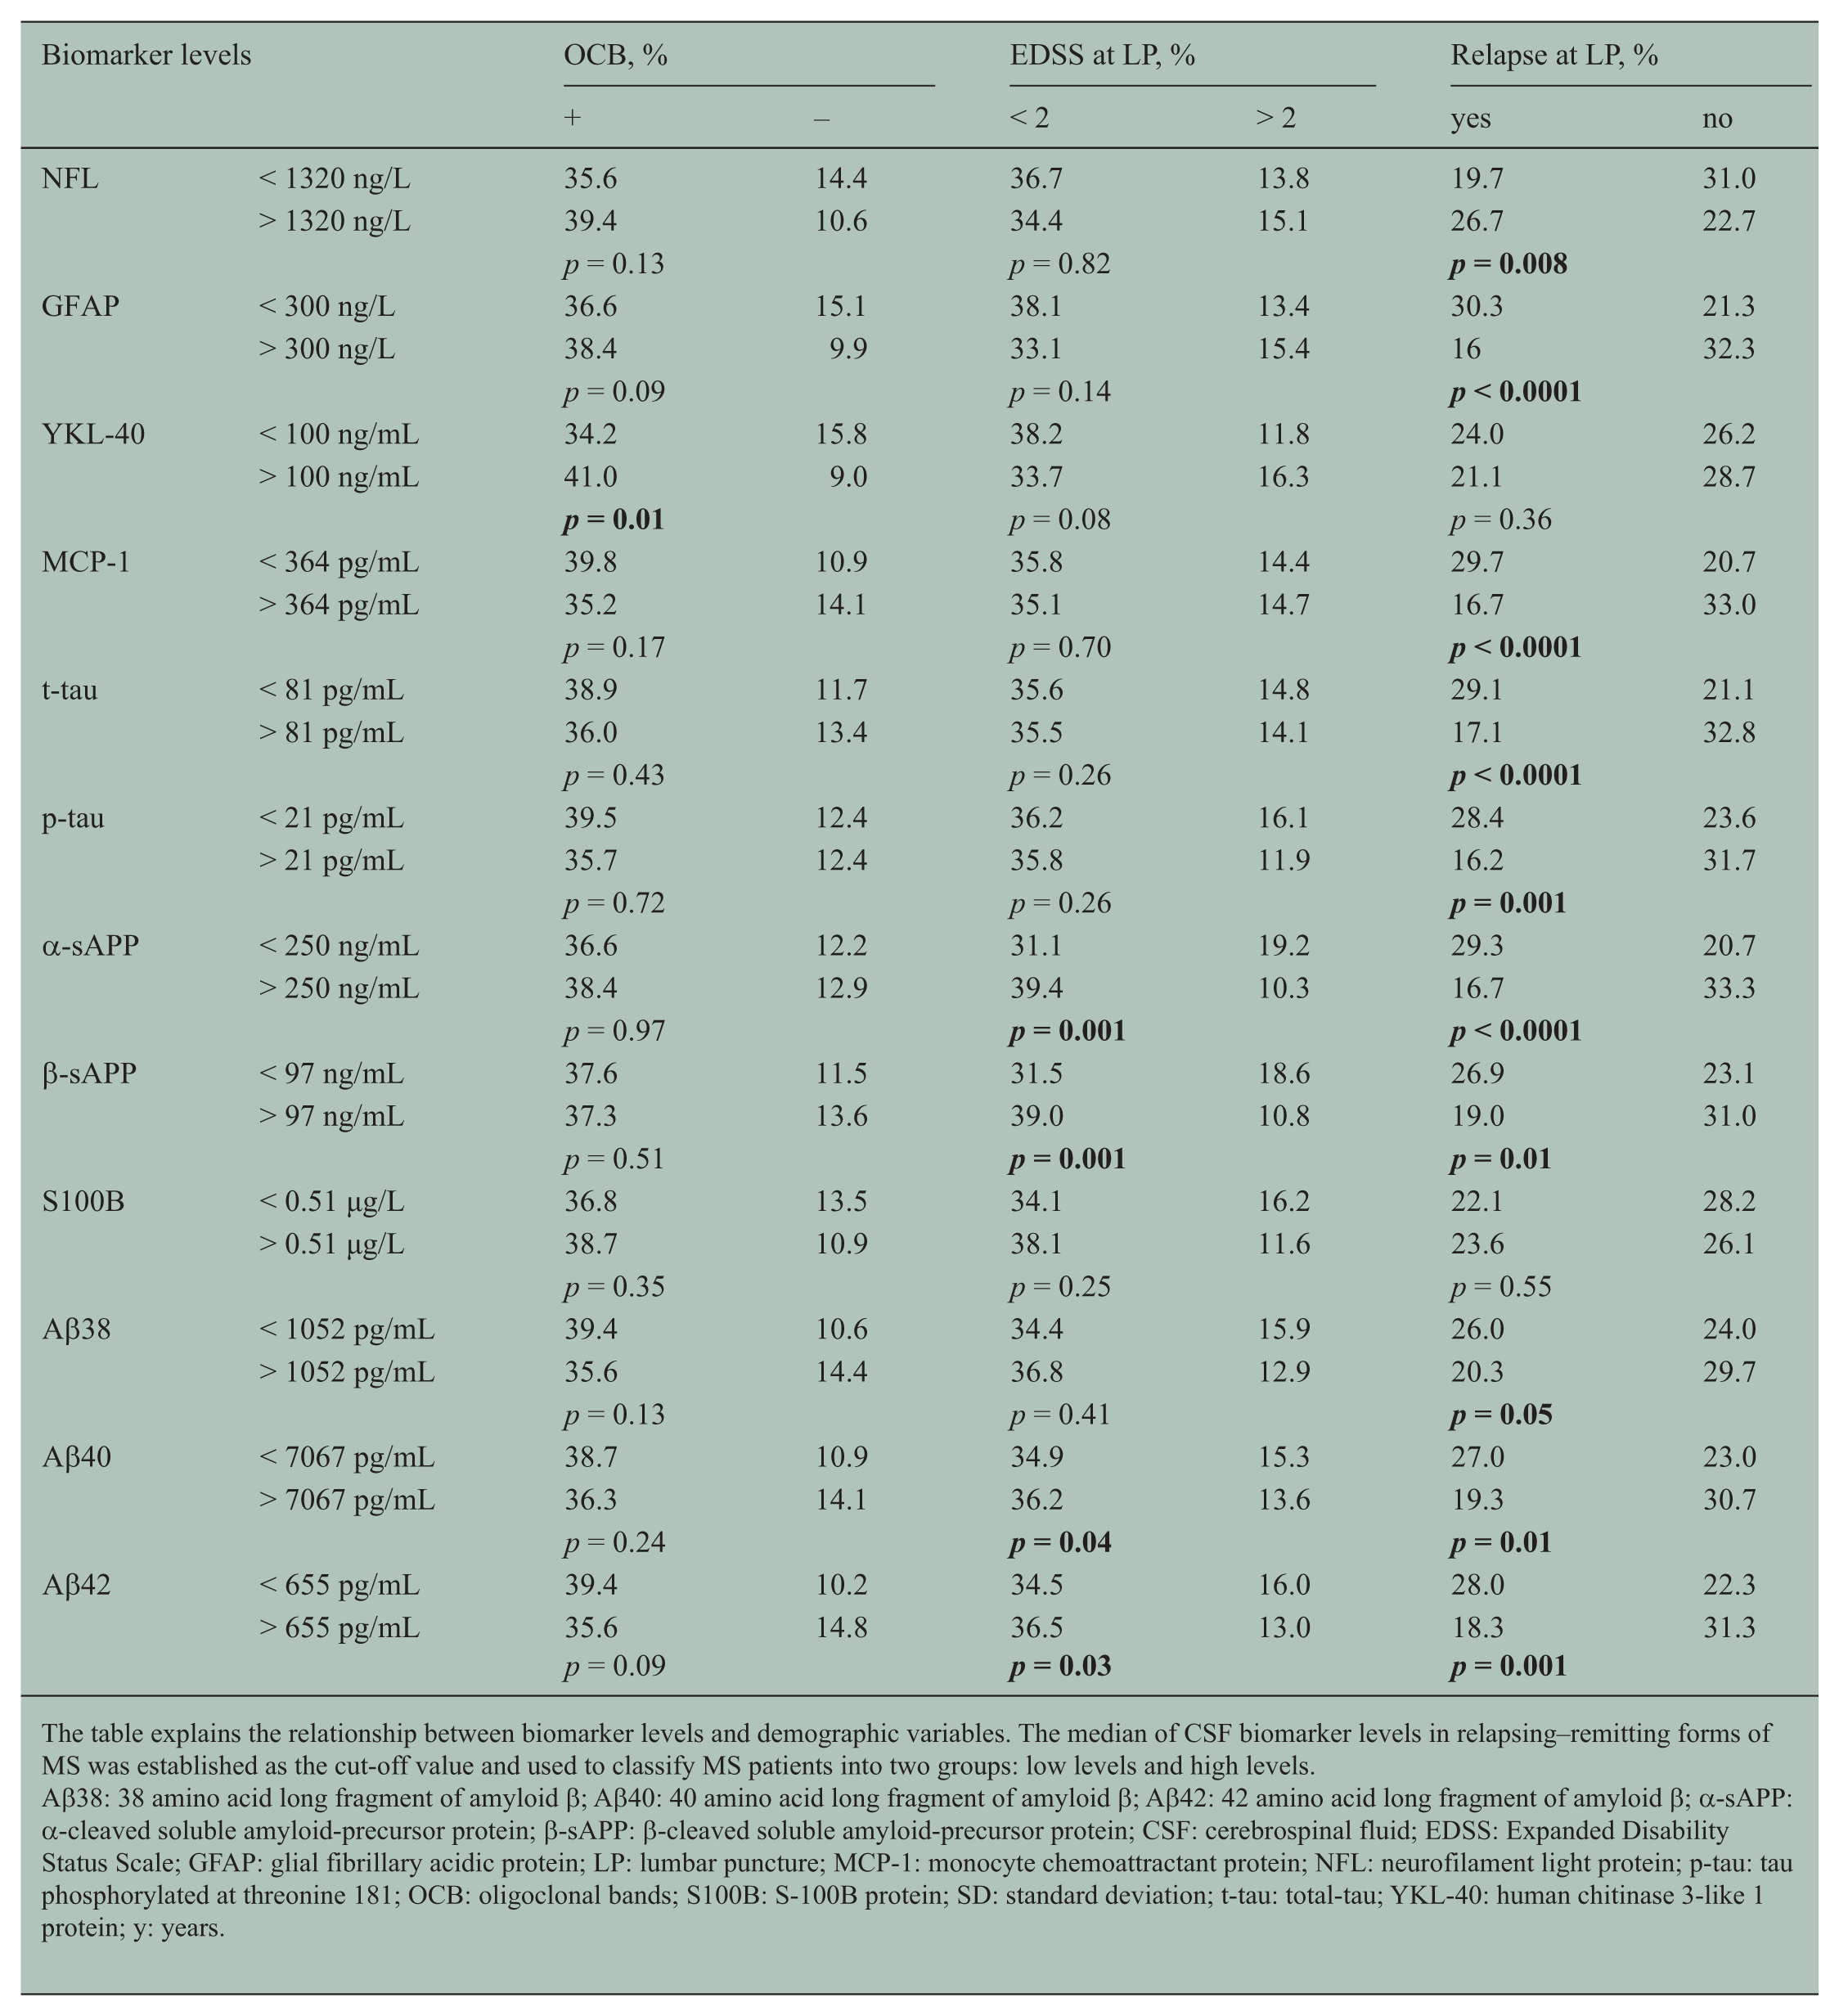
The table explains the relationship between biomarker levels and demographic variables. The median of CSF biomarker levels in relapsing–remitting forms of MS was established as the cut-off value and used to classify MS patients into two groups: low levels and high levels.
Aβ38: 38 amino acid long fragment of amyloid β; Aβ40: 40 amino acid long fragment of amyloid β; Aβ42: 42 amino acid long fragment of amyloid β; α-sAPP: α-cleaved soluble amyloid-precursor protein; β-sAPP: β-cleaved soluble amyloid-precursor protein; CSF: cerebrospinal fluid; EDSS: Expanded Disability Status Scale; GFAP: glial fibrillary acidic protein; LP: lumbar puncture; MCP-1: monocyte chemoattractant protein; NFL: neurofilament light protein; p-tau: tau phosphorylated at threonine 181; OCB: oligoclonal bands; S100B: S-100B protein; SD: standard deviation; t-tau: total-tau; YKL-40: human chitinase 3-like 1 protein; y: years.
Table 2 shows the OCB distribution. The prevalence of IgG OCB was similar between patients with high and low biomarker levels, except for the patients with high levels of YKL-40, compared with those with low levels of YKL-40 (p = 0.01) (Table 3).
CSF biomarker levels in MS
There were no significant differences in any biomarker levels between the RRMS and CIS groups (Table 2).
CSF biomarker levels and conversion from CIS to CDMS
We performed survival analyses to evaluate the association of CSF biomarker levels and demographic variables, with the time to conversion from CIS to CDMS. Univariate analysis showed that disease duration at LP, NFL levels and β-sAPP levels were associated with the time from CIS to CDMS (Table 4). A Cox hazard regression model showed that only CIS patients with increased CSF levels of NFL were associated with earlier conversion to CDMS (HR (95% CI): 2.69 (1.75 – 4.15); p < 0.0001) (Figure 1).
Univariate and multivariate analysis.
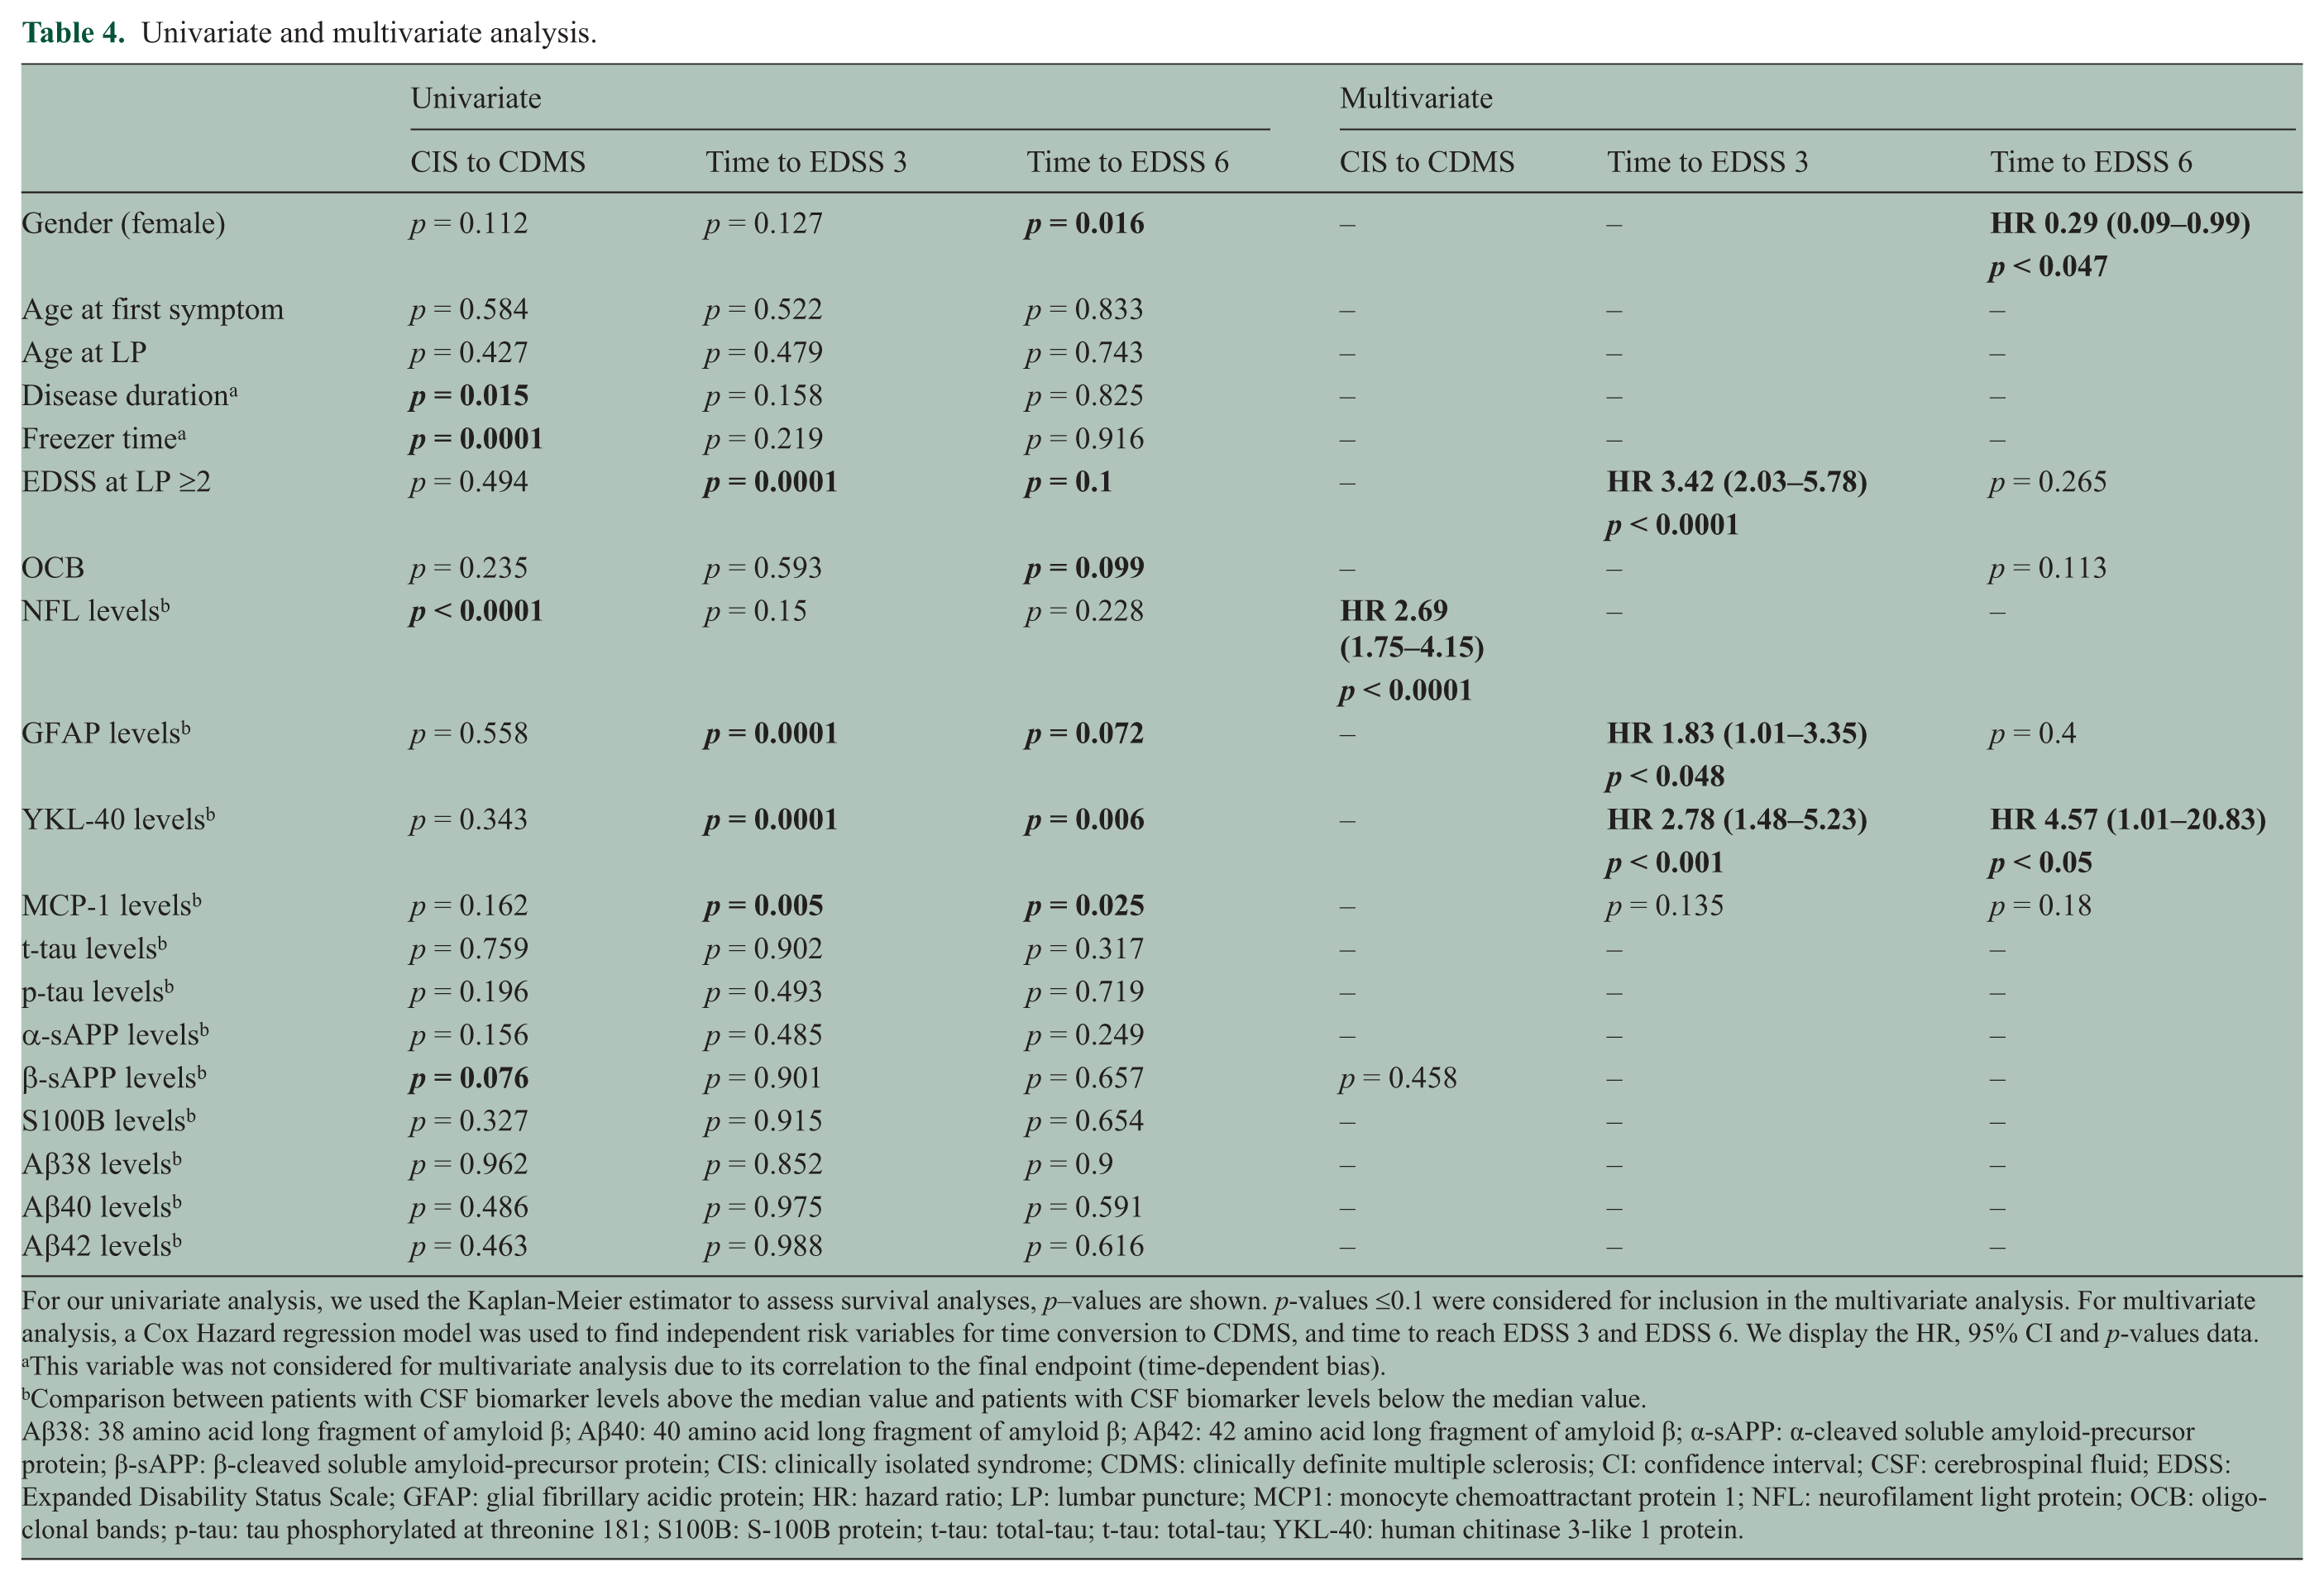
For our univariate analysis, we used the Kaplan-Meier estimator to assess survival analyses, p–values are shown. p-values ≤0.1 were considered for inclusion in the multivariate analysis. For multivariate analysis, a Cox Hazard regression model was used to find independent risk variables for time conversion to CDMS, and time to reach EDSS 3 and EDSS 6. We display the HR, 95% CI and p-values data.
This variable was not considered for multivariate analysis due to its correlation to the final endpoint (time-dependent bias).
Comparison between patients with CSF biomarker levels above the median value and patients with CSF biomarker levels below the median value.
Aβ38: 38 amino acid long fragment of amyloid β; Aβ40: 40 amino acid long fragment of amyloid β; Aβ42: 42 amino acid long fragment of amyloid β; α-sAPP: α-cleaved soluble amyloid-precursor protein; β-sAPP: β-cleaved soluble amyloid-precursor protein; CIS: clinically isolated syndrome; CDMS: clinically definite multiple sclerosis; CI: confidence interval; CSF: cerebrospinal fluid; EDSS: Expanded Disability Status Scale; GFAP: glial fibrillary acidic protein; HR: hazard ratio; LP: lumbar puncture; MCP1: monocyte chemoattractant protein 1; NFL: neurofilament light protein; OCB: oligoclonal bands; p-tau: tau phosphorylated at threonine 181; S100B: S-100B protein; t-tau: total-tau; t-tau: total-tau; YKL-40: human chitinase 3-like 1 protein.
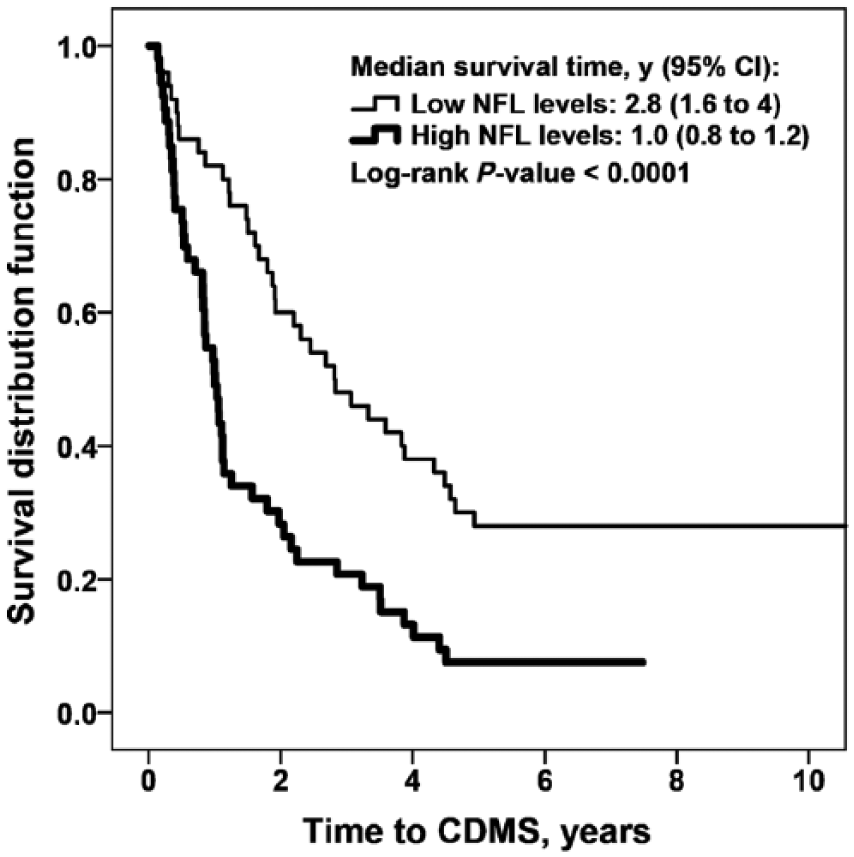
NFL levels and conversion from CIS to CDMS.
NFL and YKL-40 concentrations were significantly higher in the CIS patients whom had converted to CDMS in less than 1 year (NFL: 1770 ng/L (1202 – 5152); YKL-40: 138 ng/mL (84 – 174)), than in the non-converters (NFL: 850 ng/L (470 – 1800); YKL-40: 83 ng/mL (59 – 111)) (NFL: p = 0.001 and YKL-40: p = 0.03).
CSF biomarker levels and disability progression
We also investigated CSF biomarker levels in CIS and RRMS patients, in relation to disability progression. Survival analyses were performed to evaluate the association of CSF biomarker levels and demographic variables with the period of time to reach EDSS 3 and EDSS 6. Univariate analysis showed that EDSS at LP > 2.0 and levels of GFAP, YKL-40 and MCP-1 were associated with the time to reach EDSS 3 (Table 4). Independently of basal EDSS > 2.0 (HR (95% CI): 3.42 (2.03 – 5.78); p < 0.0001), the Cox Hazard regression model showed that high levels of YKL-40 (2.78 (1.48 – 5.23); p = 0.001) and GFAP (1.83 (1.01 – 3.35); p = 0.04) were independently associated with earlier progression to EDSS 3 (Figure 2(a) and Figure 2(b)). Univariate analysis showed that gender, OCB, EDSS at LP > 2.0, and levels of GFAP, YKL-40 and MCP-1 were also associated with the time to reach EDSS 6 (Table 4). The Cox Hazard regression model showed that male gender (female gender HR (95% CI): 0.29 (0.09 – 0.99); p = 0.04) and high levels of YKL-40 (4.57 (1.01 – 20.83); p = 0.05) were independent risk factors to reach EDSS 6 (Figure 3).
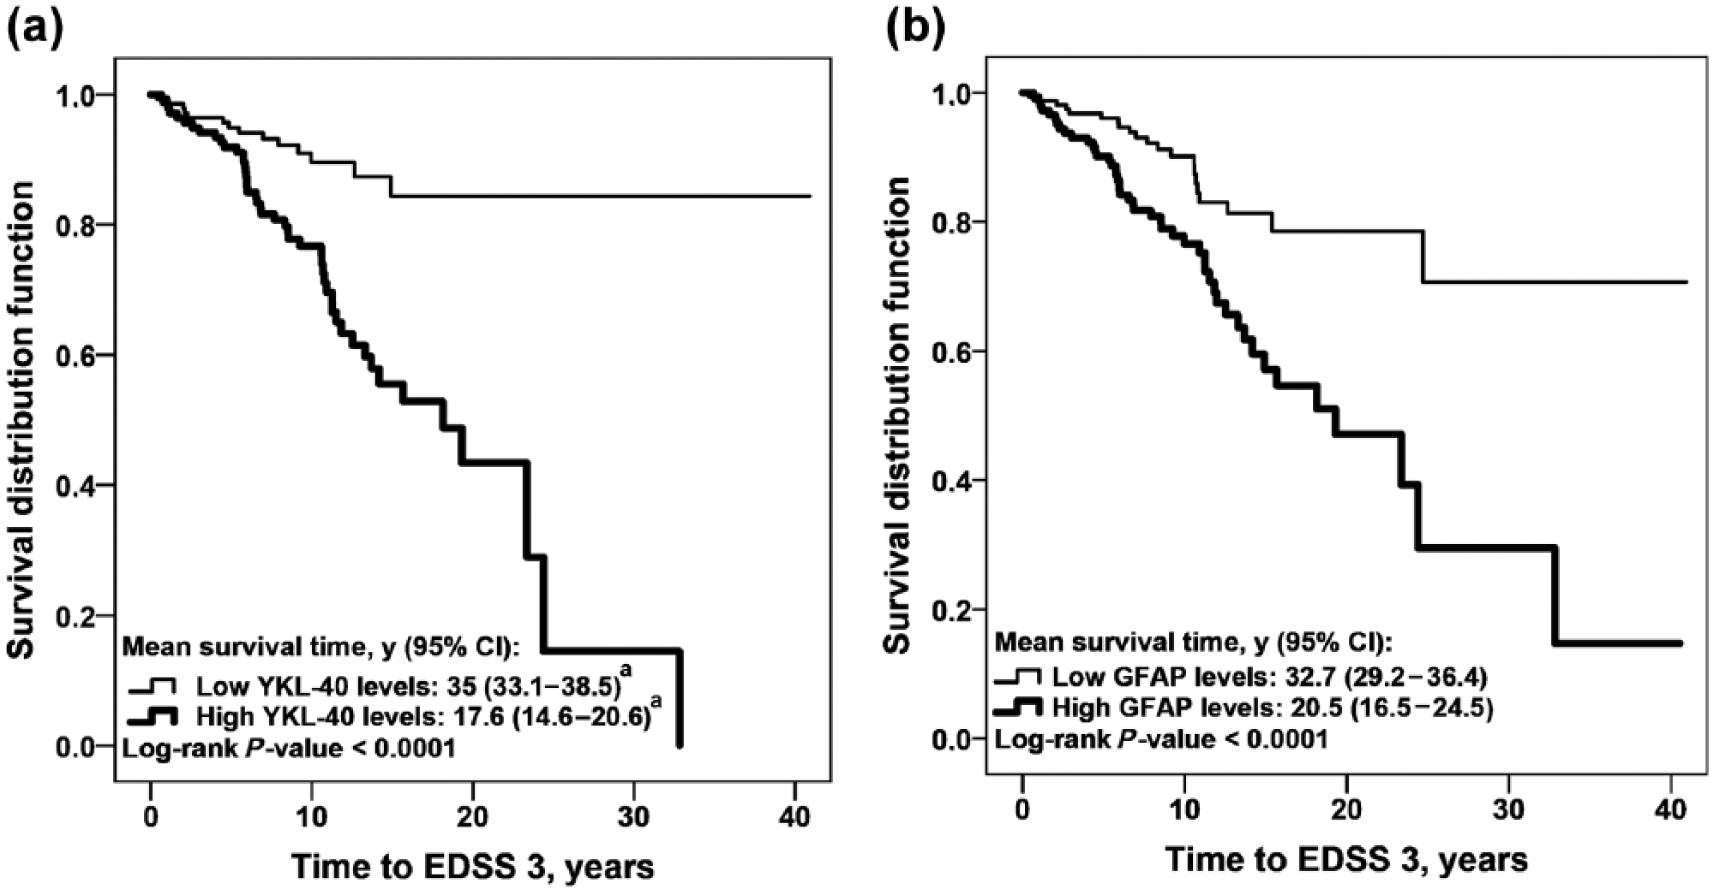
YKL-40 and GFAP levels and disability progression in the relapsing forms of MS.
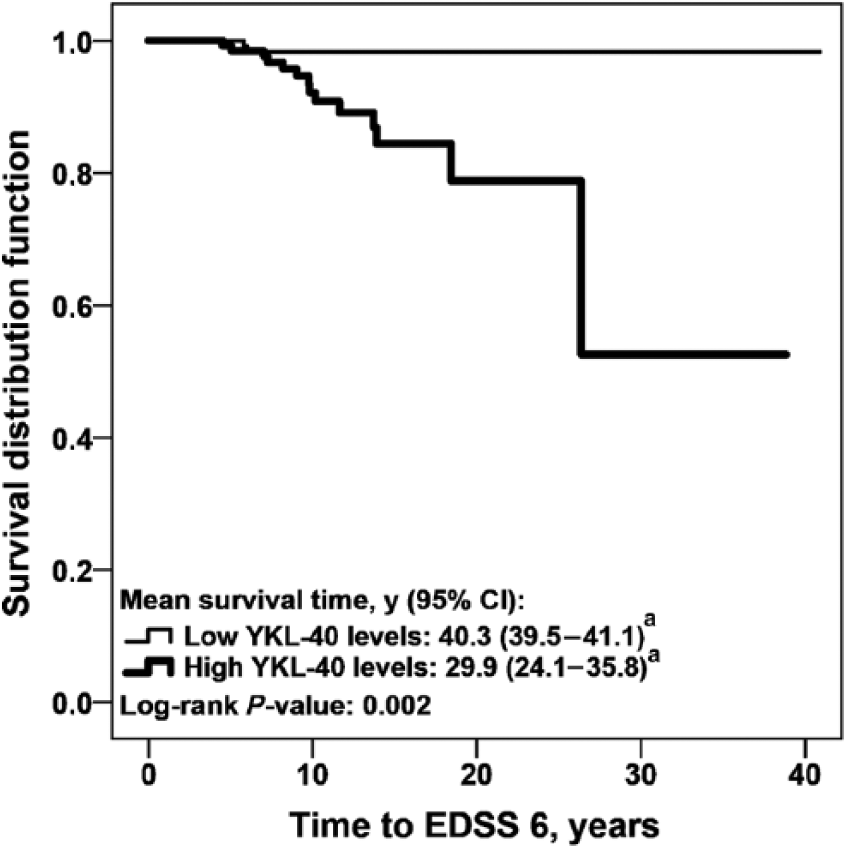
YKL-40 levels and disability progression in the relapsing forms of MS.
CSF biomarker levels and relapses
We used the RRMS and CIS samples to search for differences between the relapsing and remitting phases of MS. Patients with acute relapses had significantly lower GFAP, MCP-1, t-tau, p-tau, α-sAPP and β-sAPP levels, as compared with patients in remission (Table 2). Patients with acute relapses had significantly higher NFL levels, compared with patients in remission, only when the relapse period was extended to 3 months prior to sampling (relapse: 1455 ng/L (677 – 2670); stable phase/remission: 830 ng/L (520 – 1835); p = 0.009). In contrast, there were no differences in the levels of YKL-40 and S100B, between relapse and remission (Table 2); hence, the difference in CSF biomarker levels between the relapse and remission phase was large for GFAP, MCP-1 and NFL, while small for YKL-40.
Discussion
The strength of the present study is the head-to-head comparison of a broad range of glial, neuronal and axonal biomarkers in a large cohort of clinically representative CIS and RRMS patients with a long follow-up. We showed that high levels of NFL are associated with earlier conversion from CIS to CDMS. We also showed that high levels of the glial activation markers YKL-40 and GFAP are associated with earlier progression to EDSS 3 and that high levels of YKL-40 are also associated with earlier progression to EDSS 6. Our findings of earlier conversion from CIS to CDMS in those patients with high levels of NFL are supported by Teunissen et al., 24 whom showed that CSF levels of NFL were increased in converters, compared with non-converters. We also observed higher levels of YKL-40 in CIS patients with decreased time to CDMS, which is in agreement with a previous study. 25 Notwithstanding, the prognostic value of YKL-40 was lost when the conversion time was extended further than 5 years. Moreover, we could show that high levels of YKL-40 were associated with earlier progression of functional disability, in CIS and RRMS patients. This was shown previously, only in CIS patients. 25 YKL-40 was the best predictor of disability progression, as estimated by multivariate analysis. These findings further indicate that glial activation may be central in MS progression. Multivariate analysis also showed that EDSS at LP > 2.0 points was an independent risk factor to achieve EDSS 3, which is clinically expected.
Previous studies show a correlation between aging and some CSF biomarkers in healthy controls, while different results were observed among MS patients.4,26–28 In the present study, only GFAP showed a significant correlation with age, having higher levels in older people, presumably because we focused on diagnostic CSF samples representing a young cohort of MS patients, in whom the influence of disease on biomarker levels could be much stronger than the influence of age.
Our results are in agreement with previous studies that show higher levels of NFL during relapse. 24 We also confirmed previous findings that NFL decreases further after 60 days of relapse-free time. 26 This pattern was not observed for other biomarkers. Conversely, MCP-1 levels increased in the stable phases, indicating that it may reflect an anti-inflammatory effect. 29 The levels of YKL-40 were less influenced by relapses than the other biomarkers. This suggested that YKL-40 is continuously released in MS and that it could offer a better feature as a clinical biomarker, independent of time of LP.
About 74% of MS patients presented with IgG OCB. Only high levels of YKL-40 correlated with positive IgG OCB; however, because OCB were analyzed in the clinical routine close to the diagnostic time point and the laboratory techniques improved along the study period, we cannot exclude some false negative results.
Only seven RRMS patients had received disease-modifying drugs (DMD) before LP. Therefore, it is not likely that biomarker levels in CSF were influenced by drugs, in the current study. Following national recommendations during the time period of the present study, our CIS patients did not receive DMD until they converted to CDMS.
In conclusion, we showed that high levels of NFL in CIS patients are associated with shorter time to become CDMS. We also showed that high levels of the glial activation markers YKL-40 and GFAP are associated with earlier disability progression in MS.
Footnotes
Acknowledgements
The authors thank Dr. Txomin Arbizu for setting up the MS Unit; and Susana Pobla Müller, Ana González, Nuria Iranzo Papiol, Mª Isabel León Moreno and Mª Teresa Anguix Bricio for their technical support in the biobank and MS Unit, at the Bellvitge University Hospital in Spain. We thank Monica Christiansson, Dzemila Secic and Jonas Söderblom of the University of Gothenburg, Sweden, for excellent technical assistance in the laboratory. We also acknowledge the patients for their participation: This research would not have been possible without them.
Conflict of interest
M Alba Mañé Martínez received research support from the Fundació Hospital Universitari de Tarragona Joan XXIII and Fundació Institut d’Investigació Biomèdica de Bellvitge (IDIBELL); and received research support, funding for travel and congress expenses from Biogen Idec, Teva Pharmaceutical Industries, Sanofi-Aventis, Merck Serono, Novartis and Bayer Schering Pharma.
Laura Bau received research support, funding for travel and congress expenses from Biogen Idec, Teva, Sanofi-Aventis, Merck Serono, Novartis and Bayer Schering pharmaceuticals.
Elisabet Matas received research support, funding for travel and congress expenses from Biogen Idec, Teva, Sanofi-Aventis, Merck Serono, Novartis and Bayer Schering pharmaceuticals.
Alvaro Cobo Calvo received research support, funding for travel and congress expenses from Biogen Idec, Teva, Sanofi-Aventis, Merck Serono, Novartis and Bayer Schering pharmaceuticals.
Kaj Blennow has served on the advisory board for Innogenetics of Belgium.
Lucia Romero-Pinel received research support, funding for travel and congress expenses from Biogen Idec, Teva, Sanofi-Aventis, Merck Serono, Novartis and Bayer Schering pharmaceuticals.
Sergio Martínez-Yélamos received honoraria compensation to participate in advisory boards, collaborations as a consultant and scientific communications from Biogen Idec, Teva, Sanofi-Aventis, Merck Serono, Novartis and Bayer Schering pharmaceuticals; and received research support, funding for travel and congress expenses from Biogen Idec, Teva, Sanofi-Aventis, Merck Serono, Novartis and Bayer Schering pharmaceuticals.
Ulf Andreasson, Bob Olsson and Henrik Zetterberg report no disclosures.
Funding
This research received no specific grant from any funding agency in the public, commercial, or not-for-profit sectors.