
Abstract
Background:
Understanding long-term disability in multiple sclerosis (MS) is a key goal of research; it is relevant to how we monitor and treat the disease.
Objectives:
The Magnetic Imaging in MS (MAGNIMS) collaborative group sought to determine the relationship of brain lesion load, and brain and spinal cord atrophy, with physical disability in patients with long-established MS.
Methods:
Patients had a magnetic resonance imaging (MRI) scan of their brain and spinal cord, from which we determined brain grey (GMF) and white matter (WMF) fractional volumes, upper cervical spinal cord cross-sectional area (UCCA) and brain T2-lesion volume (T2LV). We assessed patient disability using the Expanded Disability Status Scale (EDSS). We analysed associations between EDSS and MRI measures, using two regression models (dividing cohort by EDSS into two and four sub-groups).
Results:
In the binary model, UCCA (p < 0.01) and T2LV (p = 0.02) were independently associated with the requirement of a walking aid. In the four-category model UCCA (p < 0.01), T2LV (p = 0.02) and GMF (p = 0.04) were independently associated with disability.
Conclusions:
Long-term physical disability was independently linked with atrophy of the spinal cord and brain T2 lesion load, and less consistently, with brain grey matter atrophy. Combinations of spinal cord and brain MRI measures may be required to capture clinically-relevant information in people with MS of long disease duration.
Introduction
Understanding the causes of long-term disability in multiple sclerosis (MS) is a key goal of current research; it is relevant to how we monitor and treat the disease. Histopathology studies show that MS affects brain grey matter (GM), brain white matter (WM) 1 and the spinal cord. 2 However, from such work3–5 it is difficult to determine which of these is most clinically relevant, and most likely to serve as a useful marker of long-term disease progression and treatment effectiveness.
Magnetic resonance imaging (MRI), while being less pathologically specific, allows us to assess tissue abnormalities in vivo and approximate histopathological changes. Previous work measuring brain lesion load, brain atrophy and spinal cord atrophy demonstrates correlations between changes in all these regions and the patients’ clinical outcomes,6–10 albeit of varying strengths in different cohorts and with no single measure found to fully explain variability in disability. There is increasing interest in the use of combinations of MRI measures to more fully characterise clinically-relevant pathology in live subjects.
We investigated the relationship of spinal cord and brain atrophy, and brain lesion load, with long-term physical disability (as assessed by the Expanded Disability Status Scale (EDSS)) 11 in a large group of people with MS. In order to achieve this, we undertook a multi-centre cross-sectional study of patients who had a long history (20 or more years) of MS.
Methods
Patients
Seven centres participated in this study, and we included patients with relapse-onset (relapsing–remitting (RR) or secondary progressive (SP)) MS with their first symptom onset 20 or more years prior to their clinical and MRI examinations. We classified MS subgroups by Lublin-Reingold criteria. 12 Previous or ongoing disease modifying drugs (DMD) were noted.
We determined all patients’ EDSS. The RRMS patients who had an EDSS score of ≤ 3 were defined as having benign MS. 13
Data from patients whom had been treated with steroids in the month prior to MRI acquisition were excluded. The ethics committee from each of the participating centres approved this work and we obtained written informed consent from each subject.
MRI acquisition
MRI scans were acquired using 1.5T (n = 5) or 3T (n = 2) scanners and included 3D T1-weighted gradient echo sequences of the brain and cervical cord, and dual-echo 2D spin-echo sequences of the brain. Our acquisition parameters are summarised in Table 1.
MRI parameters.
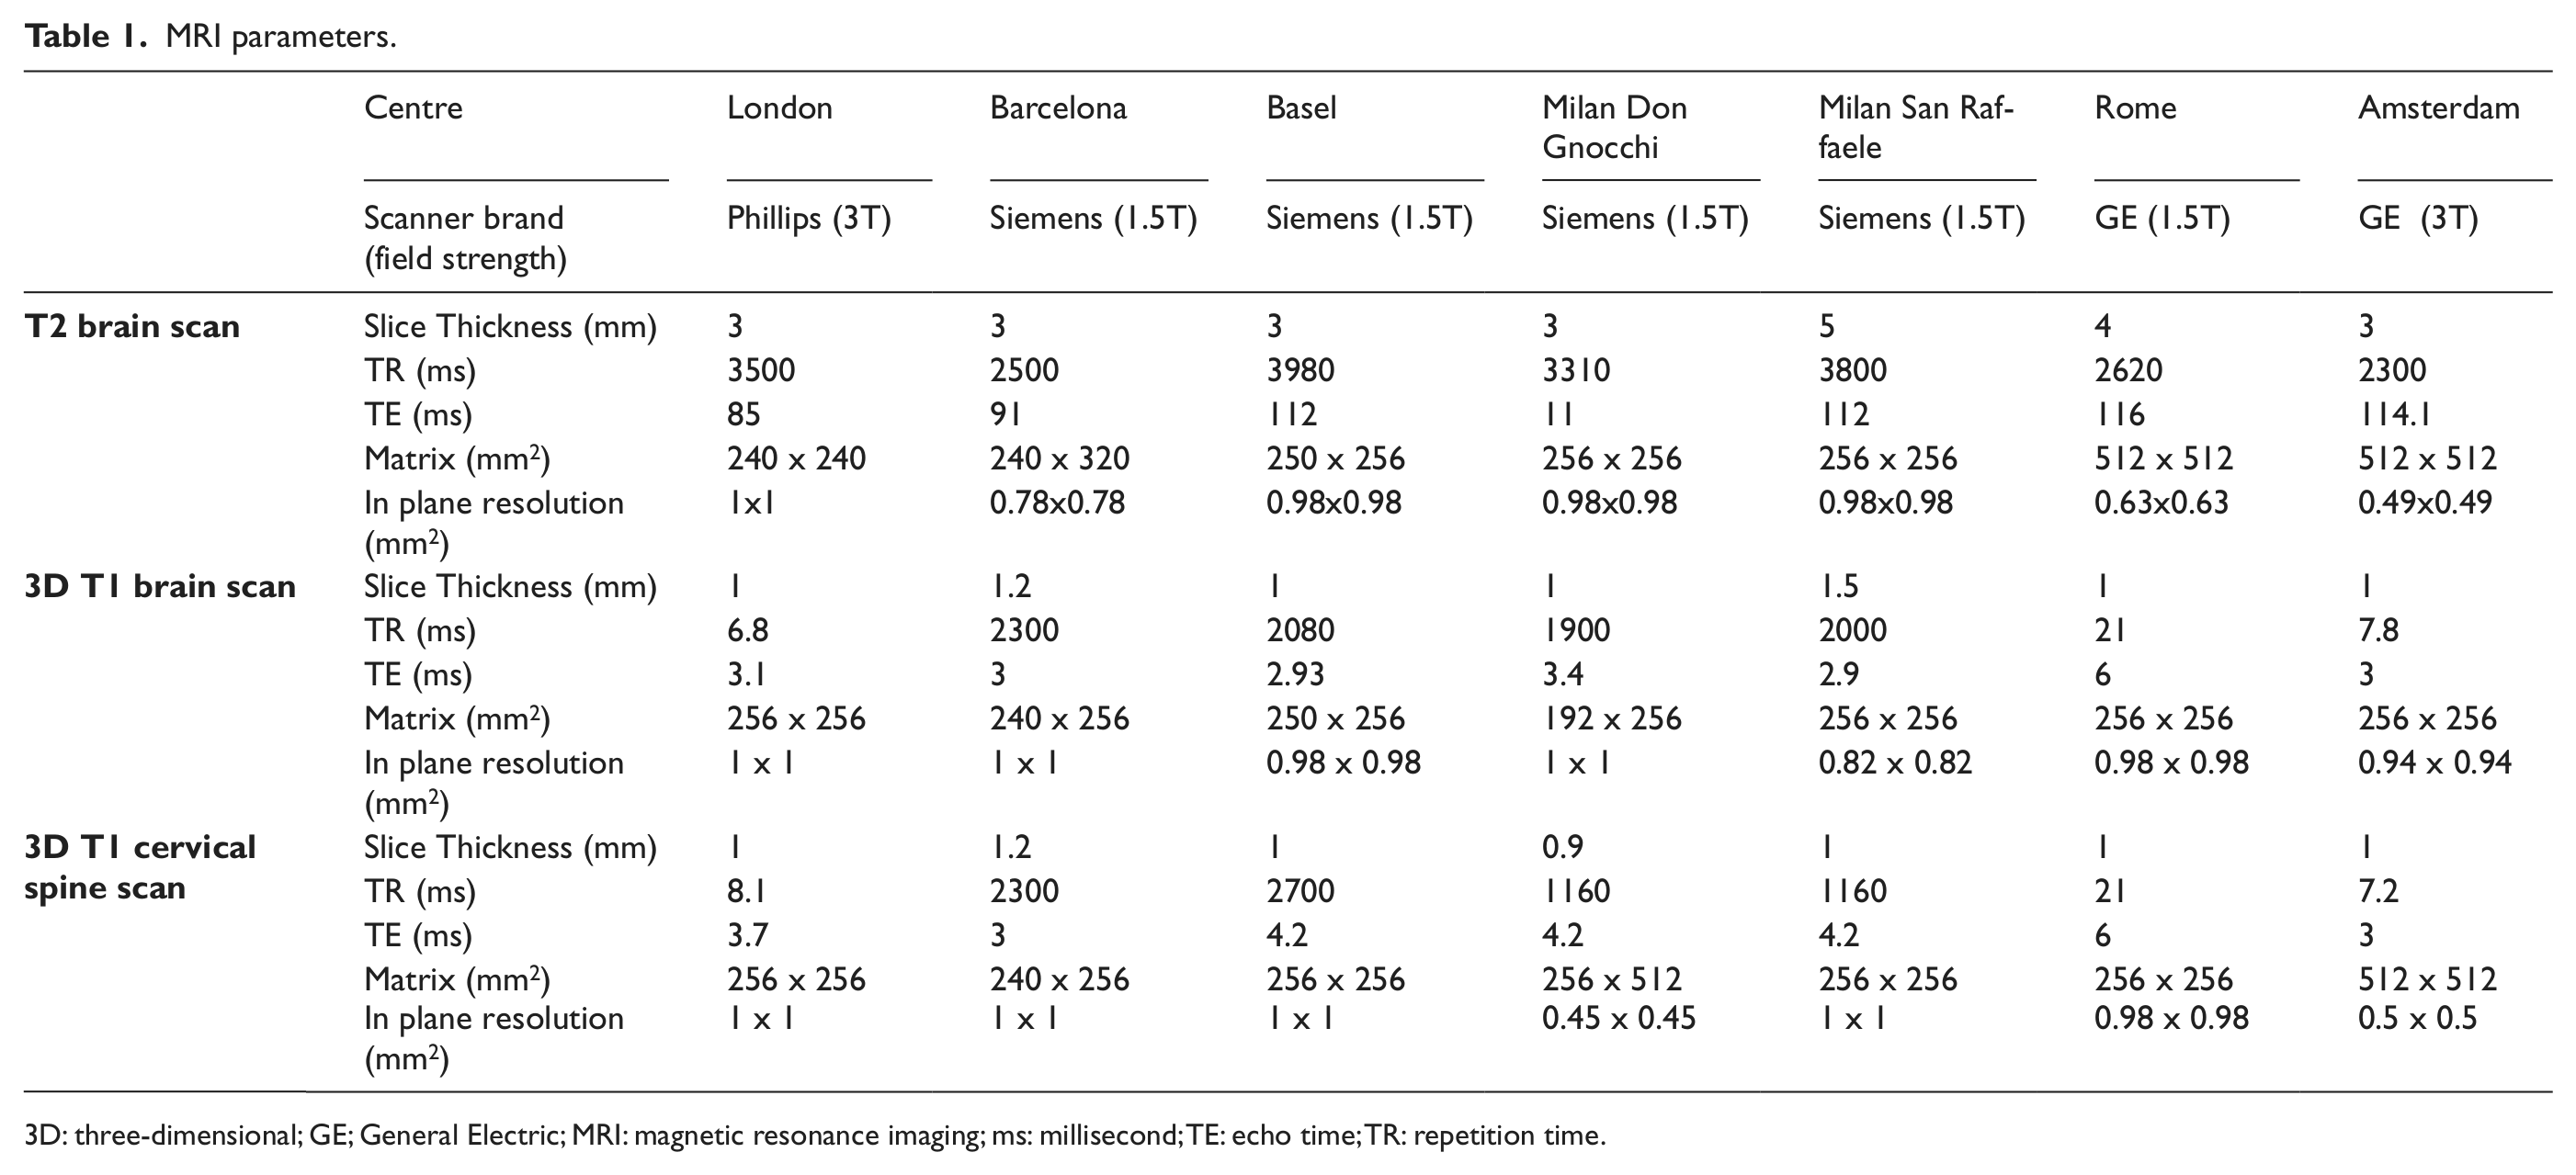
3D: three-dimensional; GE; General Electric; MRI: magnetic resonance imaging; ms: millisecond; TE: echo time; TR: repetition time.
Image analysis
T2 lesion volume
We outlined lesions on T2-weighted MRI scans using a semi-automated edge finding tool (JIM v. 6.0, Xinapse systems, Aldwincle, UK, http://www.xinapse.com). The same observer marked all lesions (HK) and subsequently, an experienced reader (DC) reviewed one in five images. Total lesion volume was recorded in mLs for each subject.
Brain tissue volumes
To avoid segmentation errors due to WM lesions, we employed an automated lesion-filling technique. 14 The same observer (HK) created all lesion masks based on 3D-T1 weighted sequences only (i.e. without reference to previously created masks on T2-weighted images) and an experienced observer (DC) reviewed one in five of these images. The lesion-filled images were segmented into WM, GM and cerebrospinal fluid (CSF), using the ‘new segment’ option on SPM8 (statistical parametric mapping; Wellcome Trust Centre for Neuroimaging, University College London (UCL) Institute of Neurology, London). All segmentations were reviewed by the same reader (HK), to exclude errors. WM and GM fractional (WMF and GMF) volumes, relative to total intracranial volume (the sum of GM, WM and CSF volumes), were calculated.
Spinal cord atrophy
Sagittal spinal cord images were reformatted axially, into five 3 mm-thick slices perpendicular to the long axis of the spinal cord, centred at C2/C3. We evaluated the upper cervical cord cross-sectional area (UCCA) using an active surface model, 15 which has been used in a multi-centre study. 16 Mean cord area of the five slices was determined for each subject. 17 The same observer (HK) analysed all images.
Statistical analysis
Univariable associations between EDSS and the four MRI predictors (WMF, GMF, T2LV, UCCA), and between MRI variables, were assessed using Spearman correlation.
For the binary EDSS models (dividing into groups by EDSS scores < 6 and ≥ 6, because an EDSS score of 6 marks the requirement for a walking aid) we performed univariable logistic regression followed by multiple logistic regression with the four MRI predictors and centre, age at scan, age at onset, disease duration, DMDs and gender, initially included as potentially confounding covariates. Of these, only centre and age at scan contributed significantly (at p < 0.05) or materially affected coefficients, so these were subsequently retained in all models. Along with centre and age at scan, the four MRI predictors were entered together and then individually removed from the final multivariable model, if they did not significantly contribute (at p < 0.05). The C-statistic was calculated to assess the predictive performance of the logistic model; this statistic can range from 0.5 (no better than chance) to 1 (perfect prediction).
With 4-category EDSS (≤1.5, >1.5 and <3, ≥3 and <6, ≥6; categories chosen for even frequency distribution) a similar procedure to the above was carried out, using instead proportional odds multiple ordered logistic regression; again, centre and age at scan were the only covariates to either be significant (at p < 0.05) or materially affect MRI coefficients, so they were retained in models. The 4-part model enabled more complete analysis across the spectrum of disability, as per previously published work. 10
Differences in means between patient groups were assessed by t-test or analysis of variance (ANOVA), for comparison of RR and SP, and subgroups of RR with SP. In the same way, patients with an EDSS ≤ 3 were compared to those with an EDSS ≥ 6, irrespective of disease subtype.
Analyses were carried out using Stata 12 (Stata Corporation, College Station, TX, USA) and SPSS 20 (IBM, USA).
Results
Demographics of patients in each participating centre and disability category are summarised in Table 2 and Table 3, respectively. For the whole group, patients had a mean age of 52 years (SD 8.8) with a mean age of disease onset of 25.8 years (SD 7.7); there were 111 females and 48 males, of whom 92 had RRMS and 67 SPMS, with a mean disease duration of 26.2 years (SD 6.7) and a median EDSS of 4 (range 0 – 8). For the 4-category EDSS model, patient numbers were as follows: ≤1.5 n=28, >1.5 and <3 n=33, ≥3 and <6 n=44, ≥6 n=54.
Patient demographics by centre.
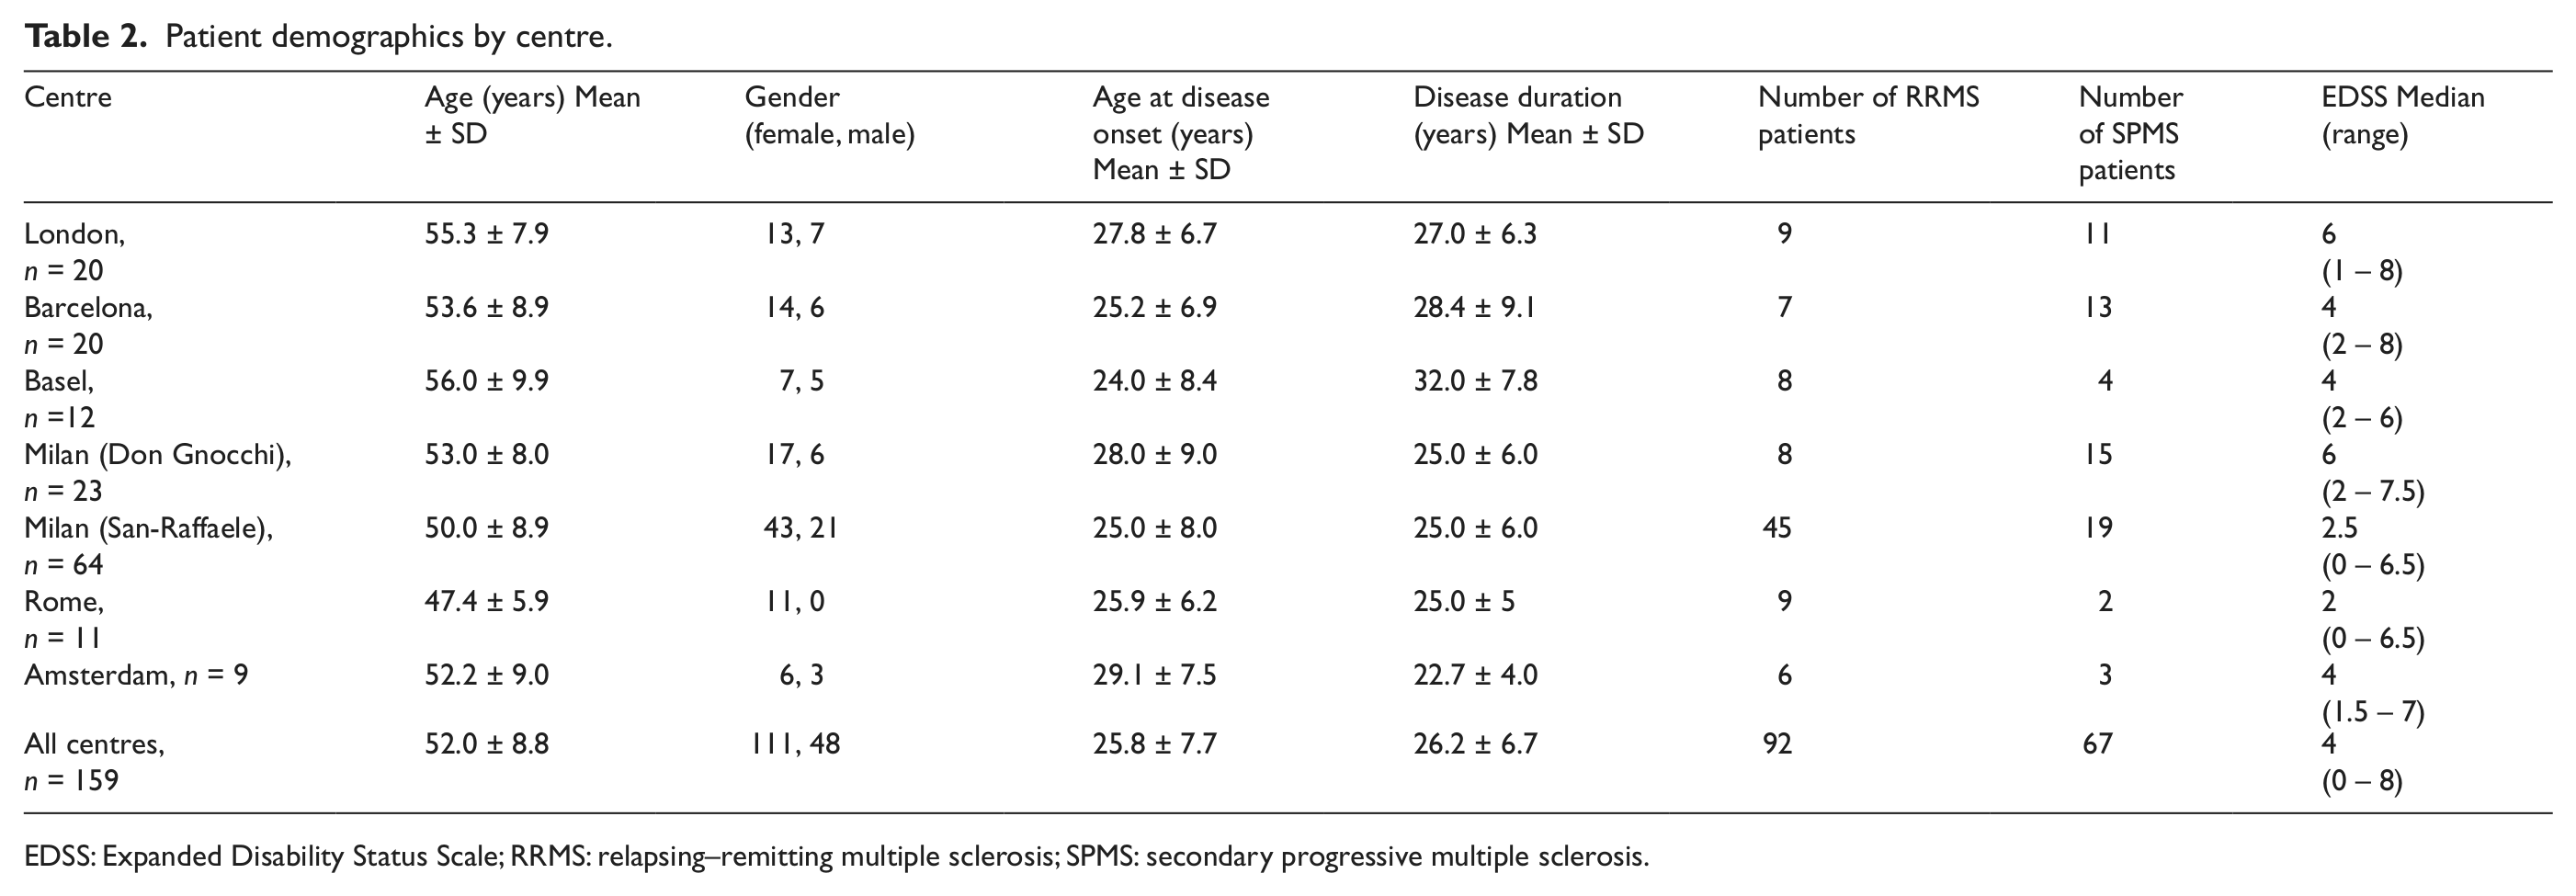
EDSS: Expanded Disability Status Scale; RRMS: relapsing–remitting multiple sclerosis; SPMS: secondary progressive multiple sclerosis.
Patient demographics by EDSS category.
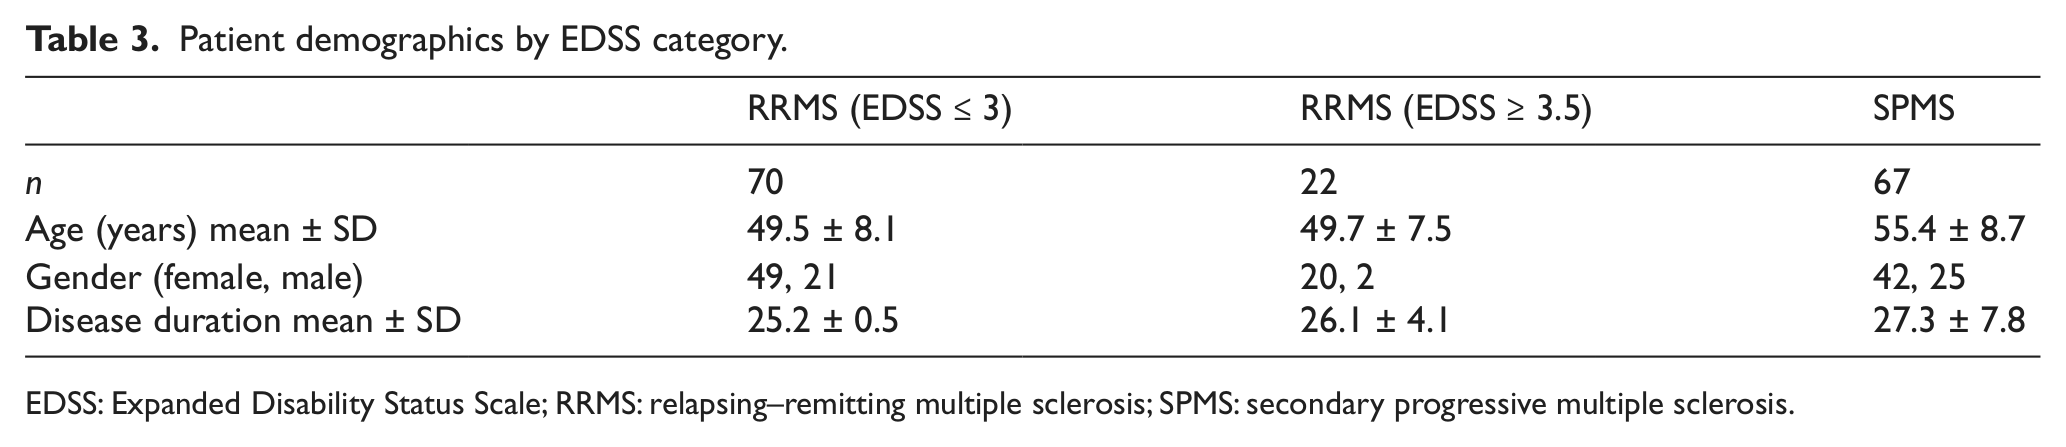
EDSS: Expanded Disability Status Scale; RRMS: relapsing–remitting multiple sclerosis; SPMS: secondary progressive multiple sclerosis.
Brain segmentation failed for four people (we used 155 volumetric brain scans), two patients did not have a T2W scan (we included 157 patients in the T2LV analysis) and three patients’ spinal cord scans were distorted, so they could not be analysed.
Correlations between MRI features
WMF was significantly correlated with T2LV (r = − 0.21; p = 0.01) and UCCA (r = 0.28; p < 0.01). GMF did not correlate significantly with either T2LV or UCCA, but was inversely correlated with WMF (r = − 0.26; p < 0.01).
MRI features and clinical subgroups
WMF, T2LV and UCCA were found to differ significantly in ANOVA analysis between the RRMS and SPMS groups, but no significant difference was found for GMF.
T2LV was significantly higher in SPMS than in benign RRMS (EDSS ≤ 3) (mean ± SD = 21.3 ± 14.7 versus 15.7 ± 11.7; p = 0.02), and showed a non-significant trend to be higher in SPMS than in the non-benign RRMS group (21.3 ± 14.7 versus 16.1 ± 14.5; p = 0.16). On the other hand, T2LV were almost identical in the benign and non-benign RRMS groups (15.7 ± 11.7 versus 16.1 ± 14.5; p = 0.94). Also, T2LV was found to differ significantly between all subjects with EDSS ≥ 6 and those with EDSS ≤ 3 (24.3 ± 14.4 versus 15.7 ± 11.7; p < 0.01).
UCCA was significantly higher in benign RRMS, when compared with both non-benign RRMS (69.7 ± 8.1 versus 64.8 ± 8.7; p = 0.02) and SPMS (69.7 ± 8.1 versus 64.2 ± 9.7; p < 0.01). On the other hand, UCCA values were almost identical in non-benign RRMS and SPMS subgroups (64.8 ± 8.7 versus 64.2 ± 9.7; p = 0.80). UCCA was also found to differ significantly between all subjects with EDSS ≥ 6 and those with EDSS ≤ 3 (63.3 ± 10.3 versus 69.7 ± 8.1; p < 0.01). Results of our comparison between groups are summarised in Table 4 and Table 5.
MRI parameters in benign and ‘non-benign’ RRMS and SPMS.
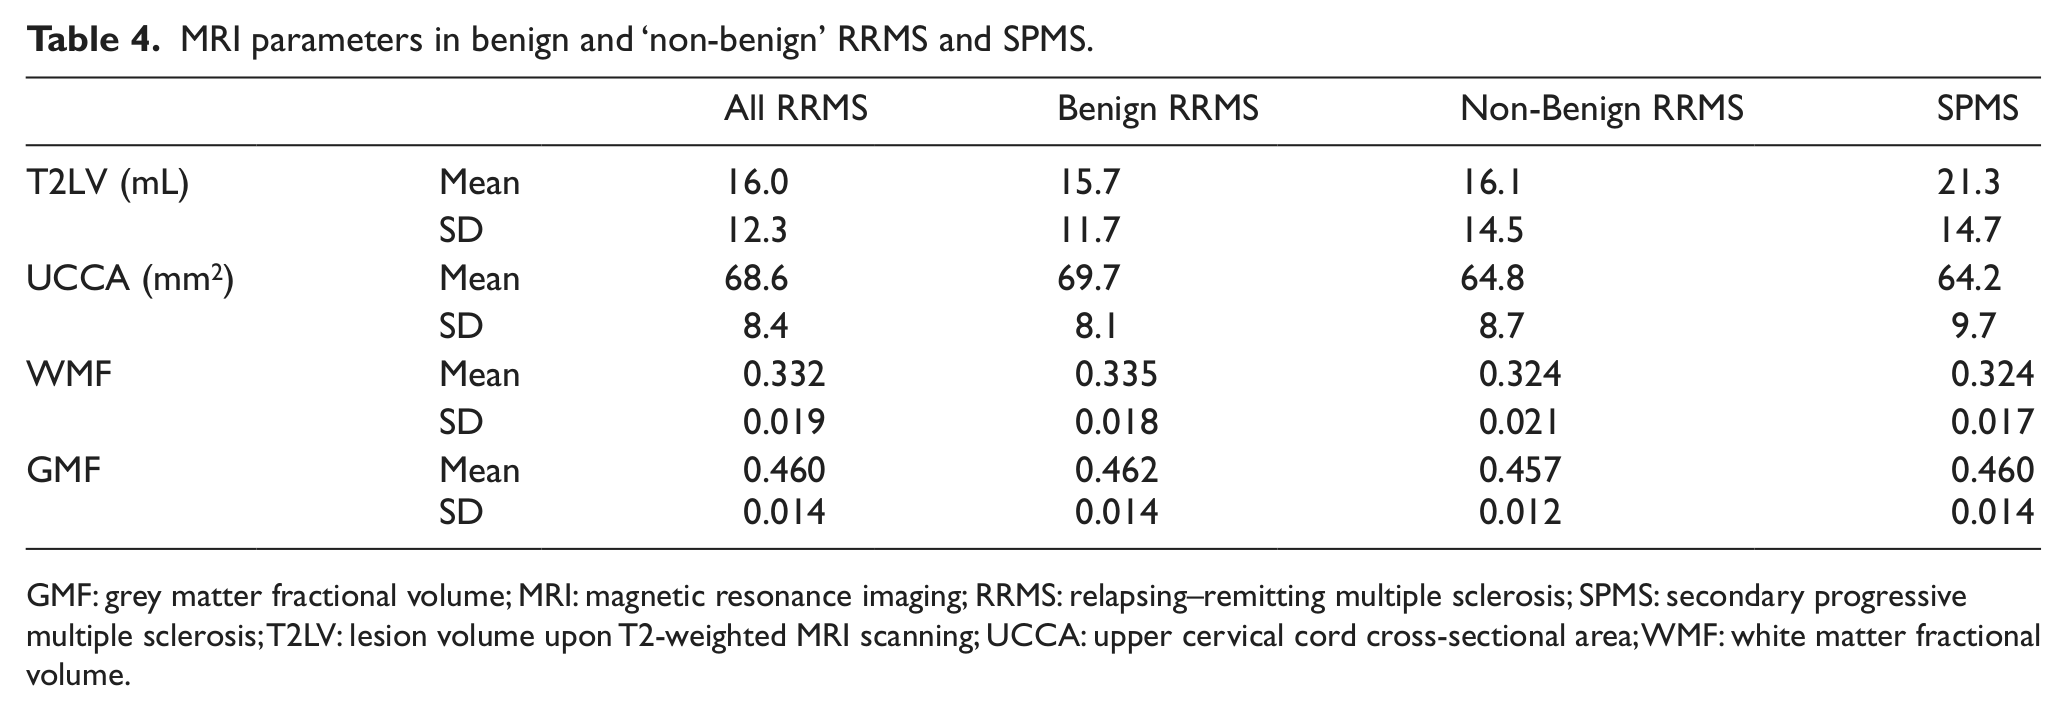
GMF: grey matter fractional volume; MRI: magnetic resonance imaging; RRMS: relapsing–remitting multiple sclerosis; SPMS: secondary progressive multiple sclerosis; T2LV: lesion volume upon T2-weighted MRI scanning; UCCA: upper cervical cord cross-sectional area; WMF: white matter fractional volume.
Comparison of MRI parameters between benign and ‘non-benign’ RRMS and SPMS using ANOVA.
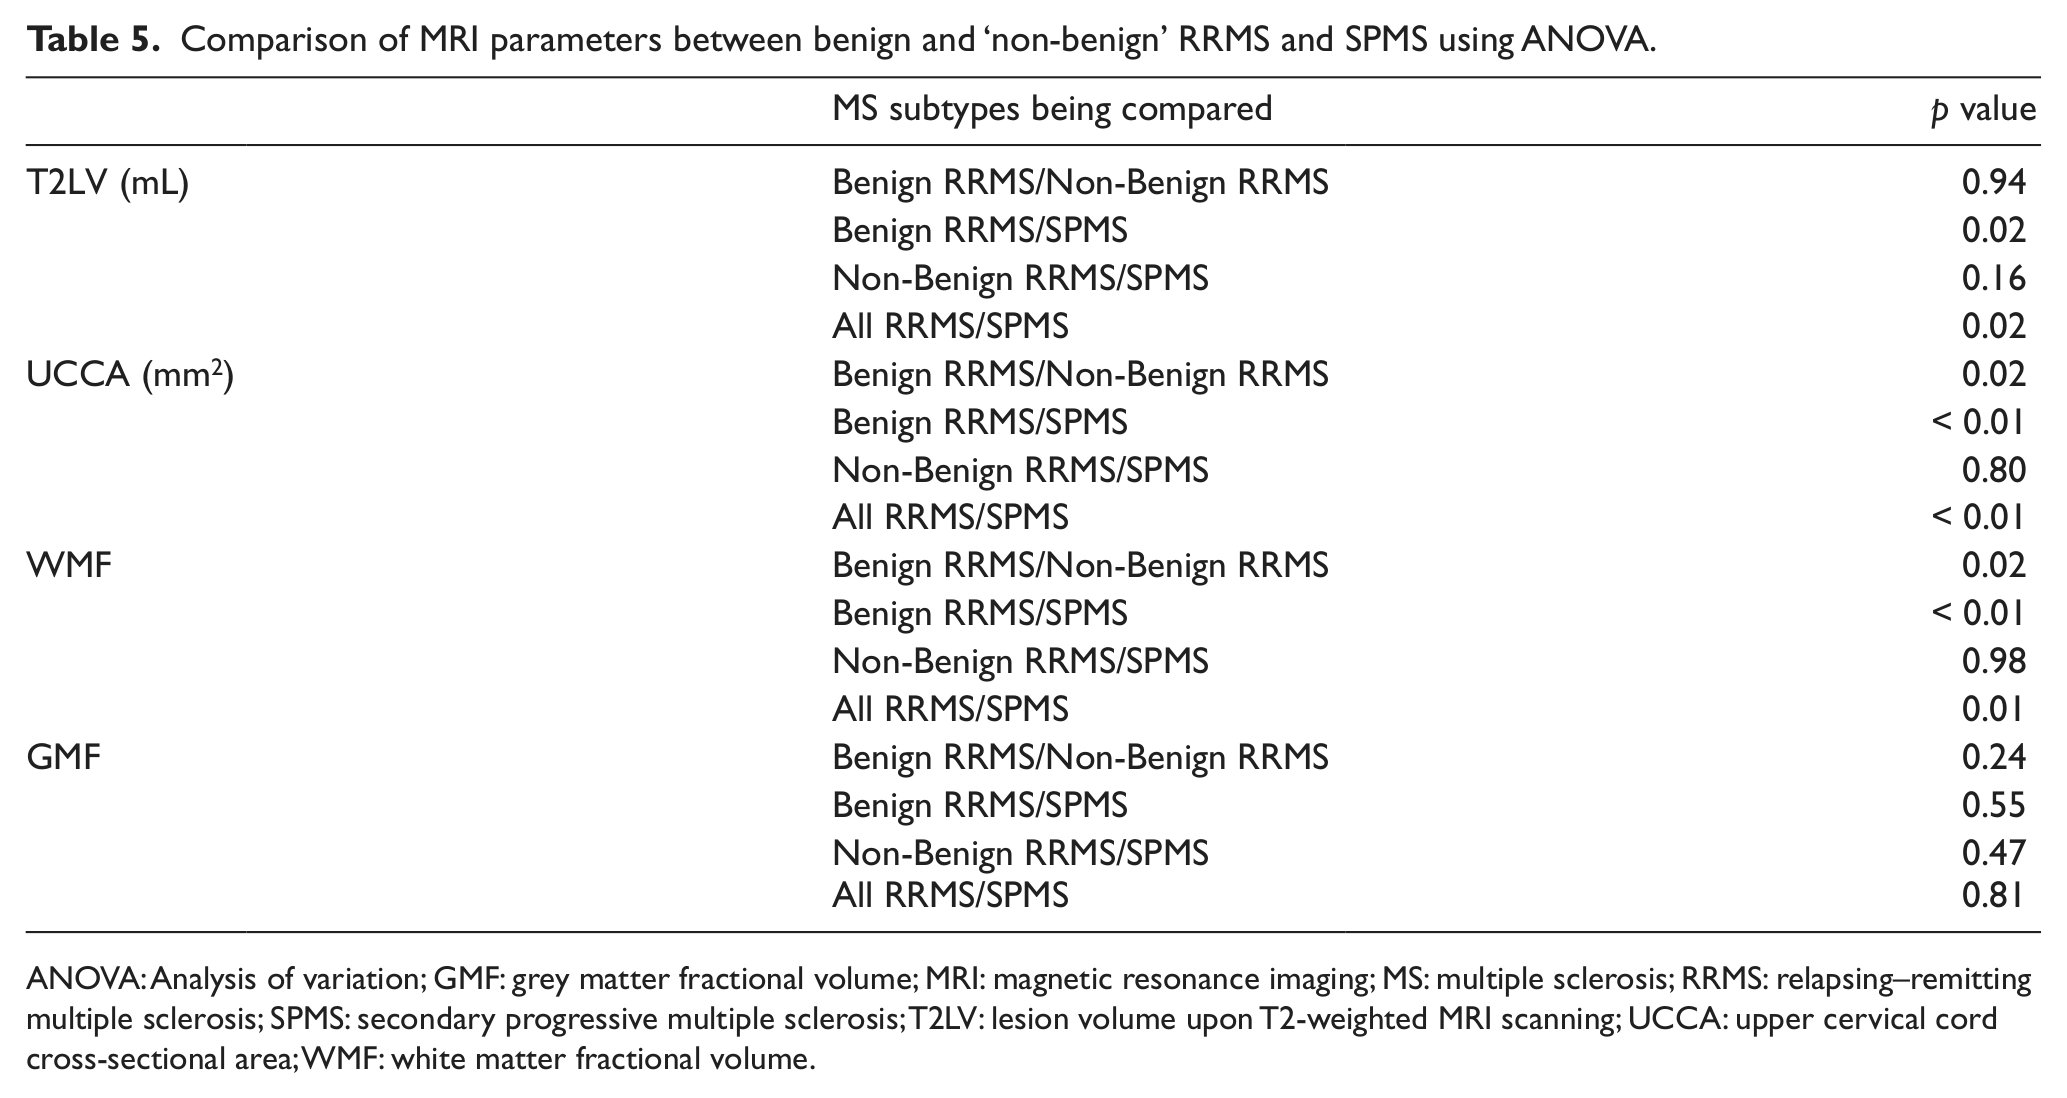
ANOVA: Analysis of variation; GMF: grey matter fractional volume; MRI: magnetic resonance imaging; MS: multiple sclerosis; RRMS: relapsing–remitting multiple sclerosis; SPMS: secondary progressive multiple sclerosis; T2LV: lesion volume upon T2-weighted MRI scanning; UCCA: upper cervical cord cross-sectional area; WMF: white matter fractional volume.
MRI features and physical disability (EDSS)
EDSS was significantly correlated with T2LV (Spearman’s r = 0.19; p = 0.02), WMF (r = − 0.32; p < 0.01) and UCCA (r = − 0.31; p < 0.01), whereas the correlation between EDSS and GMF was not significant (r = − 0.07; p = 0.36). Scatter plots of MRI variables against EDSS are shown in Figure 1.
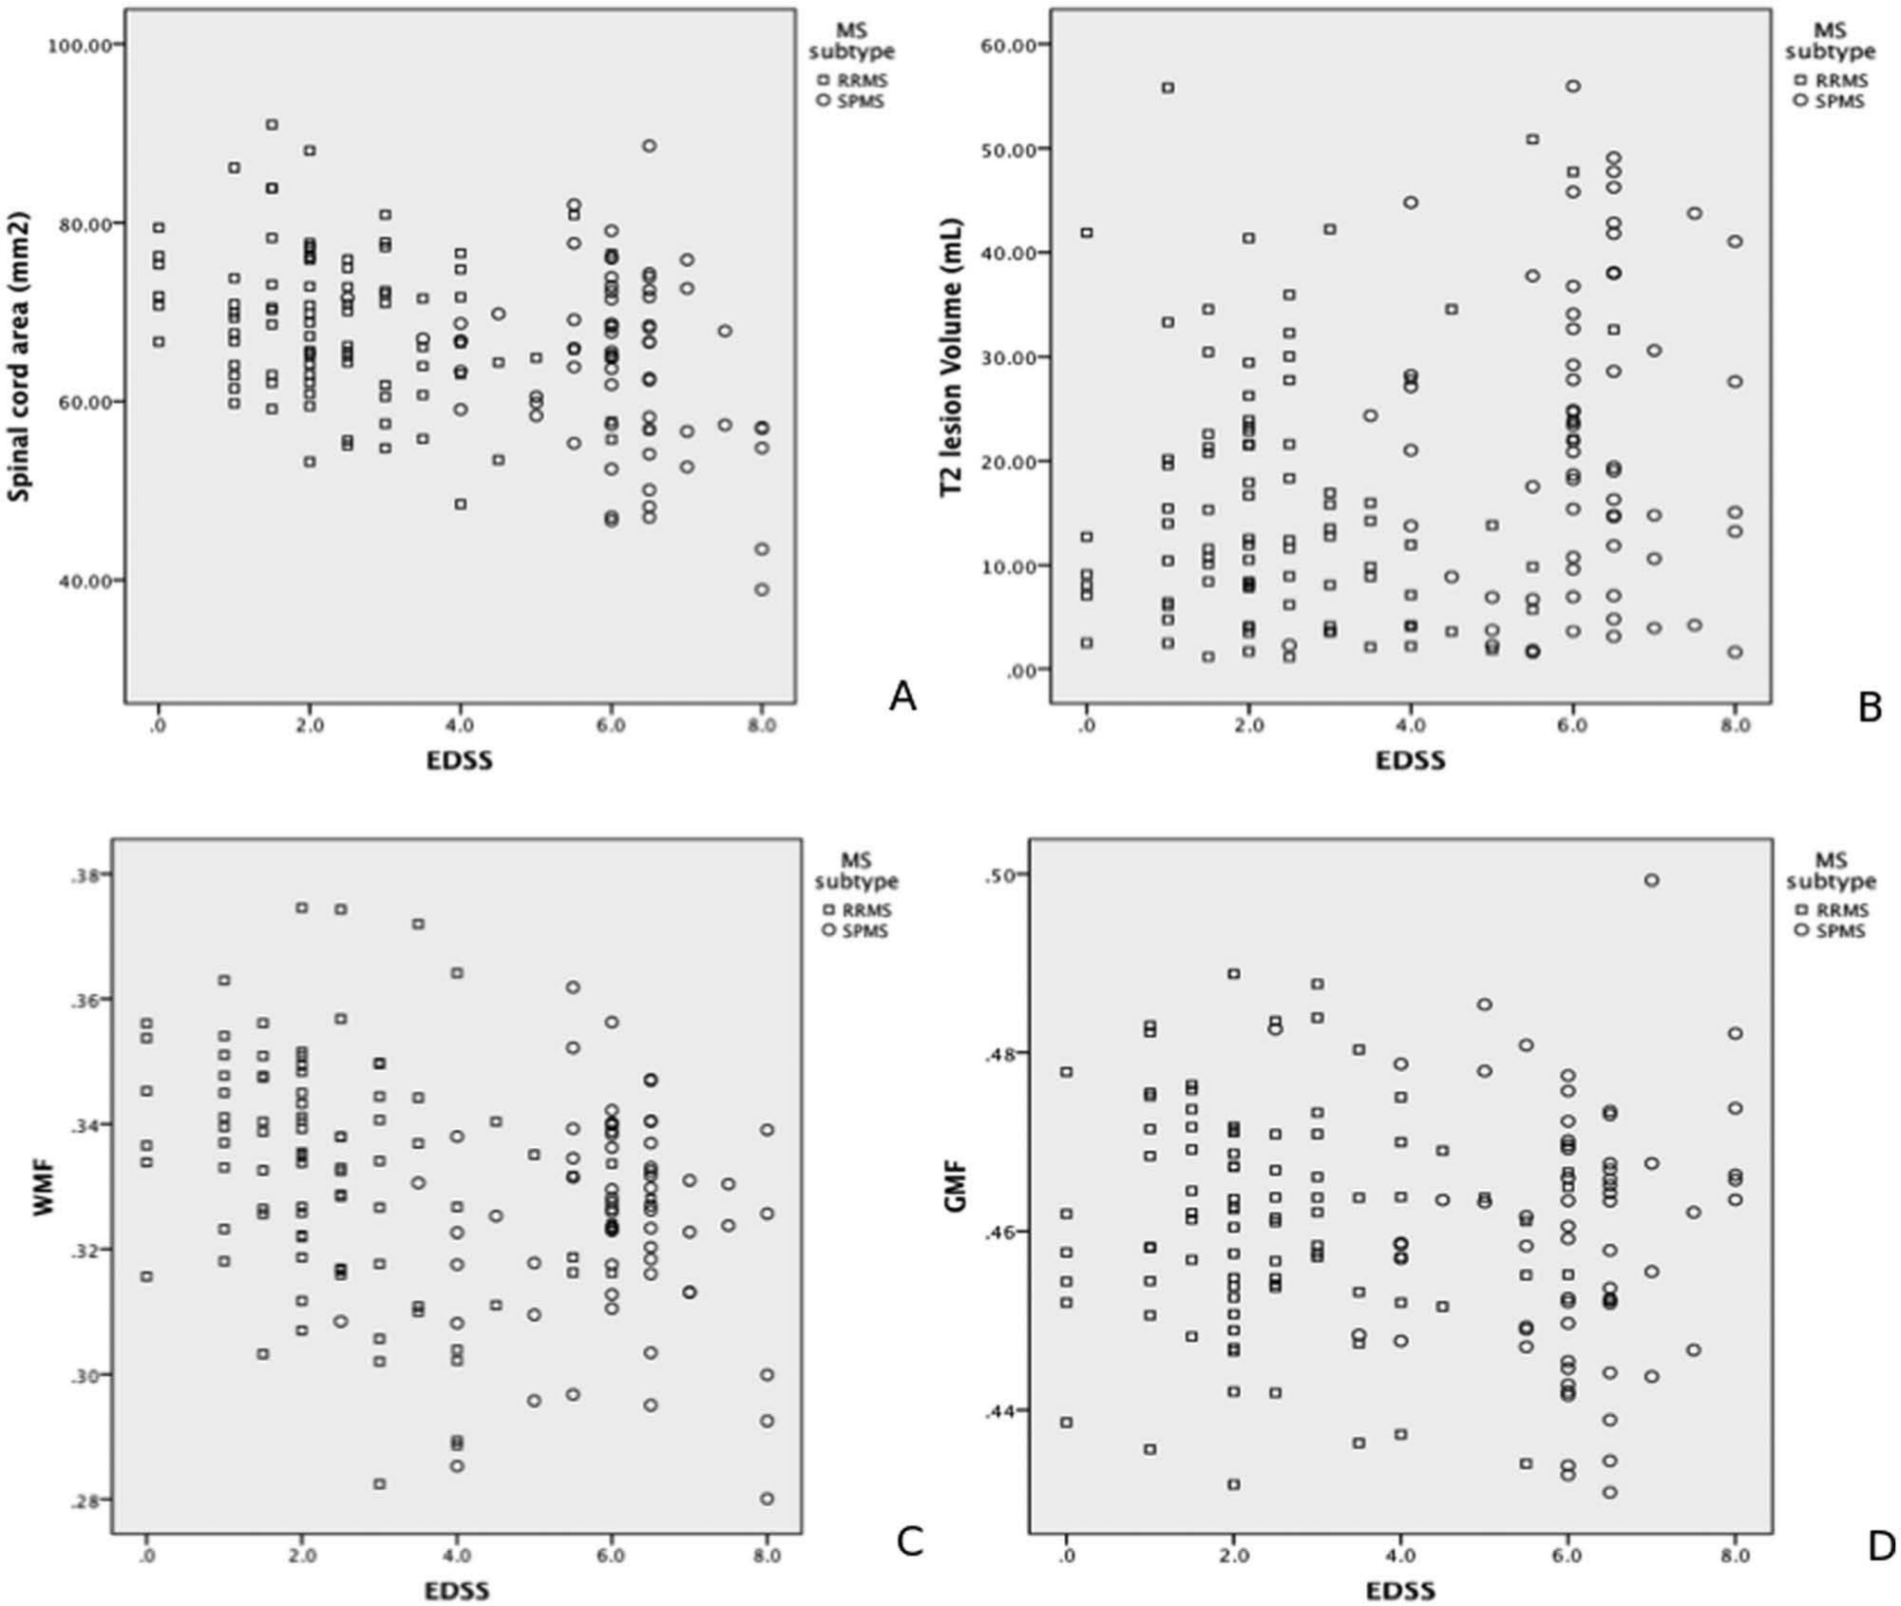
Graphs of T2LV (a), SCA (b), GMF (c), WMF (d) against EDSS.
In a univariable logistic regression analysis for binary EDSS groups, we found that both T2LV (odds ratio (OR) = 1.98 per 1 SD larger T2LV; 95% CI 1.39, 2.82; p < 0.01) and UCCA (OR = 0.55 per 1 SD higher cord area; 95% CI 0.38, 0.79; p < 0.01) were associated with EDSS ≥ 6. In a univariable ordered logistic regression for 4-category EDSS, we found the following associated with EDSS: T2LV (OR = 1.56 per 1 SD larger T2LV; 95% CI 1.16, 2.10; p < 0.01), UCCA (OR = 0.53 per 1 SD higher cord area; 95% CI 0.39, 0.72; p < 0.01) and WMF (OR = 0.62 per 1 SD WMF; 95% CI 0.47, 0.82; p < 0.01).
We subsequently performed a multivariable analysis, again using a binary and then 4-part model of EDSS. Both T2LV (OR = 1.67 per 1 SD larger T2LV; 95% CI 1.09, 2.56; p = 0.02) and UCCA (OR = 0.57 per 1 SD higher cord area; 95% CI 0.37, 0.86; p = 0.01) were found to be associated independently with the requirement of a walking aid (i.e. EDSS ≥ 6). The C-statistic for this model was 0.8, with 81% sensitivity and 75% specificity, and 77% correctly classified. In a multivariable ordered logistic regression model with a 4-part model of EDSS, the following were found to be associated with EDSS: UCCA (OR = 0.55 per 1 SD higher cord area; 95% CI 0.40, 0.77; p < 0.01), T2LV (OR = 1.56 per 1 SD larger T2LV; 95% CI 1.08, 2.25; p = 0.02) and GMF (OR = 0.67 per 1 SD GMF; 95% CI 0.46, 0.98; p = 0.04).
Discussion
In this work we studied a large group of MS patients, two to three decades after their first symptom onset. Our results show that UCCA, T2LV and less consistently, brain GM atrophy independently associated with EDSS.
When considering the results, it should be noted that this cohort differs from previous studies looking simultaneously at spinal cord and brain measures in MS.6,8 Firstly, the present cohort is larger, with 159 patients, compared with the 70 studied by Bonati et al. and 21 by Cohen et al. Secondly, it includes patients with longer disease duration (mean of 26 years, as compared to 20 years and 8 years, respectively). Thirdly, it includes more people with higher levels of disability (median EDSS current study=4; Bonati et al. median=2.5; Cohen et al. mean=1.6) and more SPMS patients (current study, n=67; Bonati et al., n=11; Cohen et al., n=1); however (unlike the previous two studies), this is a multicentre study, and so differences in scanners can introduce inter-site variability. 18 The statistical analyses adjusted for centre effects, so we are confident the findings are real.
Overall, our findings agree with previous studies6,8 demonstrating that UCCA is independently related to disability. With regard to changes in the brain, Cohen et al. find no additional association with disability in a group of mostly RRMS patients with low EDSS scores, while in a mixed CIS, RRMS and SPMS cohort with long disease duration, Bonati et al. observe that GMF independently associates with EDSS in all cases, and T2LV in those cases with clinically definite MS. In the present cohort, T2LV; and in the 4-part EDSS model only, GMF were found to contribute to variability in EDSS. The consistent, independent relationship of UCCA with disability in all three studies of cohorts with RRMS and SPMS, with disease durations ranging from a mean of 8 – 26 years, is noteworthy. An association of disability with T2LV and GM atrophy, independent of spinal cord atrophy, was only evident in the 20- and 26-year disease duration cohorts, suggesting that the effects of brain GM pathology in MS may become more relevant with longer disease duration.
Given that it can be difficult to determine the onset of progressive MS, and as a natural history study suggests SPMS tends to occur at a similar rate when a disability threshold is reached, rather than being determined by prior relapses, 19 it was of interest to see if there were MRI differences between benign and non-benign RRMS, and non-benign RRMS and SPMS. In order to do this, we split the RRMS cohort into ‘benign’ (i.e. EDSS ≤ 3) and those with an EDSS of ≥ 3.5. In doing so, we were aware that this division is defined by physical disability and that cognitive deficits may be considerable in people with physically ‘benign’ MS. 20 No significant differences emerged between T2LV brain or spinal cord atrophy, between the non-benign RRMS and SPMS patients. This suggested that the division between these groups on the basis of clinical progression may be arbitrary and not strongly supported by differences in MRI characteristics.
Lower UCCA values were evident in both SPMS and non-benign RRMS, when compared with benign MS, thus UCCA seemed to relate to concurrent physical disability. In this study, we used EDSS as a measure of disability, although it does not fully reflect the clinical impact of MS. Above 3.5, the EDSS is heavily weighted towards mobility; and thus, corticospinal tract integrity. In turn, those MRI measures that were more directly linked with the corticospinal tracts were more likely to correlate with EDSS, hence the association between UCCA and disability emerged consistently in all models. This study builds on previous work, demonstrating that UCCA is relevant to physical disability in MS, and that this relationship remains significant in the long-term, in people with higher EDSS, and in both RR and SPMS.
A question arising from our observation that the highest T2LV was seen in SPMS is whether a high T2LV in earlier years might predict future secondary progression? Although our cross-sectional study could not directly investigate this, evidence from two other studies supports a long-term prognostic role of T2LV in relapse-onset MS. First, a 20-year follow up of a CIS cohort found that the rate of increase of T2LV was three times higher in those that develop SPMS, compared to those patients who remained RRMS; and that the higher T2LV was already evident after 5 years, in those who later developed SPMS. 9 Secondly, in a recent 21-year follow-up study that reported mortality outcomes of RRMS patients who had participated in a clinical trial of beta interferon, Goodin et al. finds that the baseline T2LV is an independent predictor of death. 21 Although no information on neurological status was provided in that study, it is plausible that the higher mortality reflects a greater likelihood of patients with high lesion loads to develop secondary progression with severe disability.
In the current study’s univariable analyses, WMF was associated with EDSS, but not in the multivariable analysis, where GMF was independently associated. This can be explained by the inter-relationships between MRI measures. For a MRI measure to be retained in a regression model, it must correlate with the outcome of interest and do so at least partly independently of other measures. WMF was significantly correlated with both T2LV and UCCA, whereas GMF was not, and when both T2LV and UCCA were included in the statistical multivariable model, WMF did not add to the predictive power of the model above that of T2LV and UCCA alone. In contrast, while GMF alone did not correlate with clinical measures in univariate analysis, once variability due to T2LV and UCCA had been accounted for, it did contribute independently to disability in the 4-part model of EDSS, albeit with modest significance (p = 0.04). Although we found a negative correlation between GMF and WMF, this very likely represented a mathematical interaction between the two fractional volumes that have a common denominator, rather than an error in segmentation: when the actual GM and WM volumes were compared without normalisation, we saw a strong positive correlation, as expected (data not shown).
As a conceptual limitation of our study, it cannot be assumed the same associations would be observed if different outcome measures were used. Cognitive impairment is common in MS, particularly in SPMS,22,23 and if the cognitive scores were used instead, the imaging associations may differ. A previous longitudinal study in SPMS demonstrates a significant correlation of reductions in GM volume, but not UCCA or T2LV, with paced auditory serial addition test (PASAT) scores. 24
Although GMF was associated independently with EDSS in the 4-part model, no significant differences were established between GMF in RRMS and SPMS cohorts, although we observed a weak trend between lower GMF values with higher EDSS scores. A stronger correlation between EDSS and GMF was observed in a previous study of a MS cohort with a 20-year disease duration. 10 Several factors may have limited the associations observed in the present study. First, many subjects had large lesion loads, which could have had subtle effects on brain segmentation, in spite of using lesion filling to correct tissue volumes. 14 Secondly, lesions partly involving the deep GM may still sometimes have been classified as WM, leading to slight inaccuracies of WMF and GMF computation. Thirdly, there was often substantial atrophy. The GM and WM segmentation algorithm that we used (SPM) was developed from a normal (non-atrophic) brain template, and its performance may differ in the presence of marked brain atrophy. Finally, the cohort studied had a disease duration that considerably exceeded that of other cohorts in whom associations were observed between GM atrophy and disability.7,10 It is possible that GM atrophy may reach a nadir at a later point in the natural history of the disease, beyond which it has a lesser independent contribution to disability.
Two other study limitations are noted. First, this study was cross-sectional, and although T2LV, UCCA, and to a lesser extent GMF, were found to be independently associated with concurrent disability, the rate of change of these measures over time was not examined. Longitudinal observations would be required to clarify their temporal dynamics, in relationship to changes in disability measures.
Secondly, this was a multi-centre study. This allowed a larger cohort to be studied, but that will have introduced some variability in MRI measures, and while these were accounted for in the statistical models, they may still have influenced the apparent strength of associations between MRI measures and clinical scores.
This study showed that spinal cord and brain pathology are both relevant, contributing independently to long-term physical disability in relapse-onset MS. The results also highlighted that combinations of MRI measures may be required to optimally capture clinically-relevant information in people with MS of long disease duration.
Footnotes
Funding
The work of the NMR Research Unit at the Queen Square MS Centre is supported by the MS Society of Great Britain and Northern Ireland, and the UCLH-UCL Biomedical Research Centre.
The work of the MS centre in Amsterdam is supported by the Dutch Foundation for MS research (grant number 09-358d).
Conflict of interest
The authors declare that there is no conflict of interest.
References
Supplementary Material
Please find the following supplemental material available below.
For Open Access articles published under a Creative Commons License, all supplemental material carries the same license as the article it is associated with.
For non-Open Access articles published, all supplemental material carries a non-exclusive license, and permission requests for re-use of supplemental material or any part of supplemental material shall be sent directly to the copyright owner as specified in the copyright notice associated with the article.