
Abstract
The spinal cord plays a central role in the pathophysiology and clinical manifestations of multiple sclerosis (MS), yet remains under-studied compared with the brain. This review summarizes key insights from the 2025 North American Imaging in MS Spinal Cord Imaging Workshop, highlighting recent advances, ongoing challenges, and future opportunities in MS spinal cord imaging. We review pathological studies and outline the clinical relevance of spinal cord lesions and atrophy for diagnosis, prognosis, and disease monitoring, highlighting emerging biomarkers of progression independent of relapse activity. Correlations between magnetic resonance imaging, histopathology, and clinical outcomes support the validation and translational potential of advanced spinal cord imaging techniques. Finally, we discuss spinal cord–specific processing pipelines and reproducibility challenges. Collectively, these insights underscore the need to integrate advanced and quantitative spinal cord imaging into clinical trials, research studies, and—when feasible—clinical care, to fully capture the extent of MS pathology, and ultimately improve patient outcomes.
Introduction
The spinal cord is a clinically eloquent, pathologically vulnerable structure in multiple sclerosis (MS), frequently affected early in the disease course and strongly associated with long-term disability. Despite its importance, spinal cord imaging remains underutilized in clinical practice, trials, and research, largely due to technical and analytical challenges. Historically, clinical trials have rarely included spinal cord imaging, limiting our ability to capture the full extent of MS pathology and treatment response, particularly in progressive disease and progression independent of relapse activity (PIRA). Recent advances in acquisition, processing pipelines, and biomarker validation are shifting this landscape, offering new opportunities to understand, monitor, and treat spinal cord involvement in MS. 1 This review summarizes current knowledge and future directions discussed during the 2025 NAIMS Spinal Cord Imaging Workshop, held in West Palm Beach, Florida, on February 26, 2025. The article is intended as a workshop-informed narrative review rather than a formal consensus statement or systematic review. Workshop topics were identified in advance and discussed by invited experts, and manuscript sections were drafted by co-authors according to their subject-matter expertise. The literature cited was selected in a targeted manner to reflect key themes discussed at the workshop and important developments in the field; no formal inclusion/exclusion criteria, voting process, or Delphi-style consensus procedures were used.
MS pathology in the spinal cord
Descriptions of spinal cord pathology in MS date back to the 19th century. Carswell 2 and Cruveilhier 3 reported gray discoloration and spinal column degeneration, while Rindfleisch 4 linked demyelination to vessel-associated inflammation. Fog 5 later described a “butterfly” demyelination pattern across the posterior, lateral, and anterior columns, corresponding to venous anatomy, and Oppenheimer 6 related lesion formation to blood–spinal cord barrier disruptions.
Over a century of post-mortem studies confirms inflammation, barrier disruption, demyelination, and neural injury/loss are common in the spinal cord, within and beyond lesions. Demyelination is often more extensive in gray matter than white matter, the latter predominantly affecting the lateral and posterior columns, especially in the cervical cord (Figure 1(a)). 7 Lesions follow vessel-related rather than cerebrospinal fluid (CSF)-associated distributions, and vascular pathology is increasingly recognized as central to MS spinal cord damage. Blood–spinal cord barrier disruption—evidenced by perivascular fibrinogen and immunoglobulin deposits 8 —alongside widespread small vessel disease features (enlarged perivascular spaces, thickened vessel walls), is frequently observed, particularly in younger individuals 9 (Figure 1(b)–(e)). Iron-laden foamy macrophages are seen in lesion cores with a perivascular pattern, and ferritin (iron-binding protein) can be detected at some lesion rims. 10
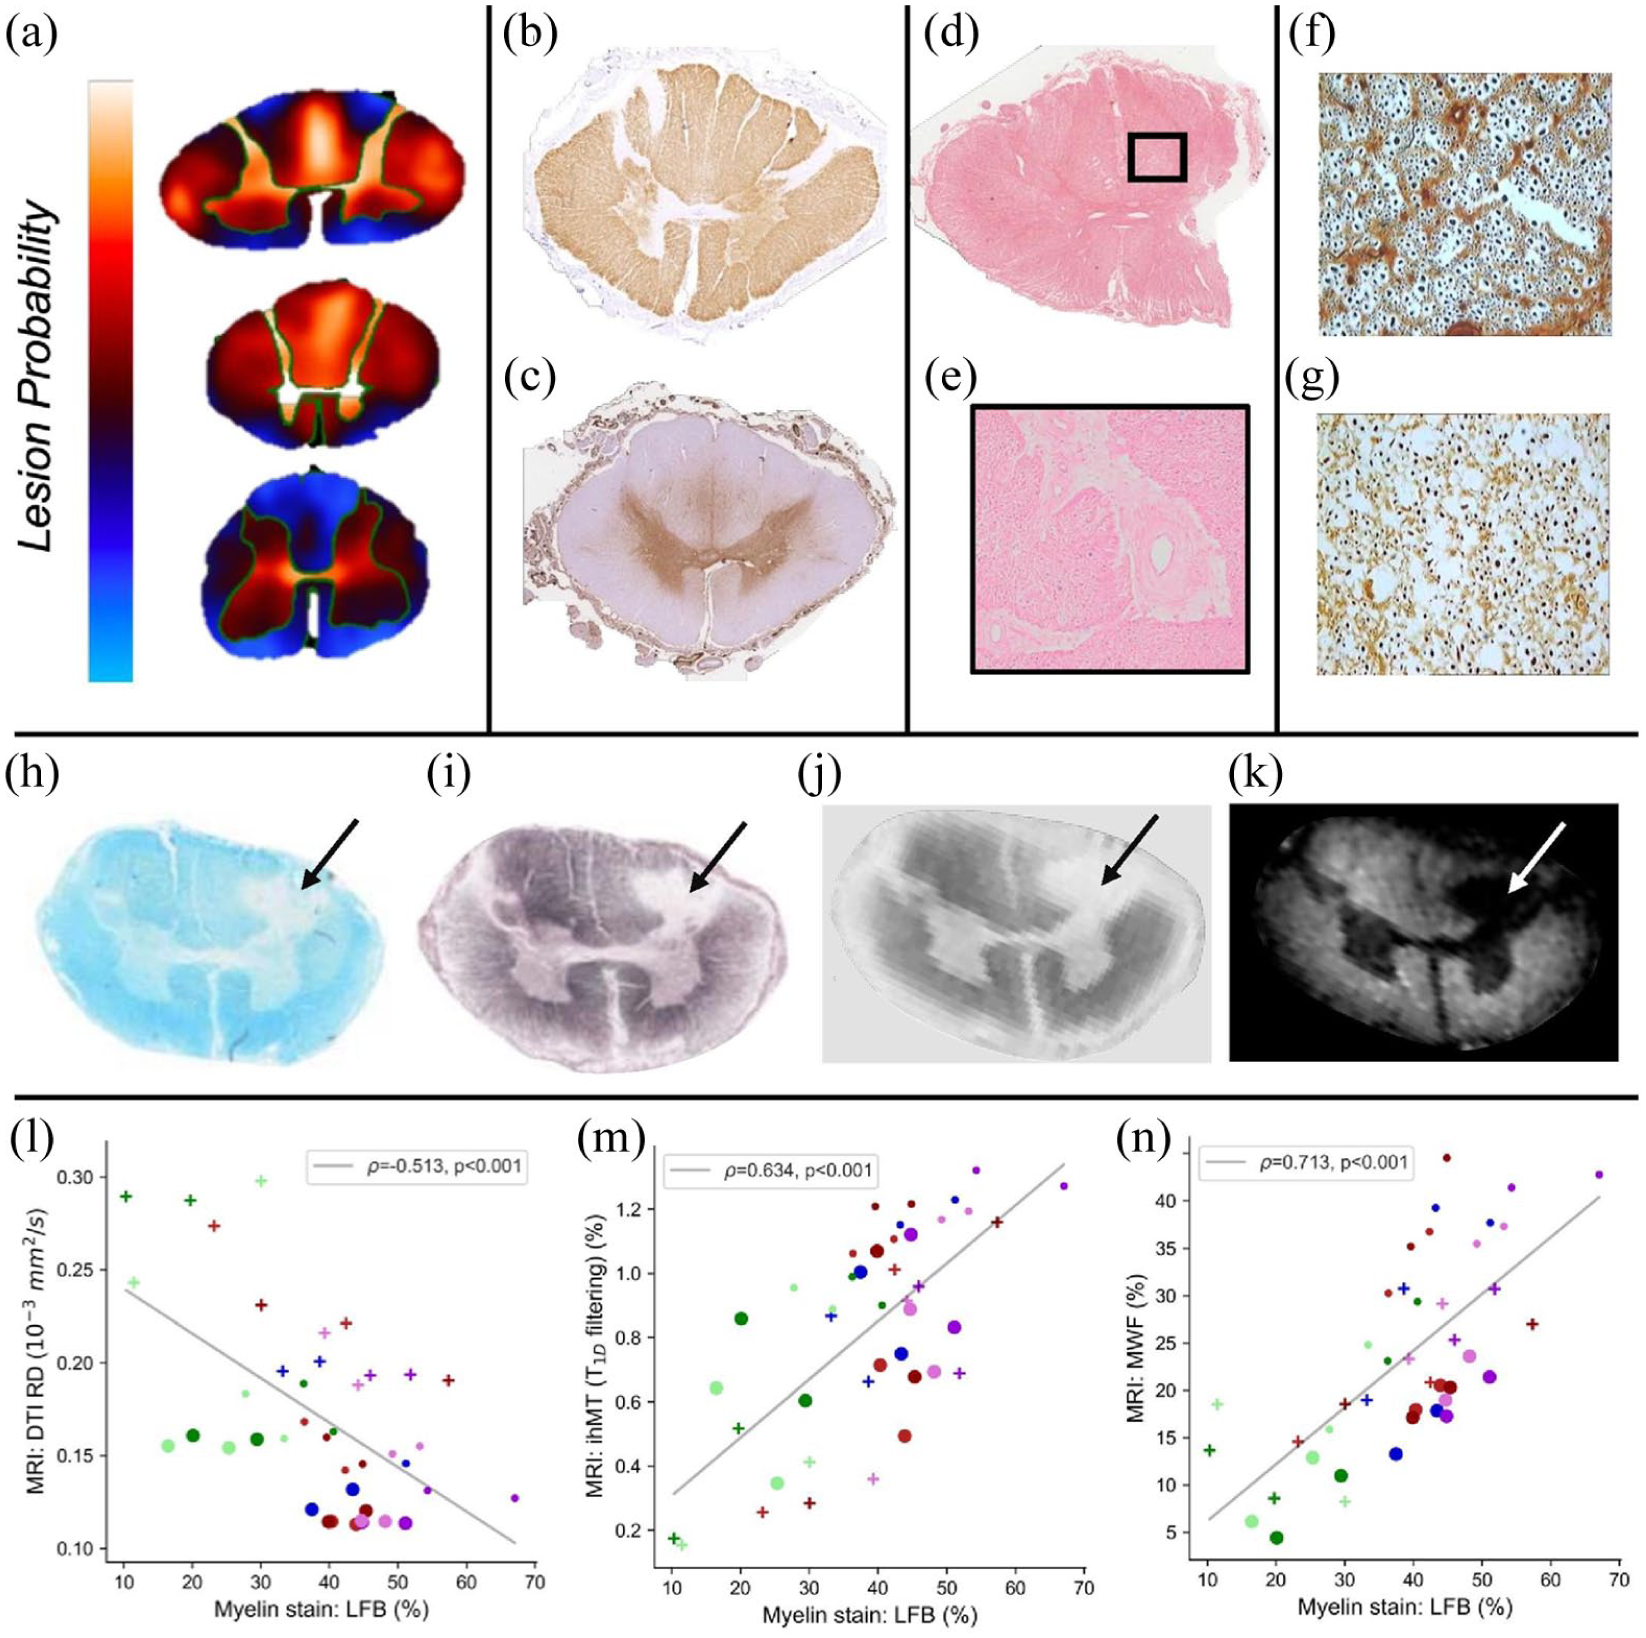
Spinal cord pathological features and MRI-pathology correlations. (a) Lesion frequency heatmaps of total demyelinated lesions in the cervical (top), thoracic (middle), and lumbar (bottom) spinal cord. Lesion predilection sites include the dorsal columns, lateral columns, and gray matter as a whole, with relative sparing of the subpial surface. (b) Myelin (proteolipid protein) and (c) fibrin(ogen) immunostaining in adjacent spinal cord sections from an MS case. Fibrin(ogen) deposition is consistently found in the central part of the cord, including gray matter, and mesial aspects of the lateral columns and central part of the dorsal column in areas outside demyelinated lesions. (d) Hematoxylin and eosin–stained section with magnified inset (e), demonstrating thickened vasculature in the MS spinal cord, a finding consistently found in younger cases. Perivascular space dilatation is also a common feature (not shown). (f) and (g) Palmgren silver-stained sections showing reduced axonal density in an MS case (g) compared with control (f), with predilection for loss of small diameter axons. (h) Luxol Fast Blue stain for myelin and (i) Bielschowsky stain for axons in the secondary progressive MS section demonstrate reduced staining in a focal lesion (arrow), which is visualized on 7 Tesla ex vivo MRI as (j) T2-weighted hyperintensity and (k) myelin water fraction imaging hypointensity. Comparison between Luxol Fast Blue myelin staining optical density and quantitative MRI, (l) radial diffusivity (RD), (m) inhomogeneous magnetization transfer (ihMT) and (n) myelin water fraction (MWF) show strong quantitative correlations between histology and MRI markers for myelin in the spinal cord. (a) Adapted from Waldman et al., Acta Neuropathol 2024 11 http://creativecommons.org/licenses/by/4.0/; (f) and (g) adapted from DeLuca et al., Brain 2004. 12
Neuronal injury in the spinal cord is also widespread and represents a major substrate of irreversible MS disability. Acute axonal damage, marked by β-APP, correlates with lesions and microglial/macrophage activity even beyond demyelinated areas. 13 Widespread neuronal, axonal, and synaptic loss occurs early, variably associates with demyelination, and appears more closely linked to diffuse parenchymal and meningeal inflammation14 –16 (Figure 1(f)–(g)). The extent of neuronal loss significantly exceeds typical imaging-detected spinal cord atrophy, suggesting that conventional atrophy measures underestimate tissue damage.
Taken together, these observations show that MS pathology in the spinal cord is multifocal, vascularly influenced, and often diffuse—features that help explain why even relatively small or clinically silent lesions can have substantial functional consequences. This pathological background provides the context for understanding how often the cord is involved in MS and what the clinical impact of that involvement is.
Clinical relevance of spinal cord lesions
Approximately 80%–90% of people with MS develop spinal cord lesions at some point in their disease course.17,18 However, the presence of spinal cord lesions in MS may be underestimated depending on the imaging technique and protocol used, with higher detection rates reported on more contemporary scanners and when axial sequences are included. In a recent study including systematic axial T2-weighted spinal cord imaging, 72.5% of patients had spinal cord lesions within 2 years of a diagnosis of relapsing–remitting MS. 19 People with an initial cord relapse are more likely to experience a second cord relapse than those with non-cord onset 20 (Figure 2(a)); genetic 14 and immunological 21 factors may contribute to inter-individual variation, although data are limited.
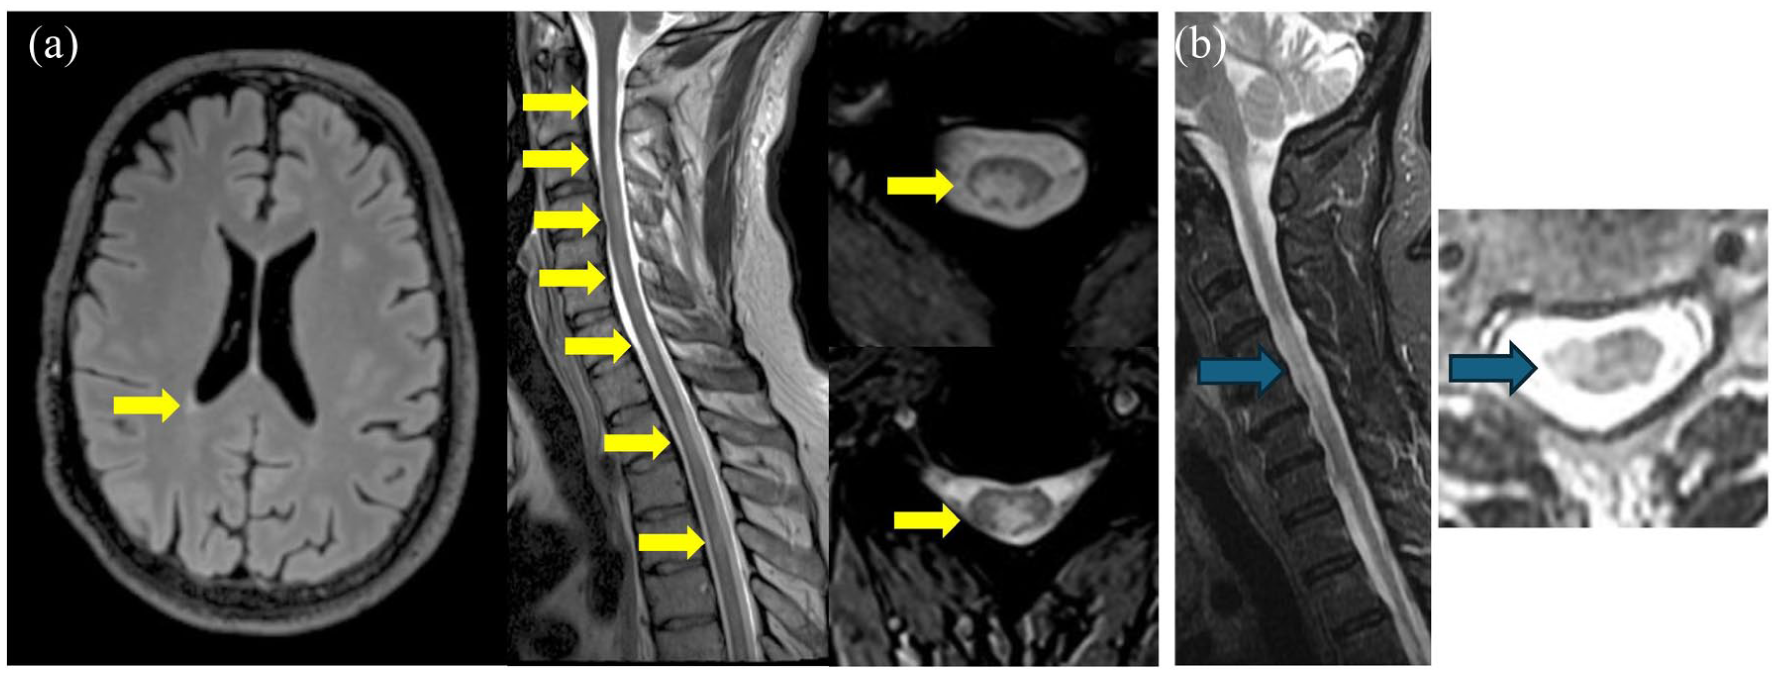
Examples of predominant spinal cord involvement in people with MS. (a) Confluent spinal cord lesions contrasting with minimal brain lesions in a 40-year-old man diagnosed with secondary progressive MS. He presented with progressively worsening balance disturbances over the year before this scan, resulting in significant gait instability. Clinical history revealed two previous probable relapses, consisting of sensory symptoms in the lower limbs 5 and 10 years earlier. (b) Critical spinal cord demyelinating lesion. A 49-year-old woman noted right leg weakness on exertion only during exercise. Over the following 12 years, she developed insidiously worsening progressive right upper motor neuron hemiparesis, with right leg worse than right arm weakness. Cervical spinal cord MRI showed a large cervical 4–5 right lateral lesion with focal hemiatrophy characteristic of a critical demyelinating lesion. Cerebrospinal fluid assessment showed elevated unique CSF oligoclonal bands, and she was diagnosed with primary progressive MS.
Diagnostic and monitoring utility
Spinal cord magnetic resonance imaging (MRI) is recommended at initial evaluation for diagnosis,22 –24 as the spinal cord is one of five topographical locations considered for lesion dissemination in space (DIS). In addition, in people with primary progressive onset of MS, the presence of ⩾2 spinal cord lesions satisfies DIS even without involvement of other central nervous system (CNS) regions. Spinal cord MRI is also valuable in adults older than 50 years and in people with cerebrovascular pathology, as spinal cord lesions are rarely associated with age-related or vascular white matter changes that may mimic MS on brain MRI.
For clinical acquisition, full spinal cord coverage is recommended using MRI scanners with a field strength of at least 1.5 Tesla, with slice thickness no greater than 3 mm (sagittal) and 5 mm (axial), and in-plane resolution of 1 × 1 mm. Two sagittal sequences (any combination of T2 fast or turbo spin-echo, proton density, short tau inversion recovery (STIR), and three-dimensional (3D) inversion-prepared T1) are required to confirm the presence of lesions and exclude artifacts, with axial moderately T2-weighted spin-echo or T2* gradient echo slices at least through the cervical regions. Post-gadolinium enhanced moderately T1-weighted scans can be helpful without additional contrast agent administration if spinal cord imaging is done immediately after a contrast-enhanced brain study.
The role of spinal cord imaging in ongoing disease monitoring and assessment of treatment response remains debated. Several studies have reported that asymptomatic spinal cord lesions occur in 15%–30% of clinically stable people with MS, and that approximately 10% of patients develop asymptomatic spinal cord lesions in the absence of new asymptomatic brain lesions.25 –28 In contrast, two recent studies using automated tools to assist with the detection of new brain lesions reported that isolated asymptomatic spinal cord lesion activity during follow-up was uncommon (~2%).29,30 These differing findings may reflect variation in imaging protocols, follow-up duration, and lesion detection methods. In addition, spinal cord imaging remains technically and diagnostically more challenging than brain MRI, and confident identification of new lesions requires substantial expertise. More sensitive artifact-reduced imaging approaches, combined with brain–spinal cord protocols, and validated automatic lesion detection methods may improve the feasibility and value of spinal cord MRI for longitudinal monitoring.
Prognostic value
Across MS phenotypes, cord lesion burden is associated with more aggressive disease and higher progression risk. In people with clinically isolated syndrome, spinal cord lesions are associated with a higher likelihood of developing definite MS. 31 Cervical spinal cord involvement can also be seen in early MS, 32 in radiologically isolated syndrome where people with asymptomatic cord lesions may later develop primary progressive MS, 33 and pediatric MS. 34 In established relapse-onset MS, early spinal cord lesion burden has also been associated with worse long-term disability outcomes, supporting the prognostic relevance of cord involvement across disease stages. 35 Most cases of progressive MS manifest as chronic, insidiously worsening, asymmetric myelopathy, consistent with the topographical model of MS, in which damage to clinically eloquent structures like the spinal cord leads to earlier clinical decline as CNS reserve is exhausted. 36
Lesion size and location may be important. In relapsing–remitting MS, spinal cord lesion number and volume are important prognostic predictors. 19 Critical demyelinating lesions with clear anatomical links to progressive motor impairment are characterized by lateral column location (affecting the corticospinal tracts), focal cord atrophy, and relatively larger size 37 (Figure 2(b)) and may even present as an isolated demyelinating lesion known as progressive solitary sclerosis. 37
Challenges for clinical practice
Despite its diagnostic and prognostic significance, spinal cord MRI is less standardized and less frequently used than brain MRI in routine clinical practice and trials. Spinal cord lesion identification is technically and diagnostically challenging, with substantial inter-individual variability. 38 Susceptibility-sensitive markers such as paramagnetic rim lesions and the central vein sign are well established in the brain, but remain technically challenging to visualize in the spinal cord at conventional clinical field strengths. Their detection in the cord has been reported mainly in small ultra-high-field MRI studies, 39 and their true prevalence and clinical significance in spinal cord MS lesions remain uncertain. Recent neuropathological work has also suggested that iron rims may be absent in spinal cord lesions, 40 further underscoring the need for caution in extrapolating brain-based lesion markers to the cord. Improved imaging sequences with better lesion-to-normal tissue contrast could enhance detection, 41 while shorter acquisition times and combined brain–spinal cord protocols may facilitate broader clinical adoption. 42 Integrating accurate, validated automated lesion detection tools into routine workflows for both cross-sectional and longitudinal analysis also remains a critical area for development. How lesion severity and evolution relate to clinical impact remains to be fully explored.
Finally, although spinal cord lesions have major clinical relevance, they are rarely used as outcome measures in MS clinical trials. Expanding cord imaging in trials is essential to evaluate therapeutic efficacy across the full extent of MS pathology.
Spinal cord atrophy
Spinal cord atrophy is one of the strongest predictors of future disability worsening, particularly for PIRA, and time to progressive MS diagnosis.43,44 In a cohort of 484 people with an initial relapsing–remitting course, a case–control analysis compared converters to secondary progressive multiple sclerosis (SPMS) with matched non-converters over 12 years. Faster C1-level spinal cord atrophy rates were strongly associated with shorter times to SPMS diagnosis and predicted transition to SPMS more than 4 years before diagnosis. 43 In the same study, cord atrophy also preceded and predicted relapse-free disability worsening. 43 Similarly, in the Swiss MS Cohort study (n = 445), C1–C3 cervical cord atrophy predicted shorter time to PIRA and was more pronounced in people who experienced PIRA during 4 years of follow-up 44 (Figure 3).
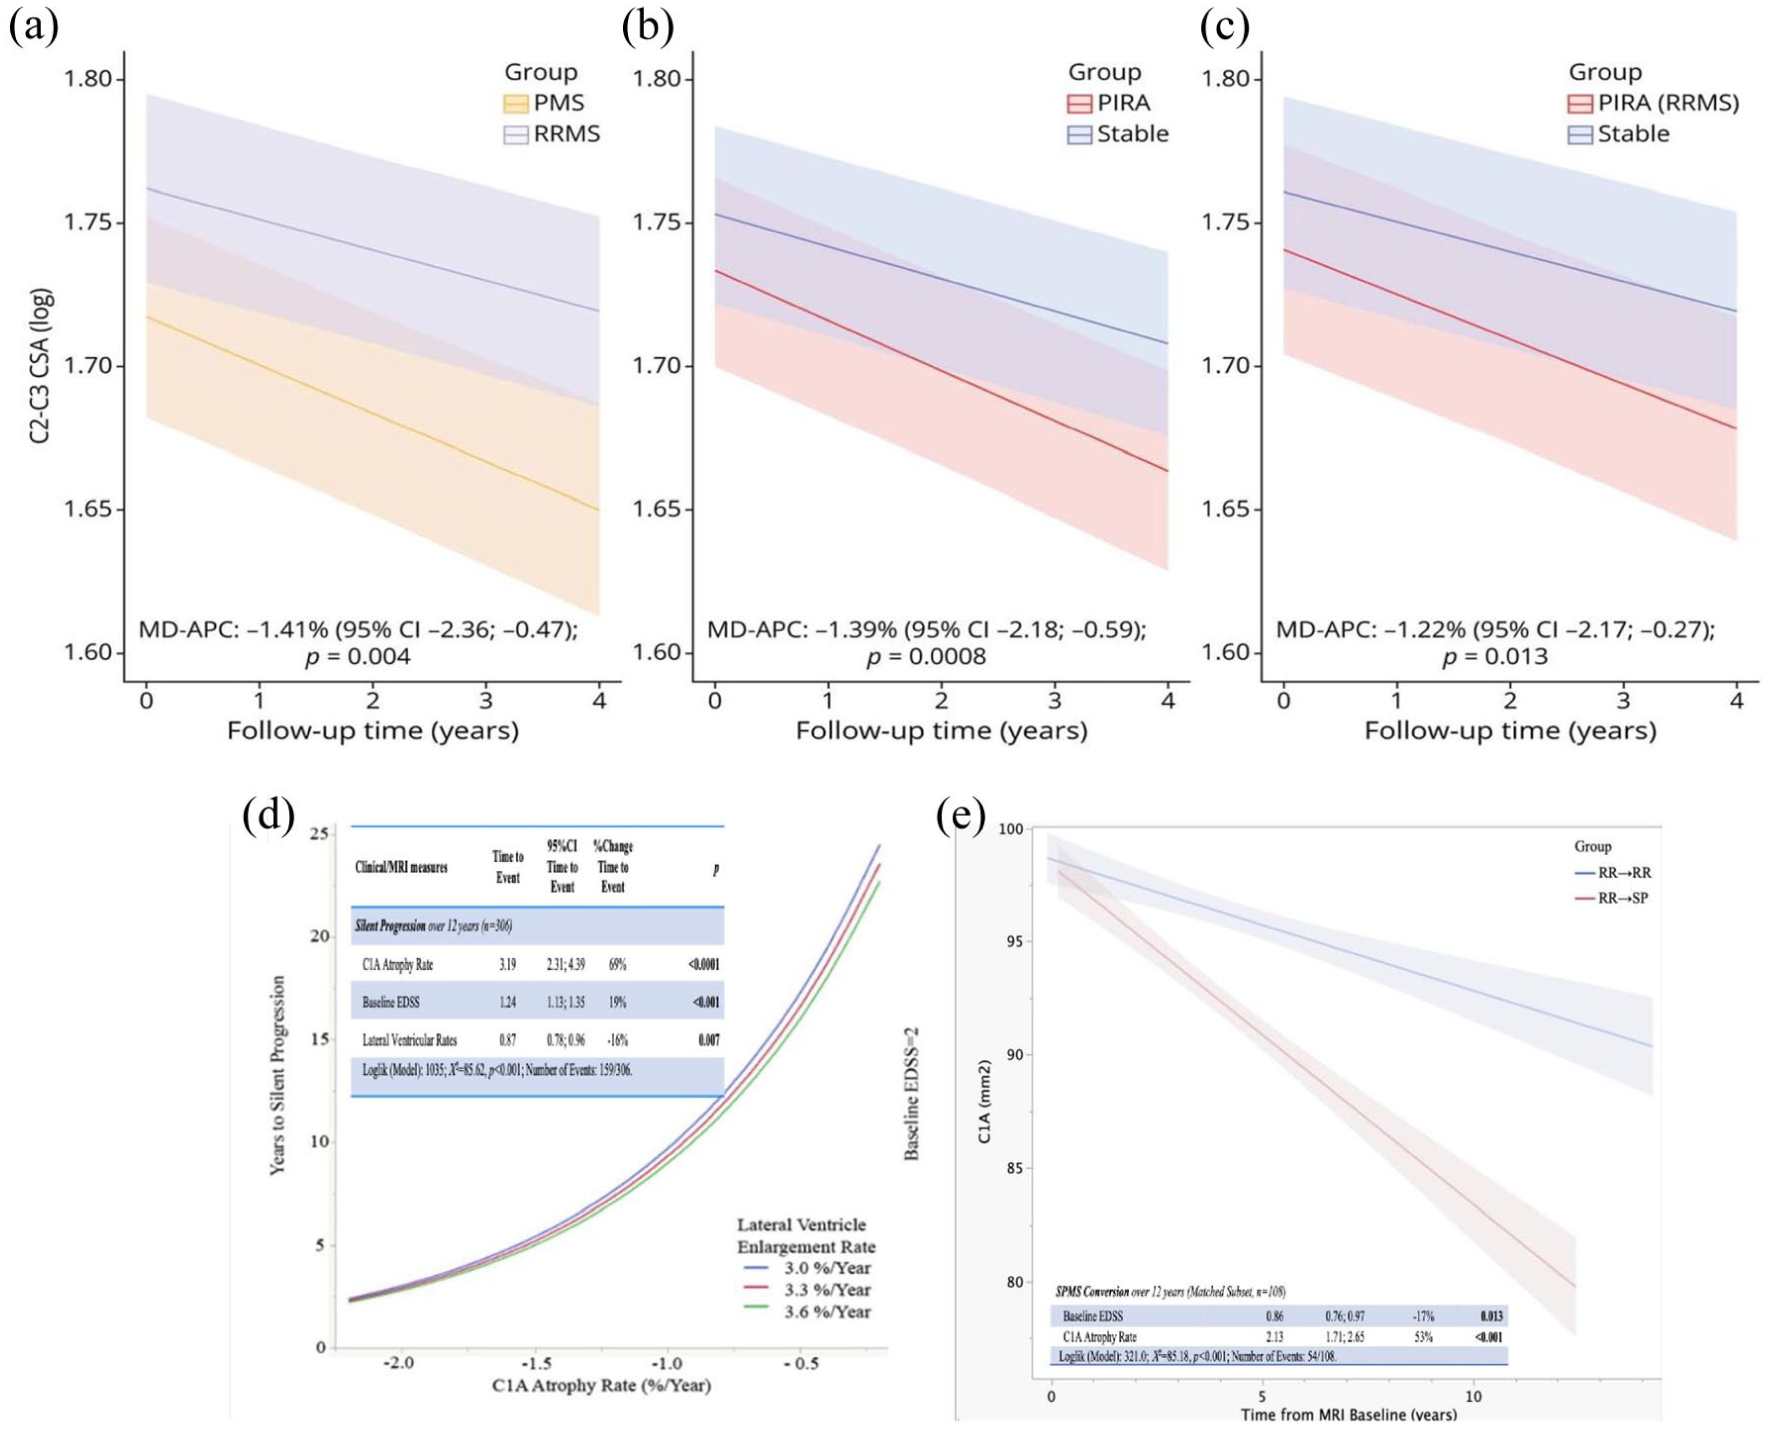
(a)–(c) From Cagol et al.: 44 Comparisons were performed between (a) patients with PMS and those with RRMS; (b) patients who experienced PIRA during follow-up and stable patients; and (c) patients who experienced PIRA during follow-up and stable patients, restricted to those with RRMS at baseline. The figures illustrate the predicted marginal effects derived from the multivariable mixed models. CSA = cross-sectional area; MD-APC = mean difference in annual C2–C3 cross-sectional area percentage change; PMS = progressive multiple sclerosis; PIRA = progression independent of relapse activity; RRMS = relapsing–remitting multiple sclerosis. (d) and (e) From Bischof et al. 43 (d) Risk of silent progression/PIRA for patients with EDSS of 2 at first visit is best predicted by C1 cord atrophy rate, with every 1% worse atrophy conveying 69% shorter time to silent progression/PIRA within a 12-year observation period. (e) Patients who convert to SPMS have 2 to 3 times faster C1 cord atrophy rates (p < 0.001) compared with those who do not within a 12-year observation period. C1 cord atrophy best predicted time to SPMS diagnosis with each 1% faster C1 atrophy rate being associated with a 53% shorter time to SPMS conversion (p < 0.001).
The relationship between spinal cord lesions and atrophy is complex. Both affect white matter and gray matter and are evident early in MS, including in clinically isolated syndrome and radiologically isolated syndrome.45 –47 Yet, there are conflicting data on the relationship between spinal cord lesions and spinal cord atrophy.45,47,48
The contribution of spinal cord atrophy to disability worsening likely varies by disease phase. In early MS, both relapse-associated and non-relapse progression can occur, with disability accruing from focal lesions as well as more diffuse damage captured by cord atrophy. Later in the disease (or when lesion activity is controlled by DMTs), diffuse tissue damage likely dominates. Regardless of disease phase, cord atrophy remains an important predictor of PIRA and non-relapsing progression. However, despite its prognostic relevance, the effect of current disease-modifying therapies on preventing or slowing spinal cord atrophy has been limited or inconsistent. 49
There is increasing interest in deriving upper cervical spinal cord atrophy measures from brain MRI scans. Sagittal 3D T1-weighted acquisitions routinely obtained in clinical and research protocols can often be used to estimate upper cervical cord cross-sectional area, typically from C1 to C3/C4, and more limited axial acquisitions have also been used in some research and trial settings.43,50,51 This approach can improve feasibility and enable retrospective analysis of existing brain MRI data sets, but measurements depend on image coverage and sequence characteristics and do not reflect more caudal spinal cord pathology. Brain-derived upper cervical cord metrics should, therefore, be considered complementary to dedicated spinal cord imaging.
Future work should aim to improve the precision and reproducibility of spinal cord imaging through advancing acquisition techniques, automated volumetric methods, and deep learning-based lesion segmentation. Integrating lesion and atrophy measures into clinical practice and trials may enable earlier detection of neurodegeneration and more accurate evaluation of therapies targeting progressive disease mechanisms. Together, these advances could support tailored treatment strategies and ultimately reduce long-term disability in MS.
Advanced MRI
Advanced MRI provides pathologically specific measures that can reveal subtle abnormalities in lesions and normal-appearing tissue. Collectively, these techniques show considerable promise for tracking progression and evaluating therapies, but additional acquisition time, specialized analysis, and sensitivity to acquisition parameters limit their current use primarily to research.
Diffusion imaging assesses microstructure by measuring water mobility. Diffusion tensor imaging (DTI) metrics like fractional anisotropy (FA), radial diffusivity (RD), and axial diffusivity (Figure 4(a)) reflect changes to myelin, axons, and fiber coherence, 52 but lack specificity, particularly to axonal pathology. 53 These measures can differentiate MS from conditions like neuromyelitis optica spectrum disorder. 54 Advanced diffusion models—including neurite orientation dispersion and density imaging, spherical mean technique, and diffusion basis spectrum imaging—may offer greater microstructural specificity. 55 While diffusion imaging is widely available, its sensitivity to scanning parameters, post-processing, and model complexity can hinder reproducibility and cross-site comparability. 56

Advanced MRI techniques for assessing spinal cord pathology in multiple sclerosis. Illustration summarizing five complementary categories of advanced spinal cord MRI. (a) Diffusion tensor imaging (DTI): The highly anisotropic architecture of spinal white matter can be exploited using DTI, enabling visualization of tract integrity and quantitative indices such as fractional anisotropy (FA), axial diffusivity (AD), and radial diffusivity (RD), which reflect axonal and myelin microstructure. (DOI: https://doi.org/10.1016/j.mri.2024.03.005.) (b) Magnetization transfer imaging (MTI): By probing exchange between macromolecular-bound and free water pools, MTR and more advanced measures (MTsat, qMT) provide semi-quantitative measures of myelin and axonal density. (DOI: https://doi.org/10.1093/braincomms/fcae395.) (c) Myelin water imaging (MWI): Multi-echo T₂-based approaches isolate the short-T₂ myelin-associated water signal to estimate the myelin water fraction (MWF), a quantitative marker of myelin content. Shown are representative MWF maps demonstrating gray–white matter differentiation (DOI: https://doi.org/10.1038/s41598-020-80585-7). (d) Magnetic resonance spectroscopy (MRS): Single-voxel ^1H-MRS of the cervical cord quantifies metabolites such as N-acetylaspartate (NAA), choline (Cho), creatine (Cr), and myo-inositol (mI), providing biochemical markers of neuronal integrity, membrane turnover, and gliosis (DOI: https://doi.org/10.3174/ajnr.A3342). (e) Resting-state functional MRI (rs-fMRI): BOLD-based functional connectivity mapping reveals synchronized activity between dorsal (sensory) and ventral (motor) gray-matter horns. In MS, local connectivity alterations are associated with lesion burden and compensatory reorganization (DOI: https://doi.org/10.1093/brain/awy083). Together, these modalities provide complementary microstructural, biochemical, and functional information that extends beyond conventional MRI, enhancing detection of occult pathology and supporting quantitative monitoring of disease progression in multiple sclerosis.
Magnetization transfer (MT) imaging infers microstructural properties by measuring interactions between macromolecular-bound and free water protons. Standard MT and advanced variants like MTsat, quantitative MT (qMT), and inhomogeneous MT (ihMT) provide metrics sensitive to myelin, axons, and inflammation57 –59 (Figure 4(b)). Standard MT is widely available, relatively fast to acquire, and analytically accessible; however, metrics reflect multiple biological processes and require calibration for cross-site consistency due to technical differences between scanners. ihMT offers improved sensitivity over conventional MT in detecting MS spinal cord damage. 60 Improving reproducibility of MT-related techniques will help facilitate longitudinal evaluation in individual patients.
Magnetic resonance spectroscopy (MRS) quantifies metabolites, including N-acetylaspartate (NAA), choline, creatine, glutamate, and myo-inositol, which reflect neuroaxonal integrity, membrane turnover, demyelination, and gliosis 61 (Figure 4(c)). Spinal cord MRS studies are limited but demonstrate clinical relevance—for instance, lower spinal cord NAA is associated with greater disability. 62 Highly specific and increasingly standardized MRS has poor spatial resolution and often relies on metabolite ratios, complicating interpretation. In practice, spinal cord MRS remains technically demanding and is currently used only in a limited number of specialized research settings.
Resting-state fMRI (rs-fMRI) measures spontaneous BOLD signal fluctuations to assess functional connectivity, providing a unique perspective on interactions between spinal cord regions that may be functionally—but not necessarily structurally—connected. In MS, altered dorsal cervical network connectivity is associated with structural damage and may reflect compensation 63 (Figure 4(d)). However, small cord size, susceptibility to motion, and difficulty localizing lesions make rs-fMRI technically challenging. Accordingly, spinal cord fMRI remains largely exploratory at present and is not yet close to routine multicenter or clinical implementation.
Myelin water imaging (MWI) estimates the MR signal from water trapped between myelin bilayers, which has a shorter T2 than intra/extracellular water. Techniques such as multi-echo spin-echo, GRASE, METRICS, ViSTa, and mcDESPOT yield quantitative myelin maps64 –70 (Figure 4(e)). MWI is highly specific for myelin and may also offer insight into inflammation/edema via T₂ distribution profiles. Myelin heterogeneity index, quantifying myelin variability, correlates with EDSS and 9-Hole Peg Test (9HPT) in progressive MS. 71 Although historically limited by long scan times, low resolution, and complex analysis, recent advances are improving MWI practicality.69,70,72
Together, these techniques provide complementary and biologically meaningful information beyond conventional imaging, enabling more precise assessment of spinal cord pathology, helping detect occult changes, and offering quantitative biomarkers for progression and treatment response. 7T imaging offers improved resolution but also comes with technical challenges. Standardizing acquisition and analysis across platforms and sites will be essential to expand their clinical and research utility.
MRI-histology correlation
MRI-histology correlation studies are critical for linking in vivo imaging to tissue pathology. Post-mortem MRI leverages the absence of motion, long scan times, and dedicated radiofrequency coils to achieve high spatial resolution, facilitating direct comparison with histological ground truth. Preclinical work has laid the foundation, using various animal models (e.g. experimental autoimmune encephalomyelitis, lysolecithin, and injury models) to demonstrate correlations between myelin, axons, and inflammatory pathology with MRI measures such as T₂, diffusion imaging, myelin water fraction (MWF), magnetization transfer ratio (MTR), and PET tracers.73 –75 Myelin-sensitive metrics like MWF and RD consistently track with histological myelin content, 76 while emerging approaches like ihMT show promise for added myelin specificity. 77 Human post-mortem studies—including in progressive MS and spinal cord injury—have extended these findings, confirming that measures like MTR, ihMT, MWF, T₁, proton density, and diffusion anisotropy correlate with myelin and axon staining78 –82 (Figure 1 (h)–(n)).
However, MRI-pathology studies must contend with important confounders. Beyond tissue samples being largely from progressive cases, post-mortem interval, temperature, and formalin fixation all influence relaxation properties and MRI metrics. 83 Histological artifacts—such as tissue tearing, staining inconsistencies, and deformation—complicate registration and interpretation. Rigorous protocols and awareness of these limitations are essential for reliable conclusions.
Overall, while many MRI measures reflect underlying pathology, their interpretation is nuanced and context-dependent. The spinal cord remains underexplored compared with the brain, presenting an important opportunity for future MRI-pathology research. Growing interest, shared data sets, and community resources (e.g. sci-biobank.org) offer a strong foundation for continued progress. A summary of major spinal cord MRI biomarkers, including their relative pathological sensitivity/specificity, key limitations, and readiness for clinical trials and clinical practice, is provided in Table 1.
Summary of major MRI biomarkers for spinal cord involvement in multiple sclerosis, including relative pathological sensitivity/specificity, key limitations, and readiness for use in clinical trials and clinical practice.
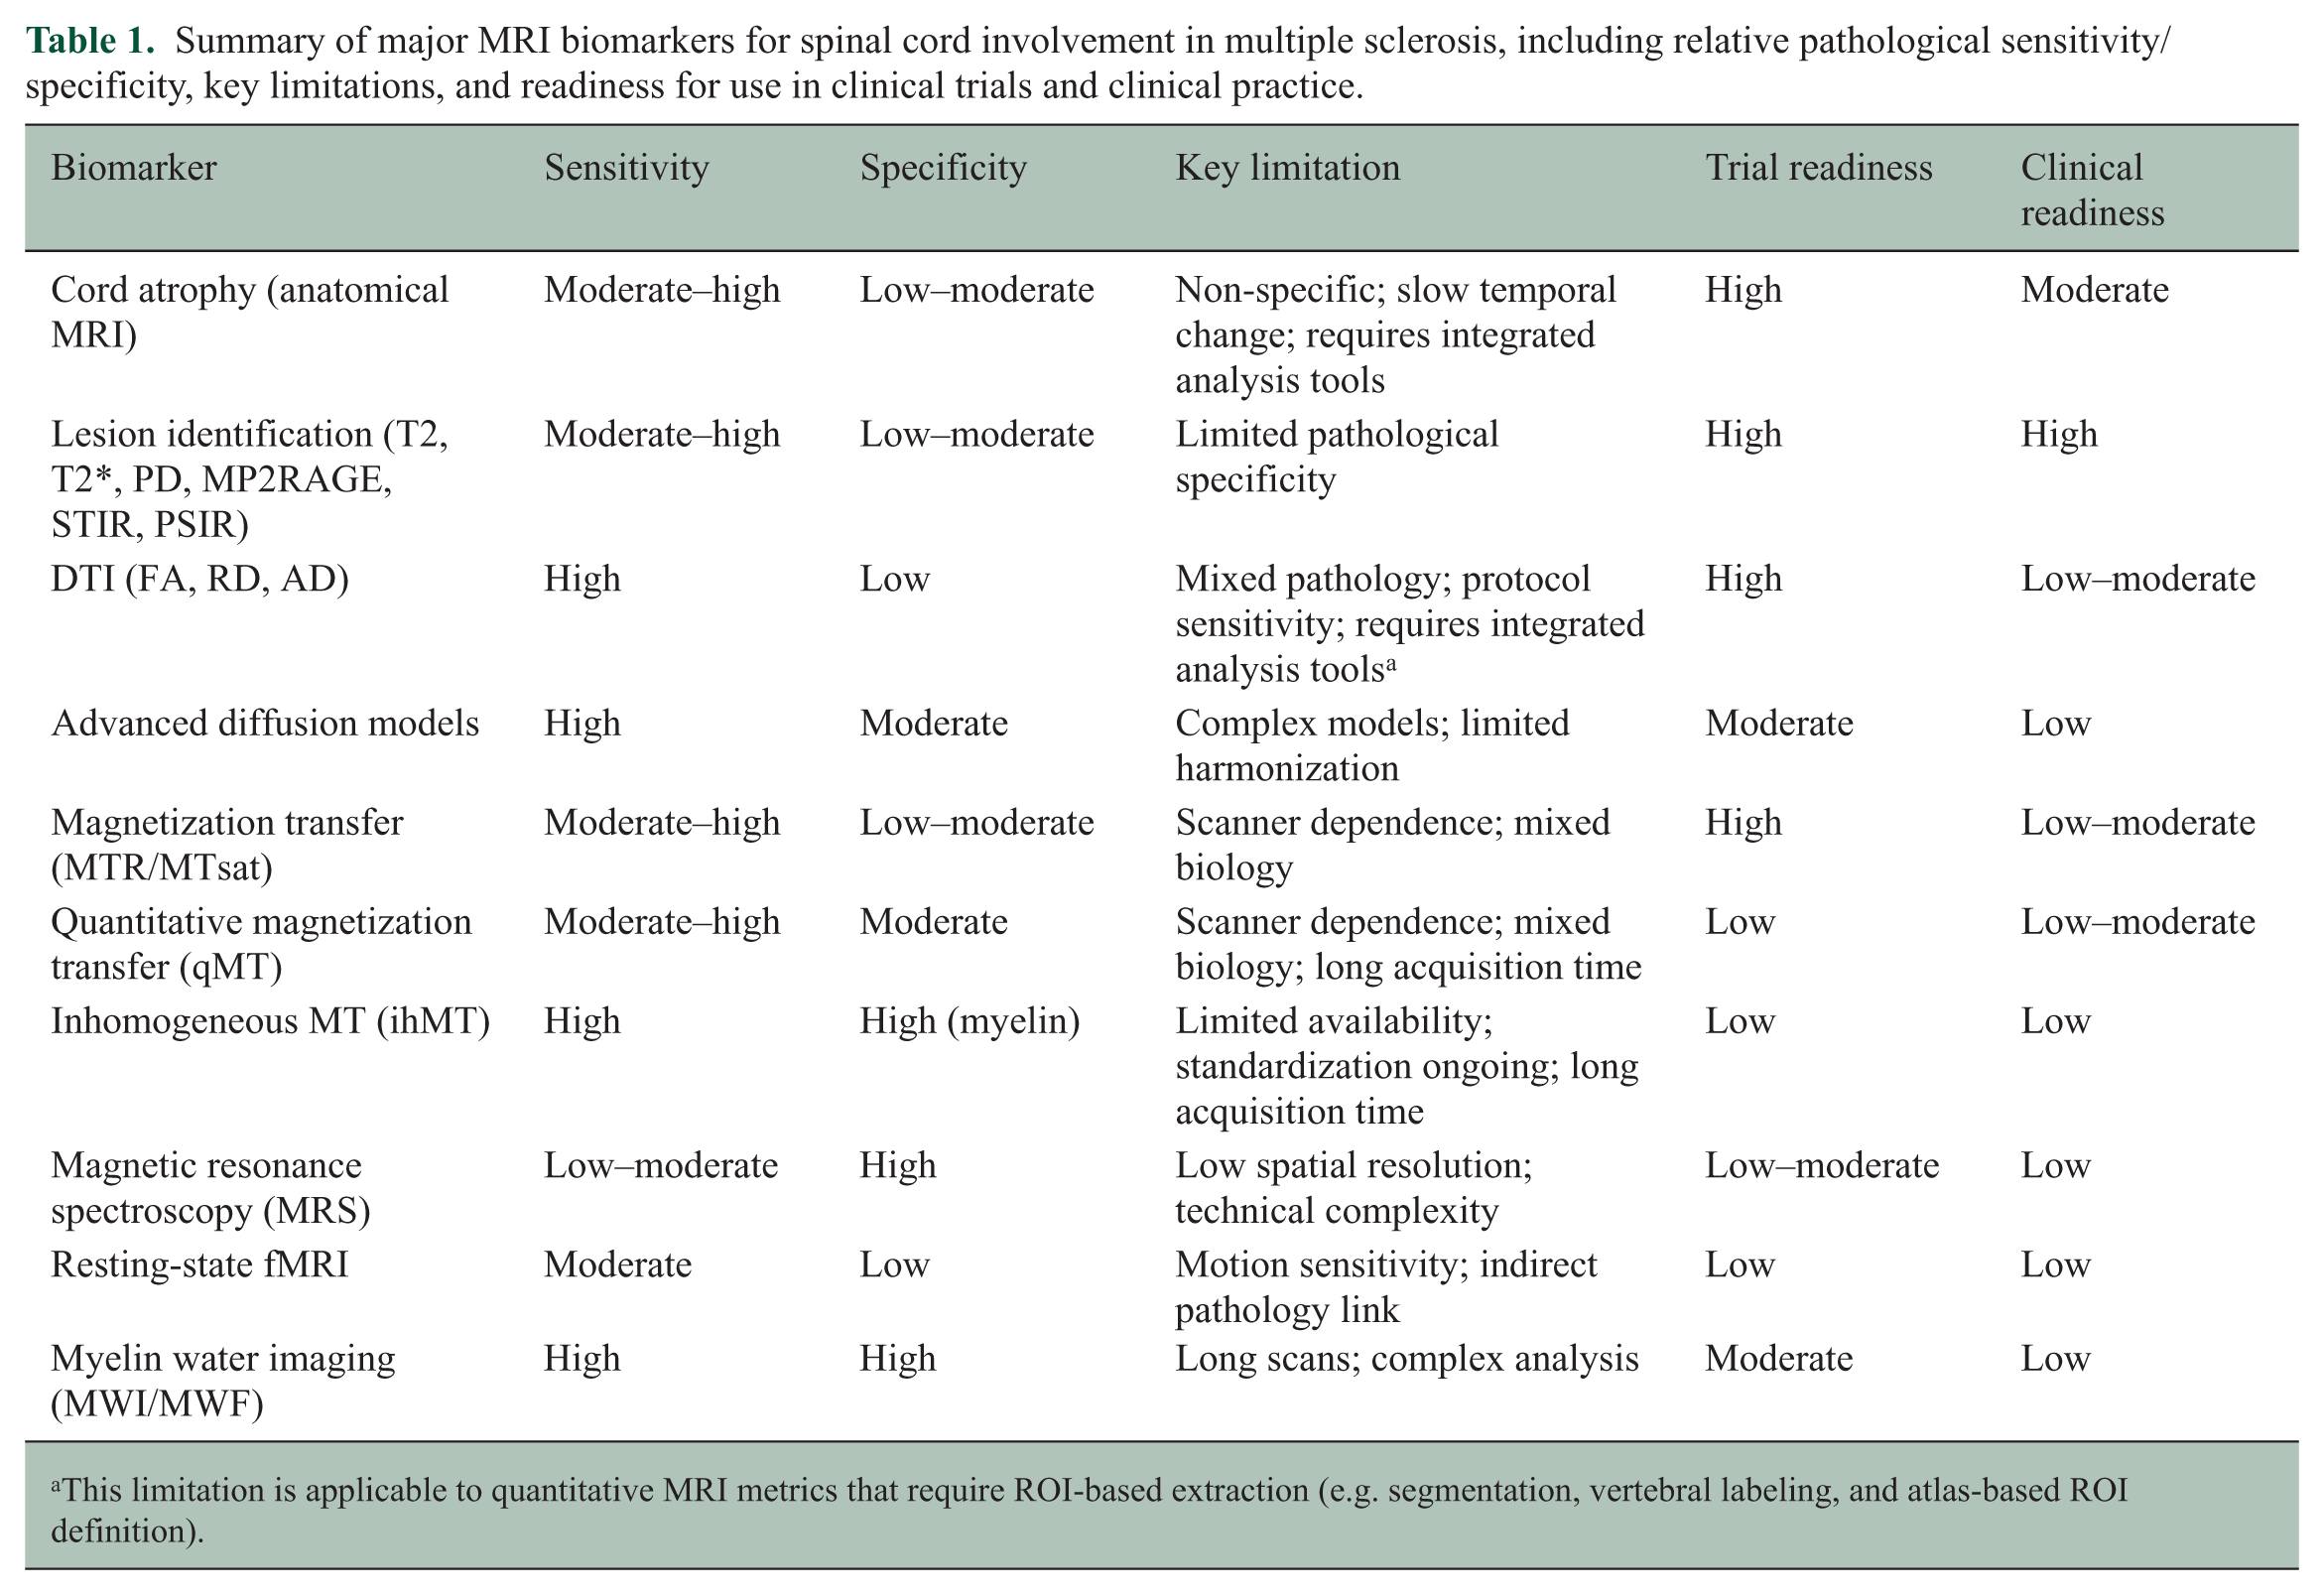
This limitation is applicable to quantitative MRI metrics that require ROI-based extraction (e.g. segmentation, vertebral labeling, and atlas-based ROI definition).
Processing pipelines and analysis methods
Quantifying MRI biomarkers using processing pipelines
The MRI techniques described in the previous sections require complex processing pipelines to yield quantitative metrics. Morphometric analysis facilitates segmentation of the whole cord, gray matter (GM), and white matter (WM), allowing calculation of cross-sectional area and tracking of subtle and tissue-specific atrophy—a key marker of neurodegeneration. Microstructural metrics reflect the microscopic integrity of spinal cord tissue, serving as surrogate markers of myelin (e.g. MTR and MWF) and axons (e.g. diffusion metrics from DTI and advanced models). Functional pipelines process resting-state and task-based fMRI data to assess network connectivity or task-based activation, providing insights into functional integrity and reorganization. Lesion analysis incorporates tools for segmenting MS lesions, characterizing their microstructure using qMRI metrics, tracking longitudinal changes, and performing atlas-based localization within specific tracts (Figure 5).
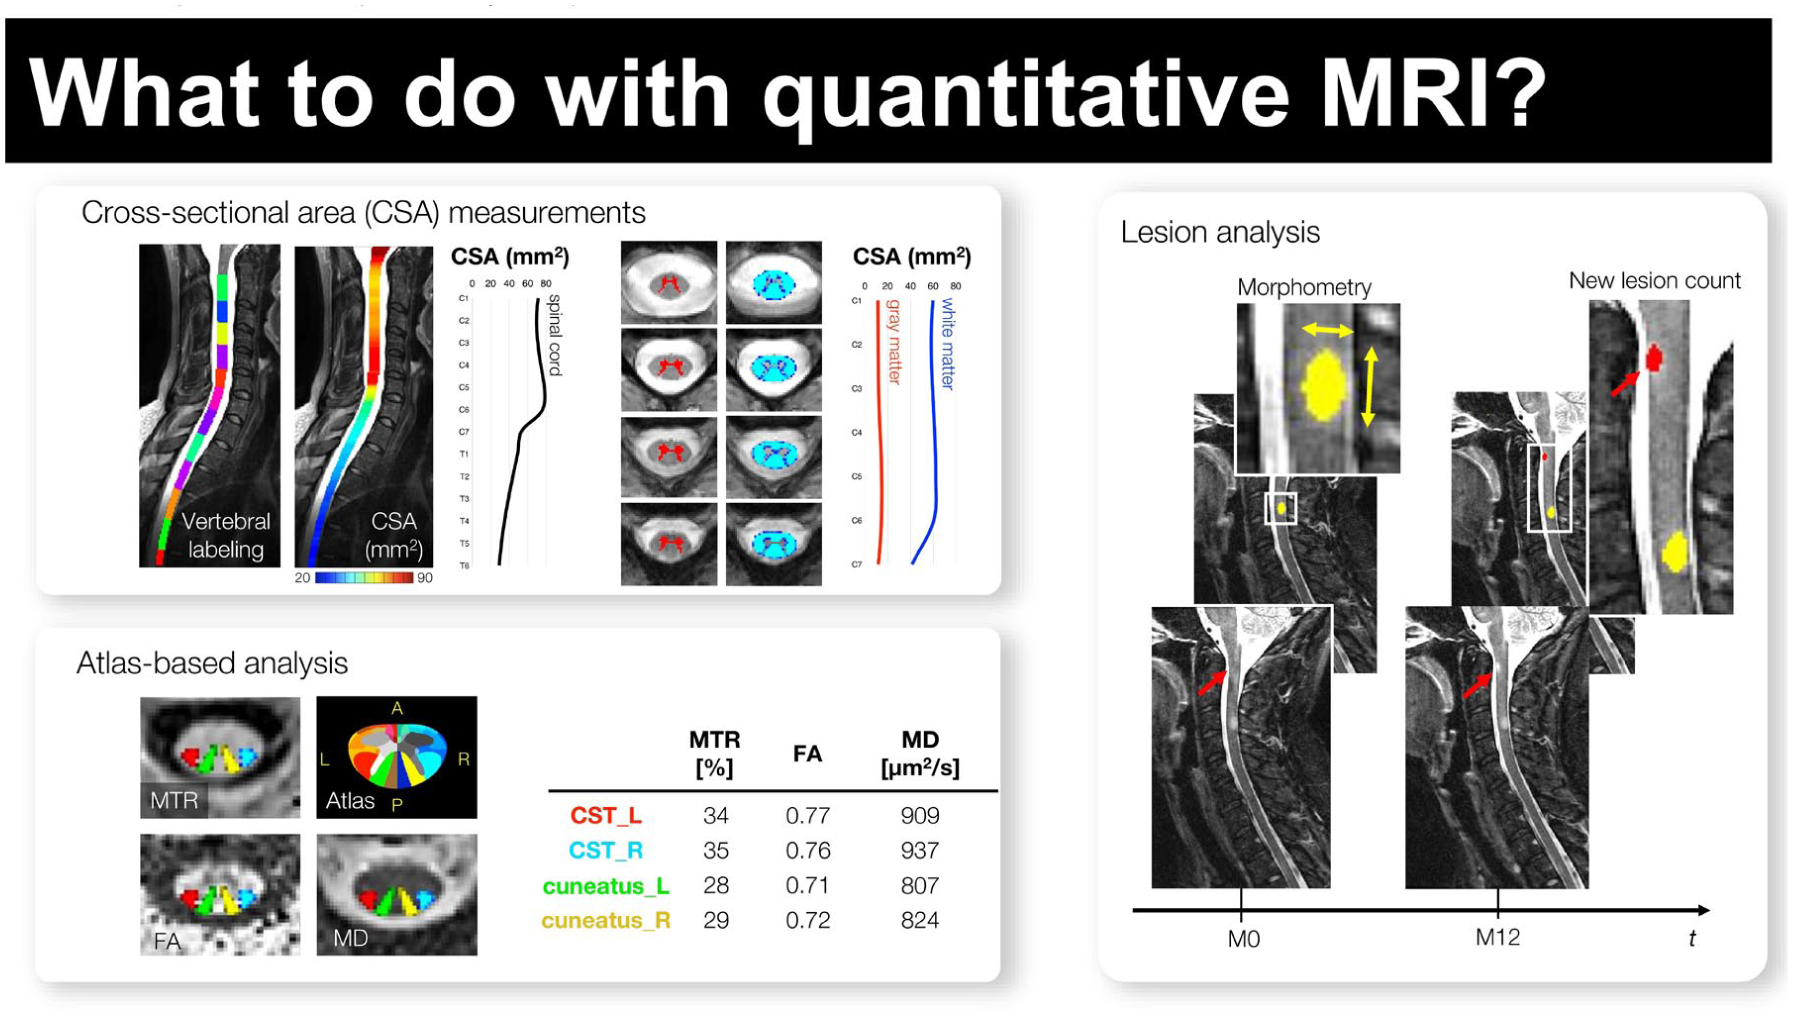
Quantitative spinal cord MRI processing for assessing neurodegeneration and lesion pathology in multiple sclerosis. (Top-Left) Cross-sectional area (CSA) measurements. Longitudinal T1/T2-weighted images are first aligned to the spinal axis, and vertebral levels are automatically identified. CSA is computed along the cord and can be extracted globally or separately within white and gray matter after tissue segmentation. These metrics provide sensitive markers of cord atrophy over time. (Bottom-left) Atlas-based microstructure analysis. After registration to a spinal cord template, quantitative parametric maps—including magnetization transfer ratio (MTR), fractional anisotropy (FA), and mean diffusivity (MD)—are sampled within anatomical tracts such as the corticospinal tracts (CSTs) and cuneatus fasciculi. This approach enables tract-specific characterization of microstructural injury. (Right) Lesion morphometry and longitudinal lesion tracking. Focal MS lesions are segmented to extract morphometric descriptors (e.g. volume, shape, and axial/longitudinal extents). Serial scans allow automated detection of new or enlarging lesions, supporting objective assessment of inflammatory activity and disease progression.
Analyzing spinal cord MRI data: challenges and tools
Spinal cord MRI analysis poses unique challenges. The cord’s small size, complex geometry, and susceptibility to physiological motion necessitate tailored approaches for motion and distortion correction, and feature extraction. Standardized coordinate systems or templates are needed for spatial normalization, enabling group, and cross-subject comparisons, while probabilistic atlases aid automated segmentation and ROI definitions for metric extraction.
Software packages such as the Spinal Cord Toolbox 84 (https://spinalcordmri.org/software/) provide integrated, validated tools designed for spinal cord MRI processing pipelines and analysis. Recent advances include robust motion correction algorithms,84,85 denoising techniques,86,87 registration methods for aligning data across time points and participants to template space, 88 and establishing normative values for quantitative metrics. 89 In addition, sophisticated diffusion models yield probabilistic atlases for robust metric extraction from specific anatomical regions.82,90,91
Reproducibility and replicability
Reproducibility (same data and analysis code) and replicability (independent data) remain major challenges in neuroimaging92,93—especially in the spinal cord, given numerous technical challenges including variations in acquisition and processing, manual analyses, and the inherent difficulty of analyzing small, artifact-prone structures. Improving reproducibility requires standardized protocols, validated and publicly available software, transparent reporting and quality control, sharing of processing/preprocessing scripts, collaborative initiatives to establish benchmarks and best practices, and harmonization efforts to enhance reproducibility and comparability across studies. These steps are critical for building trust in spinal cord MRI and are necessary for clinical translation.
Conclusion
Spinal cord imaging is essential for capturing the full pathological and clinical spectrum of MS, yet remains underused in routine practice, clinical trials, and even research—largely due to technical challenges. Advances in acquisition, processing, and validation have improved our ability to detect lesions, measure atrophy, and interpret microstructural and functional changes. Histopathological studies confirm that spinal cord damage is widespread and clinically relevant, and that advanced MRI measures reflect demyelination, inflammation, and neurodegeneration.
At present, clinicians and trialists can reasonably implement conventional spinal cord MRI to improve diagnostic assessment, refine prognostic evaluation, and expand outcome measures in selected clinical trials, particularly where spinal cord involvement is clinically relevant. In contrast, most advanced quantitative spinal cord MRI methods remain primarily research tools, with broader implementation depending on further standardization, validation, automation, and multicenter harmonization. Standardized acquisition protocols, reproducible analysis pipelines, and validated biomarkers across sites and studies are essential. Importantly, spinal cord imaging should be integrated into clinical trials—not only to capture treatment effects more fully but also to enable targeted strategies for progressive disease. Near-term efforts should focus on consistent incorporation of conventional spinal cord MRI into diagnosis, prognosis, and trial design, while longer-term efforts should prioritize validation and harmonization of advanced quantitative biomarkers. With these advances, spinal cord imaging can move from an underused adjunct to a more broadly integrated component of MS care, research, and therapeutic development, ultimately leading to better outcomes for people with MS.
Footnotes
Acknowledgements
The authors thank Govind Nair for his contributions in organizing the 2025 NAIMS workshop. They also wish to acknowledge ACTRIMS and the significant contribution of staff members Karie Krantz, Partner Managing Director, and Sarah Carrillo, Program Manager. Karie’s and Sarah’s work to prepare for and implement the logistics of this workshop was critical to the success of the program.
Declaration of Conflicting Interests
The authors declared the following potential conflicts of interest with respect to the research, authorship, and/or publication of this article: Eva Alonso-Ortiz has no disclosures. Francesca Bagnato has received honoraria from Biogen, EMD Serono, Novartis, and Sanofi. Rohit Bakshi has received speaking honoraria from EMD Serono, advisory board consulting fees from Sanofi, and research support from Bristol Myers Squibb, EMD Serono, and Novartis. Erin Beck has no disclosures. Matthew Brier has received consulting honoraria from Genentech, Biogen, Novartis, Bristol Meyer Squibb, TG Therapeutics, Sanofi, and Amgen. Julien Cohen-Adad has no disclosures. Gabriele De Luca is supported by the NIHR Biomedical Research Centre (BRC), Oxford. He has research funding from the Oxford BRC, MRC(UK), National Health and Medical Research Council (NHMRC), UK MS Society, the Oxford-Quinnipiac-Trinity Partnership, Rosetrees Trust, European Charcot Foundation, and the Multiple Sclerosis Research, Treatment, and Education (MSTRE). He has received travel expenses from Bayer Schering, Biogen-Idec, Genzyme, Merck Serono, and Novartis, and honoraria as an invited speaker/panelist for Bayer Schering, Novartis, the MS Academy, American Academy of Neurology, and the Wellcome Trust. He serves on the Editorial Board of Multiple Sclerosis Journal, Continuum, and Frontiers in Neurology. He sits on the Brain Health Advisory Group for the PFA for which he receives no remuneration. Susan Gauthier has received advisory board consulting fees from Novartis and Biogen and research support from Genentech. Cristina Granziera did not receive any personal compensation; yet, USB and RC2NB, as employers of CG, have received the following fees which were used exclusively for research support: (1) advisory board and consultancy fees from Actelion, Genzyme-Sanofi, Novartis, GeNeuro, Biogen, Merck, and Hoffmann La Roche; (2) speaker fees from Genzyme-Sanofi, Novartis, GeNeuro, Biogen, Merck, and Hoffmann La Roche; (3) research support from Siemens, GeNeuro, Biogen, Novartis, and Hoffmann La Roche. Chris Hemond has no disclosures. Roland Henry reports consulting for Novartis, Roche, and Sanofi and research funding from Roche/Genentech. B. Mark Keegan reports consulting EMD Serono: personal compensation, Moderna, Tr1X Inc.: compensation to Mayo Clinic, book royalties Mayo Clinic Cases in Neuroimmunology, personal compensation: Oxford University Press. Anne Kerbrat has no disclosures. Shannon Kolind has received advisory board consulting fees from AbbVie and research support from Roche and Biogen. Stephen Krieger reports consulting or advisory work with Biogen, Cycle, EMD Serono, Genentech, MedRX, Novartis, and TG Therapeutics, and non-promotional speaking with Biogen, EMD Serono, Genentech, and TG. Grant and research support from Biogen, BMS, Novartis, and Sanofi. Eric C Klawiter has received consulting fees from EMD Serono, Genentech, INmune Bio, Myrobalan Therapeutics, OM1, and TG Therapeutics and received research funds from AbbVie, Biogen, and Genentech. Cornelia Laule has no disclosures. David K.B. Li is Emeritus Director of the UBC MS/MRI Research Group, which has received grant support for investigator-initiated studies from Genzyme and Roche. He has given lectures, supported by non-restricted education grants from the Academy of Health Care Learning, Biogen, Novartis, Consortium of MS Centers, and Sanofi Genzyme. Caterina Mainero has no disclosures. Kristin O’Grady has no disclosures. Jiwon Oh has received compensation for consulting/speaking from Amgen, Biogen-Idec, EMD Serono, Novartis, Roche, and Sanofi Genzyme, and research funding from Biogen-Idec and Roche. Seth Smith has no disclosures. Kurt G Schilling has no disclosures. Russell Shinohara has received consulting income from Octave Bioscience and compensation for scientific reviewing from the American Medical Association. Dinesh Sivakolundu has no disclosures. Ceren Tozlu has no disclosures. Irene Vavasour has no disclosures. Atlee A Witt has no disclosures.
Funding
The authors received no financial support for the research, authorship, and/or publication of this article.
ORCID iDs
Data availability statement
Data sharing is not applicable to this article as no data sets were generated or analyzed during this study.