
Abstract
The diversity of architectural forms, together with the materials used, fundamentally determines how sound behaves in enclosed spaces. While previous research has predominantly focused on the acoustics of complex, historically or functionally specific buildings, it has given limited attention to the elementary volumetric forms that constitute the basis of architectural design. This study investigates the acoustic behavior of 20 generative geometries, ranging from basic primitives to long rooms, coupled spaces, and sequential volumes, that common architectural typologies. Room impulse responses are examined in a controlled setup through both ray-tracing simulations and the diffusion equation model (DEM). T30 values and relative sound pressure level (SPL) differences are systematically compared, and DEM is further employed to visualize time-dependent energy flow, revealing how form itself governs patterns of sound distribution. Material variations are introduced to assess the impact of inhomogeneous absorption, while a pilot field measurement in a corridor validates long-room acoustical predictions. By re-examining sound propagation in simplified forms, this research establishes the acoustic potential of architectural form as a primary design parameter, offering a framework that bridges methodological innovation with design practice in the early stages of acoustically informed architecture.
Keywords
Introduction
Architecture takes many forms, and the materiality of these forms underpins sound behavior within enclosed spaces. This research is motivated by curiosity to investigate the elementary architectural forms employed throughout history, ranging from primitive shelters to monumental sacred spaces. Over time, the complexity of form has grown in parallel with advancements in engineering technology. Ancient hillside theaters gave way to freestanding structures supported by arches and colonnades, later evolving into vaults and domes as sheltering elements. The use of different forms has been driven by various design intentions—such as achieving structural stability, spanning long distances, and accommodating larger audiences within a single space. Yet each form, with its unique volume, produces a distinct acoustic field. Acoustically critical spaces vary widely in typology and scale, from auditoriums 1 and classrooms 2 to airport terminals and sports arenas.3,4 Acoustic comfort parameters are therefore essential considerations in the early phases of design.
In the scientific literature, numerous studies have analyzed complex geometries, including worship spaces such as churches, basilicas, cathedrals,5–8 mosques, 9 and synagogues. 10 Performance venues—including opera houses,11–13 concert halls, and drama theaters—have also been extensively examined. However, from an acoustic perspective, there is little research addressing the contributions of basic volumetric components to the sound fields of complex structures. One objective of this study is therefore to take a step back and re-examine the acoustic implications—or potential—of elementary volumetric entities, from single primitive geometries to sequential and coupled spaces that constitute parts of real architectural environments.
Analyzing room acoustics across different forms and functions requires reliable tools. Since the 1960s, research and practice in architectural acoustics have expanded significantly, driven by the shift from physical scale models to computer-based simulations. A wide range of room acoustics modeling approaches exists, broadly categorized into wave-based and geometrical acoustics (GA) methods. 14 Although wave-based techniques provide the highest accuracy, they are computationally demanding at mid-to-high frequencies and particularly challenging to apply to large or complex spaces. In contrast, GA approximates sound waves as rays, neglecting wave phenomena, which makes it less accurate but computationally more practical. Among GA methods, ray-tracing and the image-source technique have been widely used for over 50 years. 15 The image-source method offers high accuracy in estimating early reflections and is often used for real-time auralizations, 16 though it becomes cumbersome for higher-order reflections.17,18 Commercial room acoustics software typically employs hybrid approaches that combine ray tracing with image-source modeling. 19 A recent study proposed a hybrid model that combines the image-source method and the acoustic diffusion equation for high frequencies, supplemented by a wave-based method for low frequencies. 20
Different methods carry distinct strengths and weaknesses. A comprehensive review of GA methods is provided by Savioja and Svensson. 17 Diffusion equation modeling (DEM) of sound energy decay is relatively recent compared to ray tracing, yet it has been successfully applied to monumental spaces and coupled volumes.9,21–24 One advantage of DEM is its use of a volumetric grid (meshed domain), which enables the propagation of sound energy to be traced in time-dependent solutions. Despite its potential, many questions remain about efficiency and the benefits for each purpose. This study, therefore, compares DEM, a relatively new approach, with the more established ray-tracing method. While several studies have employed both techniques to analyze complex venues using field data,21,23 this research applies them in a more controlled environment.
Specifically, sound propagation is examined within 20 volumetric entities, grouped into basic primitives, multi-primitives, long rooms, coupled spaces, and sequential spaces. These enclosures are designed to represent simplified architectural spaces or combinations of them, some of which suggest archetypal building typologies. Simulated room impulse responses (RIRs) are analyzed for specific source–receiver configurations, with comparisons made between fundamental acoustic parameters such as T30 and relative sound pressure levels (SPLs). Material variations are introduced on selected surfaces to evaluate the effects of inhomogeneous absorption. Furthermore, a pilot field measurement of a long corridor is included to expand the discussion of DEM applications in elongated spaces. A linear law is exploited as a function of the distance by systematically increasing the distance of the receiver from the source.
In brief, this study addresses a significant gap in architectural acoustics literature by shifting the focus from complex, historically or functionally specific spaces -such as churches, concert halls, or mosques- to the elementary volumetric forms and their combinations that constitute the building blocks of architectural design. While prior research has extensively examined real-world spaces with intricate geometries, little attention has been given to how fundamental primitives, long rooms, coupled volumes, and sequential spaces independently shape sound propagation. By systematically analyzing 20 generative forms of controlled volume and complexity using both ray tracing and diffusion equation modeling (DEM), this research reestablishes the acoustic potential of architectural form as a primary design parameter. The findings not only provide a comparative methodological evaluation of DEM and ray-tracing in simplified architectural geometries, but also reveal form-dependent acoustic behaviors -such as the long reverberation in domical structures, the attenuation challenges of long rooms, and the sound energy flow across sequential and coupled spaces -that have direct implications for early-stage design decisions. From an architectural perspective, this work provides a foundational framework that enables designers to understand and predict the acoustic consequences of form itself, independent of stylistic, functional, or material complexities, thereby enriching design practice with acoustically informed strategies at their most elemental level. The main objectives of this research can be summarized as follows:
To re-examine architectural form as a primary acoustic parameter by shifting the focus of architectural acoustics from complex, function-specific buildings to elementary volumetric forms that constitute the building blocks of architecture.
To compare diffusion equation modeling (DEM) with ray-tracing methods to evaluate the consistency, limitations, and advantages of DEM relative to established ray-tracing simulations across different geometric conditions.
To assess the role of mean-free path versus form, as well as material distributions and their effect on energy decay rates and sound-field uniformity.
To investigate sound behavior in long enclosures using field validation and to examine the need for distance-dependent diffusion coefficients in long rooms.
To visualize time-dependent sound energy flow by exploiting DEM’s ability to compute energy-flow vectors within different architectural forms over time, to support physical interpretation of form-induced acoustic effects.
The paper is structured as follows: Section II outlines the methodologies for generating geometric entities and describes the data collection and analysis techniques, including ray-tracing, DEM, and field measurements. Section III presents the results, organized around three objectives: (i) comparing DEM and ray-tracing across geometric domains of varying complexity, (ii) evaluating sound propagation patterns in long rooms with support from field data, and (iii) analyzing the influence of form, volume, and material distribution on sound propagation. Concluding remarks are provided in Section IV.
Methodology
This chapter presents the methodological steps of the research. The first section introduces the generated forms, which serve as physical domains for comparing room acoustics simulation methods. The second section presents ray-tracing, and the third chapter provides the development of DEM and applied equations. The final section of this chapter presents a field test of a long corridor, with the results later used to validate simulations and to discuss long rooms.
Generative geometric forms
The geometric domains tested by ray-tracing and DEM are shown in Figure 1, with their physical parameters, mean-free paths (λ), and diffusion coefficients listed in Table 1. The forms, generated from cubes, prisms, domes, and ellipsoids—and later combined for added complexity—are organized into four groups. Group 1 includes basic primitives. Group 2 contains multi-primitives, larger and more complex volumes that represent possible real-world environments. These include multi-domed prisms (D11, D12) that reflect simplified worship architectures such as mosques, churches, and synagogues, as well as multi-domed Ottoman structures such as caravansaries and madrasas. Cave-like geometries (D5, D9) relate to archaeoacoustic studies of habitable rock-cut spaces.46,47 Inverse domes (D7, D13, D14) are used to test concave versus convex behavior in sound decay, which is further analyzed using DEM energy-flow vectors in Sec. IIID. Group 3 includes long rooms, analogous to metro stations,25,26 which are known to challenge theoretical room-acoustics predictions; additional discussion appears in Sec. IIC.
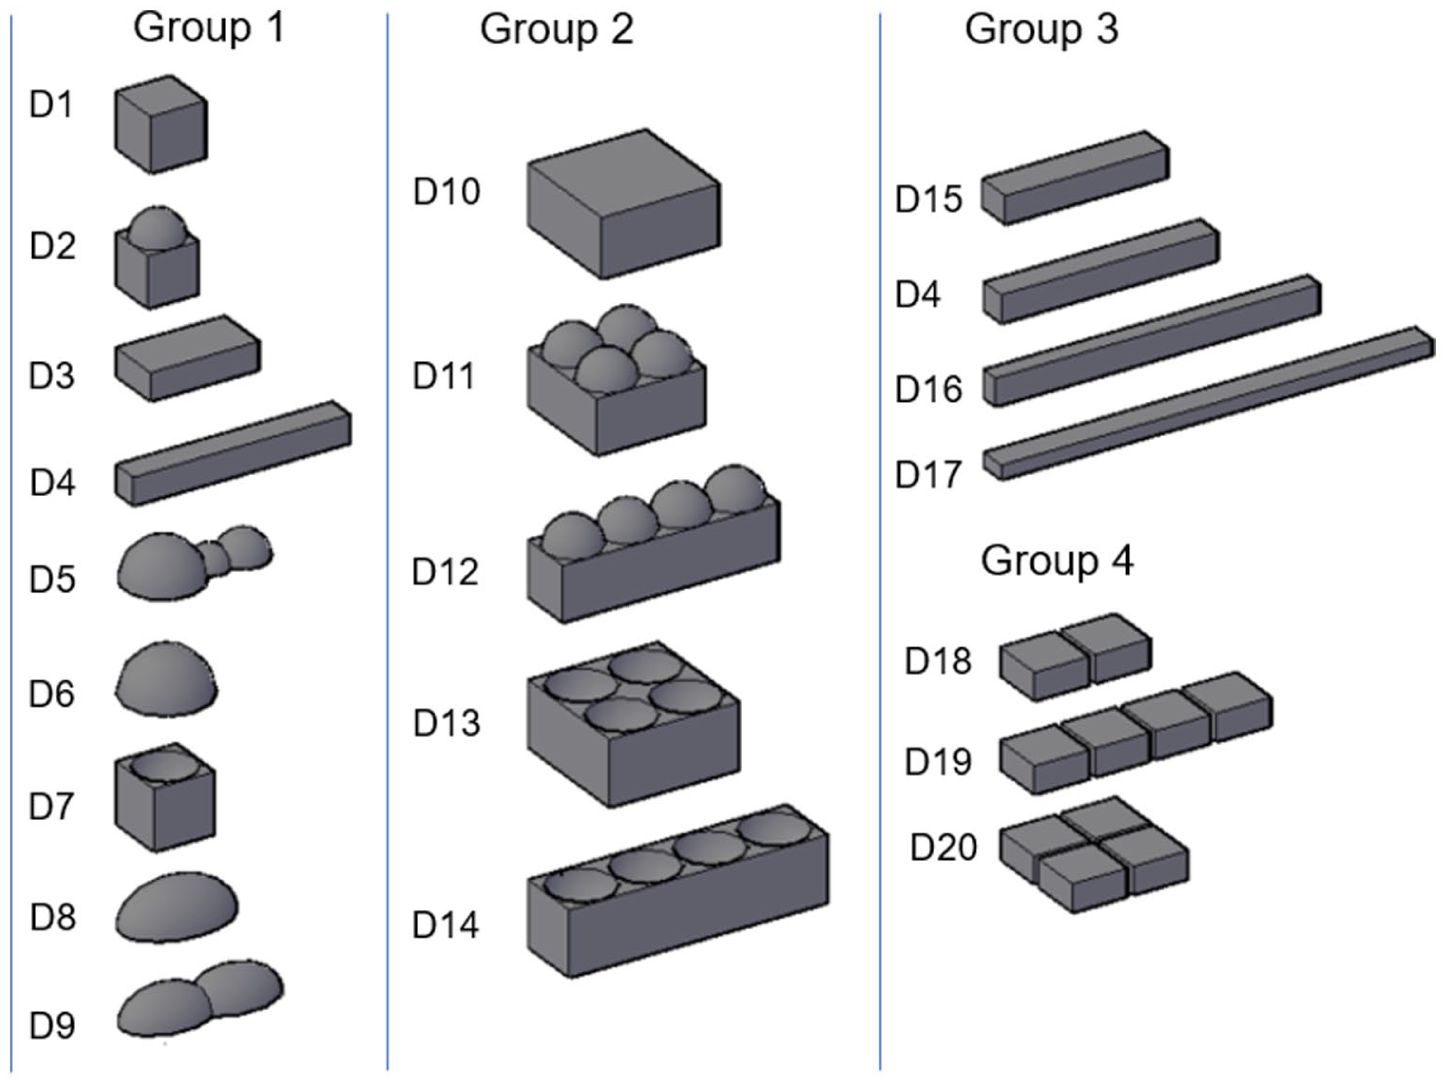
Geometric entities are studied under four main groups: Group 1 (basic primitives), Group 2 (multi-primitives), Group 3 (long rooms), and Group 4 (coupled and sequential spaces).
Physical properties of assessed geometric entities (D01–D20), total surface area, floor area to total area ratio, mean-free-path (λ), and diffusion coefficient.
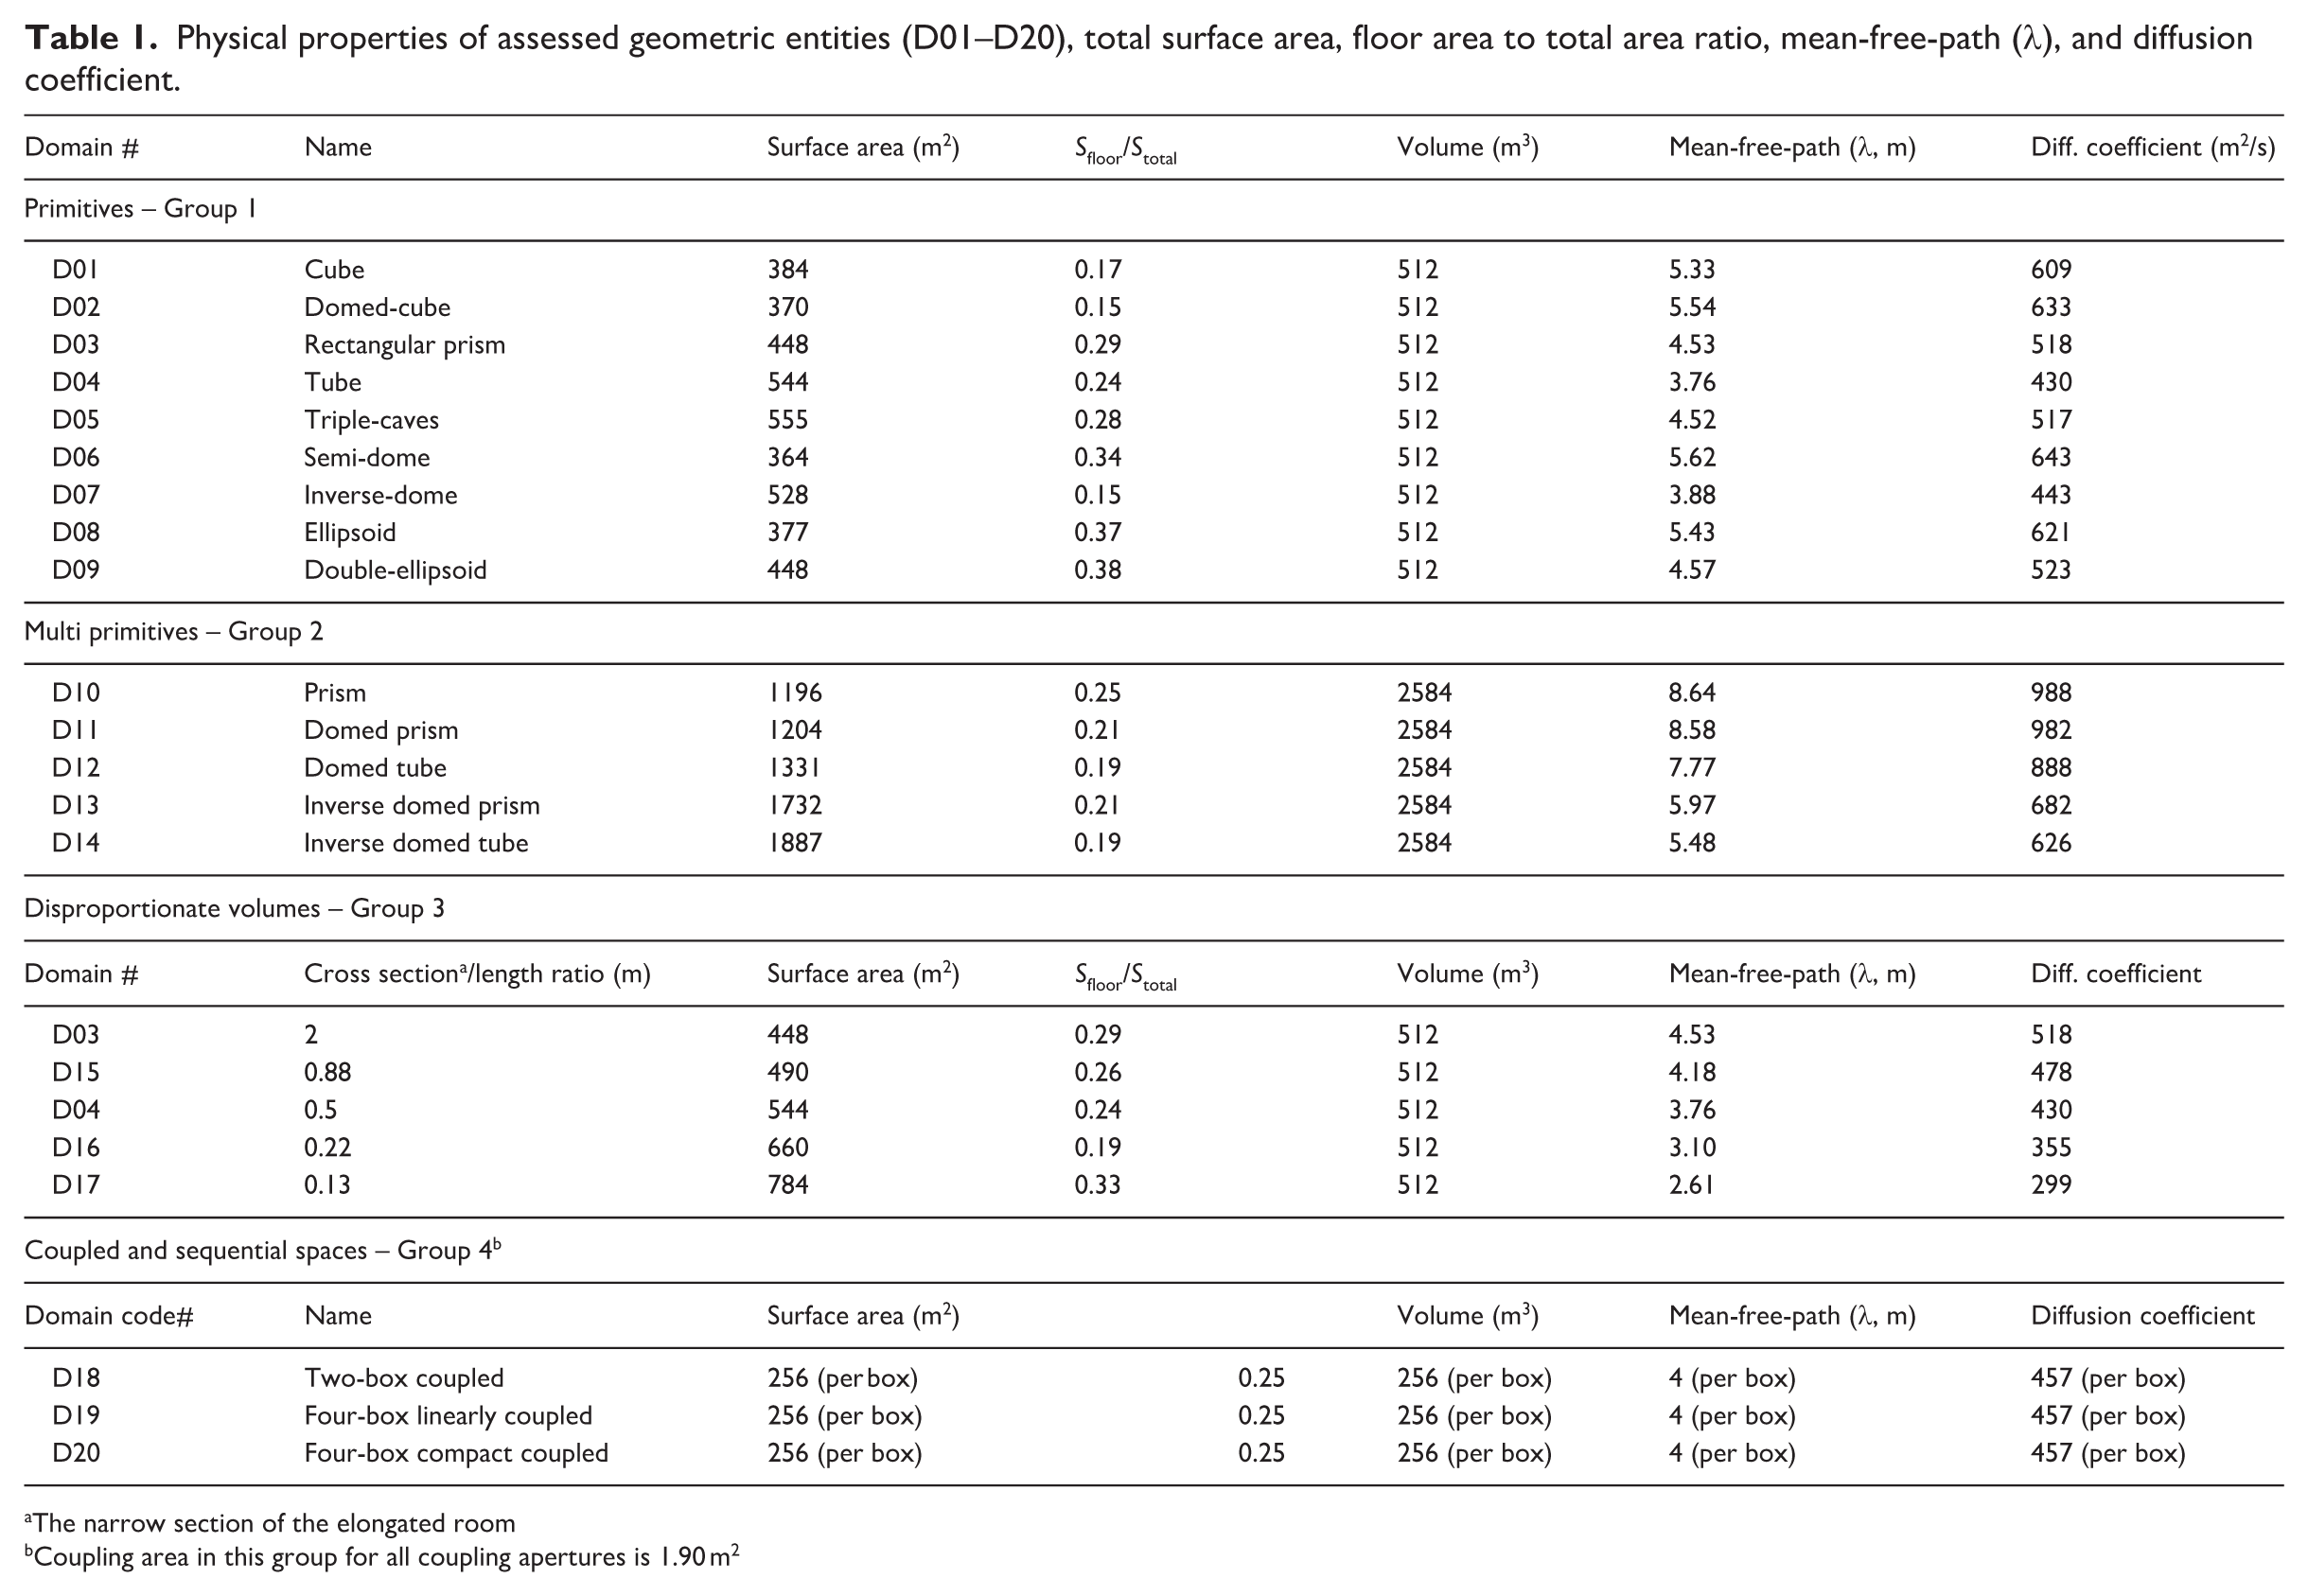
The narrow section of the elongated room
Coupling area in this group for all coupling apertures is 1.90 m2
Group 4 comprises coupled and sequential spaces that reflect real-world design strategies, such as those found in the Dallas Meyerson Symphony Hall, KKL Luzern, and the Heydar Aliyev Center Auditorium, 27 or in museum-like linear gallery sequences. 28 These cases examine how exponential decay parameters evolve as the receiver moves through connected volumes. To balance computational speed with comparative reliability, the domains -while small-typologically represent many architectural forms (e.g. cubes as studios, cube-dome combinations as worship spaces, prisms as corridors). A prior pilot study used fewer primitives with non-comparable volumes 29 ; this study systematically increases the number of domains and standardizes volumes within groups to isolate geometric effects on sound distribution and decay. Long rooms and sequential spaces, widely studied for their acoustic complexity,25,30,31 are therefore included and analyzed in Section IIIB and Sec. IIIC.
Ray-tracing simulations
In the first step of the computations, this study uses ODEON v17.12 as a hybrid room acoustics simulation software. ODEON simulates sound propagation by combining customized versions of ray-tracing and the image source method. It identifies different types of reflections, such as early versus late and specular versus scattered, and based on this classification, applies various methods. 19 In this study, acoustic models are generated for twenty domains. Considering the comparatively small sizes of the domains, one source and at most two receivers are located at the same position in the ray-tracing model and in solid models of DEM computation for Groups 1 and 2. The same models, source-receiver locations, and material inputs are used in both ray tracing and DEM. The source and receivers are located centrally within the domains, with a source height of 1.50 m, a receiver height of 1.20 m, and a minimum distance of 2 m between them. In the long rooms of Group 3, the distance from the source to the receiver is systematically increased, and the detailed locations are presented in Sec. IIIC. For coupled primitives (D5, D9) and coupled spaces (D21–D23), one source is in one room, and multiple receivers are in the others, corresponding to the number of rooms. Figure 2 presents the ray-tracing models of twenty geometric entities.
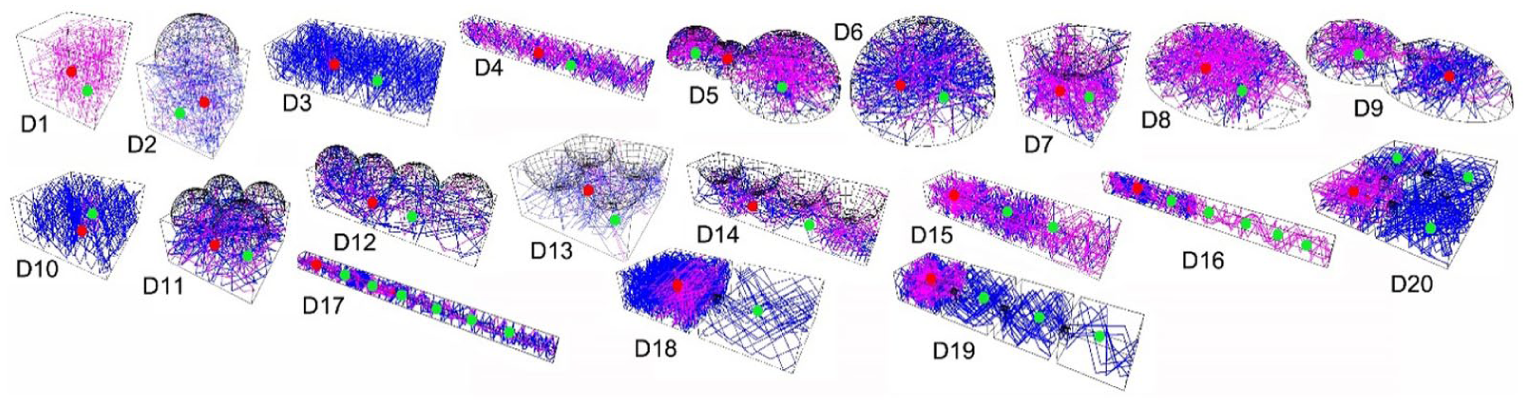
Ray-tracing models of domains D1–D20.
In this study, the maximum reflection order is applied as 10,000. The number of rays is attained in accordance with the volume of the space, and the estimated RTs; thus, the impulse response length should sufficiently cover the decay rate duration. In the precision setting of ODEON, there are recommended values for the number of rays and late rays that are initially used. But then, the late rays are constantly checked for their sufficiency by observing the decay curves. A smooth slope indicates sufficient rays, whereas one with drastic drops could be a sign of too few rays. For instance, in the case of complex geometries, such as coupled spaces, there is a necessity to use a higher number of rays.
Two different absorption states are tested. Initially, an alpha of 0.06 is attained for all surfaces, representing a typical plastered solid surface for 500 Hz. Later, only floor surfaces are replaced with alpha 0.25, representing a typical carpeted surface. 32 It is worth noting that the average absorption remains low, even with carpets. The comparisons are only held for 500 Hz in the scope of this study (and for the sake of the length of content) as a characteristic speech frequency, which is not affected much by the wave properties of sound for given sizes of geometric entities.
Diffusion equation model (DEM)
The development of DEM in room acoustics
The diffusion equation model (DEM) is one of the techniques used in this study to assess generative forms. DEM is comparatively more recent than ray-tracing (and hybrid geometric acoustics models). The transport process governing sound propagation in a reverberant sound field was initially studied by Ollendorff. 33 Picaut et al. 34 proposed a model to describe the local acoustic energy density in rooms with perfectly diffuse reflecting walls, using a physical analogy with the diffusion of particles in a medium containing spherical scattering objects. Before its applications in enclosed rooms, the diffusion equation was first used to predict background noise in urban spaces. 35 Picaut et al. also studied DEM for predicting sound propagation and reverberation in rectangular streets. 36 The numerical implementation of DEM in room acoustics predictions is further developed by Valeau et al. 37 Their results highlighted the potential of this new model for acoustic analysis of various room shapes. Billon et al.38,39 applied the diffusion model to the coupled volume configuration. The diffusion model is also applied to coupled rooms by Xiang et al., 40 who further validate it with acoustical measurements conducted on a scale model of two coupled rooms. Boundary conditions have been proposed for different levels of absorption. 41 Jing and Xiang 42 introduced mixed-boundary conditions, making the diffusion equation applicable in broader room-acoustics conditions. The application of DEM to fitted rooms with obstacles that cause diffusion is first studied by Valeau et al. 43 Foy et al. 44 proposed a modification to the room-acoustic diffusion model to account for varying amounts of wall scattering. Later, Navarro et al. 45 studied the ranges of absorption and scattering coefficient values for which DEM can be reliably applied in sound field analysis. Foy et al. 46 extended the diffusion coefficient by introducing an analytical expression of the diffusion constant as a function of the scattering coefficient. In another study, Sequeira and Cortinez 47 proposed a simplified two-dimensional diffusion model to predict sound level distribution in rooms with simple geometry, thereby reducing computational time. While Sü Gül et al.9,21–23 extended the application of DEM to real spaces with grand volumes and historical significance.
Application of DEM to long rooms
Computations for room acoustics in long enclosures, where the space is significantly longer than its cross-sectional area, are challenging. The particular sound field in long enclosures has been investigated for several decades, and several theoretical formulas have been established. Sound attenuation in actual long enclosures is even more complicated, as seen in metro stations.25,26 Various methods have been proposed for estimating acoustical parameters in long spaces, including wave theory, 30 duct theory, 48 image tracing,49,50 ray tracing, 31 transport equation methods,51,52 and diffusion equation modeling.34,37,53,54 Different models are subject to other limitations. The ray-tracing modeling method is more flexible and suitable for modeling complex spaces with intricate geometry. One of the early studies on ray-tracing simulations of long enclosures 31 has focused on optimizing the number of rays required to achieve sufficient reflection density, particularly along the length of the enclosure. To minimize the computational load, the reverberation time tail-compensation method is employed to compensate for the absence of later reflections.
Navarro and Escolano, 55 with a focus on the diffusion equation model (DEM), outlined different methods of geometrical acoustics, most of which are studied for long spaces as well. Picaut et al. 56 proposed a theoretical model to describe sound propagation in long rooms with diffusely reflecting boundaries. In their study, simple relationships, dependent on the perimeter of the cross-section and the cross-sectional area, are derived to predict sound attenuation and reverberation times in corridors. DEM has been developed further and applied to long rooms by Valeau et al. 37 In this study, RT and EDT are estimated with both diffusion and ray-tracing models for a long and highly reflective enclosure. The RTs for both models have shown a slight increase of about 15% along the length of the room. Additionally, the EDT given by the diffusion models is found to be 15% higher than that estimated by the ray-tracing model, indicating that the early part of the decay is more significantly affected by the room shape.
In another study, Visentin et al.53,54 modeled energetic quantities using the diffusion model and a particle-tracing numerical code in long rooms. When applying diffusion models to long rooms, the primary consideration is the reliability of the theoretical diffusion coefficient. Visentin et al.53,54 observed that the theoretical value of the diffusion coefficient is only valid close to the source in long enclosures. They defined a spatially varying diffusion coefficient for non-homogeneous diffusion. Foy et al. 57 applied the particle path statistics to propose a semi-analytical expression for the diffusion coefficient. As previously discussed, to improve the accuracy of room acoustics computations in long enclosures, further studies, including real-scale field tests, are necessary. Partly relying on Visentin et al.′s53,54 approach, this study further investigates the relationship between the diffusion coefficient and its variance as the distance to the source increases. A linear law y = (ax + b) × d as a function of the source-receiver distance is investigated by a comparative study of field test, ray-tracing, and DEM, the discussion of which is further detailed under Sec. IIIB and Sec. IIIC.
Governing and boundary condition equations
This section presents the governing and boundary equations applied in the solutions of the Group 1, 2, and 4 domains, which include proportionate, coupled, and sequential spaces. The diffusion coefficient presented in this section does not apply to Group 3 domains, specifically, long rooms. One advantage of DEM application in room acoustics is its computational speed in finite element solutions of energy propagation within an enclosed domain. This is primarily because the mean-free path length of the space under consideration mainly dictates the meshing condition in enclosures, regardless of the wavelength. In addition to this, DEM has the potential to trace sound propagation in a time-dependent solution by utilizing energy flow vectors, which is one of its key benefits over ray-tracing. Accordingly, the time-dependent sound energy density w, in a unit time (t) and position (r), in the presence of an omnidirectional sound source, q (r,t), can be estimated by:
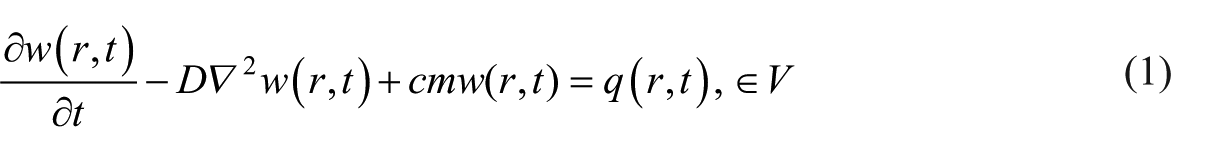
Where D is the diffusion coefficient, which takes into account the room morphology via its mean-free path (D = λ × c/3). λ (mean-free path) = 4 × V/S, where V is the volume of the space and S is the total surface area. The term
Although the choice of absorption term is not critical in this study, given that the overall absorption is low even in carpeted floor scenarios, the modified absorption factor, Ax = 4(1 – α/2), is applied, where α is the absorption coefficient of the specific surface or boundary. Ax is valid for a range of absorption coefficient values attained by different surfaces. 42 The boundary equation is then as follows:
Diffusion equation model equations for coupled spaces include, first, the assignment of MFPs for each coupled volume domain, if the coupling aperture is small, indicating a weak coupling. Second, a specific boundary condition term is assigned to the aperture area, which is the so-called continuous boundary of the coupling aperture, applied in multi-domain solutions, which has to fulfill the following condition 59 :

This represents a continuity boundary condition for interior boundaries at the aperture position rb, where D1 is the diffusion coefficient in the primary room and D2 is the diffusion coefficient for the secondary room. For two rooms with proportionate dimensions, Di = λi c/3, with λ i being the MFP of the individual rooms. In this study, domains D18, D19, and D20 are those where multi-domain MFP values and continuous boundary terms are applied, as listed in Table 1.
Rooted in Fick’s law, the diffusion equation predicts sound energy fluxes more efficiently than existing numerical tools. The approximation of the local particle-density flux J(r,t), as the gradient of the particle density, is the basis of the diffusion equation solution as given in equation (4) 37 .

The energy flow level is then defined as:
The generated solid models of computed geometric entities are meshed for finite element analysis, ensuring that the maximum mesh size of each entity is smaller than the mean-free path of individual domains. Because it relies on the mean-free path for meshing limits, DEM’s computational speed is significantly higher than that of other numerical tools, especially for complex geometries. Meshed models and meshing properties of selected examples of studied geometric entities from different groups are presented in Figure 3.
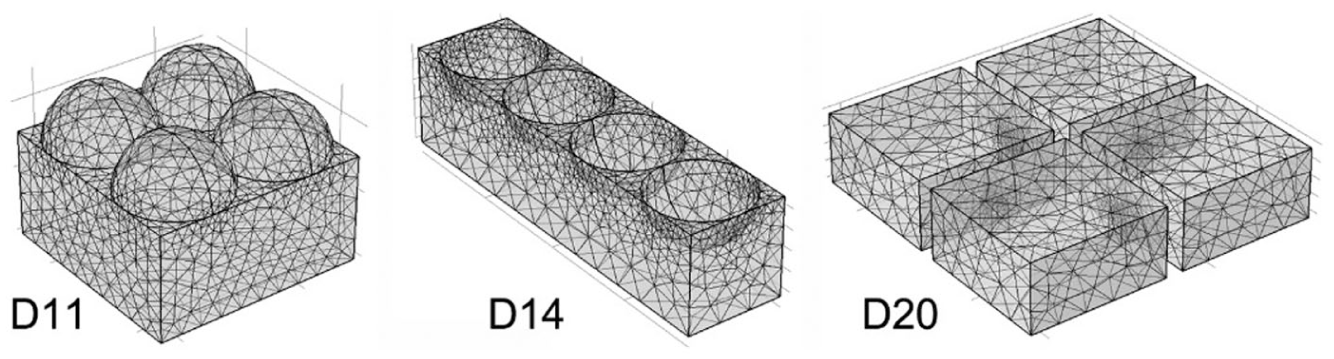
DEM mesh models of selected examples: D11 (mesh size; min: 0.29 m, max: 1.60 m), D14 (mesh size; min: 0.69 m, max: 3.83 m), D20 (mesh size; min: 0.30 m, max: 1.70 m).
It should also be noted that the diffusion equation model is considered valid after at least two or three mean-free path times. 40 For example, in the case of D01 with a mean free length of 5.33 m, the data points are included after 0.046 s. As the volume decreases, the mean free time accordingly decreases. The analysis excluded this very early portion of the impulse response, which has no significant effect on estimated decay rates, even for T10 and EDT. This paper limited the analysis to global parameters as of T30 and SPL.
Acoustical field test of a long enclosure
This part of the methodology is necessary after comparing the results for the long-enclosure domains (D4, D15–17) for ray-tracing versus DEM. Results and a detailed discussion are presented in Section IIIB. The selected long enclosure is a typical corridor space with highly reflective surfaces. The dimensions of the corridor are as follows: width: 2.25 m (average), length: 22.80 m, height: 3.00 m. The acoustical volume of the corridor is 136 m3. The cross-section-to-length ratio is 0.26 m, which is closer to D15 than that of the other studied geometric entities.
Field tests were conducted on May 27, 2024, in the corridor of a factory building during break hours, with minimal background noise (see Figure 4). A B&K (Type 4292-L) standard dodecahedron omnidirectional sound source was used for acoustical signal generation, accompanied by a B&K (Type 2734-A) power amplifier. The impulse responses at various measurement points were captured using a B&K (Type 4190ZC-0032) microphone, incorporated into a handheld analyzer (B&K Type 2250-A). The sampling frequency of the impulse is 48 kHz, covering the interval from 100 to 8 kHz. DIRAC Room Acoustics Software Type 7841 v.4.1 is used to generate noise signals and to post-process measured impulse-response data for each receiver position. For reliable decay parameter estimations, it is aimed to get a signal that is at least 45–50 dB higher than the noise in all octaves. The source signal is an E-sweep, previously shown to produce the highest PNR value. 60 The impulse response length is kept at 10 s. One source (h: 1.50 m; S1) and 12 receiver (R1–R12) positions (h: 1.20 m) are tested, as shown in Figure 5. The source is located at one end of the corridor, 2 m from the wall. The aim is to assess the variations in T30 and relative SPL values as source and receiver distances increase within the available corridor limits, and then to compare these parameters with ray-tracing and DEM results.
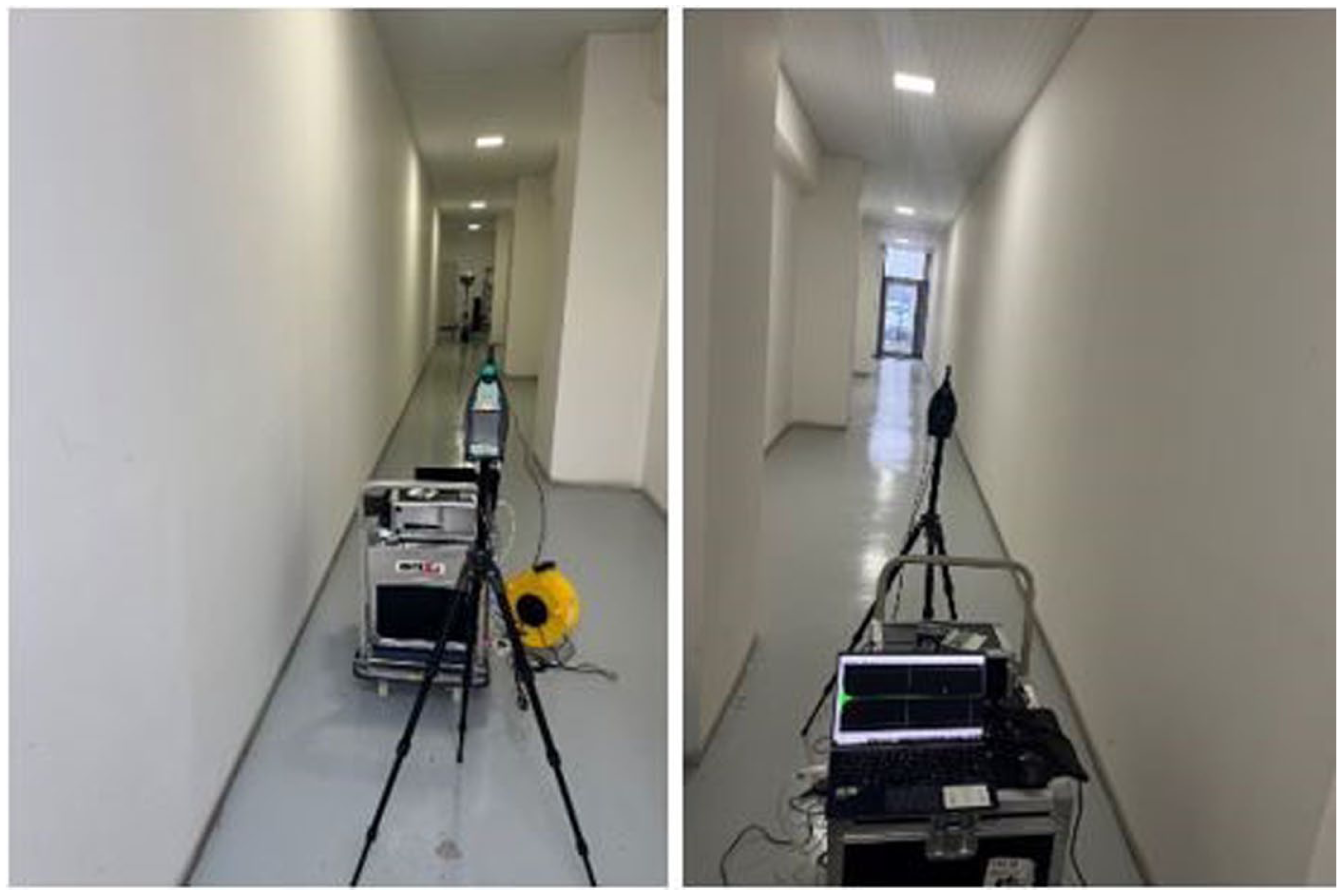
Field measurement set-up within the corridor space, interior views.
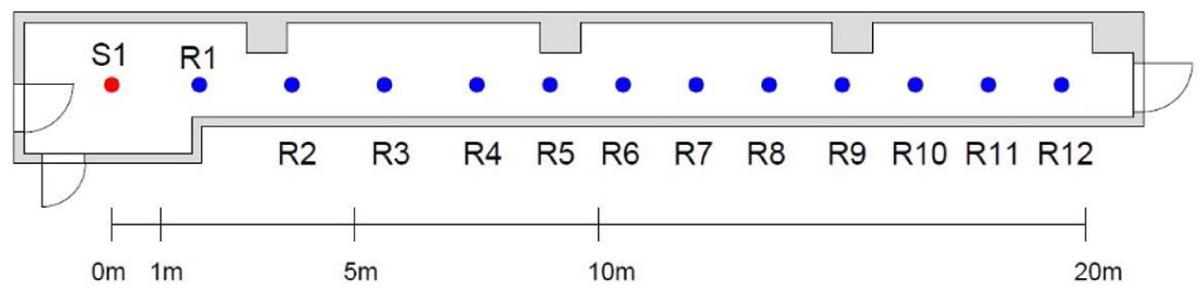
Plan view of the field-tested corridor; source (S1, red dot) and receiver (R1–12, blue dots) locations.
An acoustical model of the corridor space is generated. Ray-tracing model and mesh model views are presented in Figure 6, with specific input data for the simulations. Source and receiver positions in both models are identical to those in the field test. Material input is tuned through field tests at each receiver position, initially based on relative sound pressure levels (SPLs). Later, T30 values are compared. A 500 Hz octave band is selected for comparisons in this paper. Accordingly, sound absorption coefficients are attained for mostly reflective interior surface finishes, including vinyl flooring (α: 0.03), painted brick wall surfaces (α: 0.01), and a metal suspended ceiling system (α: 0.16). The tuned absorption coefficients are consistent with the literature data for such commonly used materials. The alpha values obtained from ray-tracing and DEM acoustic models are identical. A detailed discussion of comparisons among field test, ray-tracing, and DEM results for each receiver location is provided in the results section. IIIB.
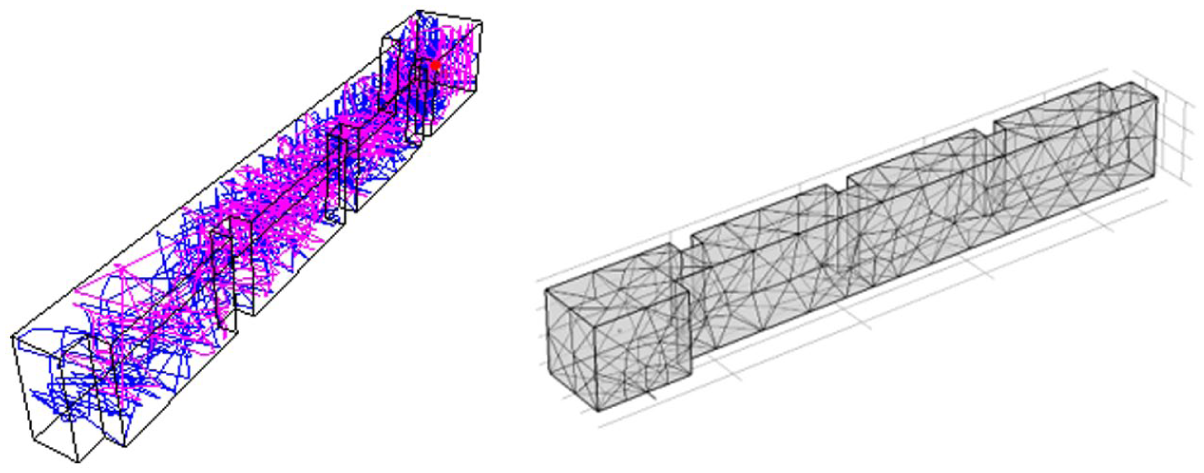
Ray-tracing model on the left (impulse response length: 3000 ms, max. reflection order: 10,000, number of late rays: 1000) and DEM mesh model on the right (mesh size: min: 0.23 m, max: 1.82 m, MFP-λ: 2.13, diffusion coefficient: 244) of the field-tested corridor space.
Results and discussion
Comparisons of T30 values obtained from ray-tracing and DEM
This section initially presents estimated reverberation times (T30) for the collected room impulse responses (RIRs), using fixed source-receiver configurations. In Figures 7 to 9, the T30 results from ray-tracing and DEM simulations are presented for 16 domains within their respective geometric groups. T30 graphs are accompanied by the mean-free-path (MFP) distribution of domains, facilitating a clearer discussion of the relationship between MFP and T30 values across different geometric entities of equal volume. Comparisons are held for the domains’ reflective and partly absorptive (carpet flooring) conditions, except for coupled and sequential spaces.
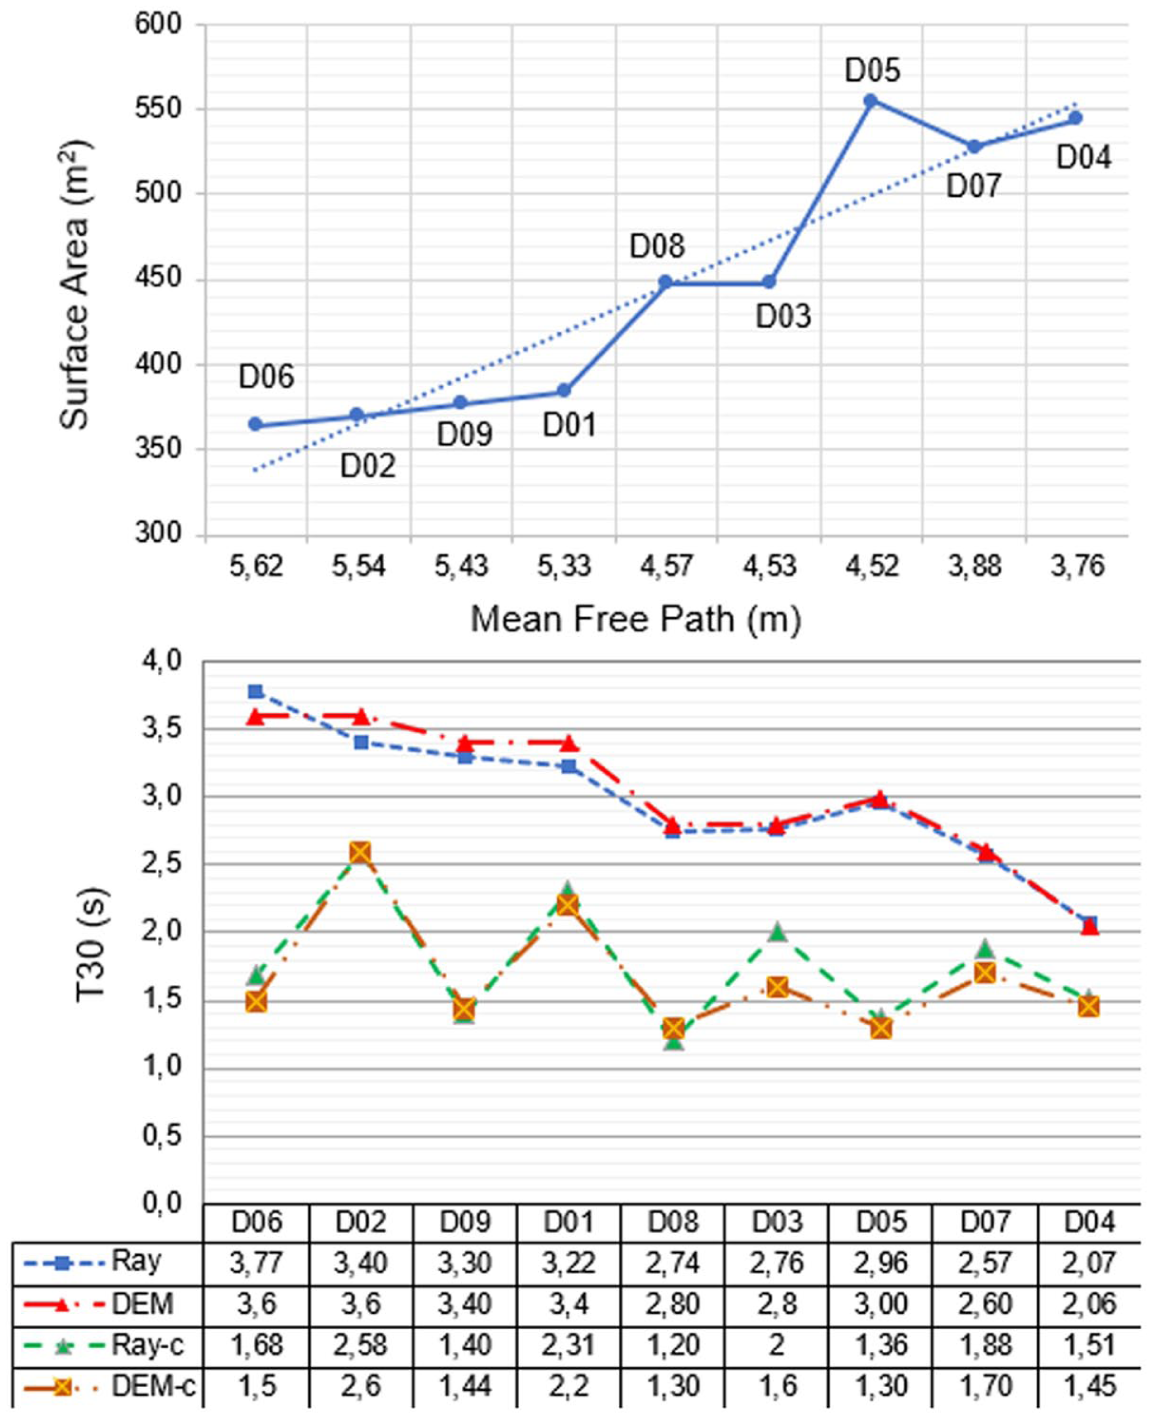
T30 comparison of ray-tracing and DEM results for floor reflective (stone: Ray, DEM) and absorptive (carpet: Ray-c, DEM-c) scenarios (below), together with MFP versus surface area distribution of the exact domains (above); Group 1 – primitives, V: 512 m3.
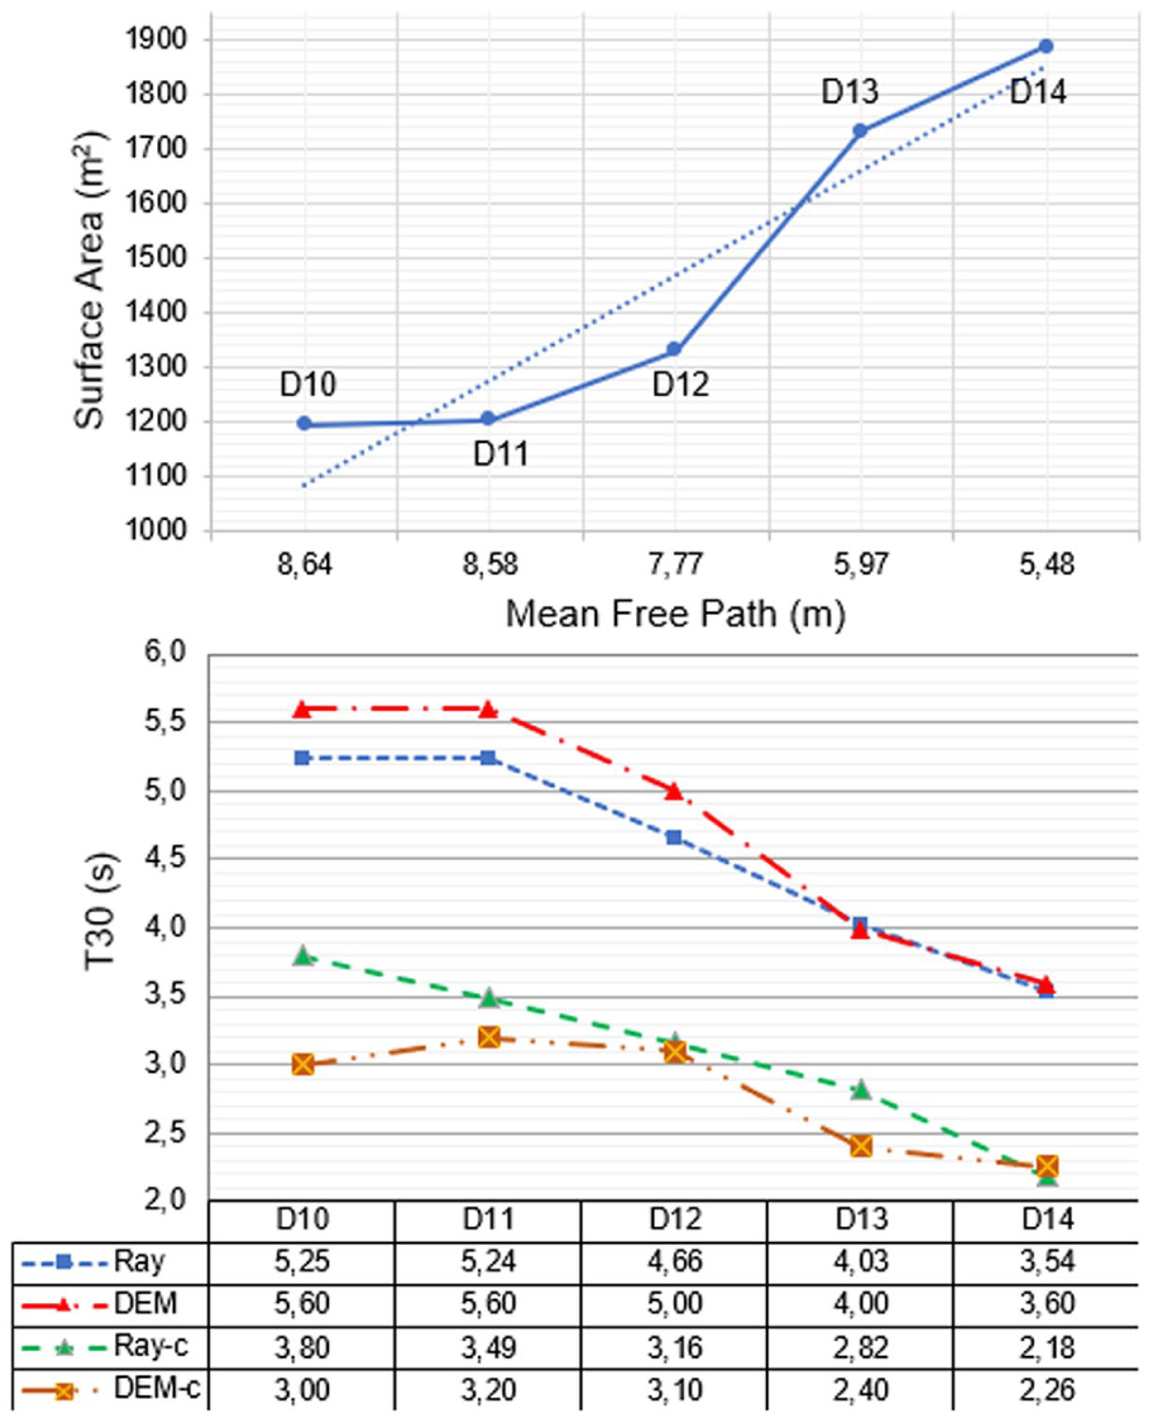
T30 comparison of ray-tracing and DEM results for floor reflective (stone: Ray, DEM) and absorptive (carpet: Ray-c, DEM-c) scenarios (below), together with MFP versus surface area distribution of the exact domains (above); Group 2 – multi primitives, V: 2584 m3.
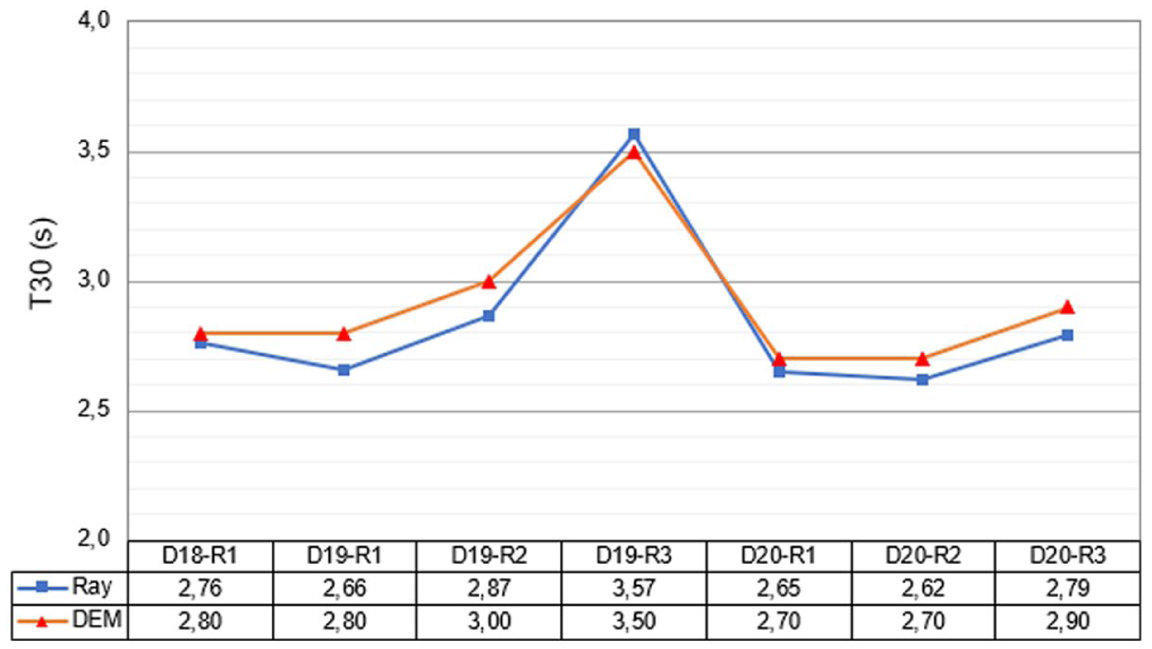
T30 comparison of ray-tracing and DEM results for floor reflective (stone: Ray, DEM) scenario; Group 4 – coupled and sequential spaces: V: 256 m3 × number of rooms.
When the estimated T30 values (Figure 7) for various room forms in Group 1 (basic primitives) are examined, it can be observed that the lower the mean-free-path, the lower the estimated T30s for domains with similar volumes. As the formula shows, the smaller the surface area-to-volume ratio, the higher the mean-free path. Dome and semi-dome (D2, D6) type enclosures have the greatest potential for long reverberation compared to other geometric entities of similar volume. On the other hand, elongated forms -long rooms- display the lowest reverberation, as they have the highest surface area-to-volume ratio. Note that reverberation time may increase as the source-to-receiver distance increases. The results presented for D04, a long room, are the average estimated reverberation times per receiver for the ray-tracing and DEM solutions. The long room discussion is further elaborated in Section IIIC. The results presented in Figure 7 for D5 refer to the case where the source is located at the central, smallest semi-dome, and the receiver is in the mid-sized semi-dome.
The trend is not consistent with MFPs when the floor surface is absorptive, as in D01 and D02. In this case, the amount of absorption the floor surface provides relative to its overall surface area dominates the results. The lower the floor area-to-total area ratio, the higher the T30 results for the floor-carpet case. This can be compared using the Sfloor/Stotal ratio, as shown in Table 1. Accordingly, domains with a lower floor-to-total-surface ratio—namely D01, D02, and D07-exhibit higher reverberation times and deviate from the general trend of decreasing reverberation as mean free path (MFP) decreases when the floor is absorptive. Overall, the difference between ray-tracing and DEM results for T30 is within 1 JND for different geometric domains when the floor is reflective. The same applies to carpeted floors. The deviation is most significant for D03 (approximately 4 JND), a prism that is much closer to a flat room compared to the other analyzed geometries.
Group 2 – multi primitive domains are almost five times larger than the basic primitives. This group is included in assessments to check whether the deviations change as the volume and MFPs increase significantly. According to Figure 8, all multi-primitives exhibit a T30 within a 1–1.5 JND difference when ray-tracing is compared to DEM, for both reflective and floor-absorptive states. The deviating data, with a 4 JND difference, is observed only for D10 when the floor is carpeted. D10 is one of the prisms closer to a flat room in proportion. Additionally, when the floor is absorptive, the distribution of sound energy becomes uneven within the space. This may affect the estimated difference in T30 values, especially when one room surface is more absorptive due to an inhomogeneous absorption distribution.
Across the compared domains, MFP decreases as space becomes more modulated or fragmented. So, the longest MFP for the same volume is observed for D10, which is simply a prism. As the ceiling’s domical attachments initially become concave (D11 and D12) and later become convex (D13 and D14), MFPs decrease. When central types (D11 and D13) are compared to linear types (D12 and D14), the linear pattern indicates a shorter MFP than the central type; for example, D11 versus D12 and D13 versus D14. Convex dome cases are referred to as inverse domes in Table 1. Convex domes with the same volume have greater surface areas and shorter reflection paths than concave domes (typical dome structures in architecture), ultimately resulting in shorter reverberation times. Thus, structures with domed ceilings have higher MFPs than inverse-domed domains of similar geometry and volume (central or linear), such as D11 versus D13 and D12 versus D14. This indicates that a convex form, currently positioned on one side of the room and serving as a ceiling, yields shorter reflection paths than a concave surface within a similarly sized volume. Accordingly, as reverberation time is proportional to the MFP, especially when the room surfaces are reflective, T30 values decrease for domains with convex upper shelters. And eventually, D14, which is an axial or linear space sheltered by an inverse-domed upper structure, exhibits the lowest T30. On the contrary, D10, a flat, simple prism with a similar volume (in this group, 2584 m3), has the longest T30. D11, a prism with a multi-domed upper structure, has an MFP closer to that of D10. Therefore, T30 values are nearly identical across all surfaces in the reflective state for D10 and D11, with D11 exhibiting the highest T30 within this group. The difference is much greater when the floor is absorptive. The difference in T30, considering the group’s maximum and minimum values, is approximately 1.7 to 2.0 seconds for the reflective scenario. There is a significant discrepancy in domain D10 between ray-tracing and DEM results for the carpeted floor state. Overall, the results of Group 2 align with and further validate those of Group 1. The increase in volume has affected the parameters being compared similarly. The only deviation in both cases is the domains that are much closer to flat room proportions, specifically D3 and D10. The carpeted-floor condition results from both DEM and ray tracing in flat rooms and should be further evaluated by comparing the results with field-measured data.
Group 4 – Coupled and Sequential Spaces is the last group of assessed geometric entities. Coupled spaces have been the subject of numerous investigations,60–64 primarily due to their potential to exhibit multi-exponential energy decay and their peculiar behavior. This outcome is mainly observed when the source and receiver are in one room, which is coupled to a larger room with much higher natural reverberation, like in the case of reverberation chambers coupled to a concert hall’s main audience area. Within the scope of this study, RIRs are collected in one room when the source is in another. All rooms are identical in volume and have the same absorption area. Rooms have reflective surfaces, so the potential of multi-slope (multi-exponential) decay is minimized and excluded from this study. D18 is a typical two-room coupled scenario. D19 is a sequential space in a linear form, and D20 is a sequential space of a central pattern. In D18, the source is located in one room and the receiver in the other. In D19, the source is located in the first box, and three receivers are in the following three coupled boxes (D19-R1, D19-R2, D19-R3). Similarly, in D20, the source is located in one of the boxes, and the three receivers are located in the other three adjacent or opposite boxes (D20-R1, D20-R2, D20-R3), as previously highlighted in Figure 2 under Sec. IIB. According to Figure 9, all T30 values obtained from RIRs in coupled and sequential spaces differ by less than 1 JND between ray-tracing and DEM solutions, indicating that both simulation techniques yield consistent results.
Within domain D19, as distance from the source increases, T30 values rise, with a notable difference of 0.91 s between D22-R1 and D22-R3. A similar increase is also observed in the comparatively central pattern of D20s receiver positions. This result aligns with a previous study in which field measurements were conducted in connected studio spaces at a university, in which the measured T20 values in each room increased with source-receiver distance. 65 This situation can be particularly problematic in public spaces, such as interconnected gallery areas in schools or museums, especially when all surfaces are reflective. Under these conditions, even moderate noise levels may cause discomfort in adjacent rooms or volumes. Consequently, the use of absorptive materials becomes a critical acoustic design strategy, with ceiling surfaces often being the most practical location for their application.
Field test results of a long enclosure and comparisons with ray-tracing and DEM
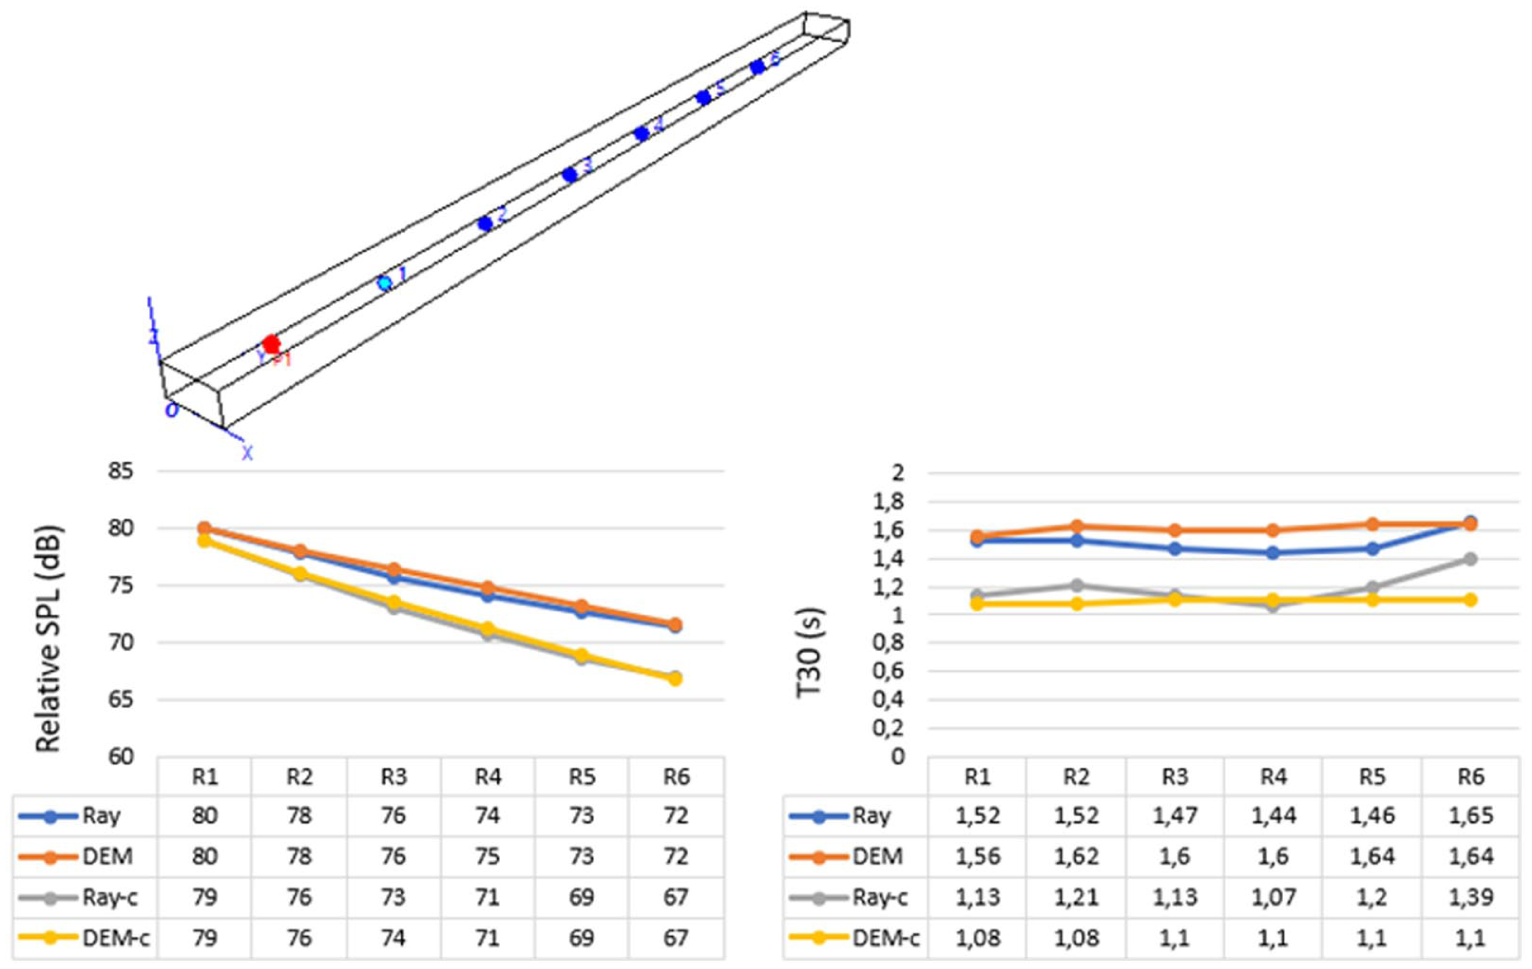
This section presents the evaluation of the field-tested corridor space. As described in detail in Sec. In the IID, the sound source is positioned at one end of the corridor, and the receiver locations are systematically extended up to 12 positions. Field test results are used to compare ray-tracing and DEM results. Model tuning is initially based on relative SPL values, followed by a comparison of T30 values. As previously noted, theoretical DEM values are not directly applicable to long spaces in DEM simulations. Thus, a linear law y = (ax + b) × d is investigated as a function of the source-receiver distance. In this equation, “y” is the estimated value of the diffusion coefficient, x” is the distance from the source, and “d” is the theoretical diffusion coefficient as described in Sec. IIC3. For the corridor space, the relationship between the distance from the source and the factor applied to the theoretical diffusion coefficient is given by y = (x/7 + 1) × d.
In Figure 10, relative SPL comparisons are presented, and in Figure 11, T30 results are shown. For SPL, the deviation among methods at the farthest receiver position is only 2 dB, indicating that ray tracing predicts higher sound energy attenuation. The difference is not noticeable. The difference between DEM and the field test is at most 1 dB across all receiver positions tested. In Figure 11, when field results are compared to ray-tracing results, it is observed that the difference between T30 for different receiver positions is mostly within a 1 JND difference. Similarly, the most significant deviation between DEM and field-tested T30 results is for R8, and the difference is slightly higher than 1 JND, meaning that the estimated linear law for the diffusion coefficient applies well to overall receiver positions with the given proportions of this long space and the attained materials. To test the linear relationship between the distance to the source and the factor applied to the theoretical diffusion coefficient, alternative long rooms are studied over virtually generated domains (D4, D15–17), as discussed in Section IIIC.
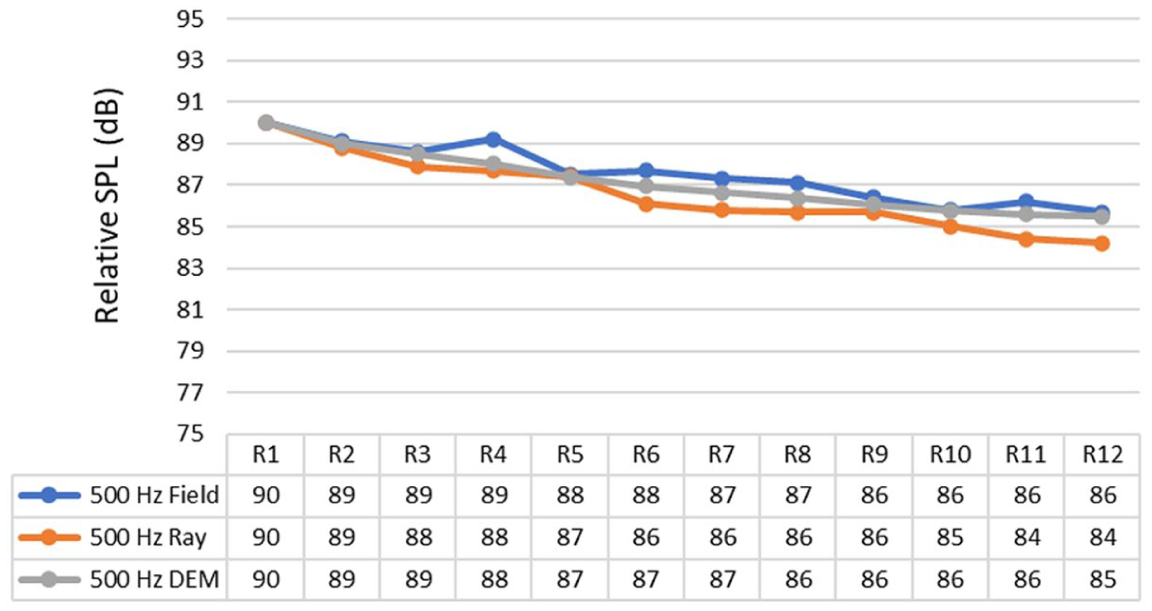
Relative SPL comparison of field test, DEM, and ray-tracing results for the corridor space.
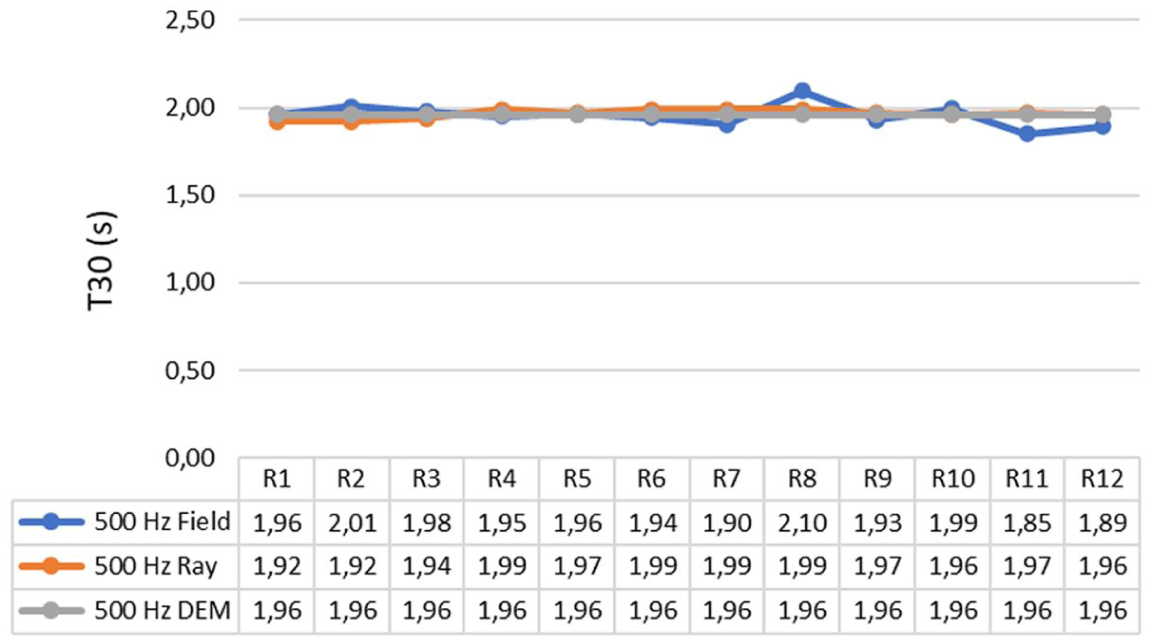
T30 comparison of field test, DEM, and ray-tracing results for the corridor space.
Discussion on long room acoustical computations using ray-tracing and DEM
This section presents the acoustic assessment of the generated long rooms, including domains D04, D15, D16, and D17. Mean free path (MFP), cross-sectional area-to-length ratio, and average absorption coefficient (αavr) values are summarized in Table 2. Figure 12 shows the MFP per surface area for the long-room domains in Group 3, all of which have a volume of 512 m3, comparable to Group 1.
Parameters in effect of estimated versus theoretical diffusion coefficient.
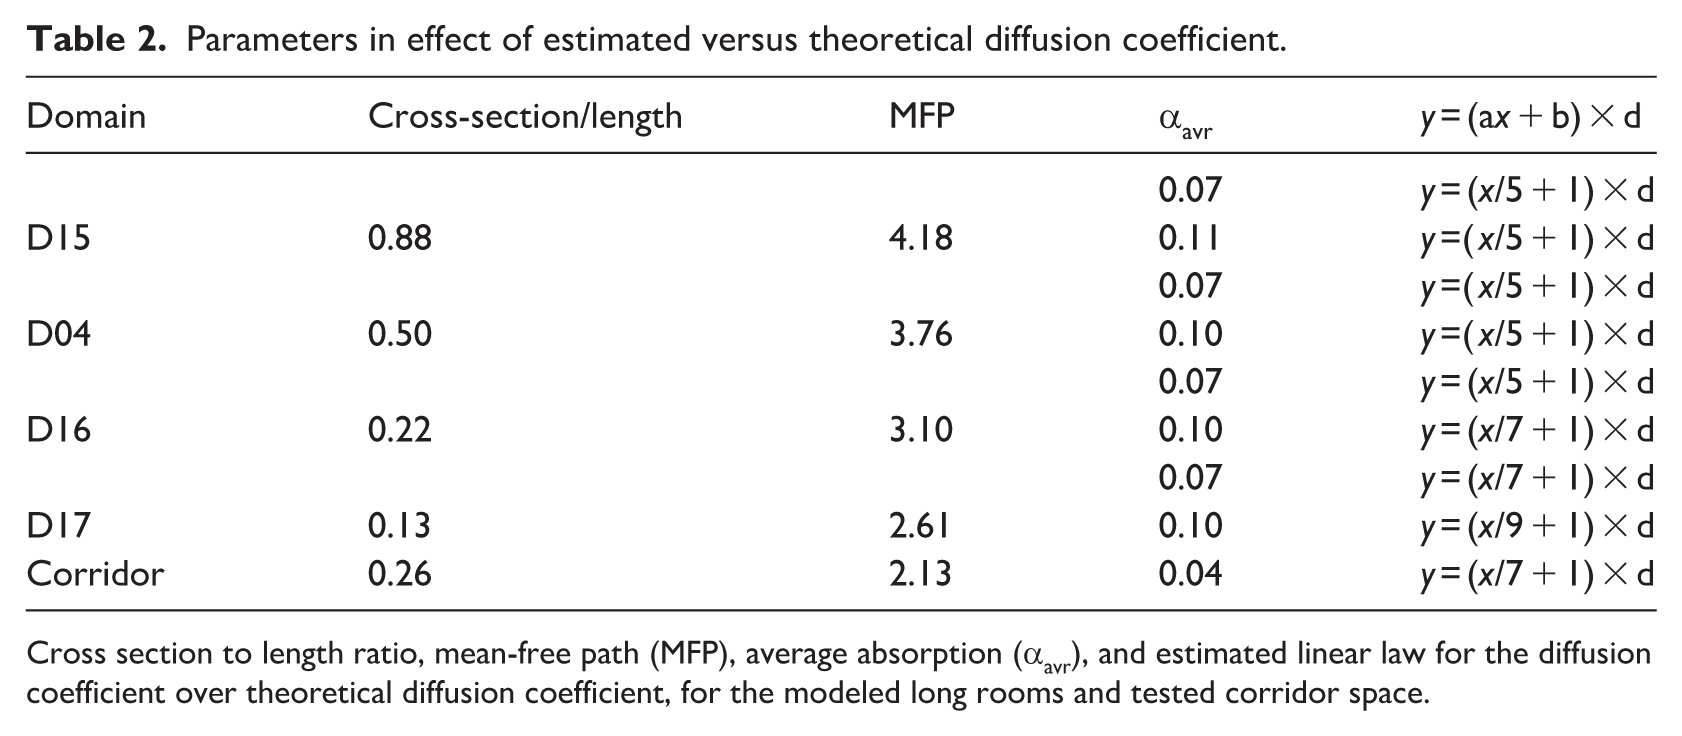
Cross section to length ratio, mean-free path (MFP), average absorption (αavr), and estimated linear law for the diffusion coefficient over theoretical diffusion coefficient, for the modeled long rooms and tested corridor space.
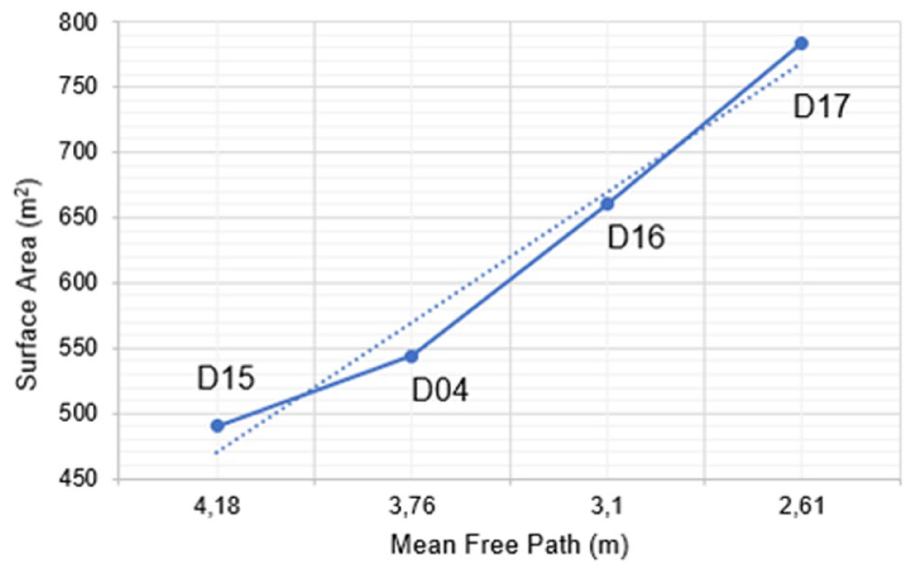
Mean-free path versus surface area distribution of Group 3-long rooms, V: 512 m3.
An inverse relationship between surface area and MFP is observed as a linear trend for identical volumes. Conversely, as the cross-sectional area-to-length ratio decreases, the MFP decreases; in other words, for a given volume, longer rooms exhibit shorter MFPs and, consequently, shorter reverberation times. This trend holds for both reflective and partially absorptive surfaces, such as carpeted floors, though the average absorption in both cases remains low. T30 values per source-receiver distance show slight variation across the simulated domains, while relative SPLs vary more noticeably. It should also be noted that the situation may differ in other cases, as the cross-section (narrow section of the long room) to length ratio decreases and the source-receiver distance increases further. On the other hand, the variation in relative SPLs with distance is much more pronounced. In particular, SPL decreases more rapidly with distance in rooms with absorptive floors. Figure 13 compares T30 and SPL for domain D17, which has the smallest cross-section-to-length ratio.
Source and receiver positions for D17 (above), relative SPL and T30 comparisons of ray-tracing and DEM results for floor reflective (stone: Ray, DEM) and absorptive (carpet: Ray-c, DEM-c) cases, per receiver positions (R1–R6).
As previously noted, the theoretical diffusion coefficient is not directly applicable to long rooms. This study investigates how diffusion coefficients vary with distance from the source. Tuning of SPL and T30 results from ray-tracing and DEM simulations, in comparison with field-test data for long enclosures (D04, D15, D16, and D17), yields a linear law y = ax + b)·d, where y is the estimated diffusion coefficient, x is the source-receiver distance, and d is the theoretical value (see Table 2). SPL tuning is prioritized for each receiver position, ensuring deviations of less than 1 dB between field tests and simulations. T30 results are generally within 1 JND, except for D17, where the maximum deviation occurs at the farthest receiver (R6) in the one-surface absorptive case. Otherwise, differences range from 1 to 2 JND. Relative SPL values for D17 deviate by 0–1 dB in both fully reflective and one-surface absorptive cases (Figure 13). Table 2 shows that the estimated diffusion coefficient exceeds the theoretical value in all reflective cases, particularly for the highest MFP (y = x/5 + 1)·d) and the shortest MFP (y = x/7 + 1)·d). In one-surface absorptive scenarios (D16 and D17), the factor varies slightly with the cross-section-to-length ratio and the absorptive surface area. Differences in average absorption and MFP affect the theoretical versus estimated diffusion coefficient values. This study is limited to four virtual long-room domains and one full-scale corridor. Future research examining alternative long-room proportions that produce different MFPs and average absorption rates could further develop these findings.
Relative SPL and time-dependent sound energy distributions within domains
In this section, the results of ray-tracing and DEM simulations are initially presented for the nine selected primitives from Group 1 to examine the stationary distribution of energy levels (relative SPL; Figure 14). Additionally, DEM is employed to visualize the time-dependent propagation, concentration, and flux of sound energy within different geometries. The objective is to highlight the distinct sound propagation patterns associated with each geometric configuration. Figure 14 shows the stationary sound energy distribution maps for ray-tracing simulations (top) and DEM solutions (bottom) in the reflective-floor scenario. Given the relatively small scale of the domains, differences between grid and meshed positions are generally minor, ranging from 0 to 2 dB. The most significant discrepancy occurs in D09, the double-ellipsoid domain, with approximately 5 dB. Here, the source is positioned under one ellipsoid, and the increased source–receiver distance, combined with partial flow restriction at the intersection of the two ellipsoids, contributes to the difference. This intersection should not be interpreted as a coupling aperture, as its area is substantially larger than typical apertures found in coupled-volume scenarios.
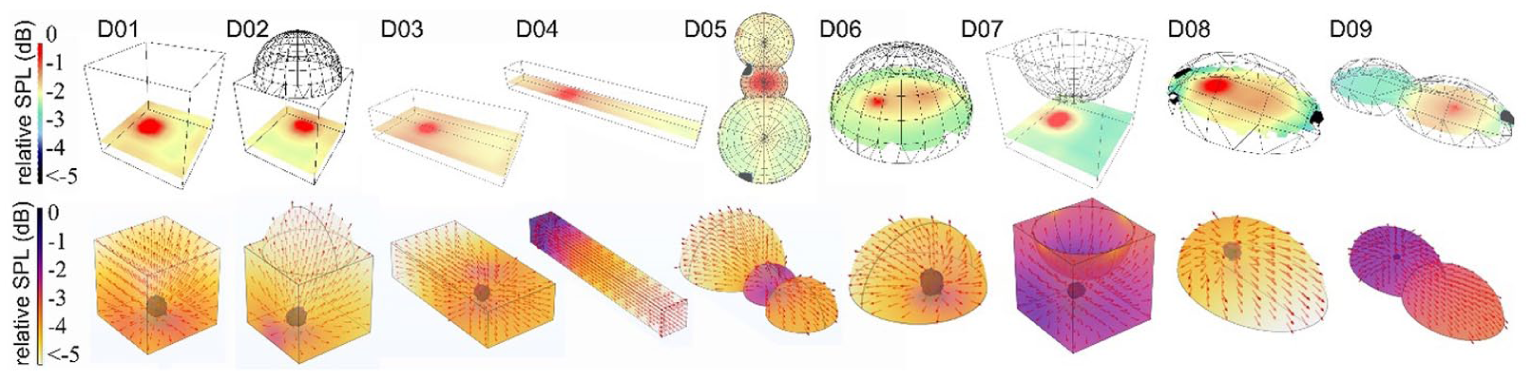
Relative SPL (dB) maps, for 500 Hz, obtained from ray-tracing (first row), sound energy distribution, and energy flow vectors obtained from DEM solution (second row) for all surfaces reflective case; for geometric entities under Group 1-D01 to D09.
Some specific examples from Figure 14 are further illustrated in Figures 15 to 17, which provide close-up views and comparisons between reflective and absorptive floor scenarios. Overall, an examination of sound energy flow across different geometric entities shows that domains with relatively short MFPs-and therefore lower diffusion coefficients, such as D07 (inverse dome)-are less influenced by a single absorptive surface compared to domains with higher MFPs, as in D01. Energy distribution is generally more uniform in spaces with a convex upper structure, regardless of surface absorption.
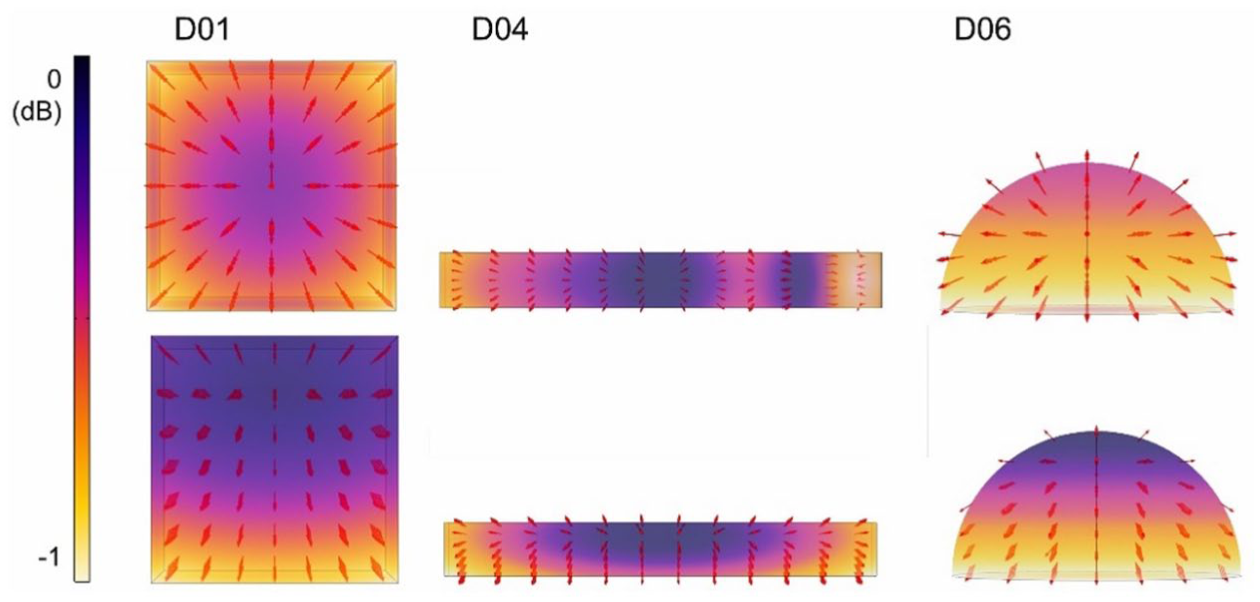
Energy flow vectors obtained from DEM solutions for 500 Hz at time instant 2 s, for domains D01, D04, and D06; all surfaces reflective (above) versus absorptive floor (below), cross (vertical) sectional views.
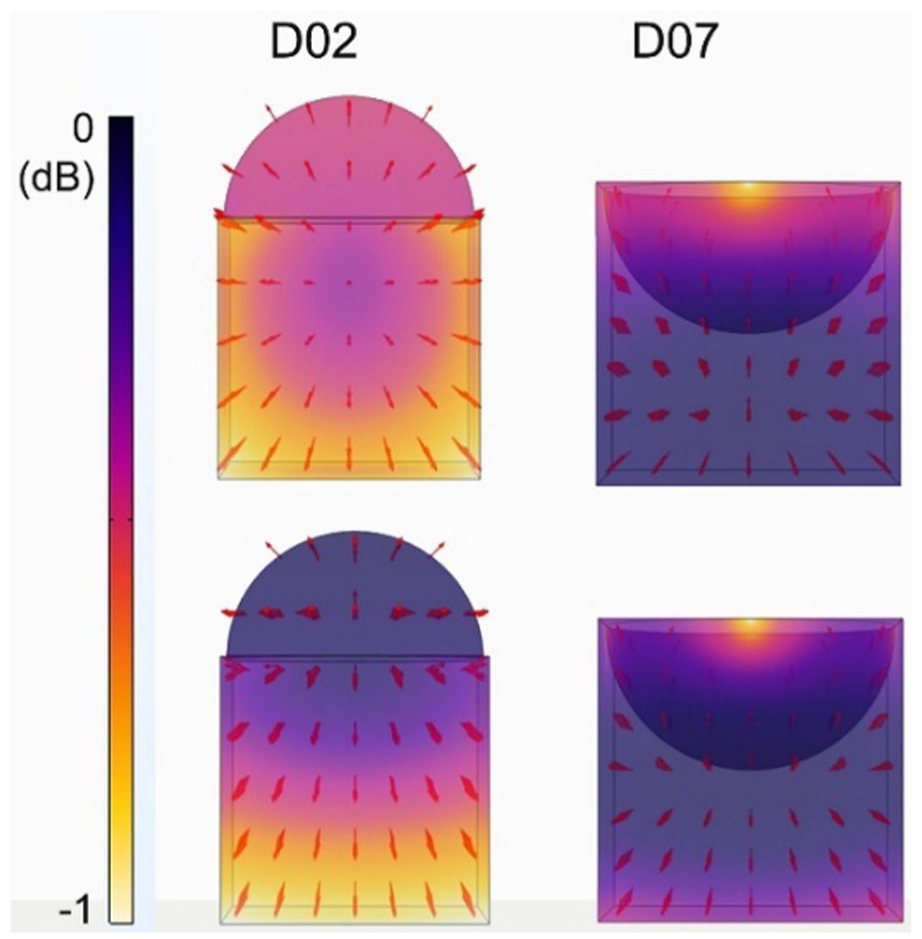
Energy flow vectors obtained from DEM solutions for 500 Hz at time instant 2 s, for domains D02 and D07; all surfaces reflective (right column) versus absorptive floor (left column), cross (vertical) sectional views.
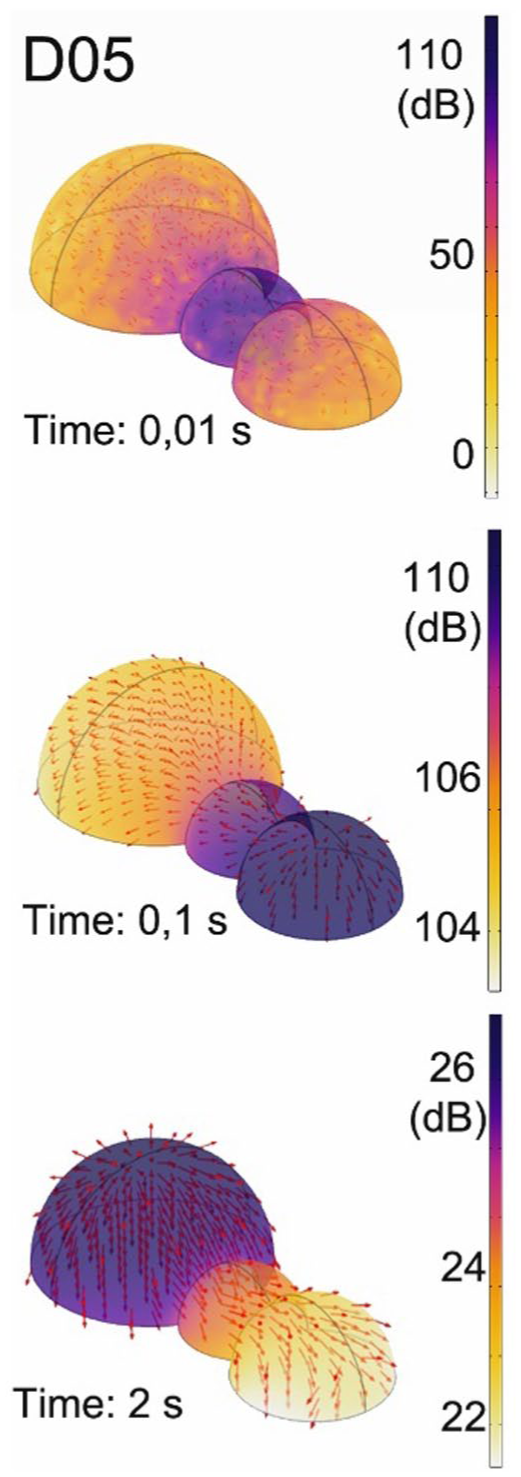
DEM solution for D05 for 500 Hz for the time instants 0.01, 0.1, and 2 s for the floor absorptive and dome reflective state, axonometric views.
A shorter MFP corresponds to a lower diffusion coefficient, which indicates a slower rate of particle interaction with boundary surfaces over a given period. Consequently, the characteristics of surfaces-reflective or absorptive-have less impact on energy decay in these domains compared to spaces with higher diffusion coefficients, where particle–surface interactions occur more rapidly. Regarding the average SPL distribution, carpeted-floor cases show deviations of 2–3 dB compared with reflective floors on mapped or meshed surfaces. Among the basic primitives, this variation is minimal for D01, a simple cube, where almost no difference is observed. In contrast, the variation is largest for D06, the semi-dome, with SPL differences of up to 3 dB for a reflective floor and 8 dB for an absorptive floor. D06, featuring a domical upper structure and the highest T30 among the primitives, is more affected by a single absorptive surface, resulting in less uniform sound energy distribution.
The concentration of energy is particularly noteworthy when comparing absorptive and reflective floor conditions in D01, D04, and D06, as illustrated in Figure 15. In the cubic domain D01, once stabilized, energy distributes from the center toward the room boundaries. When the floor is absorptive, the energy flux along the two cross-section axes moves from the ceiling toward the floor. This behavior is observed in most symmetric cases but is more pronounced in single-space volumes, such as D06.
For rectangular or tubular forms with fully reflective surfaces, energy flux tends to be directed toward the boundaries of the smaller cross-section, such as the end of a corridor or tunnel. When the floor is absorptive, the energy flux in tube-shaped and rectangular-prism domains shifts downward from the ceiling toward the floor. In D06, at a 2-s time instant, the center of energy flux rises higher along the vertical section of the semi-dome under the absorptive-floor condition compared to the reflective-floor scenario. It should be noted that the spatial variation of energy flux remains small – 1–2 dB —regardless of geometry or floor absorption. Like sound pressure level (SPL), the energy flux is relative in magnitude.
Figure 16 illustrates a comparison between concave and convex geometries in terms of sound energy flux in simple enclosures. The D02-domed cube and D07-inverse dome are analyzed over cross-sections of energy flow vectors for both reflective and absorptive floor conditions at a 2-s time instant. D02 combines a dome with a prismatic base, reflecting many religious building typologies, but is simplified here to two basic, primitive forms. For D02, as in D01 and D06, energy flux moves from the center of the cross-sectional axis toward the edges of the prismatic base when all surfaces are reflective. However, this pattern shifts immediately from dome to floor when the floor is absorptive, creating an energy division within the space.
In these small-scale volumes, uneven absorption does not produce multi-exponential decay of sound energy, at least for the cases analyzed from D01 to D09. At larger scales, however, such effects could generate multiple decay rates, as previously observed in monumental structures. 9 D07, a half-dome subtracted from a cube, is designed to investigate the diffusive properties of a convex boundary compared to a concave dome. In D07, energy flow vectors are directed toward the overall boundary surfaces rather than from a high concentration at the ceiling to the floor. In the carpeted scenario, flow vectors shift slightly toward the floor relative to the reflective case. Yet, the distribution remains more uniform than in other absorptive-floor examples, particularly those with concave or domical upper structures. Note that in a time-dependent DEM solution, instantaneous energy-flux plots show the energy flow at a given time instant; the magnitude difference in dB is not meaningful, especially for small single-volume spaces; instead, the direction of flux is highlighted. The meaningful differences in sound levels with respect to form and size in this study are best observed in sequential and coupled spaces, or in Relative SPL graphs of disproportionate rooms.
Figure 17 presents the time-dependent solution for D05, representing cave-like structures, a topic of interest in archaeoacoustic research.66,67 The temporal evolution of energy can be observed immediately after the impulsive source is initiated (t = 0.01 s), shortly after it stops (t = 0.1 s), and later as the energy fills the entire volume and stabilizes (t = 2 s). In this case, the source is located beneath the central half-dome, which also represents the smallest volume. During the initial time steps, energy flows from the central semi-dome toward the medium-sized half-dome on one side, indicating that the source initially fills the medium volume. Over time, the region of higher energy concentration shifts to the largest semi-dome, and energy subsequently flows from the largest semi-dome to the smaller domes.
The floor’s reflective or absorptive properties have minimal influence on the energy flow patterns in this triple semi-dome configuration. A random initial sound power level is used to demonstrate attenuation over time, as illustrated in the different time slots. At specific time instants (t = 0.1 s and t = 2 s), the deviation between receiver positions ranges from 2 to 3 dB. This geometry is the only case in Group 1 that exhibits a variation of up to 3 dB between positions at a given time, and it is the most volumetrically fragmented among the assessed basic primitives. Observing energy flow among caves of different sizes shows that, even when the source is placed in a mid-sized space, once all volumes are filled, the largest cave maintains higher natural reverberation. Afterward, energy flux is directed from the large cave toward the smaller volumes, which have shorter natural reverberation times, a behavior similar to that observed in coupled spaces.
Finally, an example from Group 4, Coupled and Sequential Volumes, is presented. D19, a four-box linearly coupled domain, represents a typical sequential space found in many real architectural settings, such as museum galleries. As shown in Figure 18, following the termination of the sound source (around t = 0.1 s), energy flows from the first cube toward the fourth. At subsequent time steps, energy levels gradually decrease while the flow continues from the first to the fourth cube, persisting until approximately t = 1 s. Only after t = 3 s does the fourth cube begin feeding energy back to the preceding volumes; however, this feedback is insufficient to produce multi-exponential energy decay. Notably, the ability to investigate such detailed energy flow patterns across various room geometries is one advantage of DEM over ray tracing, enabling a more in-depth analysis of sound fields.
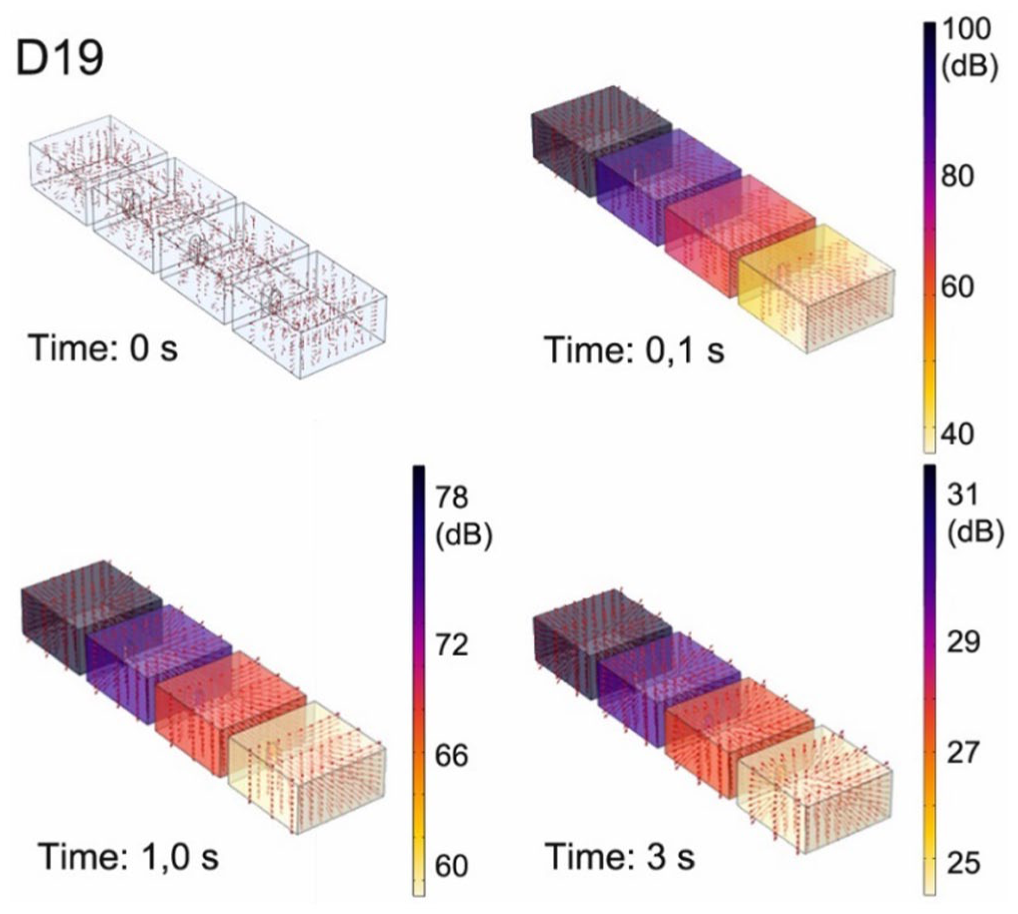
Time-dependent DEM solution for D22 for 500 Hz for the time instants 0, 0.01, 1.0, and 3 s for the floor reflective case, axonometric views.
As a last discussion point, some limitations of this study should be highlighted. Concave surfaces often produce problems in room acoustics applications due to focusing. Both ray tracing and diffusion equation models are geometrical room acoustics models; they have the disadvantage of accurately modeling the possible locations of sound foci within concave boundaries. On the other hand, modeling concave surfaces in geometrical room acoustics models can yield sufficiently accurate results in areas far from the possible focal points. For circular surfaces, only a radius large with respect to the wavelength would be applicable for estimations on the frequency of interest. In this study, the discussed domains are larger than the wavelength.
The common situation in room acoustics where we encounter concave inner surfaces is in domed structures. Typical domed cases in this study include domains D06, D08, D05, and D02. If the problem is approached as in the case of simple laws for rays reflected at concave mirrors, well known in geometrical optics, 68 and considering the source right beneath the dome -or concave upper shelter -at a position 1.5 m from the ground, the patterns of sound propagation would be expected as shown in Figure 19. The conceptual reflection patterns are shown on section views. Accordingly, if the source is between the center and the apex, the rays focus behind the floor line. However, there is still a concentrated energy return rather than a diffuse one as in the case of D06, D05 large dome (on the left) and medium-sized dome (on the right). If the source is at half the radius on the central axis, the rays return parallel to the floor zone, as in the case of D05, the small dome (at the center). When the source is between the half-radius and the apex, the reflection pattern becomes more diffuse, as in D08. Lastly, when the source is located even lower than the full diameter of the upper dome, then the focal point would be much higher and closer to the apex, as shown in D02 (Figure 19). In given cases, the only focal point that could not be modeled by ray tracing or DEM is given in D02. Because the source position represents a standing person, none of the other domains has a focal point within their represented boundaries. All the other domains show slightly concentrated or slightly diffuse sound-propagation patterns, consistent with the energy flow vectors. On the other hand, D08 is an ellipsoid. Its centers would be multiple, and wave propagation would be much more complex in 3D analysis. For all those reasons, acoustical foci are best detected using wave-based simulation techniques.
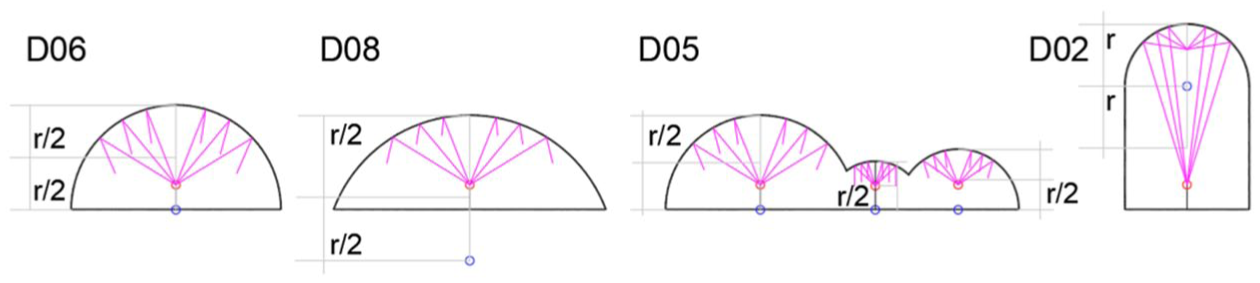
Propagation patterns when the sources are underneath the typical domed domains; source at a height of 1.5 m.
Conclusion
This study examines sound propagation in elementary architectural forms and their combinations, progressing from basic primitives to elongated, coupled, and sequential spaces representative of real buildings. Twenty generative domains are analyzed using both ray tracing and diffusion equation modeling (DEM), with results primarily evaluated using reverberation time (T30), relative sound pressure level (SPL), and sound energy flow characteristics. The principal findings of the study can be summarized as follows:
Consistency of modeling approaches; for most geometric domains—including coupled and sequential spaces—T30 values obtained from ray-tracing and DEM agree within approximately one just-noticeable difference (JND), confirming that both methods yield consistent global decay estimates under controlled conditions.
Geometry–mean free path relationship; for domains of identical volume, mean free path (MFP) increases as the surface-area-to-volume ratio decreases. Accordingly, compact and centrally organized forms exhibit longer reverberation times than more fragmented or elongated geometries.
Influence of domical versus elongated forms; dome and semi-dome enclosures consistently produce longer decay times than other geometries of comparable volume. In contrast, elongated forms show the lowest reverberation times, primarily due to their high surface-area-to-volume ratios.
Effect of absorption distribution; when the floor is absorptive, reverberation time trends no longer follow MFP alone. Instead, the relative contribution of the absorptive surface to the total enclosure area becomes the dominant factor, indicating that material distribution can override geometric tendencies.
Fragmentation and modulation of volume; in composite geometries, MFP decreases as spaces become more modulated or fragmented. Linear configurations exhibit lower MFPs than central-type geometries of equal volume. Structures with domed ceilings show higher MFPs than inverse-domed configurations, leading to longer decay times in centrally domical forms.
Sequential space behavior; in sequentially connected spaces, sound generated in one volume may cause a progressive increase in reverberation time in adjacent spaces as source–receiver distance increases. This behavior can pose acoustic challenges in buildings with reflective finishes, emphasizing the need for targeted absorption strategies.
Limitations of constant diffusion coefficients in long rooms; for elongated enclosures, a single constant diffusion coefficient (within DEM) is insufficient to describe sound propagation accurately. DEM requires a distance-dependent diffusion coefficient. A linear correction law, validated through field measurements, significantly improves agreement with measured data.
From an architectural perspective, these results demonstrate that elementary volumetric decisions-domical, elongated, coupled, or sequential—have measurable and sometimes critical consequences for sound distribution, reverberation, and acoustic comfort. By systematically reducing architectural complexity to basic geometric primitives, this research bridges acoustical modeling with architectural form-making, showing that geometry itself can act as an acoustic design parameter, even before material optimization.
Both ray tracing and DEM are effective computational tools for acoustics analysis; however, DEM offers the additional advantage of visualizing time-dependent sound energy flow, providing insights that are difficult to obtain from conventional scalar parameters alone. Thoughtful manipulation of architectural form can therefore support more efficient use of materials while achieving acoustically comfortable environments. By focusing on elementary forms and their combinations, this study re-examines the acoustic potential of architectural geometry. It provides design-relevant guidance for the early stages of acoustically informed building design.
Footnotes
Funding
The author received no financial support for the research, authorship, and/or publication of this article.
Declaration of conflicting interests
The author declared no potential conflicts of interest with respect to the research, authorship, and/or publication of this article.
Data availability statement
Data available on request from the authors: The data that support the findings of this study are available from the corresponding author, (ZSG), upon reasonable request.*