
Abstract
Speaking in poor acoustic conditions constitutes a risk factor for voice disorders. This study investigated how speaker’s comfort and vocal effort were affected during short speech tasks in four different room acoustic configurations. Voice recordings of the speech tasks and self-evaluations of the speaker’s comfort were collected from 15 participants in four room acoustic configurations as part of an acoustic refurbishment in a university lecture room. The influence of background babble noise and the use of a classroom sound field amplification system were also investigated. Results indicate that speaker’s comfort increased, and vocal effort decreased post-refurbishment, in configurations with reflectors or diffusers above the speaker position. Further, speaker’s comfort decreased, and vocal SPL and fo increased, indicating higher vocal effort, in conditions with background noise. Sex differences were observed both regarding vocal effort and speaker’s comfort in noisy conditions. Our results suggest that reflective materials above the speaker position, which enable more early reflections, are important for improving speaker’s comfort.
Keywords
Introduction
Poor room acoustics is one of the several risk factors identified for speakers, increasing voice problems and affecting working ability. 1 For occupational voice users, such as teachers and lecturers, poor room acoustics are associated with decreased health and well-being, 2 and despite room acoustics being an important part of effective teaching and learning, the acoustical conditions of the learning spaces are often suboptimal or even poor.3 –6 Another factor impacting both vocal health and well-being among teachers and the communication between teacher and student is excessive noise levels in classrooms.4,7,8 For teachers, voice disorders are two to three times more frequent compared to the general population. 9 The prevalence of voice disorders among university lecturers is likewise high compared to the general population (41% compared to 3%–9%). 10
Speakers modify their vocal behavior depending on the room’s acoustics and the listener’s distance.11,12 In learning spaces with poor room acoustics and noise, teachers typically increase their vocal sound pressure level (SPL) to increase the signal-to-noise ratio and compensate for the sound propagation losses.13,14 This tendency to increase SPL as a response to an increase in background noise levels, known as the Lombard effect, is involuntary. However, inhibition, to a certain extent, is possible with training.15,16 As with SPL, speakers also tend to increase their vocal fundamental frequency (fo, the average number of vocal fold collisions per second, expressed in Hertz) in spaces with poor room acoustics and increased distance to the listeners, which leads to an increase in vocal fold collisions and consequently higher vocal doses, 12 meaning higher exposure of the vocal fold tissue to vibrations. 17 Factors such as increased distance to the listeners and background noise increase the vocal demand for a speaker, leading to a vocal demand response with increased vocal effort. 18 Vocal effort can be defined in terms of both a physiological or perceptual effort, and from a vocal acoustic standpoint, an increase in vocal effort is characterized as an increase in both vocal SPL and fo. 19 Perceptually, vocal effort is characterized by an increased strain in the voice, 19 and associated with vocal pathologies such as hyperfunctional voice disorders. 20
While most of the research regarding teachers and room acoustics has focused on vocal health aspects, 2 a smaller sample of studies have reported associations between poor room acoustics and for example, workplace social climate, 21 increased stress, 22 decreased job satisfaction and motivation, 23 as well as burnout, 24 suggesting that in addition to voice problems, other health-related issues might arise from teaching in an acoustically poor environment. The effect of poor room acoustics on students is well-documented by recent reviews by Mealings,8,25 –27 and while students’ performance, behavior, and well-being suffer from poor classroom acoustics, students might also be indirectly affected by poor room acoustics, since teachers’ hoarse (dysphonic) voices affect the young student’s ability to process information.28,29 Learning is even more negatively affected when university students listen to a dysphonic voice in an acoustically poor environment. 30
A speaker’s perception of their voice is influenced by the surrounding acoustics. Speaker’s comfort is characterized as the speaker’s subjective impression of when the spoken message reaches the listener effectively, with little or no vocal effort. Factors influencing speaker’s comfort include room acoustic support, speech intelligibility, and sensory-motor feedback from the speaker’s phonatory apparatus.31,32 Since most speakers will intuitively try to regulate their voice for the listener to hear them properly, listener feedback also plays an important role in speaker’s comfort and voice regulation.12,32 Traditionally, most studies concerning classroom acoustics have looked at the effect of room acoustics from the listeners’ point of view. Consequently, acoustic parameters such as reverberation time and speech clarity (C50), which best describe the room from the listeners’ point of view, have been used to assess the room’s acoustics. However, previous research has suggested that good classroom acoustic conditions from the listener’s perspective, including lower reverberation times and higher speech clarity, do not automatically imply better acoustic conditions for the speaker.12,33
Due to the numerous confounding factors in real-world environments, studying the relationship between speaker’s comfort, vocal behavior, and room acoustics has been challenging. To address this, laboratory research has been employed to examine the impact of room acoustics on speakers.12,34 While this approach provides valuable insights into room acoustics, a key limitation is the laboratory setting in itself, as visual aspects of the room also influence vocal behavior.12,34 Another factor is the mode of speech used in different studies, as it has previously been found that participants adapted their speech differently depending on whether they were reading or lecturing. 35 While acoustic refurbishments in learning spaces have been suggested to increase well-being, reading, attention, and speech perception for students, 36 only a handful of studies have looked at how the speaker is affected by the room acoustics in real-life teaching settings in the context of an acoustic refurbishment of the classroom, although only using subjective measures. In these studies, the common result was that the teacher’s perception of disturbing ambient noise decreased post-refurbishment, while the effect on vocal symptoms was mixed.37 –39 While most of the acoustic treatments include the addition of sound absorbers on ceilings and walls, a few studies have investigated how reflective materials, such as plasterboards or diffusers, above the speaker position affect the room’s acoustics, with the intention to increase early reflections, especially to the back of the room.40 –42 Diffusers were especially effective in increasing the rate of early reflections to the back of the room.42,43 Furthermore, one study reported that ceiling diffusers increased speech clarity (C50) in the back of the classroom while overall decreasing reverberation time (T20) and increasing sound strength (G). 41 However, further investigation is required to assess whether reflective materials in front of the classroom benefit the speaker as well.
An alternative way to enhance the speaker’s signal is via a sound field amplification system (SFAS). The SFAS is essentially a public address (PA) system, but unlike a regular PA system, it enhances specific frequencies important for speech sound, making speech more intelligible, and increasing the signal-to-noise ratio in the learning spaces. Nevertheless, SFAS does not seem to provide benefit for listeners in poor room acoustic conditions with long reverberation times,44,45 and a classroom reverberation time of <1 has been suggested as a limit. 46 Although most research regarding the benefits of SFAS, like the research on room acoustics, has focused on the listeners’ perspective rather than the speakers’, a few studies have reported positive results through self-reports on vocal effort and well-being,47,48 as well as a decrease in vocal parameters fo and SPL, indicating less vocal effort for teachers using an SFAS.49,50
Specific aims of the study
Poor classroom acoustics is detrimental to the learning space as it interferes with the communication between the teacher and student. Acoustic interventions could be a solution. We aimed to investigate the relationship between speaker’s comfort and vocal effort in an ecologically valid environment using both self-assessments of comfort and voice data of vocal effort. Therefore, the purpose of this study was to investigate the effects of different room acoustic configurations, both with and without reflective materials above the speaker, non-semantic background babble noise, and an SFAS on:
Self-rated speaker’s comfort
Vocal effort, measured as changes in mean SPL, as well as changes in mean, and mode fo
Perceived SFAS benefit
Participants’ task experience, for example, whether they thought they succeeded in the speech task or thought the task was fun
Another purpose was to investigate whether there is an interaction between background noise and room acoustics/SFAS use as well as possible sex differences between participants.
Methods
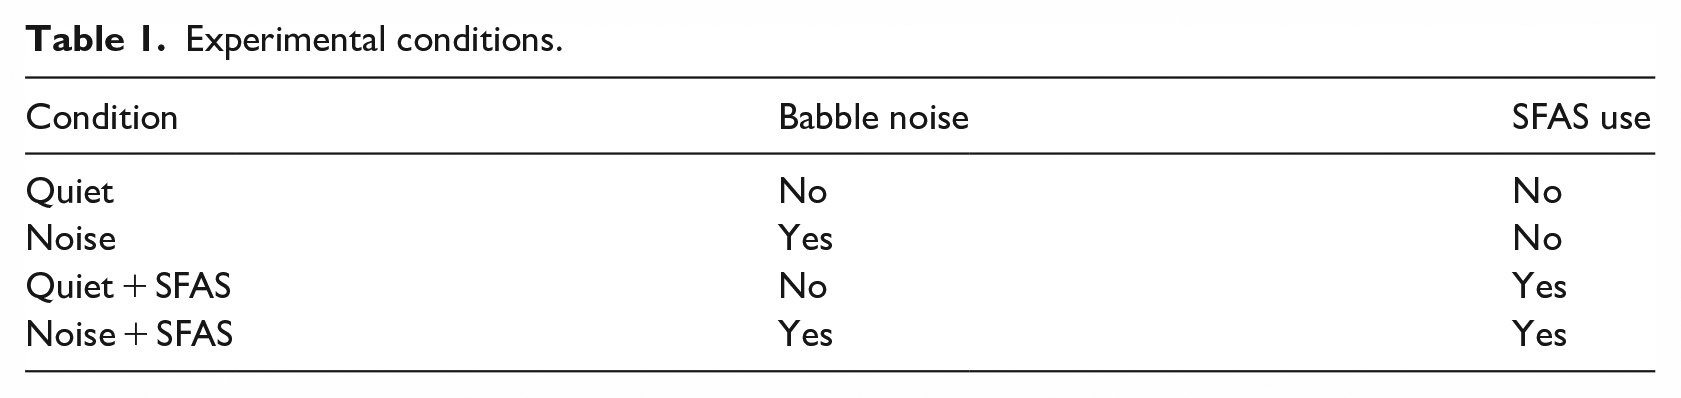
This experimental field study was conducted as a repeated-measures design in a university lecture room undergoing a three-step acoustic refurbishment, with 5–8 weeks between each step. The participants performed sets of three different speech tasks in front of a small audience (1–4 people) in four different room acoustic configurations, including before the acoustic refurbishment (configuration 1) and at each step of the acoustic refurbishment (configurations 2–4), resulting in four different data collection points. At each data collection point, participants performed all speech tasks in four different experimental conditions in a randomized order. The experimental conditions (Table 1) included the addition of background babble noise and an SFAS versus no background babble noise or an SFAS. For the study design, see Figure 1. Before data collection, the study received approval from the Ethics Committee for Psychology and Speech and Language Pathology at Åbo Akademi University.
Experimental conditions.
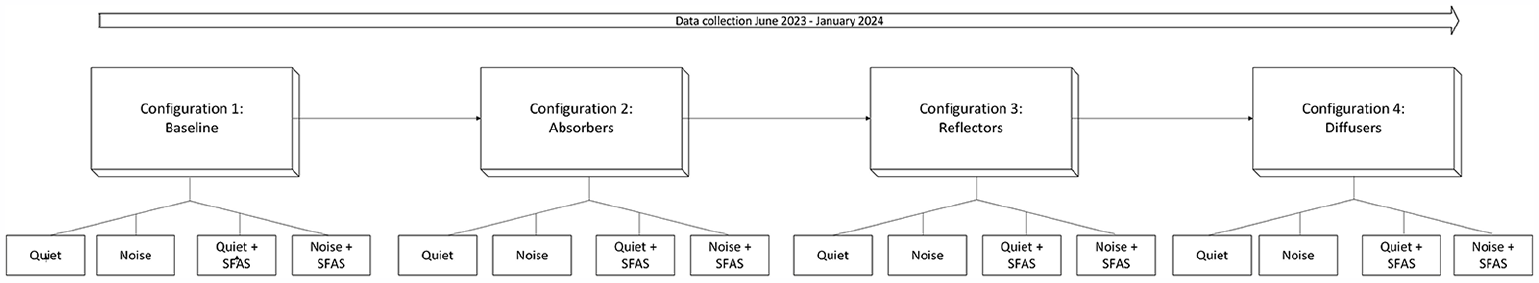
The study design.
Acoustic refurbishment and room acoustic parameters
The lecture room, with the dimensions 7.2 m × 5.6 m × 4.1 m, had a floor with linoleum laid over concrete. The outer walls and back wall were made of stone, while the lectern wall and corridor walls were made of plaster. In configuration 1 (baseline, pre-refurbishment), the lecture room had 20 mm thick fixed porous absorbers on the walls (11.5 m2) and 40 mm thick fixed porous absorbers on the ceiling (11.5 m2). In configuration 2 (absorbers), old absorbers from walls were removed and replaced with 40 mm thick sound-absorbing wall panels on two walls (7.8 m2), and a suspended ceiling with 40 mm thick, porous absorbers was installed between ceiling beams (o.d.s. 300 mm) with two additional layers (50 + 50 mm) of low-frequency porous absorbers above the suspended ceiling. Additionally, an empty grid ceiling was installed above the speaker position, approximately 74 cm below the ceiling. In configuration 3 (reflectors), 3 × 8 flat gypsum panels with 12.5 mm thickness (Gyproc GNE) were installed in the grid. The room was otherwise kept in the same condition as in configuration 2. In configuration 4 (diffusers), the gypsum panels were replaced by 3 × 8 wooden, vertically oriented diffusers with directional properties, facilitating the comparison of two different kinds of reflection properties between configurations 3 and 4. The wooden diffusers had the dimensions 600 mm × 600 mm × 100 mm and were painted white to prevent them from altering the room’s lighting. For the configurations, see Figure 2. For more information on the diffusers, see the work by Arvidsson et al., 41 and for more detailed information on the acoustic configurations, see conference paper by Christensson. 51
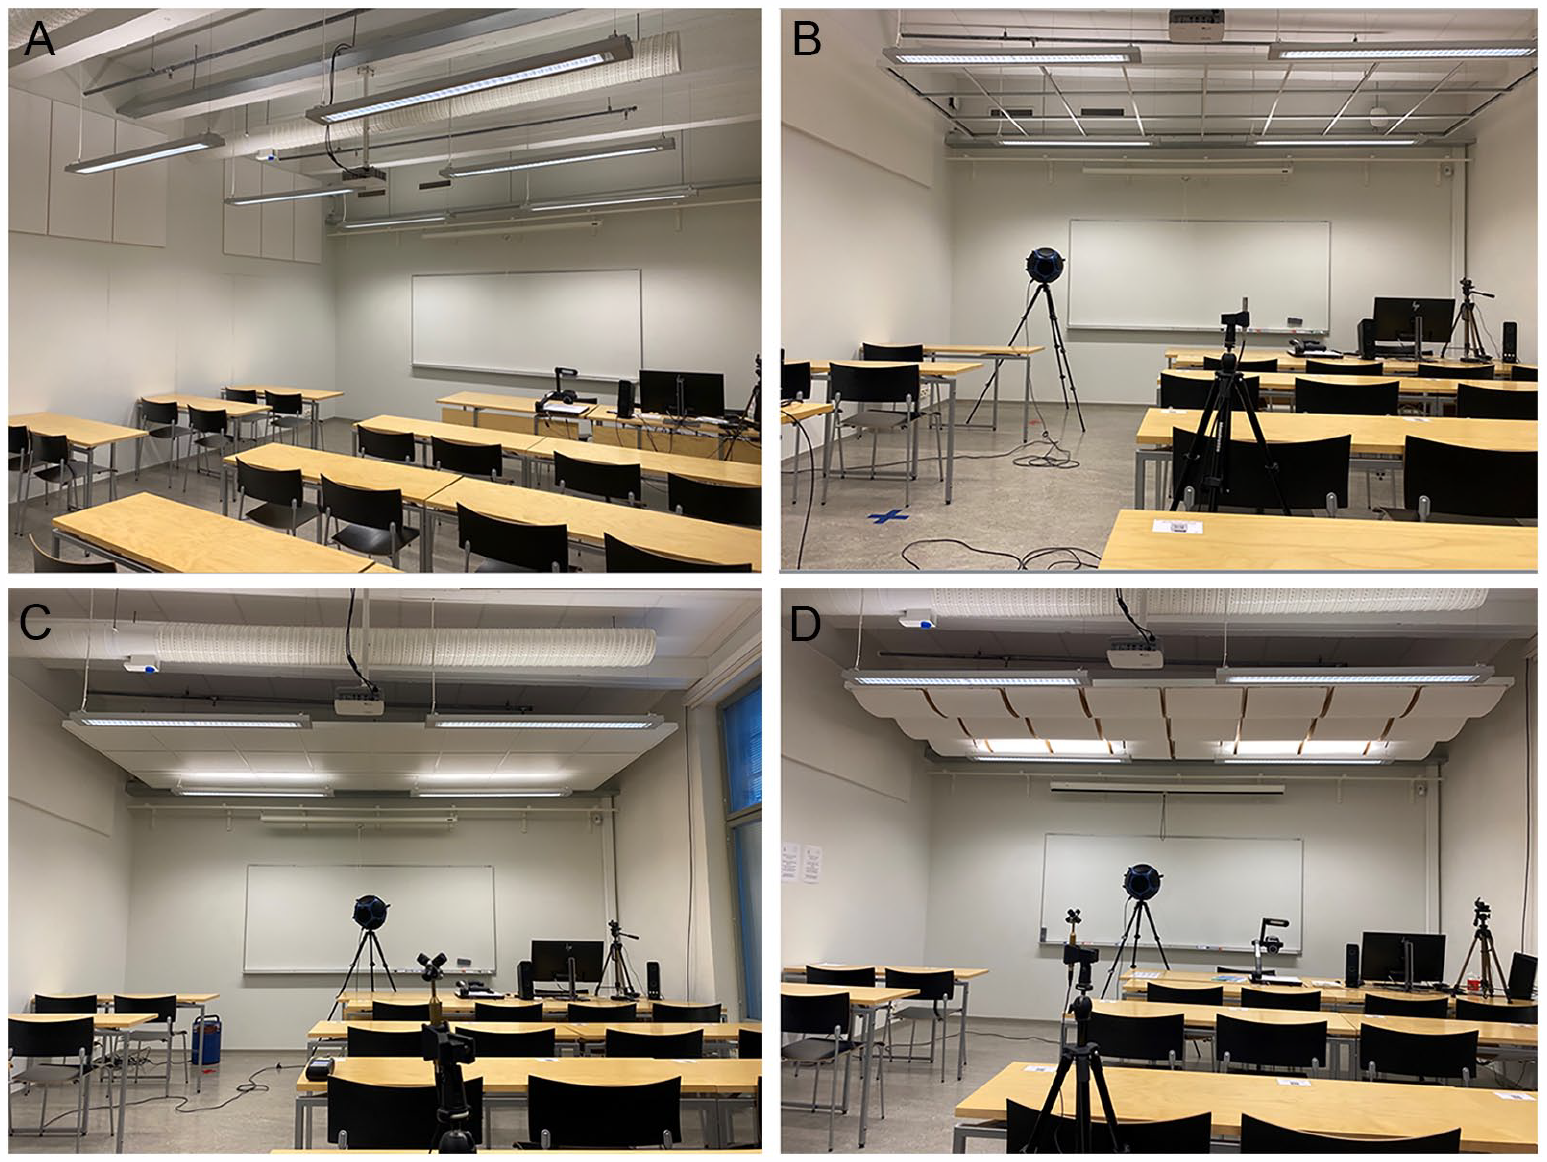
Photos of the lecture room in all configurations of the acoustic refurbishment. A = Baseline, B = Absorbers, C = Reflectors, D = Diffusers.
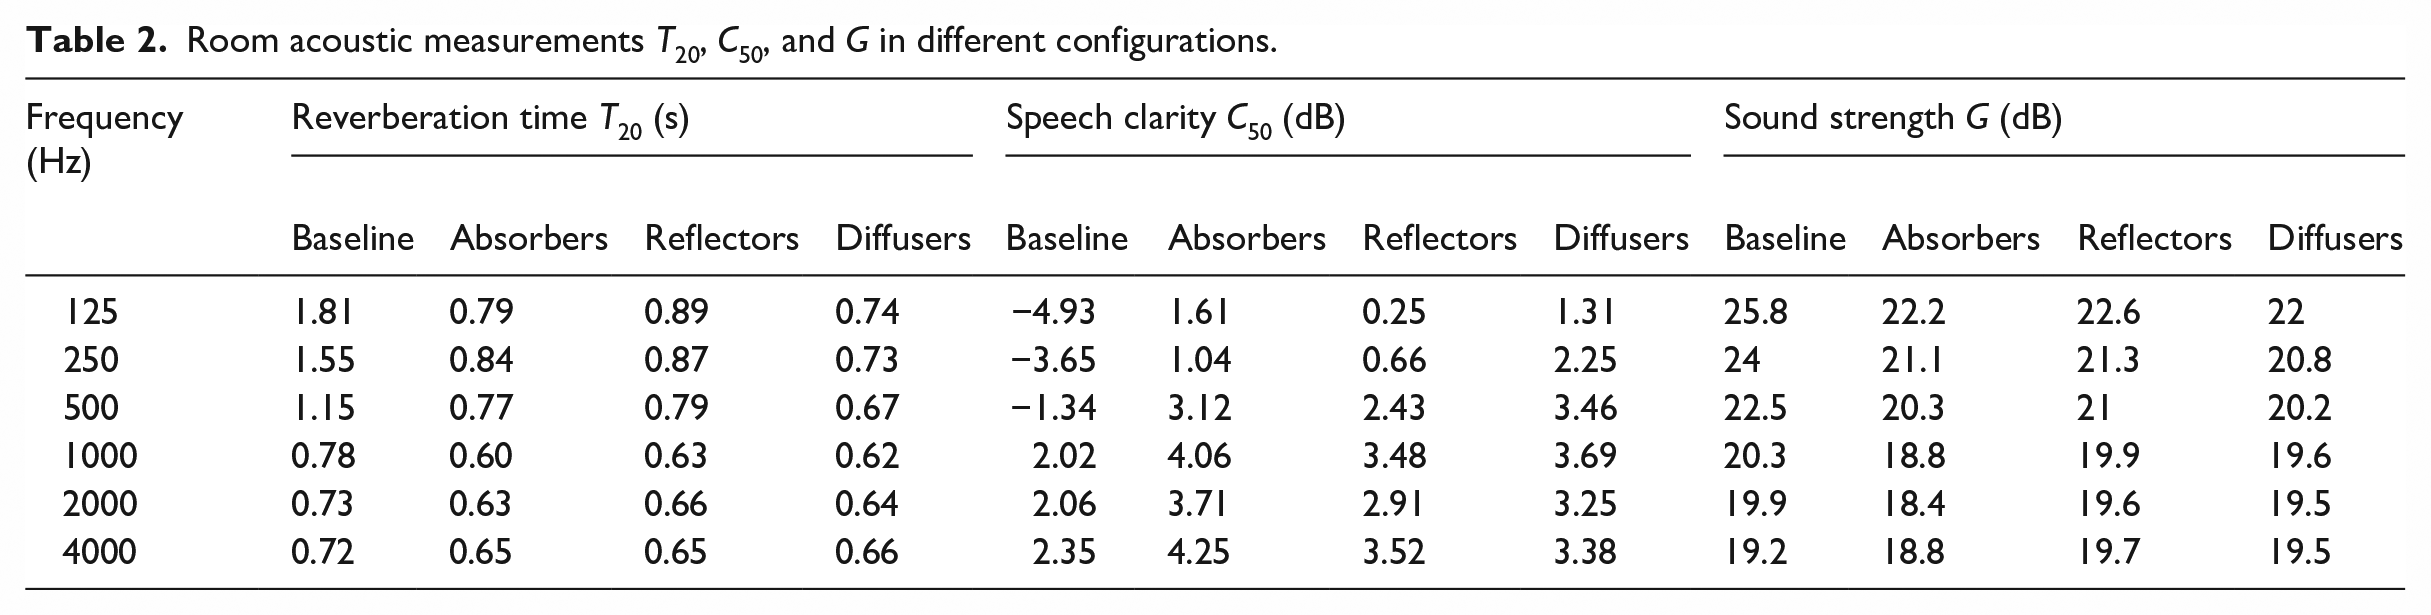
Reverberation time (T20), speech clarity (C50), and sound strength (G) were measured in baseline and all the steps of the acoustic refurbishment. Measurements were performed using IRIS by Akustikbüro K5 GmbH (Berlin, Germany). Two source positions and six receiver positions were used, see Figure 3 for positions. T20 and C50 were measured using an omnidirectional loudspeaker. G was measured using a constant sound power source placed on the floor. The measurements covered the octave bands of 125–4000 Hz averaged over source and microphone positions. See Table 2 for measurements of T20, C50, and G respectively in all the room acoustic configurations.
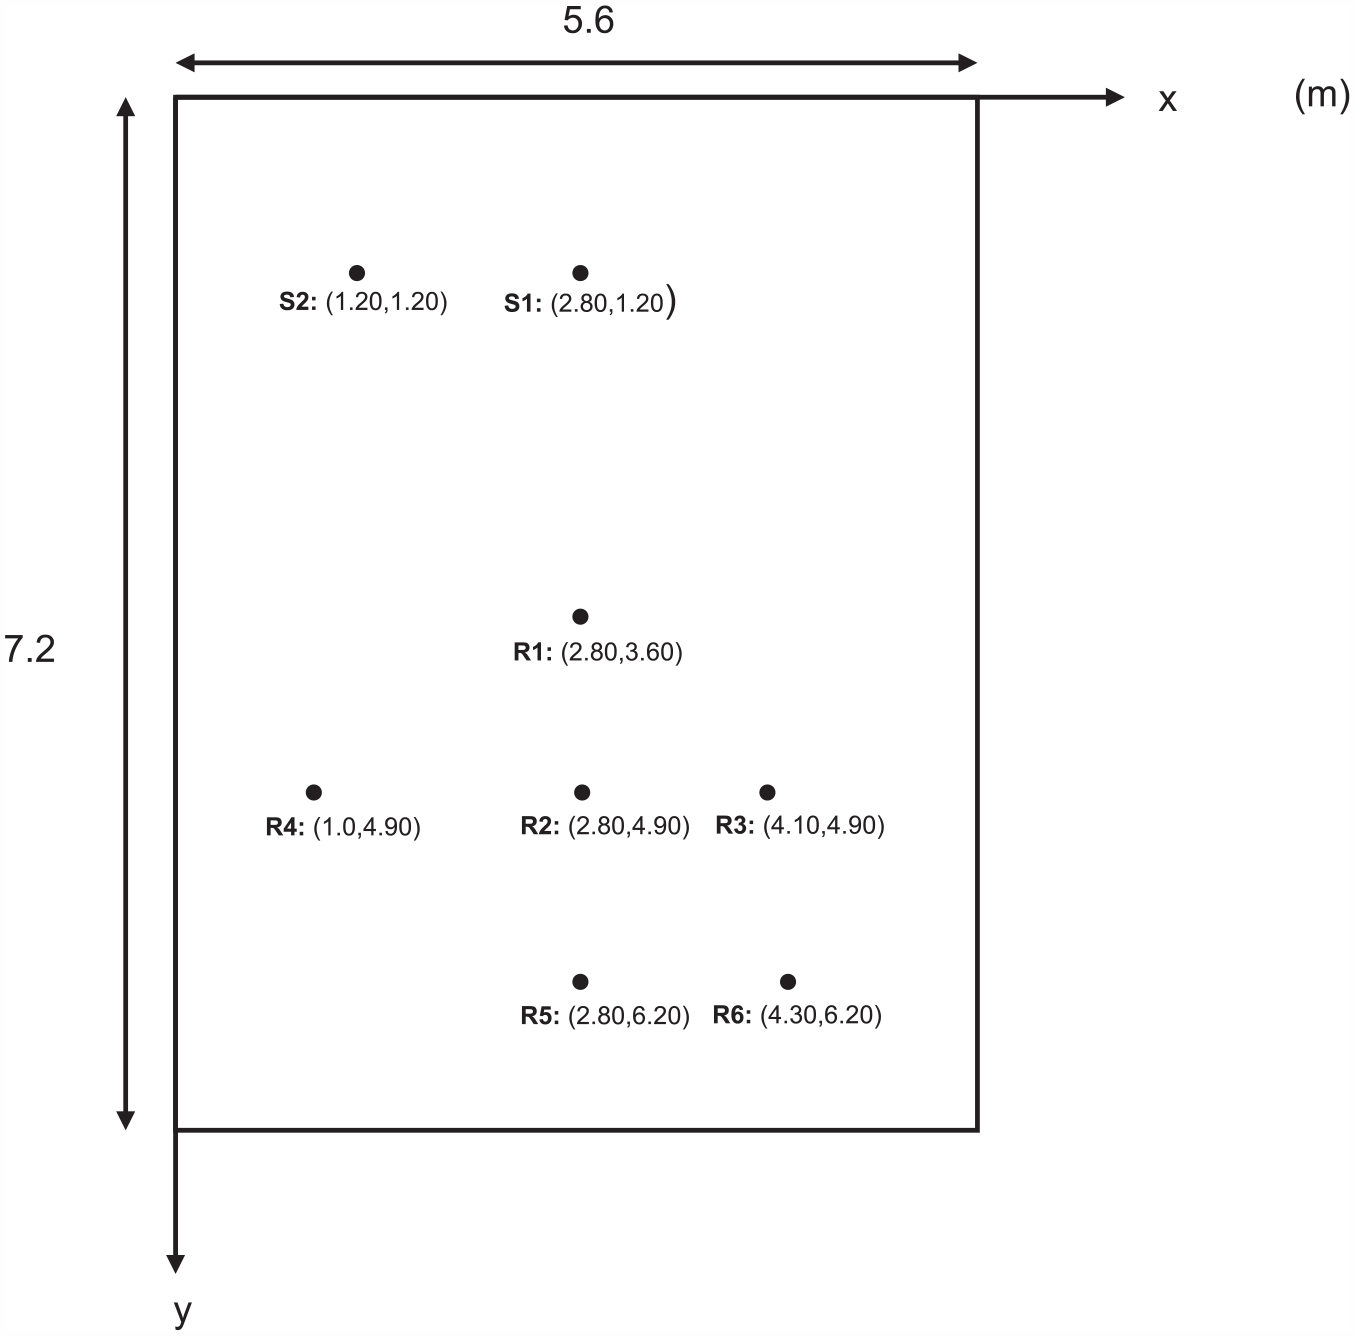
Room dimensions, source positions S1–S2, and receiver positions R1–R6.
Room acoustic measurements T20, C50, and G in different configurations.
Participants
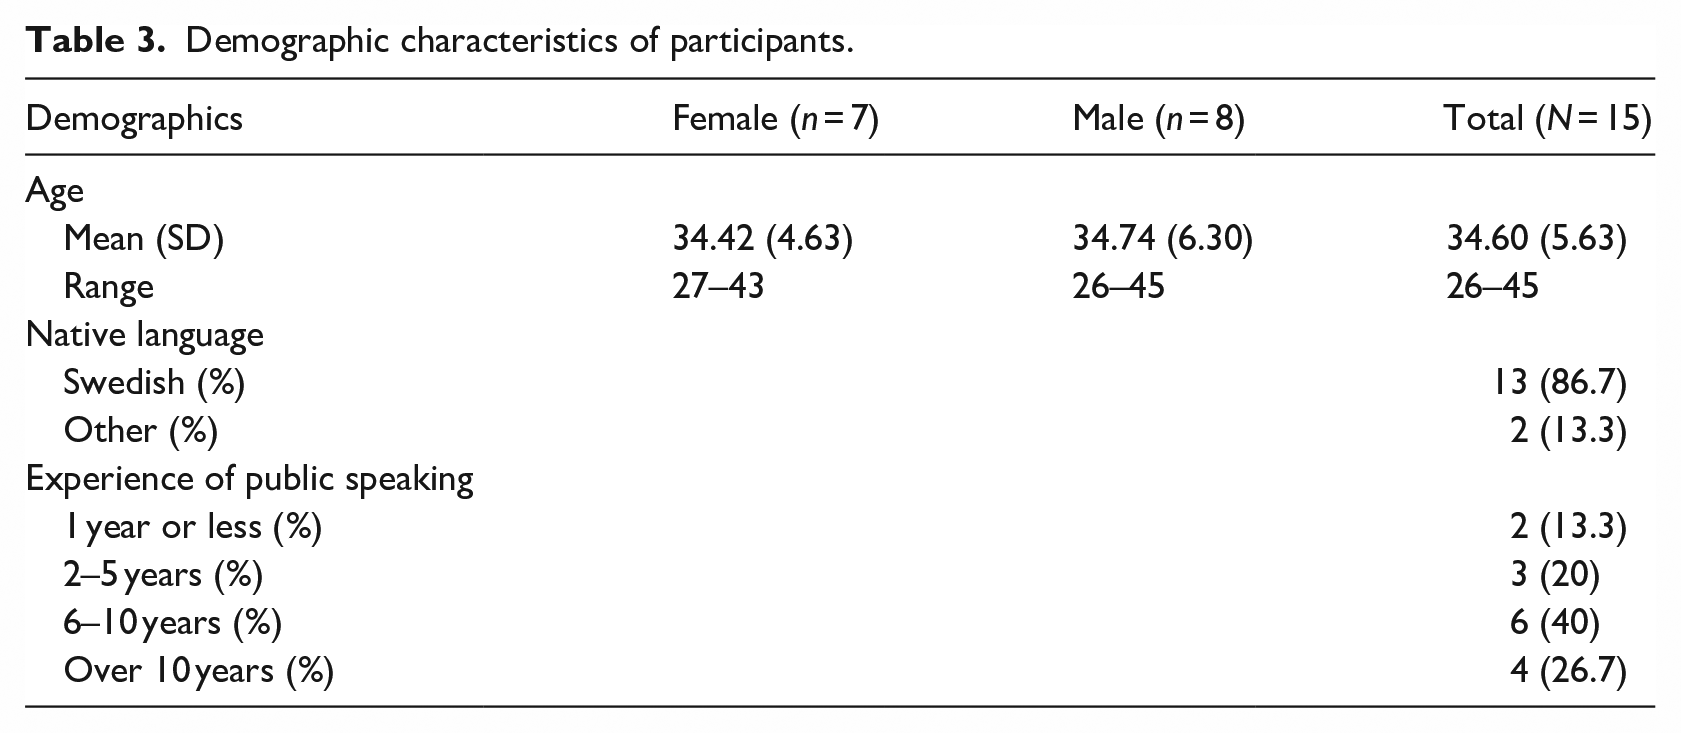
Fifteen participants (seven females and eight males, average age 34.6, range 26–45 years, SD = 5.63) with previous experience in public speaking (e.g. lecturing, teaching, giving presentations), and no known voice pathology were recruited via convenience sampling (Table 3). All participants spoke Swedish fluently. Participants were asked to fill out a background form including questions about vocal health and well-being at every step of the acoustic refurbishment. One participant reported a mild, undiagnosed self-perceived unilateral hearing impairment. All other participants reported normal hearing. Ten of the 15 participants participated in all 4 data collection points, while 5 participants in total only participated in 3 of the 4 data collections.
Demographic characteristics of participants.
The experimental study: audience, speech tasks, and experimental conditions
The audience consisted of a research leader, a research assistant who also participated as a mock listener, and participants recruited for the study as listeners. The distance to the listeners was kept constant, and distances from the lectern wall to listener seats ranged between 3.5 and 6 m. Participants (speakers) were positioned in front of the lecturer’s table and were free to move from behind to beside the table during speech tasks (see Figure 4 for the experimental setup). The inclusion criteria for the recruited listeners included self-reported normal hearing. The first speech task consisted of a describe-and-draw task inspired by Sjølund’s textbook, 52 where the participant had to describe a complicated geometric figure to the listener. The participants were instructed to explain as much of the figure as possible within a maximum of 3 min, and if participants had not completed the task, they were interrupted by the researcher at a suitable time after approximately 3 min had passed. In the second speech task, the participant gave an approximately 3-min-long oral presentation of an exotic or fantasy animal using presentation slides unfamiliar to the participant. Before starting the oral presentation, the participants prepared for the task by reading a one-page information paper on the animal in English, but all speech tasks were performed in Swedish. The participants were instructed to present as freely as possible and only use the presentation slides as support. As the final task, the participants performed a Stroop task with 40 trials immediately after the oral presentation. The results concerning the Stroop task will not be reported in this paper.
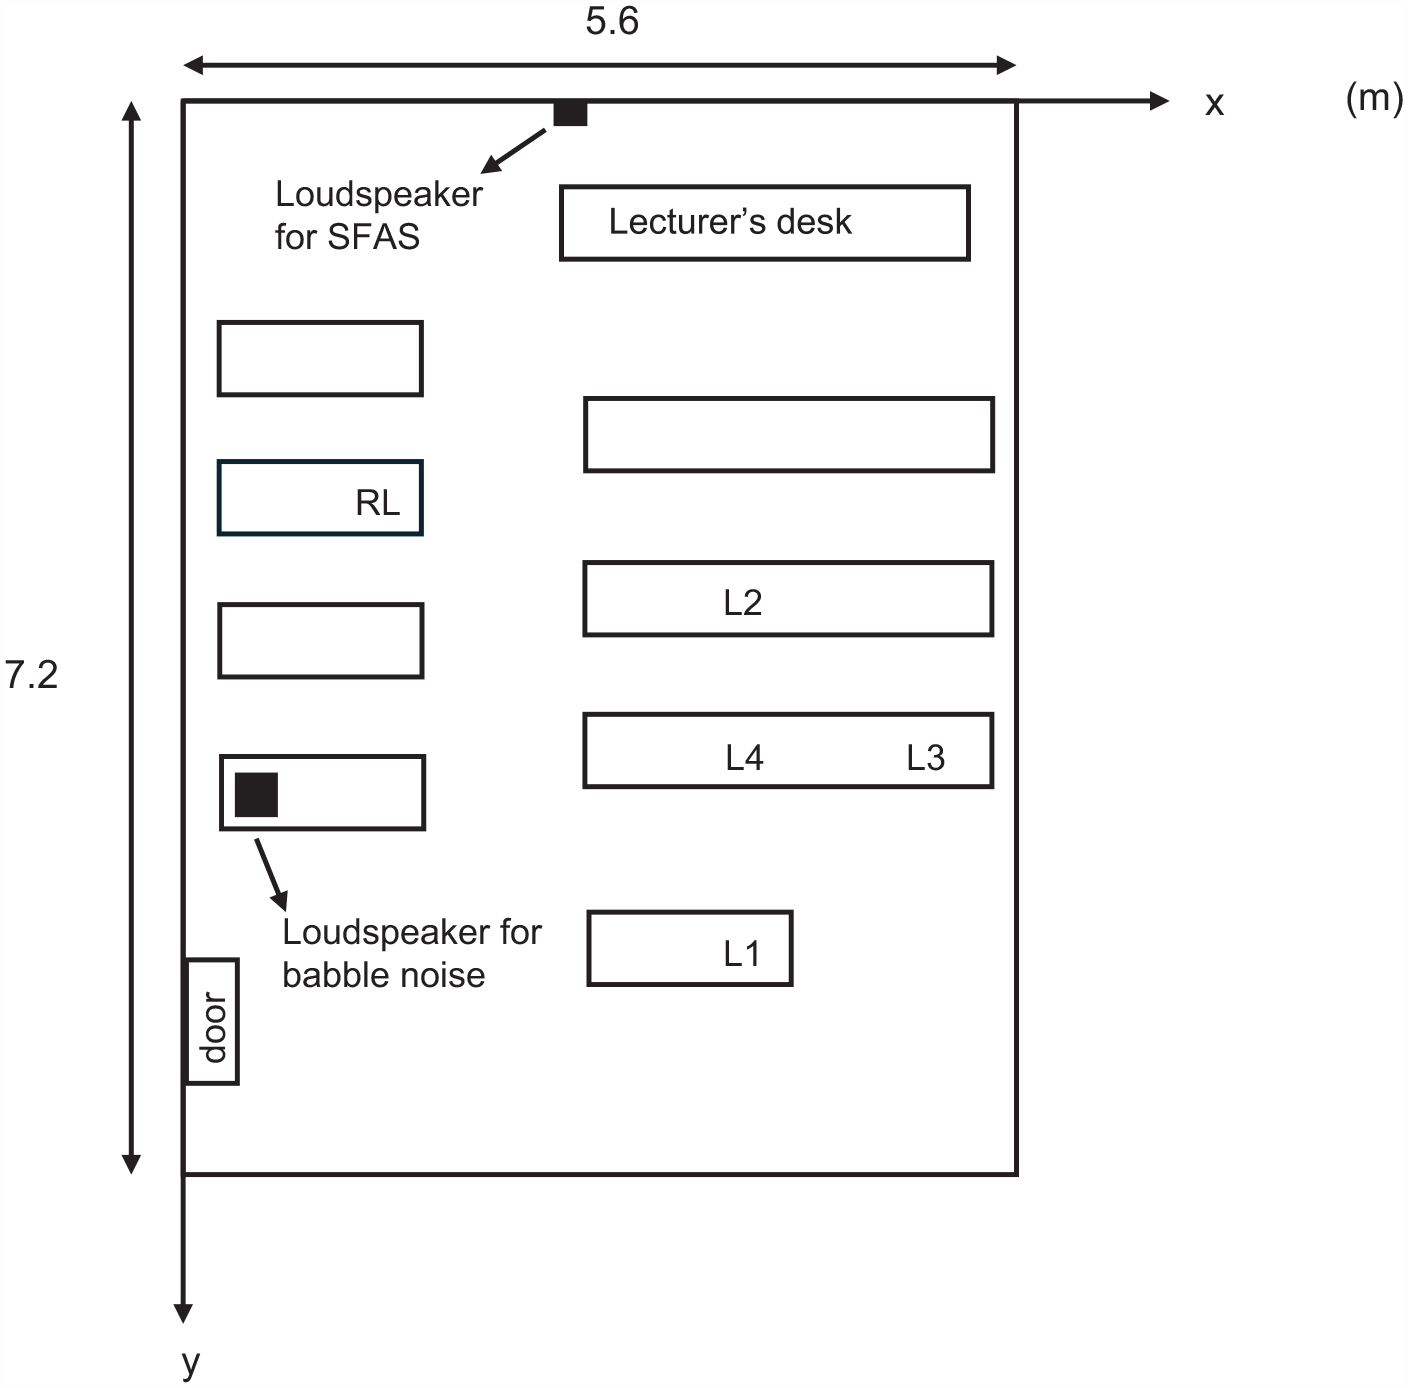
The experimental setup. RL = Research leader’s position. L1–L4 = listener positions.
The experimental conditions included the addition of non-semantic multi-talker babble noise of 50 dB (A) at the speaker’s position (fo (mean) = 143 Hz, fo (mode) = 110 Hz, frequency range = 49–554 Hz) from a loudspeaker (Fostex 6301B personal monitor) that was placed on a table in the back of the room, right beside the door, and the sound field amplification system Vox Duo (Sensio Vestfold, Sandefjord, Norway) with the loudspeaker placed right behind the speaker, on a stool, in front of the lecture room’s whiteboard. The loudspeaker position was chosen based on previous research that indicates that a congruence between the speaker and the loudspeaker position is favorable for the listener. 53 Additionally, we aimed to increase speaker support by placing the loudspeaker behind the participant. A different variation of the speech tasks was used in every condition, and the order was randomized for each participant. Participants did a practice task in the first data collection point (configuration 1) before starting with the actual speech tasks.
The background form and questionnaire
The participants answered a background form before the speech tasks in each configuration. The background form included questions about vocal health, vocal symptoms, and well-being as well as demographic questions. Perceived stress, vocal health, sleep quality, well-being, physical fatigue, and psychological fatigue were all controlled for by self-assessment in the background form using a VAS scale. Friedman’s ANOVA of the background variables indicated that the aforementioned self-assessed factors did not significantly differ across the data collection points. See Supplemental Table S1 in the Supplemental Material for the results of Friedman’s ANOVA for each background variable.
Immediately after the speech tasks, the speakers were asked to rate their perceived speaker’s comfort using a questionnaire developed based on previous research.54,55 The questionnaire consisted of 10 questions regarding speaker’s comfort and the perception of the speech tasks, which were answered using a 5-point Likert scale, range 0–4. The questions included were (1) The room helped me to speak comfortably, (2) I had to make an effort to be heard in the room, (3) My voice got tired after the task, (4) My voice reverberated in the room as I spoke, (5) It felt like my voice was muffled by the acoustics of the room, (6) The sound environment in the room made me tired, (7) I succeeded well with the task I was asked to perform, (8) I needed to make an effort to perform as I did, (9) The task made me feel insecure, irritated, or stressed, and (10) The task was fun. Also, two questions regarding the use of the SFAS were answered with a 5-point Likert scale after experimental conditions that included the SFAS. These questions were The sound field amplification system helped me to speak comfortably and The sound field amplification system was irritating to use.
Voice recordings
Voice recordings of the speech tasks were collected using a head-mounted omnidirectional and calibrated microphone (Sennheiser MKE 2 P-C) placed 10 cm from the participant’s mouth, as well as an H5 digital recorder (Zoom corporation, Tokyo, Japan). The voice recordings were analyzed using RecVox Version 0.0.0.22 for Windows, freely available and downloaded from tolvan.com, which yielded phonetograms of the recorded voice. Since RecVox has an algorithm for automatic background noise detection, pauses were automatically excluded from all vocal parameters. In order to exclude background noise and speech pauses from the phonetograms, the background noise detection range was set to 25–60 dB. Despite RecVox’s automatic background noise detection, background babble noise still appeared in the phonetograms of some voice recordings. In certain cases, the noise formed a distinct area that was excluded from the vocal parameter calculations. However, in other cases, it was integrated into the phonetogram alongside the participant’s voice, requiring manual exclusion of pauses. Vocal parameters for the two speech tasks, describing a geometric figure and the oral presentation, were analyzed separately. The mean duration of the describe-and-draw task was 133 s (range 30–264), and 151 s (57–282) for the oral presentation task. There was a significant difference between the length of the tasks, as the describe-and-draw task had a duration of, on average, 18 s less than the oral presentation (t(219) = −4.58, p < 0.001, 95% CI: (−25.77, −10.26)). The first and last 5 s were edited out from the voice recordings of each task, as well as speech from the research conductors and any deviant sounds including loud noise from a chair, ringing from a phone, and prolonged laughter from one participant.
Statistical analysis
To operationalize speaker’s comfort, an exploratory factor analysis of the items in the self-assessment questionnaire regarding speaker’s comfort was conducted using R software version 4.3.2 56 with libraries corpcor 57 for multicollinearity assessment and correlation matrix; psych 58 and GPArotation 59 for factor analysis; and sjPlot 60 for data visualization. Eight out of a total of 10 items from the questionnaire were used for factor analysis with oblique rotation (Direct Oblimin). An analysis with eigenvalues over Kaiser’s criterion of 1 gave a two-factor solution that explained 53.53% of the variance. The items that cluster around the same factors suggest that factor 1 (Voice) represents how the participant perceived the room acoustics and how the room acoustics affected their vocal behavior, while factor 2 (Task experience) represents how the participant perceived the task in itself. As a final step, negative items were converted to positive values so that all items within each factor reflected the same direction. The sum scores for the factors Voice and Task experience were then calculated and converted to standardized scores (z-scores). Higher z-scores in factors Voice and Task experience imply higher speaker’s comfort and task experience respectively. See Table 4 for the questionnaire items included in factors Voice and Task experience. More detailed information on the factor analysis can be found in the Supplemental Material.
Questionnaire items included in the final factors.
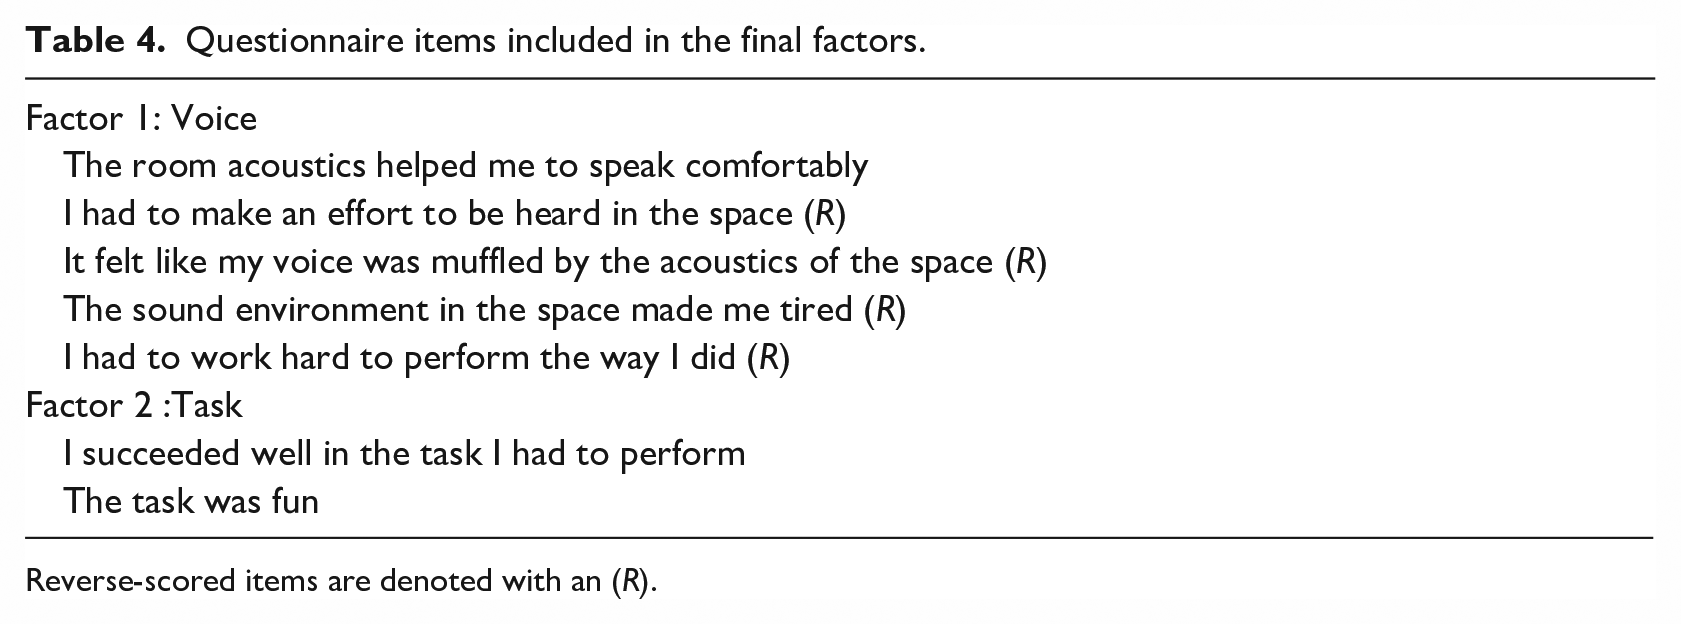
Reverse-scored items are denoted with an (R).
To investigate the effect of room acoustics, noise, and SFAS use on speaker’s comfort, task experience, and vocal effort, the data were analyzed using linear mixed-effects models in R version 4.3.2 with the libraries lme4 61 for statistical modeling; ggeffects, 62 ggplot2, 63 and sjPlot 60 for data visualization; lmerTest 64 for p-values; and emmeans 65 for pairwise comparisons. Outcome variables included speaker’s comfort (factor Voice standardized sum scores), task experience (factor task experience standardized sum scores), and vocal parameters SPL (mean) and fo (mean and mode). Outcome variables with skewed distributions were transformed to make the distributions more normal. Vocal parameters were analyzed separately for both speech tasks. For variables fo (mean) and fo (mode), the best-fitted model exhibited heteroscedasticity due to sex differences in fo. Hence, we decided to use a variance-adjusted model using the package nlme with the varIdent function, 66 which improved the models’ fit. In all models, participant was considered a random effect to account for within-participant variation, while fixed effects included Room acoustics, Background babble noise, Sex, and SFAS use, lmer notations parameter ~ (Configuration + babble noise + SFAS + Sex)^3 + (1|ID) and parameter ~ (Configuration + babble noise + SFAS + Sex)^2 + (1|ID). Models with two- or three-way interactions were compared for all outcome variables since interactions between independent variables were part of our research questions. Participants’ age was included as a fixed effect in models where the outcome variable had a significant correlation with age, and the addition of age improved the model’s fit. A categorical variable representing different configurations was used to examine the effect of room acoustics on all outcome variables instead of the continuous variables T20, C50, and G, due to the strong multicollinearity between the acoustic parameters. Because one participant reported an undiagnosed unilateral hearing impairment, we reanalyzed the best-fitted models for each outcome variable without this participant. The results remained similar to those including all participants. Model summaries for these analyses are provided in the Supplemental material (Supplemental Tables S4–S9). Models were assessed using the analysis of variance function and comparing the Akaike information criterion (AIC) so that the lower the AIC score, the better the model fit. 67 Model assumptions were checked using the R package performance. 68 In this study, p-values < 0.05 were considered statistically significant.
Results
Speaker’s comfort
The best-fitted model for Voice (z-scores) suggests a main effect of room acoustics in both the configuration with reflectors (0.81, 95% CI: (0.30, 1.32), t = 3.13, p = 0.002) and diffusers (0.64, 95% CI: (0.12, 1.17), t = 2.41, p = 0.017), as well as a main effect of babble noise (1.63, 95% CI: (1.19, 2.07), t = 7.36, p < 0.001). According to the model, participants’ self-perceived speaker’s comfort showed a significant increase in configurations with the reflectors and diffusers compared to baseline. However, post hoc tests showed no significant difference in pairwise comparisons of the reflector and diffuser configurations (0.067, SE = 0.121, t(92.2) = 0.554, p = 0.5807). The model also revealed an interaction between the sex of the participant and babble noise (−0.55, 95% CI: (−0.88, −0.23), t = −3.36, p = 0.001), suggesting that for acoustic conditions with no additional background babble noise, both males and females rated their speaker’s comfort similarly, whereas, in conditions with background babble noise, the speaker’s comfort for females decreased to a greater extent compared to males (Figure 5). See Table 5 for a summary of the model for factor voice.
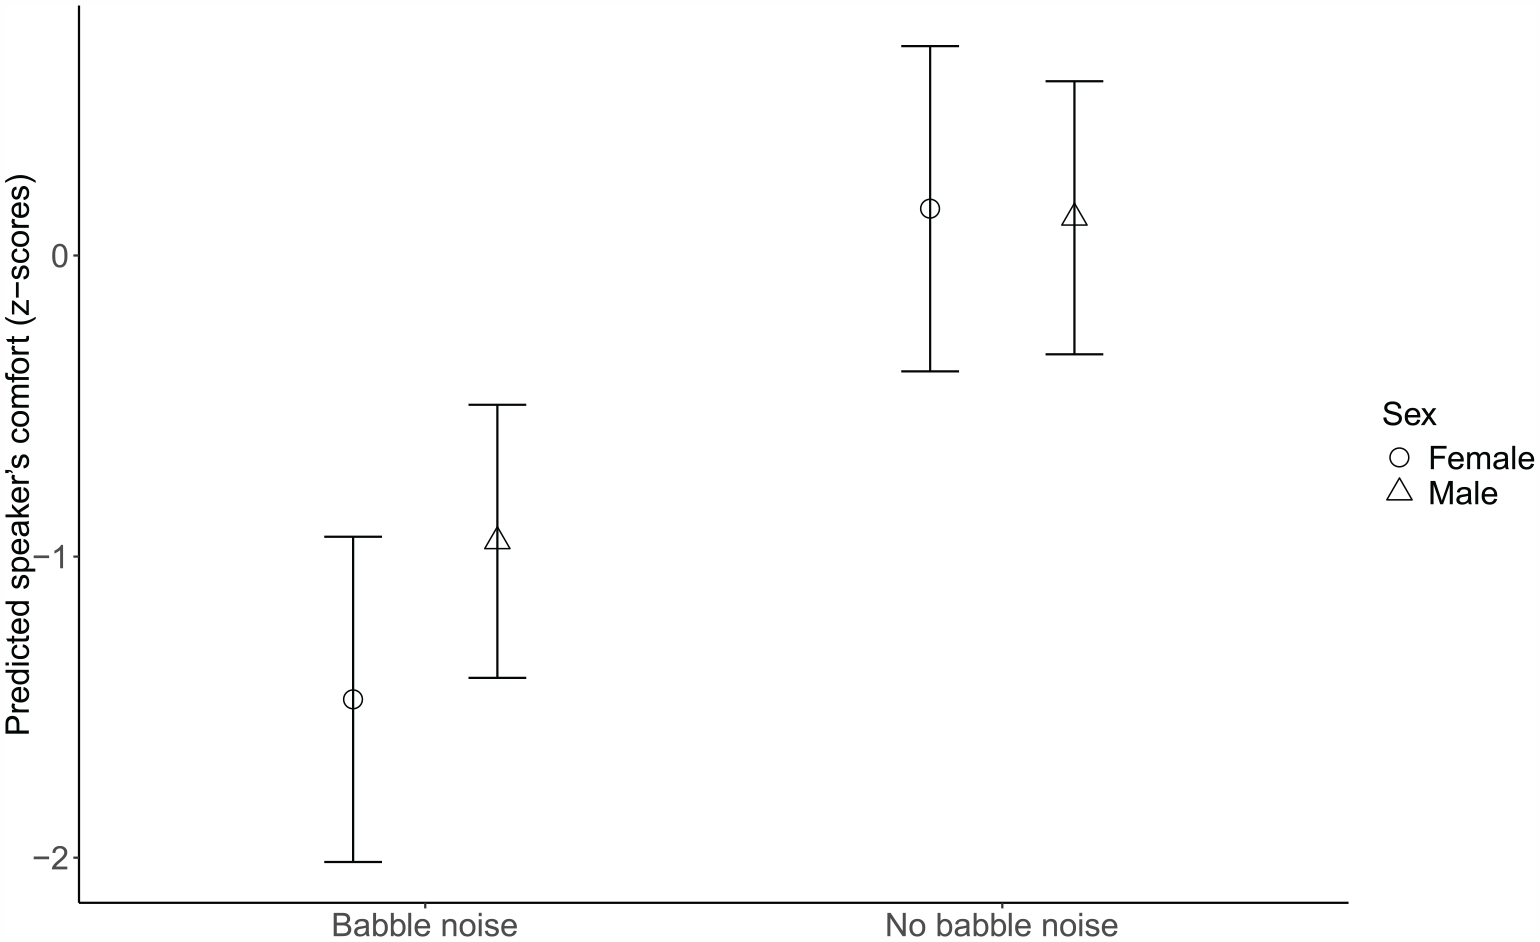
Speaker’s comfort (z-scores) as a function of babble noise and sex. Higher scores in the outcome variable stand for increased speaker’s comfort. Error bars represent 95% confidence intervals.
Factor voice (z-scores) as a function of room acoustics, background babble noise, sex, and SFAS.
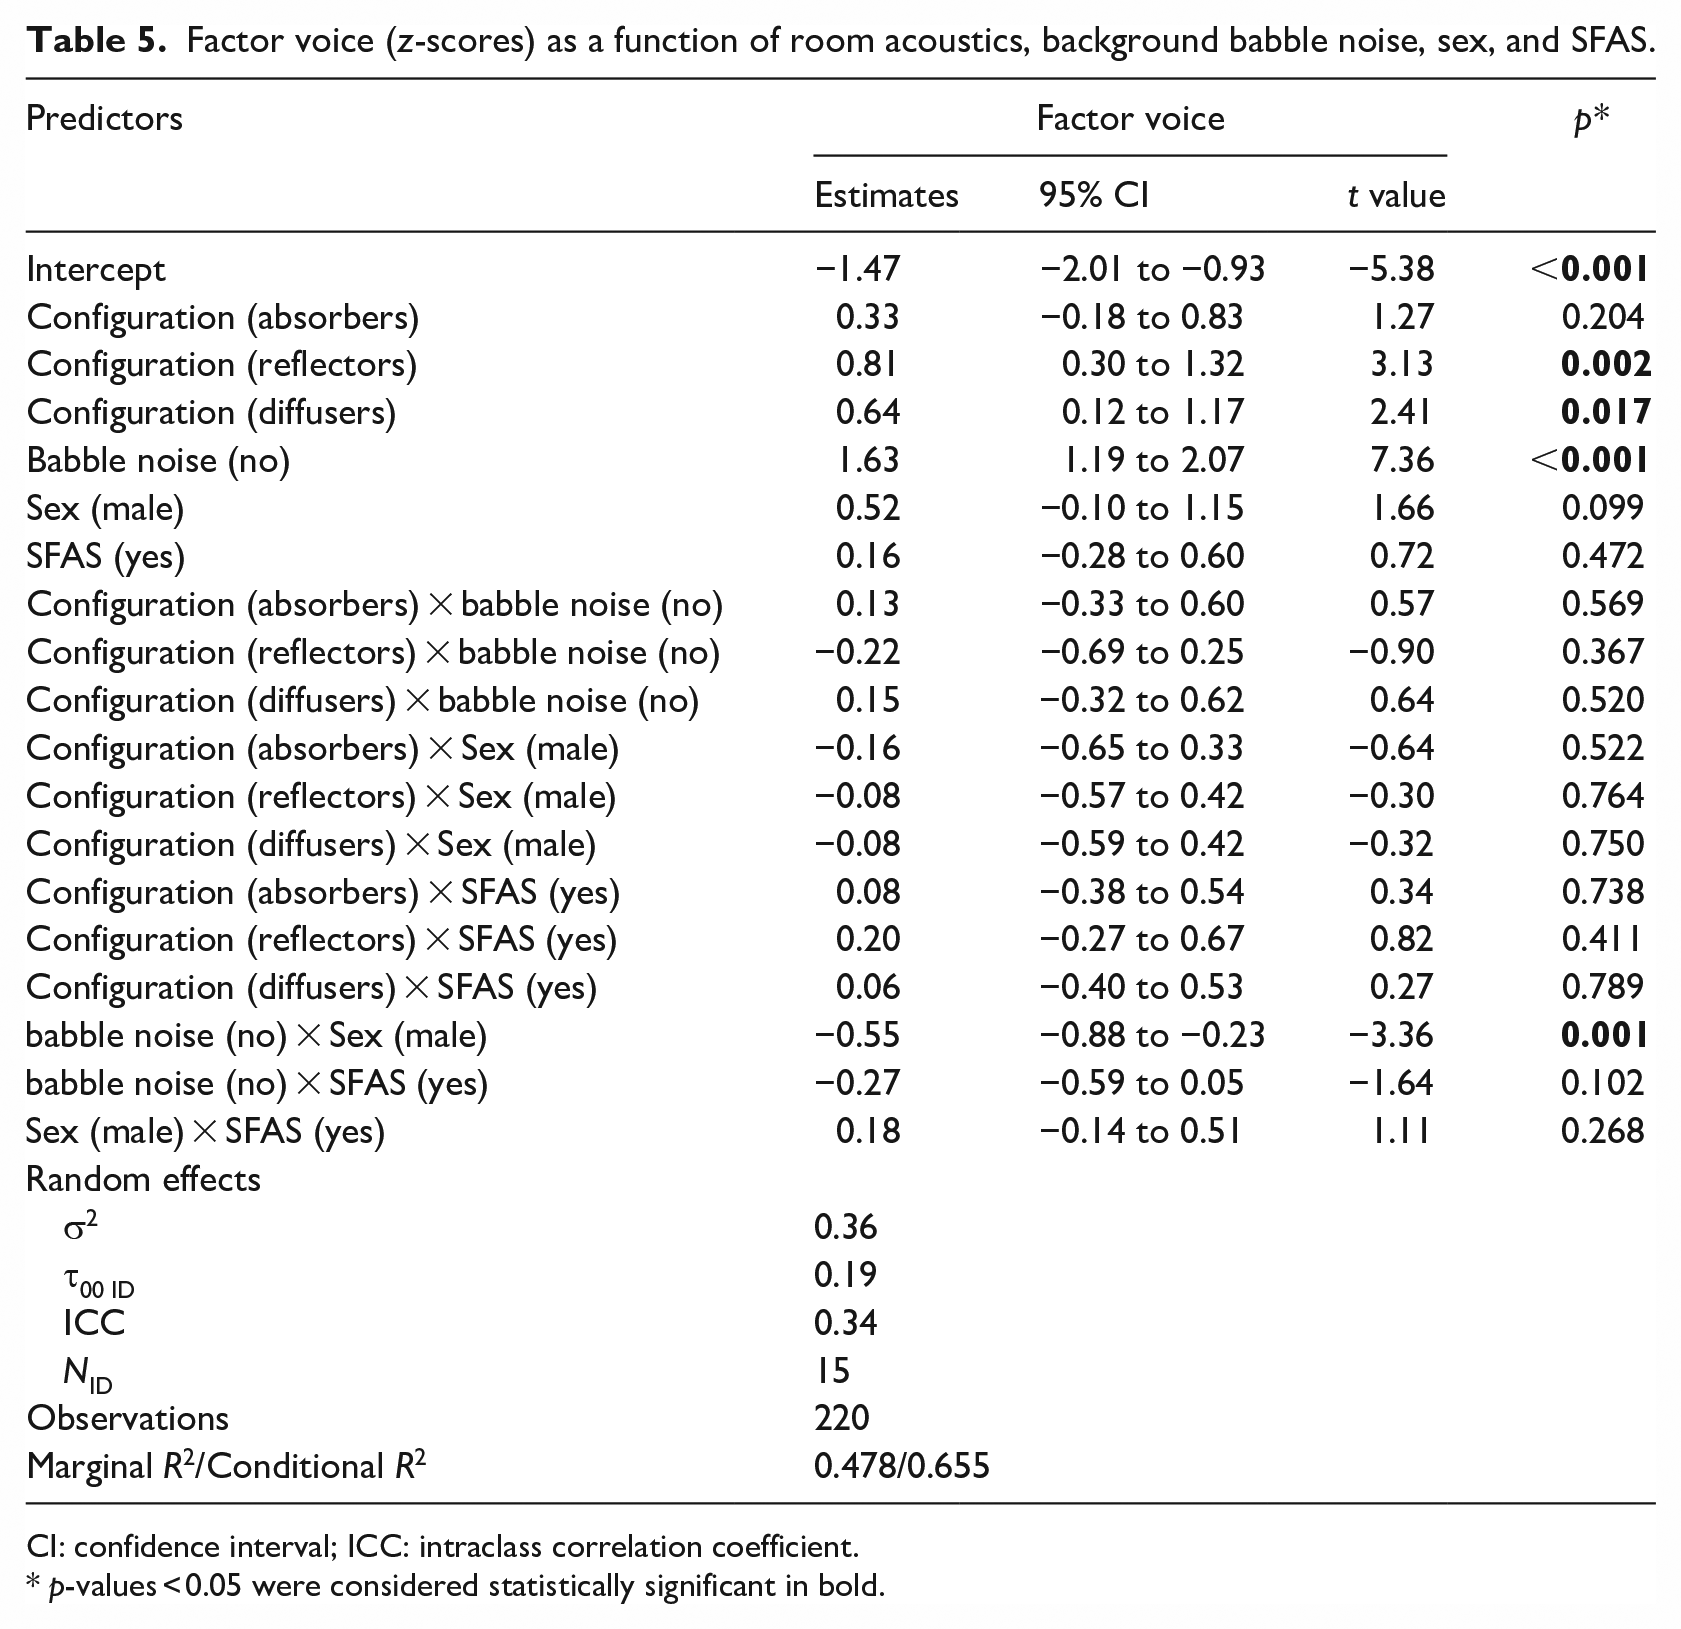
CI: confidence interval; ICC: intraclass correlation coefficient.
p-values < 0.05 were considered statistically significant in bold.
Vocal SPL (mean)
Participants’ SPL (mean) for each configuration and experimental condition in both speech tasks is presented in the Supplemental material (Supplemental Table S10). The best-fitted model for mean SPL in the describe-and-draw task included significant main effects of room acoustics, background babble noise, and SFAS use. The estimated decrease in mean vocal intensity was 1.29 dB (95% CI: (−2.49, −0.09), t = −2.12, p = 0.035) when participants performed the speech task in the fourth configuration (diffusers) compared to baseline. However, the decrease in mean vocal intensity was not significant in the other configurations compared to baseline. Additionally, the participants’ mean vocal SPL decrease was estimated to 1.50 dB when using an SFAS (95% CI: (−2.49,−0.51), t = −2.99, p = 0.003), while the largest decrease in mean SPL, estimated to 3.45 dB, was suggested to stem from speaking in a quiet environment compared to speaking in background noise (95% CI: (−4.44, −2.47), t = −6.89, p < 0.001). The model also revealed significant two-way interactions. The first interaction (Figure 6) suggests that while male participants’ mean vocal SPL did not change between the baseline configuration and the diffuser configuration, female participants’ vocal SPL decreased significantly in the diffuser configuration (1.36, 95% CI: (0.20, 2.51), t = 2.32, p = 0.021). The second interaction (Figure 7, left), between the participants’ age and background babble noise, indicates that older and younger participants exhibit similar levels of vocal SPL in conditions with babble noise present. In contrast, older participants had a lower vocal SPL in the quiet conditions compared to younger participants (−0.60, 95% CI: (−0.97, −0.24), t = −3.27, p < 0.001).
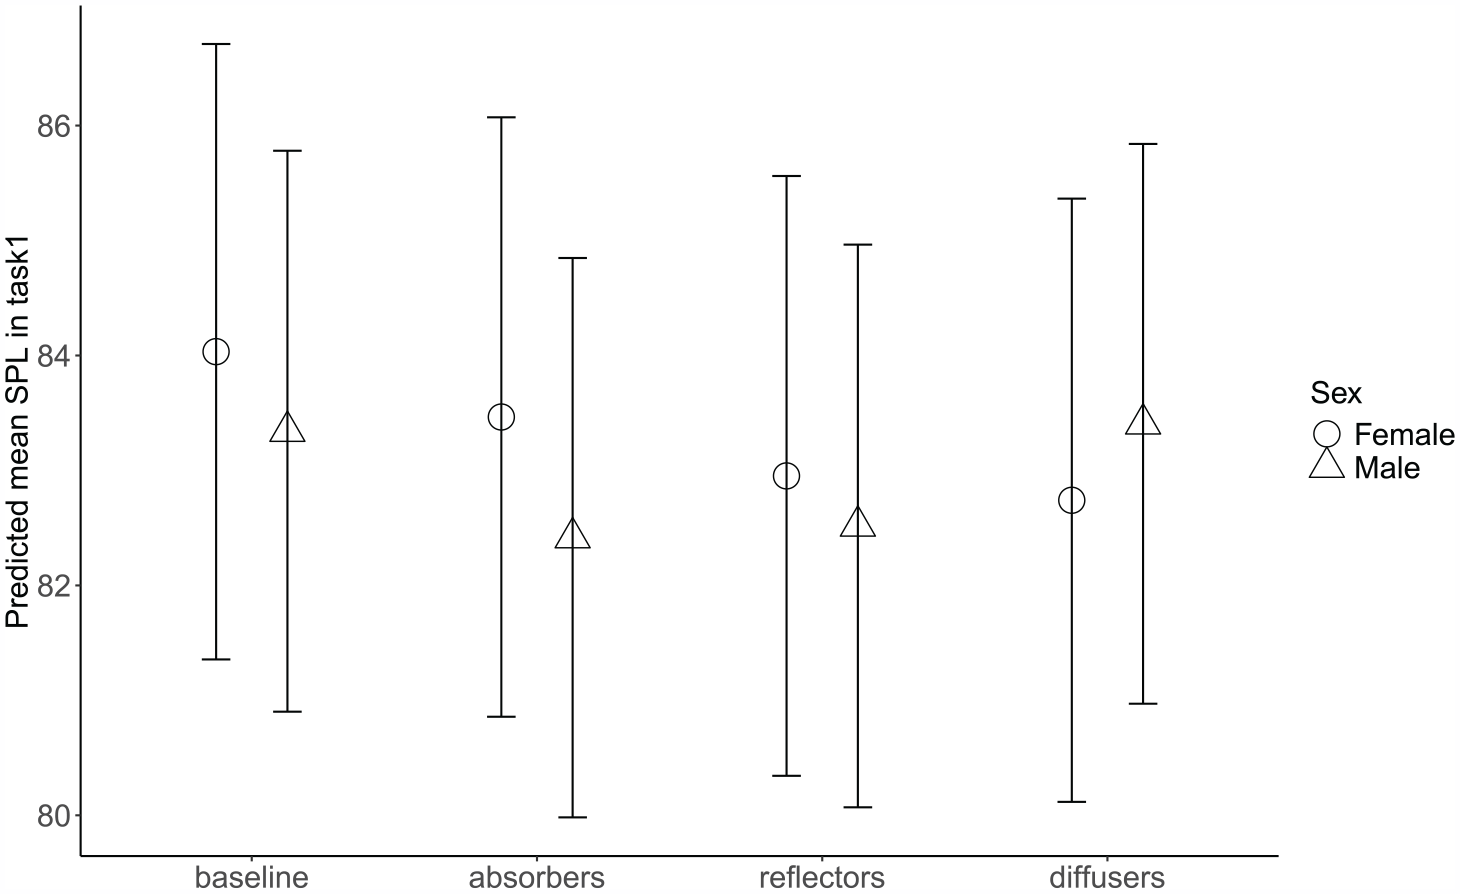
Predicted SPL (mean) in task 1 as a function of room acoustics and participants’ sex. Task 1 = describe-and-draw. Error bars represent 95% confidence intervals.
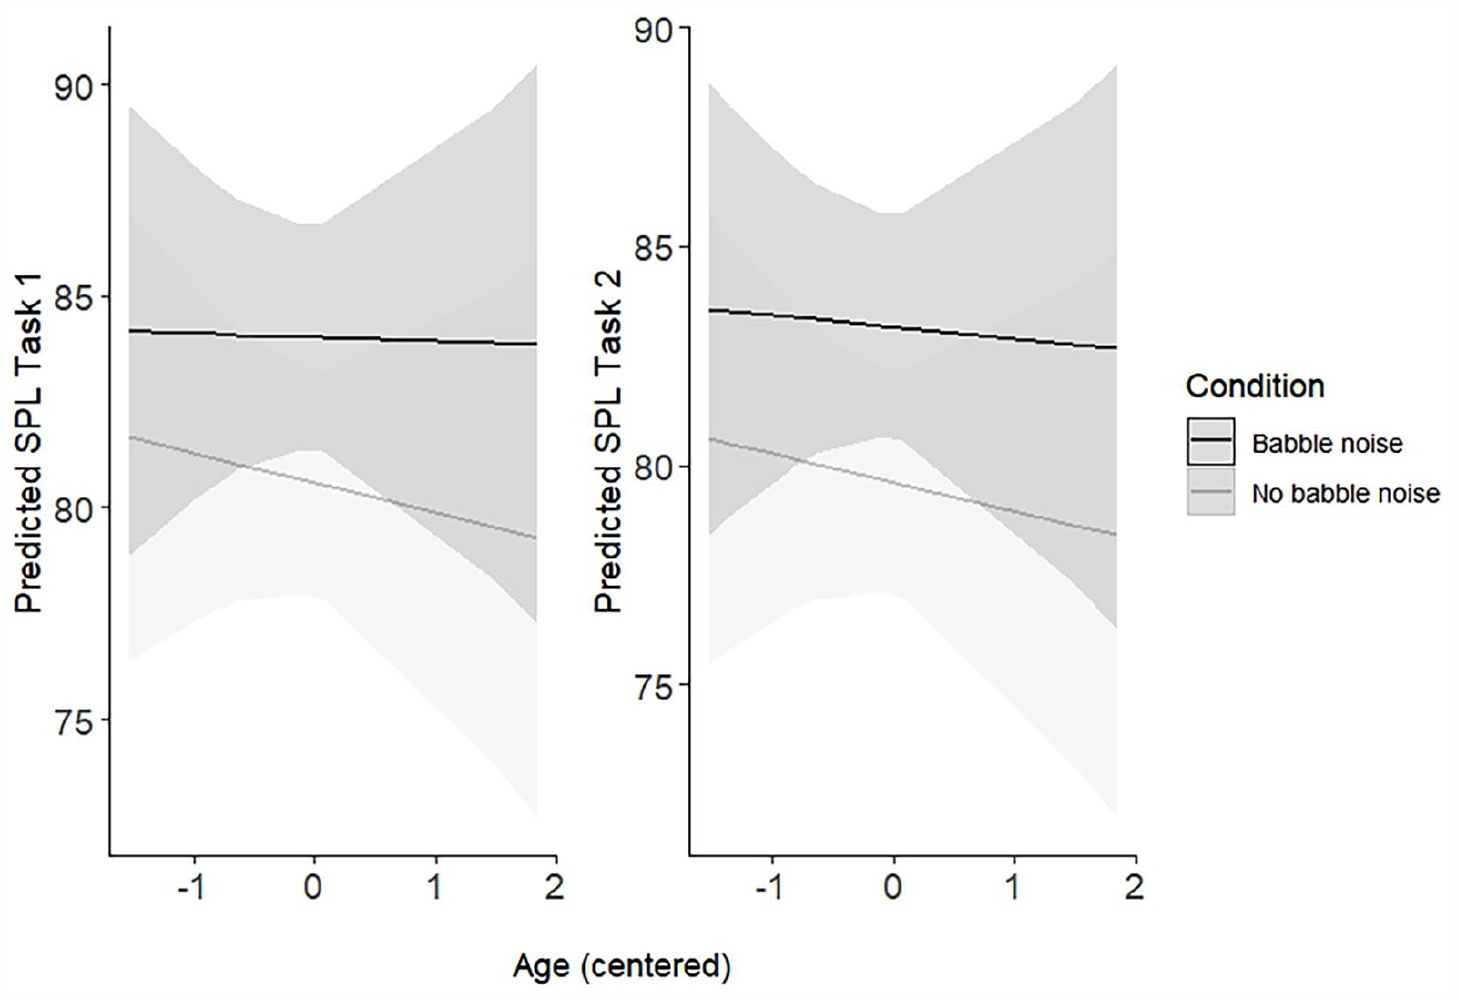
Predicted SPL (mean) values in task 1 and task 2 as a function of babble noise and age. Age is scaled to z-values and centered to the sample mean, –1 corresponds roughly to 29, 0–35, and 1–40 years. Task 1 = describe-and-draw, task 2 = oral presentation. Gray areas represent 95% confidence intervals.
The best-fitted model for mean vocal SPL in the oral presentation task only included a significant main effect of background babble noise, meaning participants decreased their mean vocal SPL with an estimated 3.56 dB in the quiet conditions when performing the oral presentation (95% CI: (−4.29, −2.83), t = −9.65, p < 0.001). All other main effects were both non-significant and minuscule in effect sizes. Similarly to the best-fitted model for mean SPL in the describe-and-draw task, the model for mean SPL in the oral presentation revealed a two-way interaction between background babble noise and the age of the participant (Figure 7, right), which suggested a higher mean vocal SPL difference between the noise condition and quiet condition for older participants (−0.39, 95% CI: (−0.66, −0.13), t = −2.90, p = 0.004). In addition, the model included a significant two-way interaction between configuration and SFAS use (0.77, 95% CI: (0.00, 1.55), t = 1.98, p = 0.049). However, the effect size and t-value for the interaction were small and might be due to overfitting. For brevity, the interaction plot (Supplemental Figure A) is presented in the Supplemental material. See Table 6 for a summary of the models for vocal SPL (mean) for both speech tasks.
Vocal SPL (mean) as a function of room acoustics, background babble noise, sex, age, and SFAS-use.
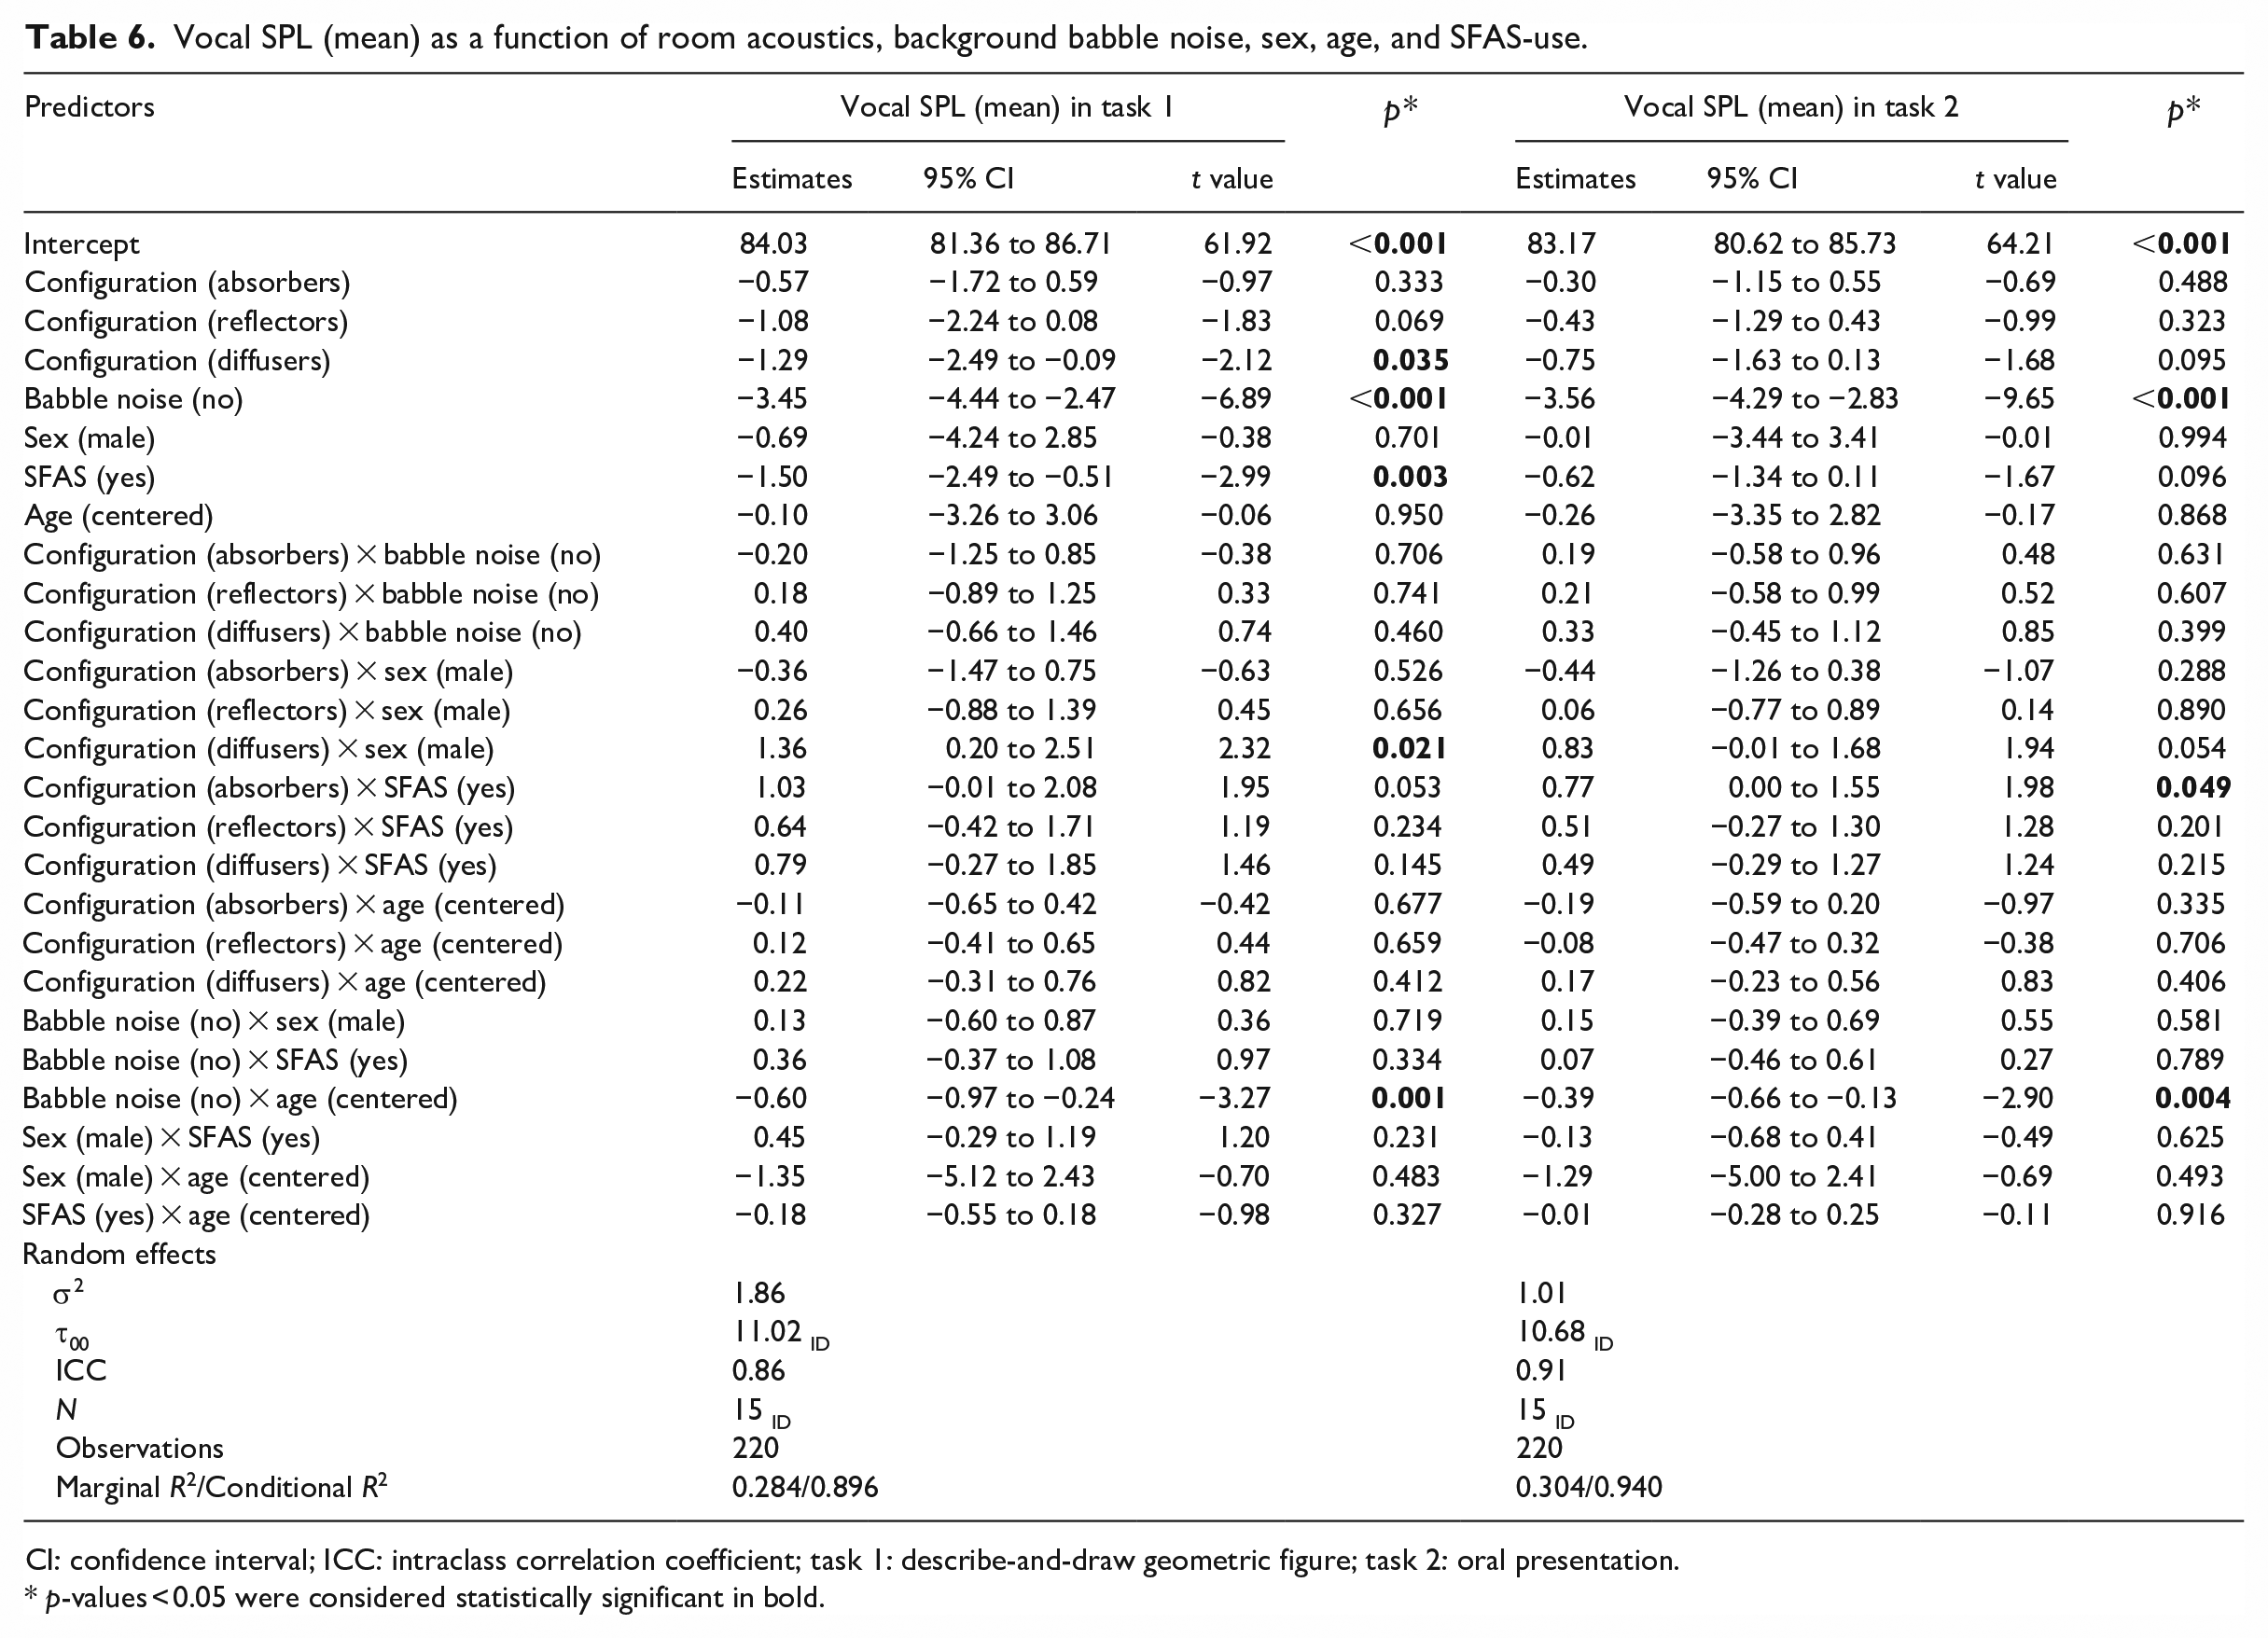
CI: confidence interval; ICC: intraclass correlation coefficient; task 1: describe-and-draw geometric figure; task 2: oral presentation.
p-values < 0.05 were considered statistically significant in bold.
Fundamental frequency (fo mean and mode)
Participants’ fo (mean) for each configuration and experimental condition in both speech tasks is presented in the Supplemental material (Supplemental Table S10). The model with the best fit for fo (mean) in the describe-and-draw task suggested that participants had an estimated decrease of 6 Hz in fo in the reflector configuration (95% CI: (−10.92, −0.25), t = −2.06, p = 0.040), and an 8 Hz decrease in the diffuser configuration (95% CI: (−13.09, −2.09), t = −2.72, p = 0.007) compared to the baseline configuration. Other significant fixed effects included SFAS use (−5 Hz, 95% CI: (−9.22, −0.58), t = −2.24, p = 0.025) and background babble noise (−15 Hz, 95% CI: ( −18.96, −10.33), t = −6.69, p < 0.001), meaning that participants’ fo decreased both as a result of the SFAS use and in the quiet conditions. The model also revealed several two-way interactions. Both the interaction between babble noise and sex of the participant (Figure 8) and the interaction between babble noise and age of the participant (Figure 9) suggested that mean fo difference was higher for females (5 Hz, 95% CI: (2.18, 8.72), t = 3.29, p = 0.001) and older participants (−3 Hz, 95% CI: (−4.66,−1.71), t = −4.26, p < 0.001) respectively when comparing the babble noise conditions with quiet conditions. Other significant interactions suggested by the model were between the room acoustic configuration and participants’ age (3 Hz, 95% CI: (0.93, 5.20), t = 2.83, p = 0.005), and sex (6 Hz, 95% CI: (1.04, 11.20), t = 2.38, p = 0.019) respectively, which are visualized in Figures 10 and 11.
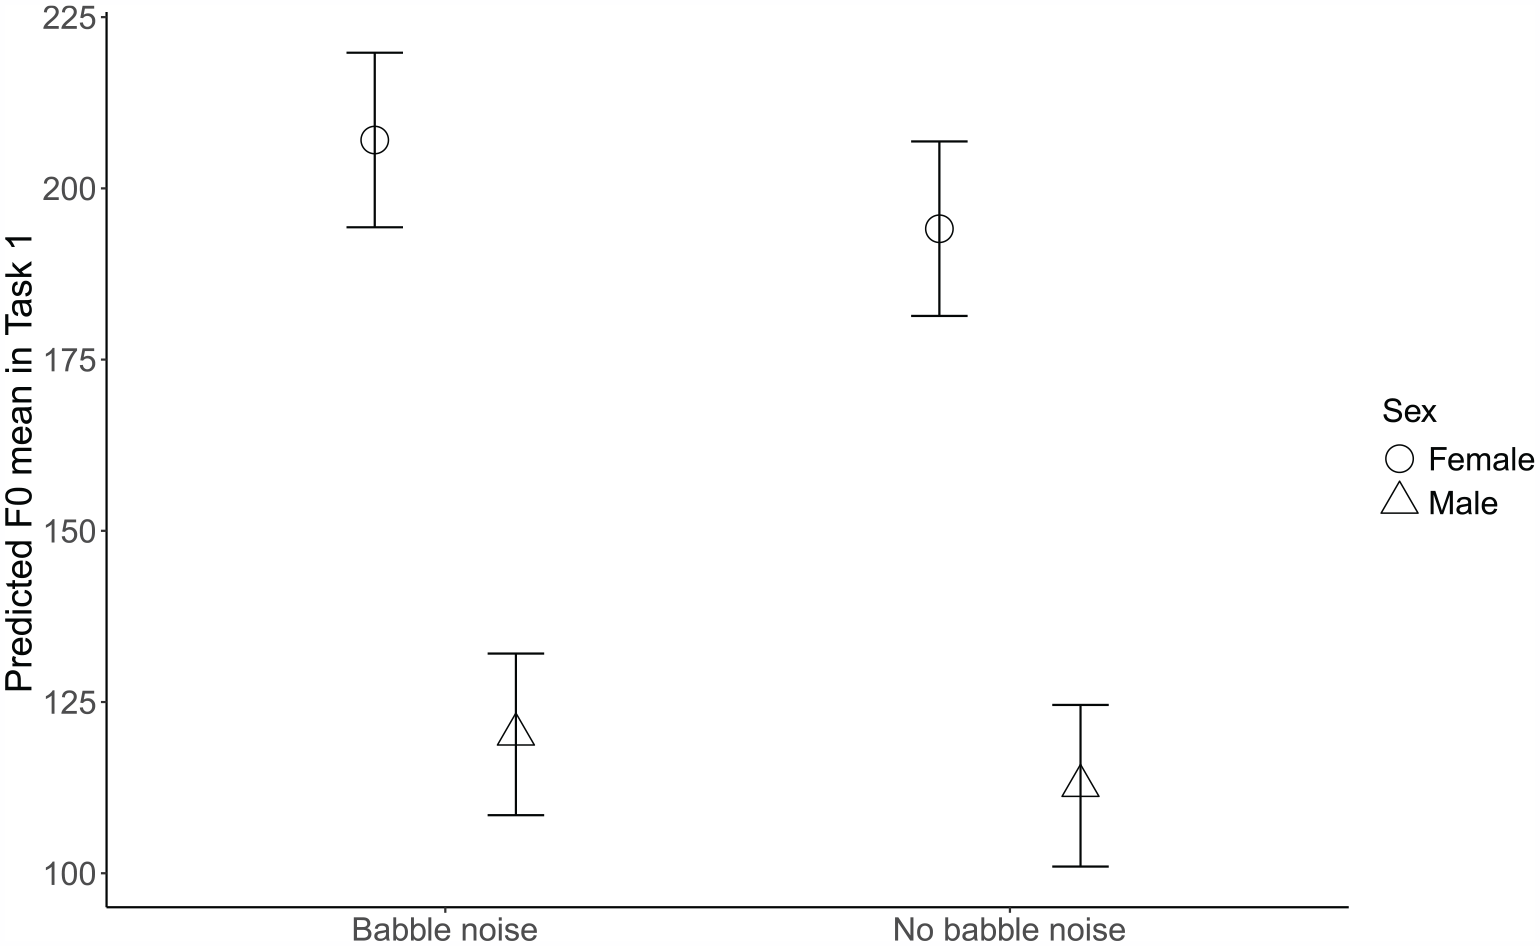
Predicted fo (mean) values in task 1 as a function of babble noise and participants’ sex. Task 1 = describe-and-draw. Error bars represent 95% confidence intervals.
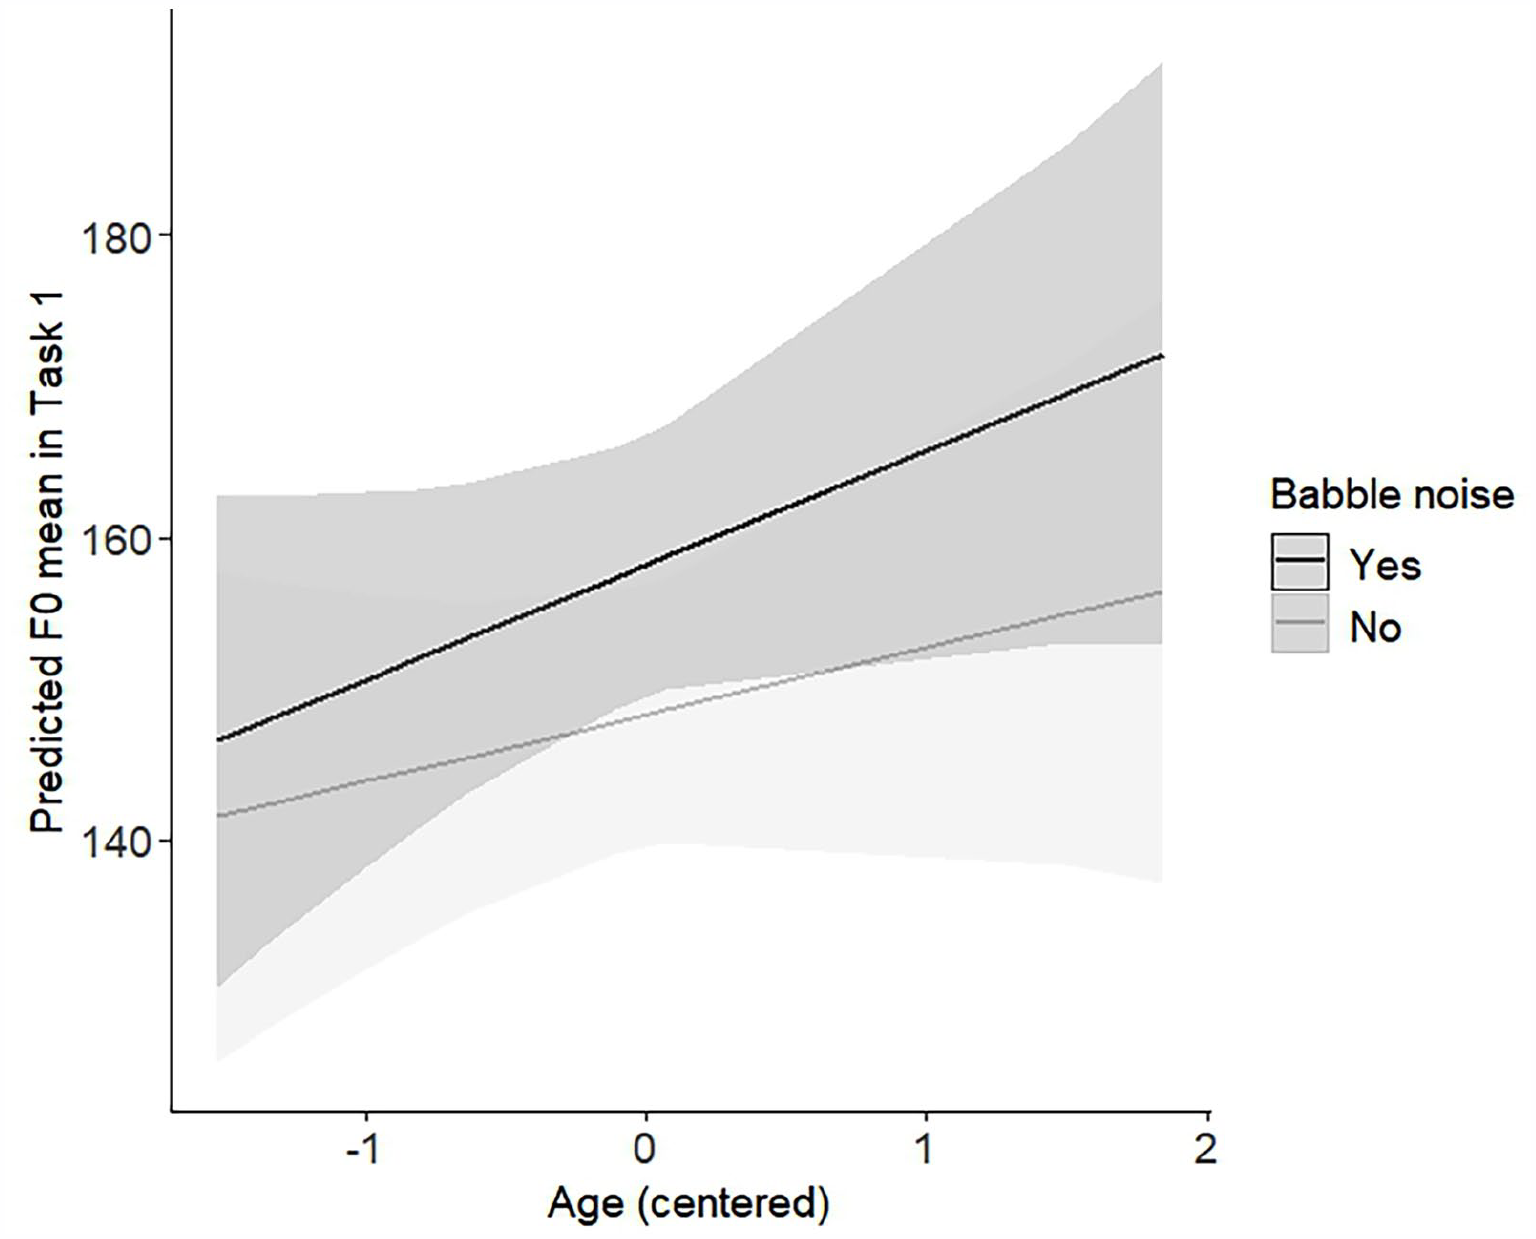
Predicted fo (mean) values in task 1 as a function of babble noise and age. Age is scaled to z-values and centered to the sample mean, –1 corresponds roughly to 29, 0–35, and 1–40 years. Task 1 = describe-and-draw. Gray areas represent 95% confidence intervals.
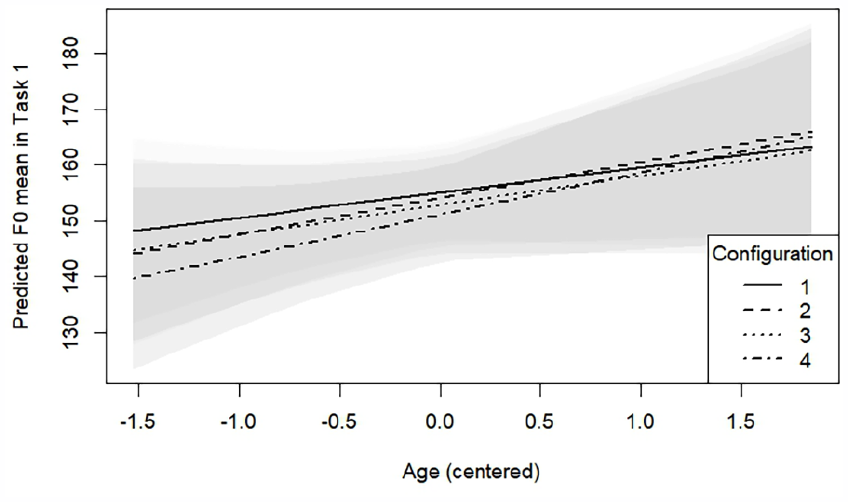
Predicted fo (mean) values in task 1 as a function of room acoustics and age. Age is scaled to z-values and centered to the sample mean, –1 corresponds roughly to 29, 0–35, and 1–40 years. Task 1 = describe-and-draw. Gray areas represent 95% confidence intervals.
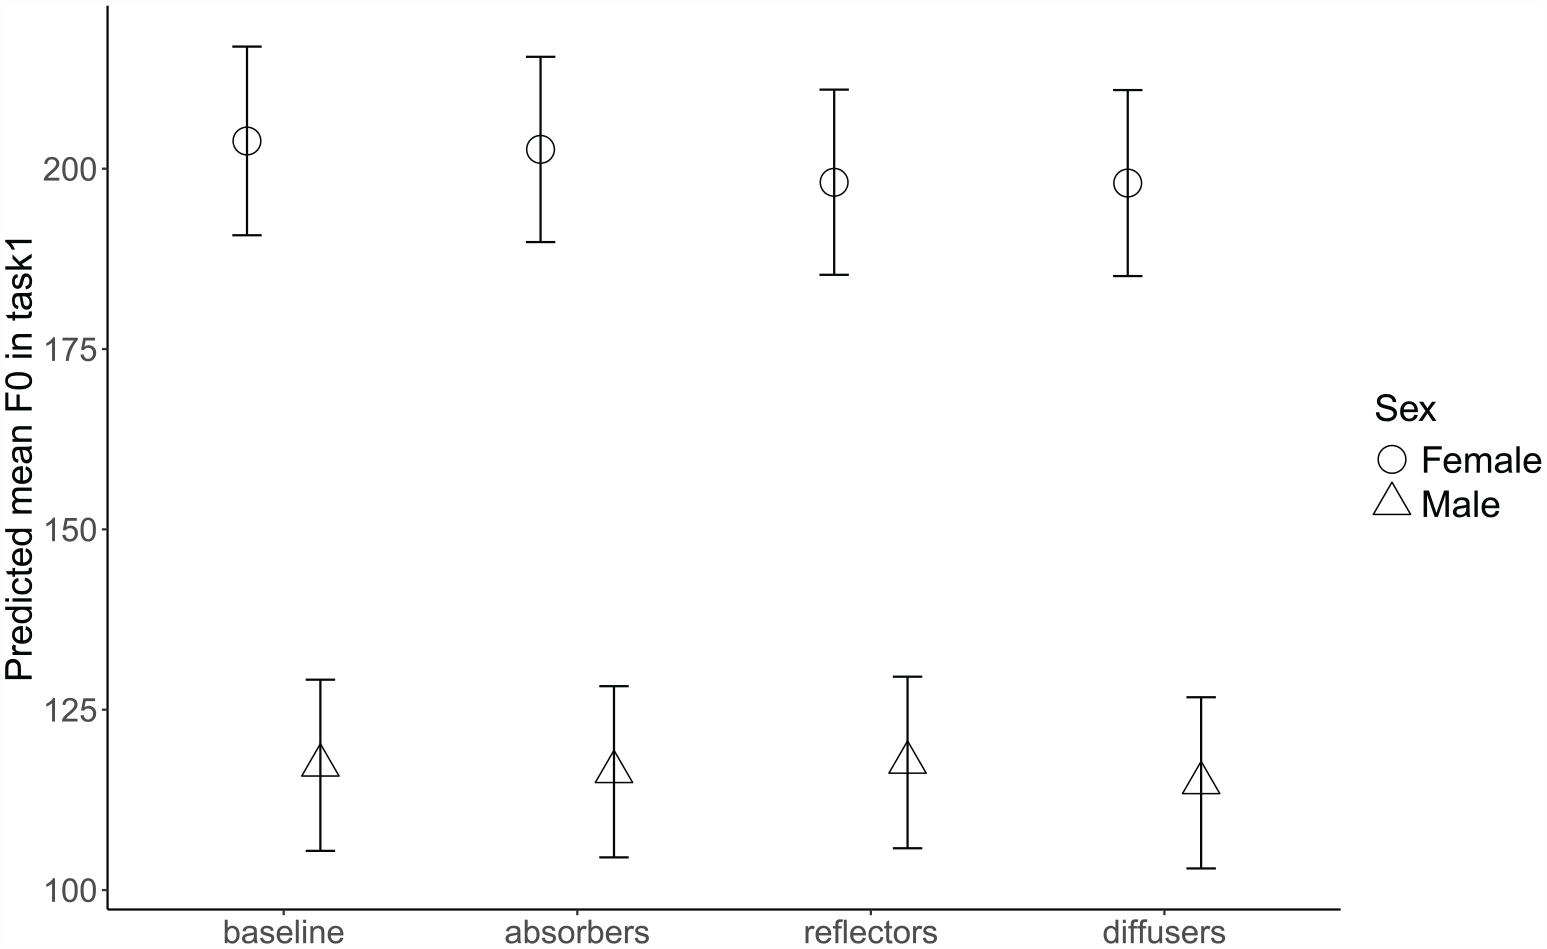
Predicted fo (mean) values in task 1 as a function of participants’ sex and room acoustics. Task 1 = describe-and-draw. Error bars represent 95% confidence intervals.
For the oral presentation task, the best-fitted model for fo (mean) included only one significant main effect of babble noise, which suggested that participants decreased their fo by an estimated 12 Hz in the quiet conditions compared to noise conditions (95% CI: (−15.98, −7.68), t = −5.62, p < 0.001). However, the effect of room acoustics was approaching significance for the diffuser configuration (−5 Hz, 95% CI: (−11.09, 0.14), t = −1.92, p = 0.056). The model did not reveal any significant two-way interactions. See Table 7 for a summary of the models for fo (mean) in both tasks.
fo (mean) as a function of room acoustics, background babble noise, sex, SFAS, and age.
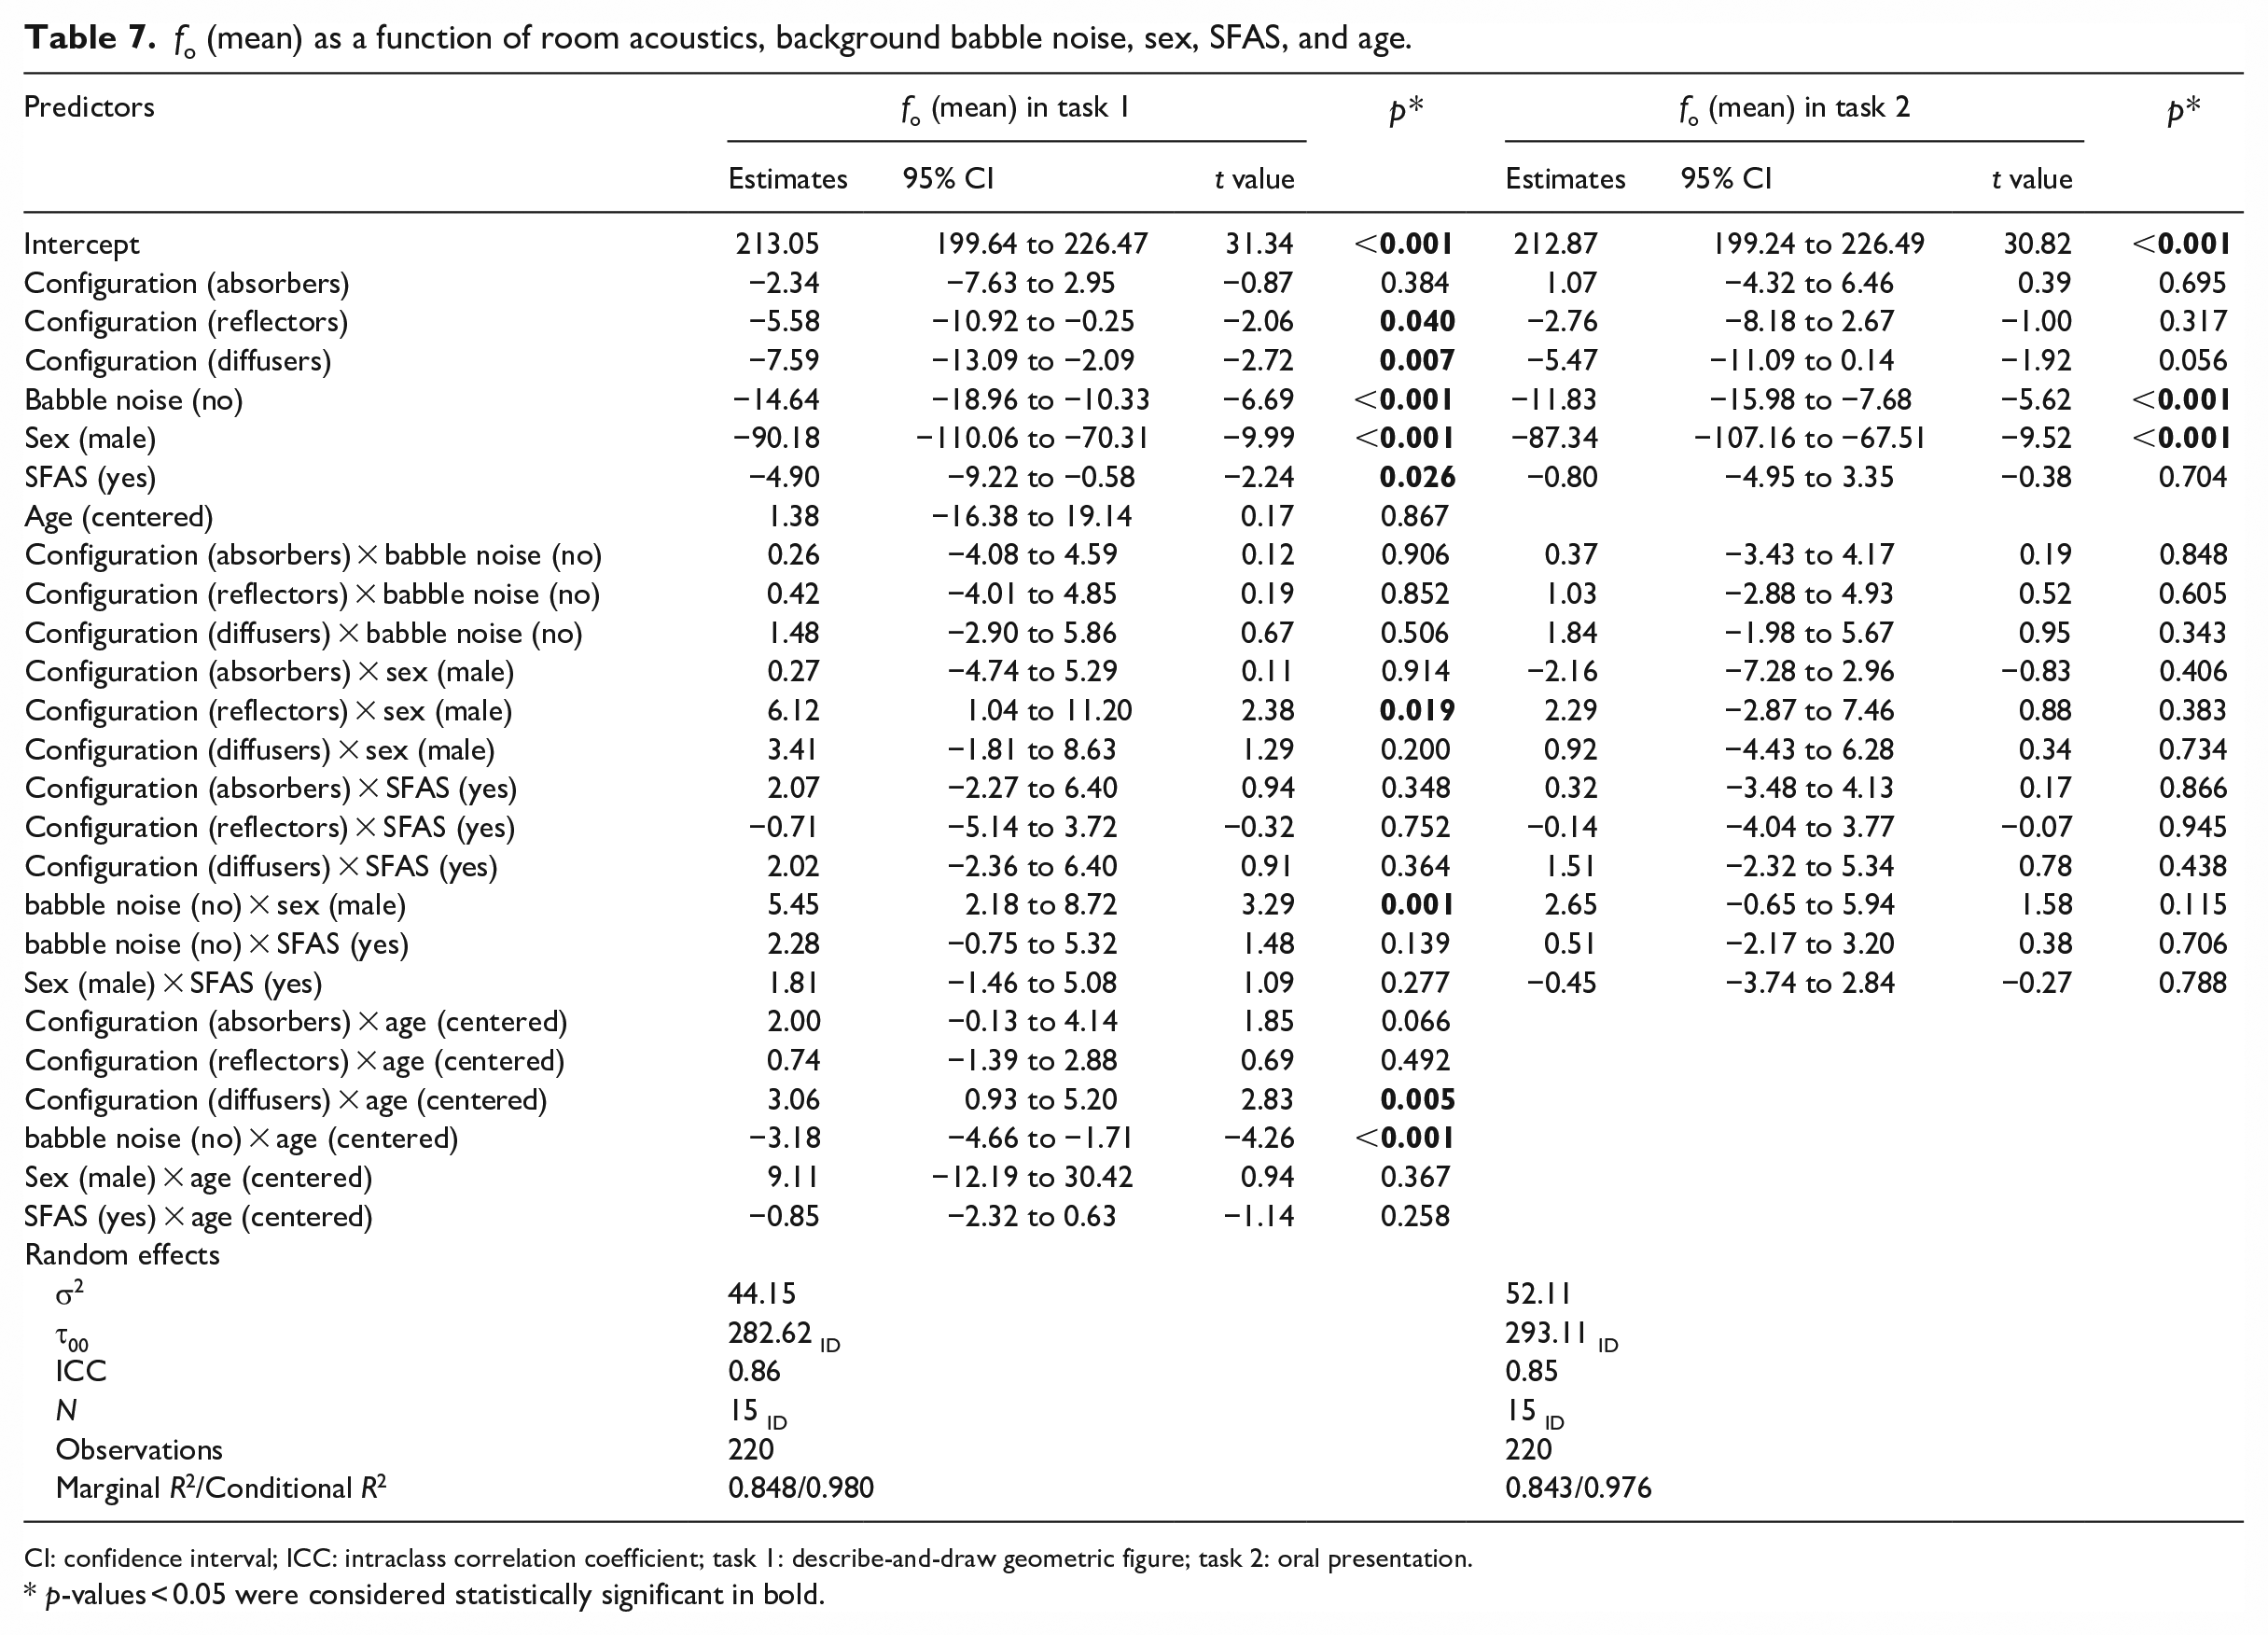
CI: confidence interval; ICC: intraclass correlation coefficient; task 1: describe-and-draw geometric figure; task 2: oral presentation.
p-values < 0.05 were considered statistically significant in bold.
Lastly, for both speech tasks, the best-fitted models for participants’ fo (mode) revealed only a main effect of babble noise, meaning that participants’ decreased their fo (mode) an estimated 13 Hz in the describe-and-draw task (95% CI: (−18.17,−7.37), t = −4.66, p < 0.001) and 11 Hz in the oral presentation (95% CI: (−15.45,−5.60), t = −4.21, p < 0.001) respectively, when speaking in the quiet conditions compared to the noise conditions. However, for the describe-and-draw task, the model revealed a significant interaction (Figure 12), suggesting that female participants had a larger fo (mode) difference between the quiet and noisy conditions compared to the male participants (6 Hz, 95% CI: (1.49, 9.60), t = 2.70, p = 0.008). Additionally, for this task, the significant interaction between the quiet condition and SFAS use (Figure 13) indicated that while fo (mode) values were similar independent of SFAS use in the quiet condition, fo (mode) values decreased significantly in the noise condition with SFAS use (4 Hz, 95% CI: ( 0.32,8.06), t = 2.14, p = 0.034). The oral presentation task fo (mode) model revealed no significant interactions between fixed effects. See Table 8 for a summary of the models for fo (mode) in both tasks.
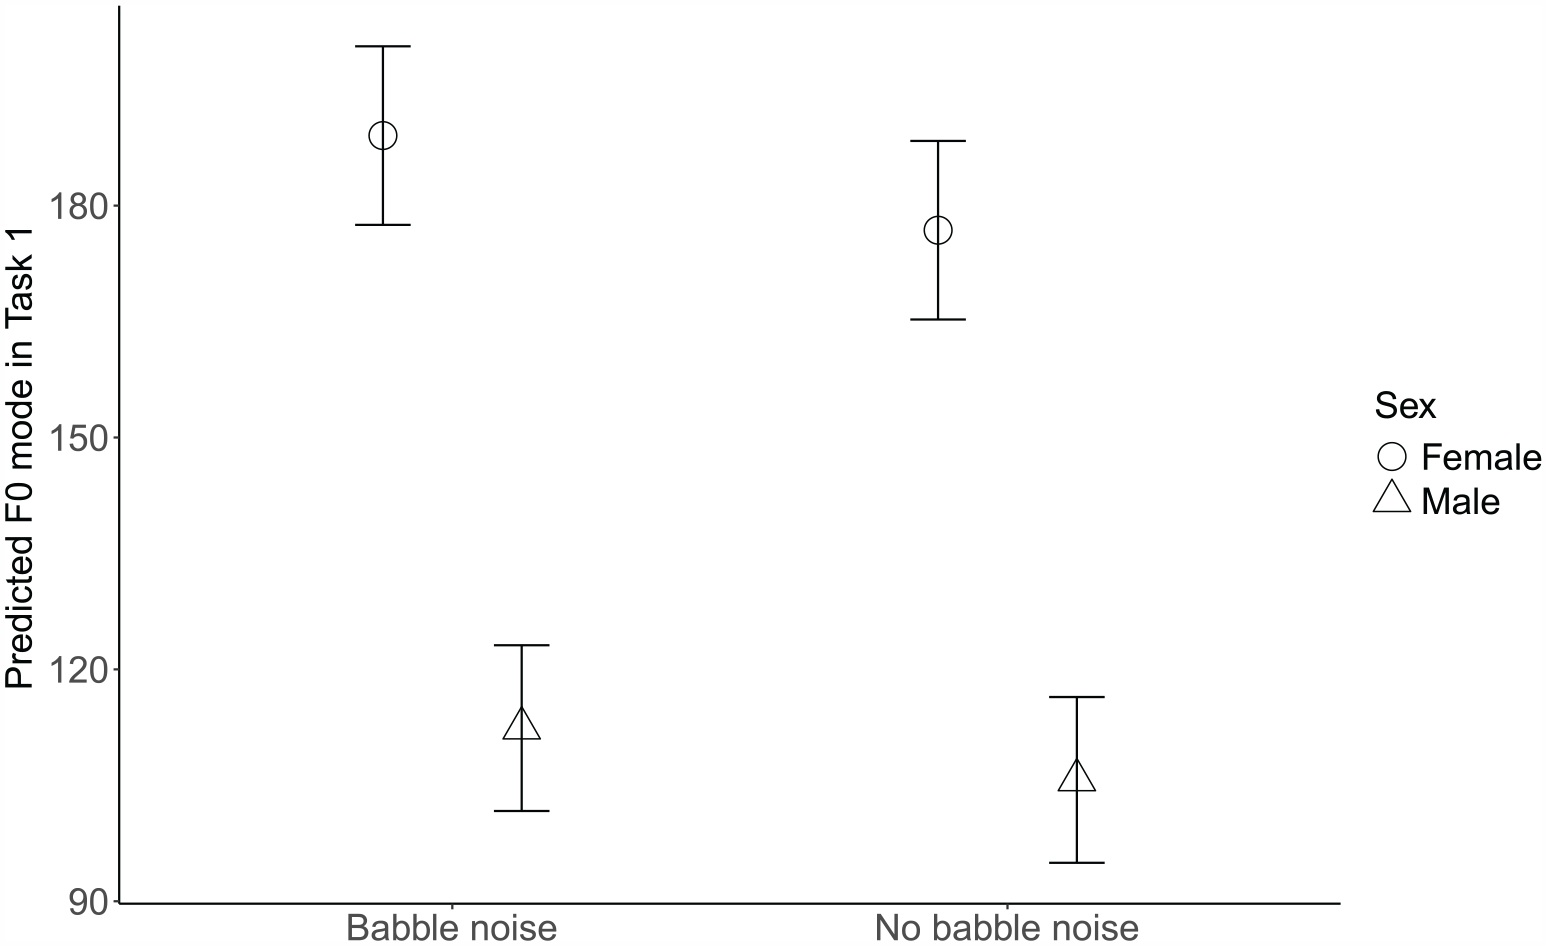
Predicted fo (mode) values in task 1 as a function of participants’ sex and babble noise. Task 1 = describe-and-draw. Error bars represent 95% confidence intervals.
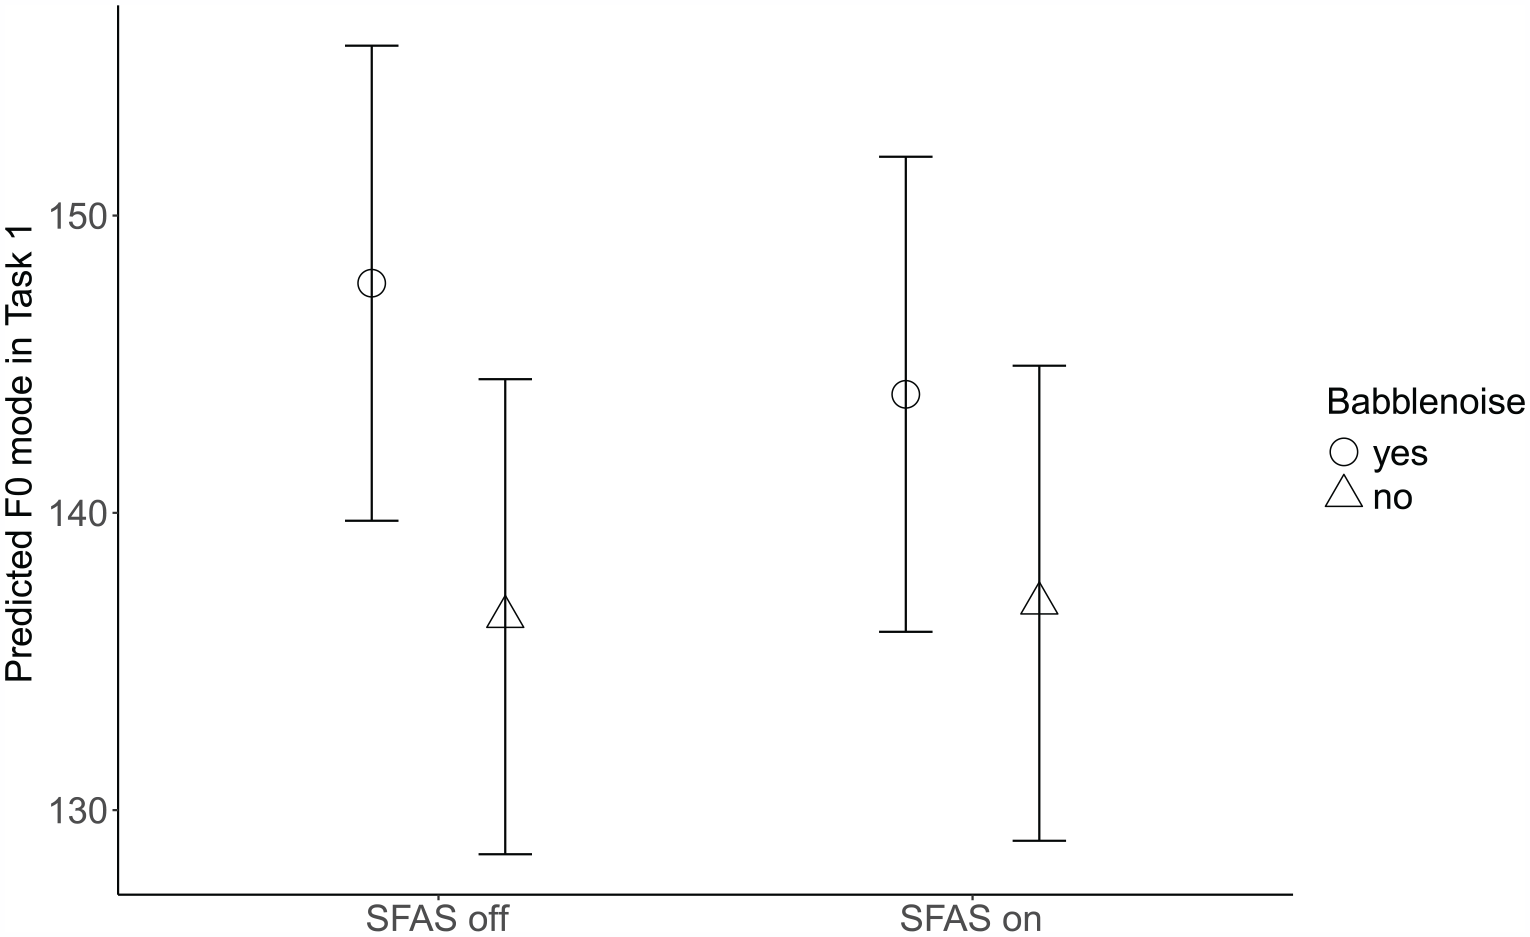
Predicted fo (mode) values in task 1 as a function of babble noise and SFAS. Task 1 = describe-and-draw. Error bars represent 95% confidence intervals.
fo (mode) as a function of room acoustics, background babble noise, sex, and SFAS.
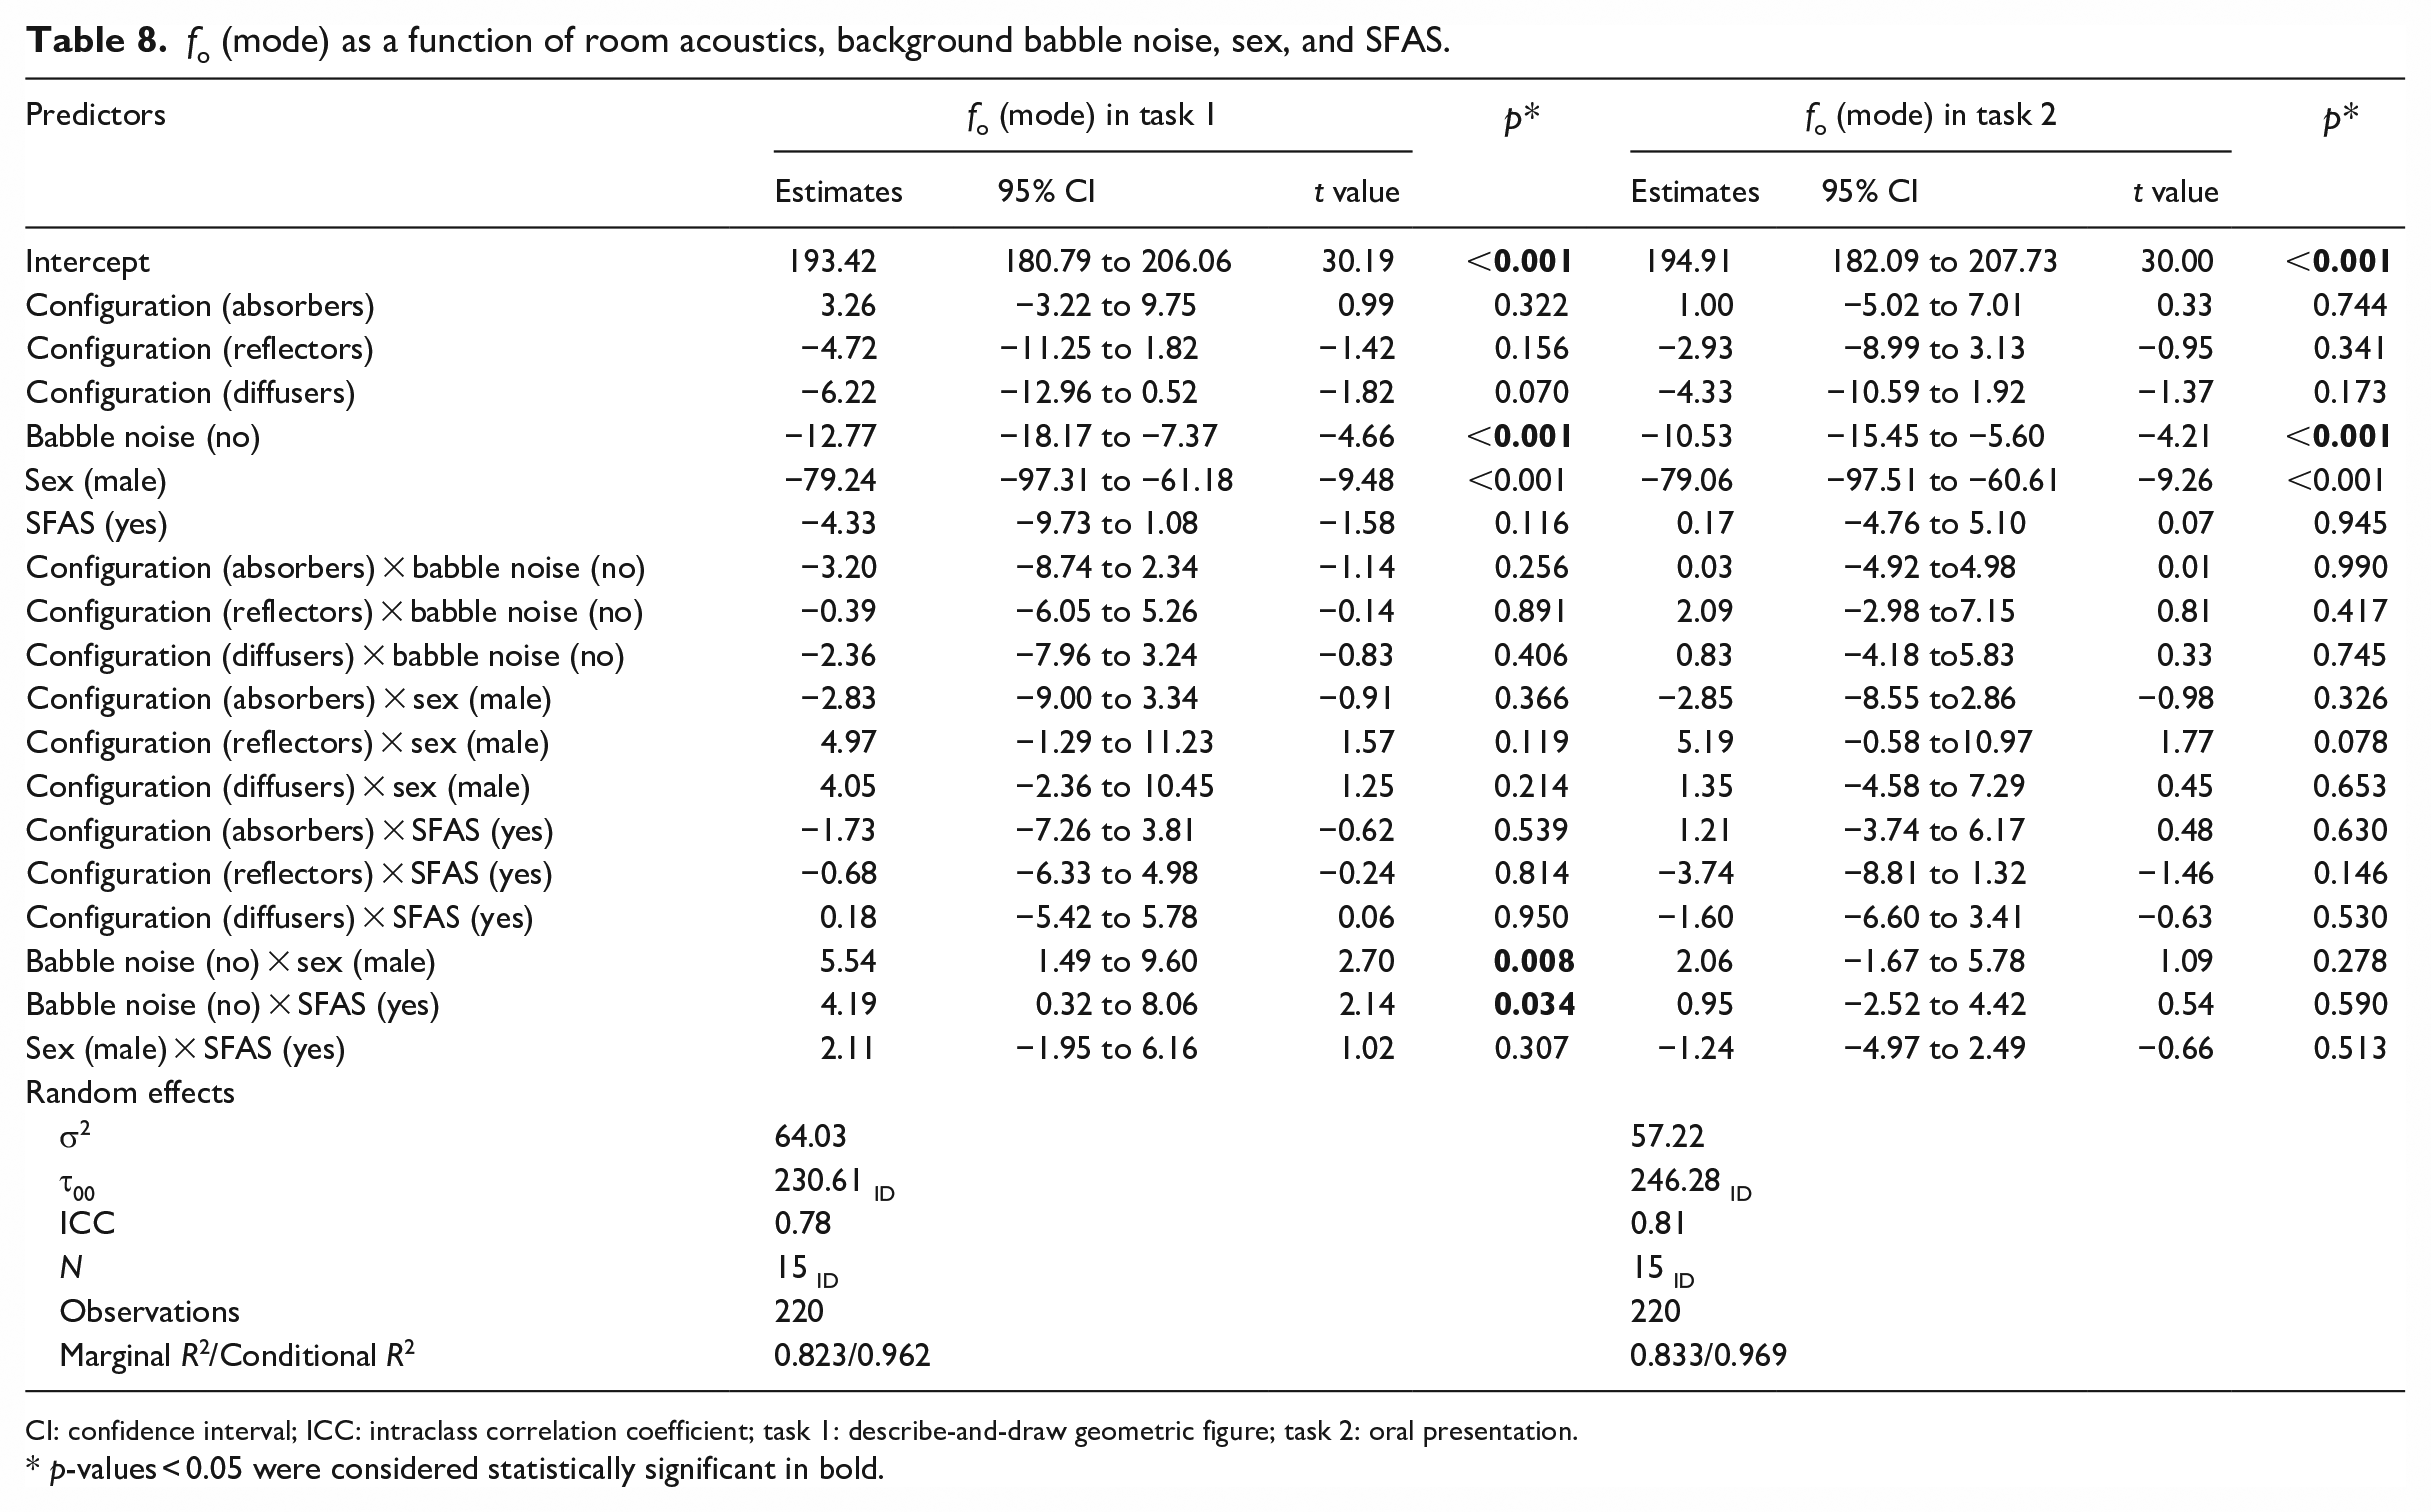
CI: confidence interval; ICC: intraclass correlation coefficient; task 1: describe-and-draw geometric figure; task 2: oral presentation.
p-values < 0.05 were considered statistically significant in bold.
Task experience and sound field amplification system benefit
For Task experience (square root transformed and converted to z-scores) the best-fitted model revealed neither any significant main effects nor significant interactions, suggesting that factors like room acoustics, background noise, sex, and SFAS use did not affect the participants’ task experience. For the sake of brevity, a summary of the Task experience model is presented in the Supplemental material (Supplemental Table S11).
Additional analyses were conducted to investigate whether the fixed effects Room acoustics, Background babble noise, and Sex could predict the values for the self-assessment question “The sound field amplification system helped me to speak comfortably,” answered with a 5-point Likert-scale, square root transformed, and converted to z-scores. Higher scores imply higher perceived benefits. SFAS benefit increased post-refurbishment, but the results were not significant. Moreover, the best-fitted model revealed neither significant main effects nor interactions. An interaction between babble noise and sex (Figure 14) suggested that while both males and females perceived their SFAS benefit as equally high in quiet conditions, their perceptions diverged in noise: females reported a decrease in benefit, whereas males reported an increase compared to the quiet condition. However, this interaction was not significant (−0.63, 95% CI: (−1.26, 0.01), t = −1.95, p = 0.054). A moderate correlation between factor Voice and SFAS benefit suggests that participants’ speaker’s comfort and SFAS benefit correlated positively, meaning that participants who rated their speaker’s comfort as high also rated their SFAS benefit as high (r = 0.42, t(104) = 4.7717, p < 0.001). A summary of the SFAS benefit model is presented in Table 9.
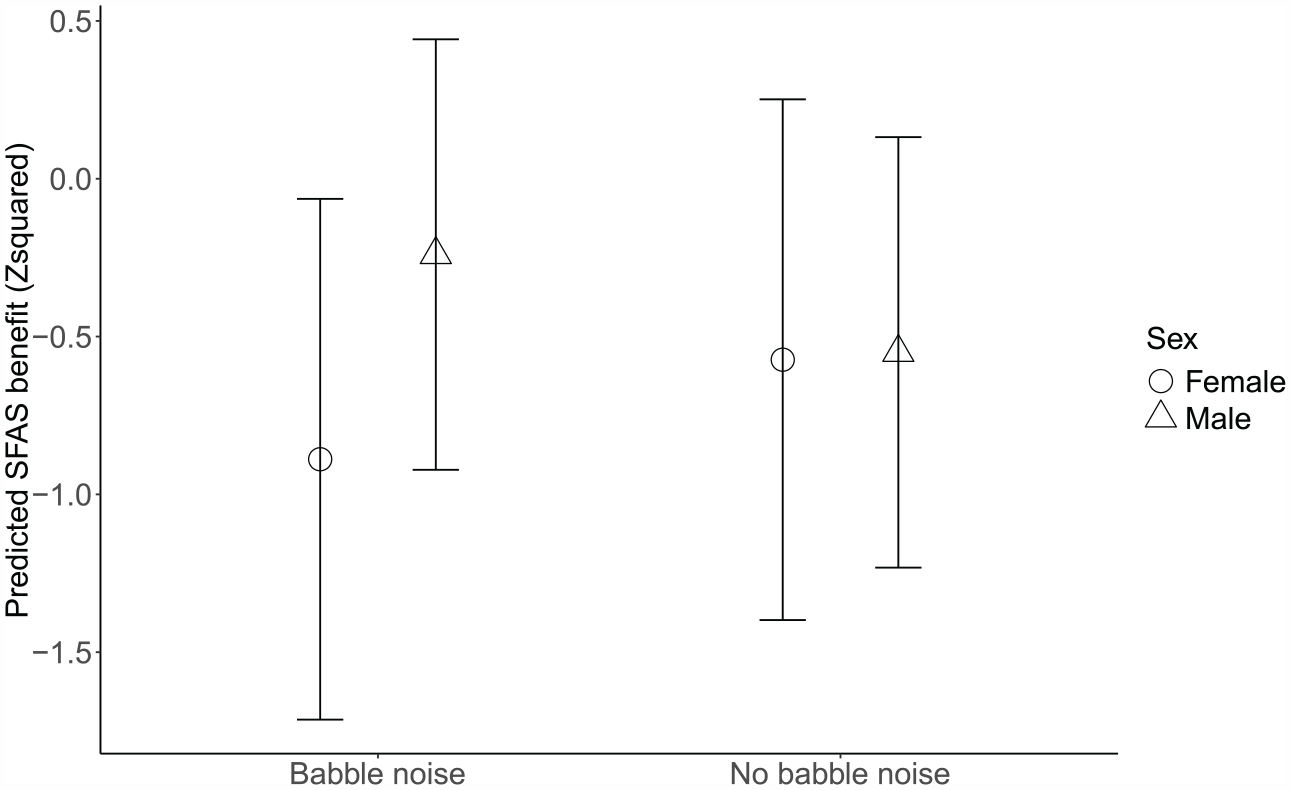
Predicted SFAS benefit as a function of babble noise and sex. Females reported less benefit from the SFAS in noise compared to males, but the results are non-significant. Error bars represent 95% confidence intervals.
Self-perceived SFAS-benefit (sqrt-transformed and centered) as a function of room acoustics, background babble noise, and sex.
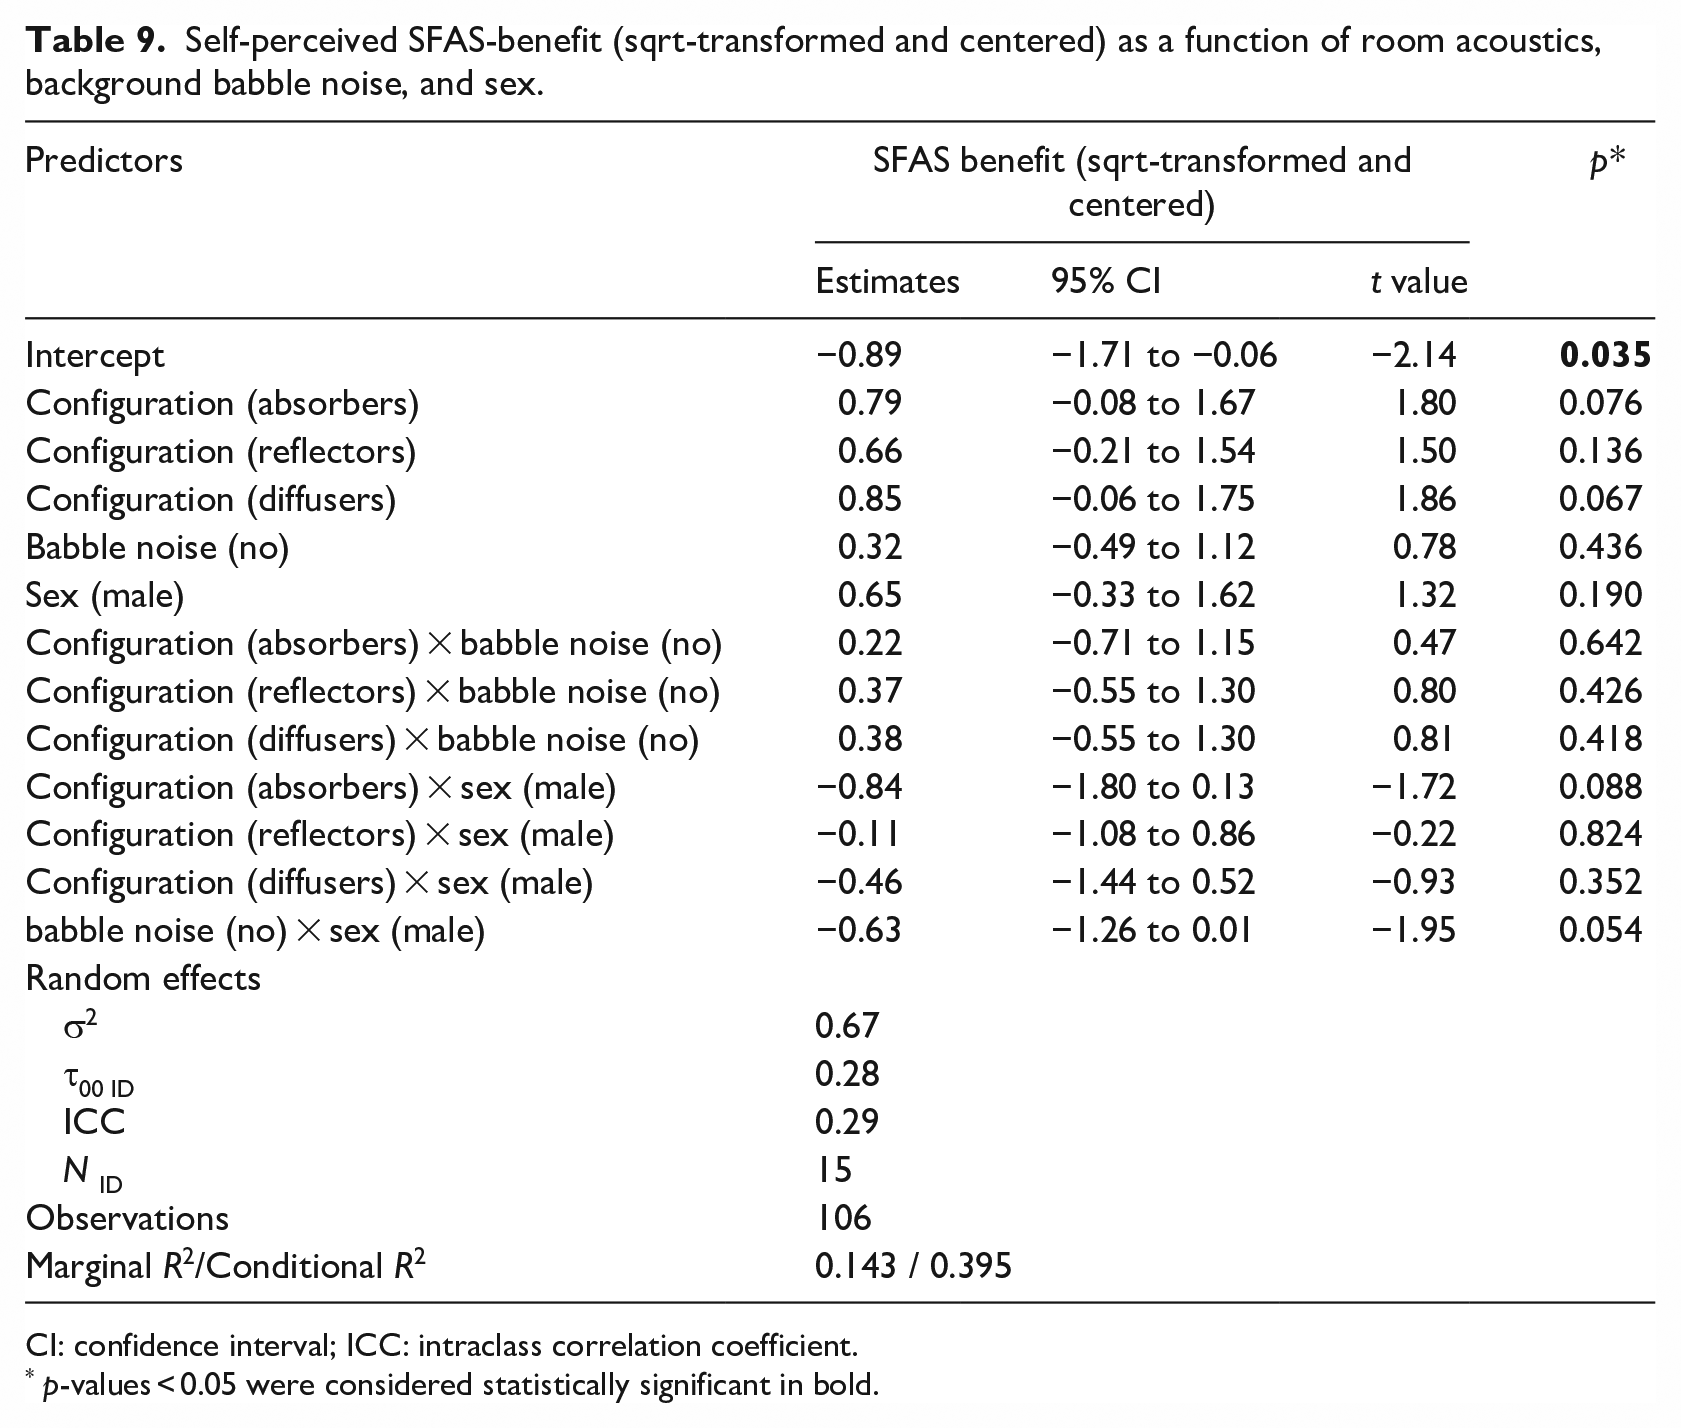
CI: confidence interval; ICC: intraclass correlation coefficient.
p-values < 0.05 were considered statistically significant in bold.
Discussion
This study investigated how speaker’s comfort and vocal effort, measured as changes in vocal SPL and fo, were affected by room acoustics, background noise, and SFAS during an acoustic refurbishment in a university lecture room setting. The results indicate that improved room acoustics increases speaker’s comfort even after a short period of speaking. However, a significant increase in speaker’s comfort was detected only in configurations with reflective materials in the grid above the speaker position, suggesting that reflective materials near the speaker are important for improved comfort. We saw a decrease in mean SPL and fo, indicating less vocal effort, in acoustic configurations with diffusers, and reflectors present. This effect was, however, task-dependent and only present in the describe-and-draw task. We also discovered some sex differences in our data, with for example, female participants reporting a greater decrease in speaker’s comfort due to the background noise compared to males. Next, we discuss the effects of room acoustics, noise, and SFAS on our outcome variables, and additionally, some sex and age differences.
Room acoustics
According to our findings, room acoustic changes with added reflectors or diffusers on the ceiling above the speaker position significantly increased speaker’s comfort and decreased vocal effort among participants. There were no differences in speaker’s comfort between reflectors and diffusers. However, a significant decrease in participants’ SPL was observed only with diffusers, while fo (mean) decreased in both configurations with reflective materials. Thus, our data does not indicate any clear or practically significant differences between reflectors and diffusers regarding speaker’s comfort and vocal effort. Although changes in the acoustic parameters T20 and C50 were obtained already in configuration 2 (absorbers) compared to configuration 1 (baseline), with T20 decreasing and C50 increasing, especially in the lower frequencies (Table 2), significant increases in speaker’s comfort and vocal effort were observed only in configurations 3 (reflectors) and 4 (diffusers). Still, reverberation time and speech clarity values did not differ considerably between configurations post-refurbishment, suggesting that other room acoustic measures might be more important from the speaker’s point of view. Our data indicates that reflective materials above the speaker position enhance speaker’s comfort and reduce vocal effort by increasing early reflections. Early reflections (first 50 ms) play an important role in enhancing the signal-to-noise ratios in a room and increasing speech intelligibility, thus improving the listening experience.42,43,69,70 For the speaker, early reflections could likewise be beneficial since they would reinforce the speaker’s direct speech signal and improve the auditory feedback of the speech. 71 This would, in turn, lead to the speaker not feeling the need to exert as much vocal effort, thus increasing speaker’s comfort. Moreover, at the physiological level, a decrease in vocal effort is manifested as a reduction in laryngeal tension and subglottic pressure, leading to a reduction in vocal SPL and fo.72 –76 Our findings align with the research of Bottalico et al., who reported that reflective panels placed near speakers reduced vocal SPL and led to an increase in self-reported vocal clarity among participants. 77 However, to measure the effect of early reflections on participants, speaker-oriented measures such as room gain and voice support, introduced by Brunskog et al., 78 should be used. Room gain refers to the extent to which a room amplifies the speaker’s voice at his ears, excluding the body-conducted sound, while voice support is an alternative measure, defined as the energy ratio between the reflected sound, and the airborne direct sound. The purpose of these speaker-oriented measures is to quantify the natural amplification a room offers to the speaker’s own voice.71,78 Both room gain and voice support have been shown to correlate negatively with voice power level, suggesting that an increase in these parameters could reduce the vocal effort exerted by the speaker.12,78 Thus, in the future, we hope to include speaker-oriented parameters in configurations 2, 3, and 4 to better understand why participants preferred the room with reflectors and diffusers as well as to compare the different reflective materials.
While our data suggested a decrease in objective vocal parameters, mean SPL, and fo in configurations with reflectors or diffusers present, this effect was dependent on the speech task and only noticeable in the describe-and-draw a geometric figure task. In this task, we observed a decrease in mean SPL of 1.3 dB in the diffuser configuration and a mean fo decrease between 6 and 8 Hz for the reflector and diffuser configurations. We found the same discrepancy between tasks for SFAS use because using the SFAS only decreased vocal effort among participants in the describe-and-draw task. There are several possible explanations for this phenomenon. A plausible explanation might be that the relationship between vocal effort and room acoustics depends on the mode of speech. Previously, studies investigating the relationship between room acoustics and vocal effort have used different modes of speech, such as reading, 77 map description-tasks,11,12,79 and free speech.55,79 Previous research suggests that vocal effort is influenced by the mode of speech since parameters like mean fo, fo SD, pause and speech rates, and voicing periods differ depending on the speech task.35,79 Indeed, in our data, fo values were higher for the oral presentation task compared to the describe-and-draw task, suggesting that different modes of speech were used for each task. Moreover, the influence of room acoustics on voice may vary depending on the specific demands of the communication task, and spontaneous speech is suggested as mentally more demanding than reading.80,81 Differences in cognitive demands between the two speech tasks may have resulted in differences in vocal behavior between tasks and affected the speaker’s ability to take support from room acoustics and amplification devices when adjusting vocal behavior, but further investigation is required to confirm this hypothesis. Although there is limited research on the relationship between vocal and cognitive effort, self-perceived mental and vocal effort have been found to correlate strongly. 81 Since we did not ask participants to rate their speaker’s comfort separately for each task, our data only suggests a discrepancy in vocal behavior depending on the mode of speech. An additional consideration is the vocal health status among participants. Previous research suggests that teachers with self-reported voice problems utilize classroom acoustics differently than their vocally healthy peers. Unlike their vocally healthy peers, teachers with voice problems decrease their vocal SPL as voice support in classrooms increases, meaning that they are more aware of the acoustic environment and are able to decrease their vocal effort to increase their speaker’s comfort compared to their vocally healthy peers. 82 Therefore, the relatively small changes in f₀ and SPL observed among participants in response to room acoustic changes may be explained by the vocal health status of our participants.
Background noise
Background babble noise was the independent variable with the largest impact on speaker’s comfort and vocal effort, and the effect of noise was present in both speech tasks. In contrast, we found no immediate effect of noise on task experience, suggesting that noise only had an impact on aspects of comfort and vocal effort among participants. Nevertheless, there is evidence that noise affects other aspects of well-being for speakers, outside of vocal behavior and comfort.21 –24 Our results regarding task experience may be due to limitations in the measurement, as the task experience factor included only two items, and these may not have effectively captured participants’ task experience. Additionally, the distribution was skewed, with most participants scoring high on task experience. Moreover, while previous studies on the effects of noise on speakers have focused on long-term exposure in real-world teaching environments, our data specifically examined the immediate effects of short-term noise exposure in a controlled experimental setting.
Surprisingly, we found no interactions between acoustic configurations and background noise, meaning that in our data, background noise affected vocal effort and speaker’s comfort similarly regardless of the acoustic configuration in the room. Our results regarding the interaction between noise and room acoustics align with some previous research stating that in unfavorable room acoustics, participants increased their vocal effort regardless of whether background noise was present or not. 11 In contrast, other studies have shown that noise can influence the impact of room acoustics on vocal behavior.33,83 However, the combined effect of room acoustics and noise on voice does not occur immediately but develops over time, 33 which may explain some of the inconsistencies observed across different studies.
Sound field amplification system
With SFAS use, participants’ mean fo and SPL decreased by an estimated 1.5 dB and 5 Hz, respectively, indicating that the SFAS did decrease vocal effort among participants to some extent, which aligns with previous research using amplification systems such as SFAS or regular PA systems.49,50,84 Notably, SFAS differs from other amplification systems by specifically enhancing the mid-to-high frequencies of speech, improving speech intelligibility and signal-to-noise ratios, especially in occupied classrooms with high background noise levels. 85 As a result, it may impact listeners differently than a regular PA system, which in turn indirectly affects the speakers since speaker’s comfort is affected by the feedback from listeners.12,32 However, from a clinical standpoint, 5 Hz can be regarded as merely a small change in fo, leading us to conclude that voice amplification only made small changes to the speakers’ fo, which has been concluded in previous research as well.49,86 As with room acoustics, the effect of SFAS on vocal effort was likewise dependent on the mode of speech and only observed for the describe-and-draw task. This finding suggests, again, that the amount of support a speaker is able to use, whether it be via amplification systems or improved room acoustics, might be affected by the cognitive effort required during said speech task. Even though vocal effort seemed to decrease with SFAS use, participants did not perceive a significant decrease in speaker’s comfort with SFAS use. Although speaker’s comfort with SFAS use has not, to our knowledge, been studied before, previous research has reported positive outcomes regarding for example, self-rated vocal fatigue and effort with SFAS use.47,48 The results from these studies are, however, not directly comparable with our results since the length of SFAS use (3–12 months), the number of participants, and the self-assessment questions differed from our study. Furthermore, only descriptive data were available. It is possible that participants would have rated their perceived benefit from SFAS or speaker’s comfort during SFAS use differently if they had used the SFAS for a longer time. Additionally, we wanted to keep the amplification level of the SFAS constant between participants, which might have resulted in some participants not perceiving the amplification of their voice as sufficient. Indeed, when we asked participants to determine which amplification level of the SFAS was good for them at the end of the data collection period, 6 out of 15 participants answered that they would have chosen a higher amplification level for themselves while eight participants were content with the level we had chosen, one participants was not present at the last data collection., and none wanted to decrease the amplification level. Thus, in future research, it would be beneficial to let participants choose their preferred level of amplification. Participants mostly rated the question “The sound field amplification system was irritating to use,” with a 0 or 1 on the Likert-scale, indicating that they did not find the SFAS bothersome. However, because of the high skewness in the distribution, we did not include this question in our final analysis.
Some research has been conducted on the use of an SFAS in different acoustic conditions from the point of view of the listener.45,87 For listeners, it seems that poor room acoustic conditions with high reverberation times (>1 s) hinder the potential benefits of an SFAS for listening.44,45 On the other hand, since we found no interactions between room acoustics and SFAS, our data suggest that SFAS was beneficial in reducing vocal effort among speakers regardless of the acoustic configuration and even with reverberation times of approximately 1 s in mid frequencies (250–2000 Hz). While studies regarding the speakers’ use of SFAS in different room acoustics are lacking, one study reported that the associations between classroom reverberation times and teachers’ vocal parameters were the same in both unamplified and amplified classrooms. 49 This altogether suggests that somewhat longer classroom reverberation times do not seem to hinder the benefit of a classroom SFAS from the speakers’ point of view.
Our results regarding interaction effects between SFAS and noise were somewhat contradictory. Results suggest that participants’ fo (mode) decreased with SFAS use, but only in the babble condition, indicating that the SFAS was more effective in reducing vocal effort in noisy conditions compared to quiet conditions. The interaction effect was, however, small (about 4 Hz) and only present in the describe-and-draw task. Similar interactions between noise and SFAS were not observed regarding vocal SPL or self-perceptions of SFAS benefit, making it more challenging to draw clear conclusions. Female participants seemed to perceive a decrease in the SFAS benefit in noisy conditions, but the results were, however, not significant. Nevertheless, our results do not indicate that additional noise in learning spaces will hinder or worsen the benefit of an SFAS for speakers. To the authors’ knowledge, no other study has compared SFAS use in noisy and quiet conditions.
Sex and age differences
Our findings suggest sex differences regarding both speaker’s comfort and vocal behavior in background noise. In our study, female participants exhibited larger fo differences (both mean and mode values) in noisy and quiet conditions compared to male participants. These findings suggest that females might be putting in more vocal effort than males when needing to speak in noisy environments. Indeed, our results also indicated that self-rated speaker’s comfort was significantly lower among female participants compared to male participants in noisy conditions. Our findings are in line with previous research, stating that females find it more difficult to make themselves heard in noise and experience a higher subjective level of vocal effort when speaking in noise compared to males. 88 Other studies have also investigated sex differences in background noise and different room acoustics, with females reporting higher levels of noise annoyance, fatigue, and noise-induced stress, decreased cognitive performance in noise, and even differences in vocal adjustments in virtual reality rooms with different acoustic properties compared to males.55,89,90 Since the differences in fo between males and females in noise were of a small effect size (5–6 Hz), it is unclear how practically significant this finding is, since we saw no differences in SPL between female and male participants in noisy conditions. Hence, the observed sex differences in speaker’s comfort might be more closely related to noise annoyance than to actual clinically significant sex differences in vocal effort.
Since the age range was narrow between participants (late 20s to early 40s), we could not see the interaction effects between age, room acoustics, and noise clearly in our data. Given that age-related changes in the human voice, such as laryngeal muscle atrophy, loss of tissue flexibility, structural changes, and decreased muscle control, typically begin no earlier than age 50 and become more pronounced with advancing age,91 –94 it is unlikely that our data will reveal any real age-related differences, and the observed age differences in our data might be due to other underlying factors such as differences in work experience among participants.
Methodological considerations
There are some methodological aspects to consider when interpreting the results. First, because of scheduling issues, 5 out of 15 participants could not participate in all four data collection points, resulting in some missing data. Second, while participants had no information on room acoustic parameters for each configuration and were not informed of any details of the refurbishment process, it cannot be ruled out that visual aspects of the room might have influenced how participants rated their speaker’s comfort. Previously, research has confirmed placebo-like effects on listeners’ subjective assessments of clarity, and differing physiological responses due to differences in the interior of a room.95,96 Additionally, participants were informed of the aim of the study before participation and, as a result, may have anticipated an improvement in the room’s acoustics over time. Nevertheless, our data suggested a decrease in objective vocal parameters, mean SPL, and fo in configurations with reflectors or diffusers present. Third, the mixed-effects models with vocal parameters as outcome variables had a relatively high intraclass correlation coefficient (0.78–0.93), indicating that within-person variability was small. This suggests that vocal parameters were largely stable within individuals, which can weaken the effects of time-varying predictors such as room acoustics and noise. Consequently, the relatively weak effects observed for some fixed effects might partly be explained by the limited within-person variability in vocal parameters. Since the impact of background noise and room acoustics on vocal health is both immediate and cumulative,33,97 a longer speech task might have amplified these fixed effects. Nevertheless, because our study design included several different conditions in which the participant was asked to speak, excessively long speech tasks could potentially introduce the effects of fatigue. Fourth, some self-assessment questions exhibited skewness, leading to issues with the normality of residuals that could not be fully corrected through variable transformation. Specifically, skewness was observed in responses to the perceived benefit of the SFAS (“The sound field amplification system helped me to speak comfortably”), as most participants provided high ratings. Similarly, the factor task experience was skewed, with most participants reporting both a sense of success and enjoyment. Notably, we found no significant effect of fixed effects on task experience, suggesting that participants’ perceptions remained consistent across acoustic environments. A longer or more complex task, or the presence of a larger audience, might influence the distribution of task experience ratings. Finally, in future research, incorporating speaker-oriented measurements of room acoustics would be beneficial to better understand why participants preferred the room with reflective materials above the speaker position. This would also help clarify why simply shortening reverberation time and increasing speech clarity through greater absorption did not appear to influence speaker’s comfort or vocal effort among the participants.
Conclusions
Improved acoustics in learning spaces, especially with the addition of reflective materials such as wooden diffusers or plasterboards above the speaker position, increases speaker’s comfort, and decreases vocal effort among speakers.
The exclusive addition of thicker wall and ceiling absorbers, which reduced reverberation time and increased speech clarity, especially in the low-frequency range, was insufficient to significantly improve speaker’s comfort and reduce vocal effort among participants. This finding suggests that incorporating reflective materials can be an important factor in optimizing room acoustics for the speaker. However, further investigations using speaker-oriented room acoustic parameters are needed to confirm our results.
The relationship between vocal effort and room acoustics depends on the mode of speech, emphasizing the need for naturalistic speech tasks that reflect real-world teaching conditions in studies of vocal behavior in different acoustic environments.
Participants had a reduction in fo and SPL (mean) when using an SFAS but did not perceive an improvement in speaker’s comfort due to the SFAS.
While additional background noise negatively affected speaker’s comfort and increased SPL and fo among all participants, female participants experienced a greater impact than male participants. This underscores the importance of considering sex differences when examining the effects of noise and room acoustics on vocal behavior and comfort.
Supplemental Material
sj-docx-1-bua-10.1177_1351010X251364493 – Supplemental material for Speaker’s comfort and vocal effort in different room acoustic conditions: A controlled field experiment in a university lecture room
Supplemental material, sj-docx-1-bua-10.1177_1351010X251364493 for Speaker’s comfort and vocal effort in different room acoustic conditions: A controlled field experiment in a university lecture room by Nicole Cansu, Greta Öhlund Wistbacka, Sofia Holmqvist-Jämsén, Roland Rydell, Pia Calderara and Viveka Lyberg Åhlander in Building Acoustics
Supplemental Material
sj-xlsx-2-bua-10.1177_1351010X251364493 – Supplemental material for Speaker’s comfort and vocal effort in different room acoustic conditions: A controlled field experiment in a university lecture room
Supplemental material, sj-xlsx-2-bua-10.1177_1351010X251364493 for Speaker’s comfort and vocal effort in different room acoustic conditions: A controlled field experiment in a university lecture room by Nicole Cansu, Greta Öhlund Wistbacka, Sofia Holmqvist-Jämsén, Roland Rydell, Pia Calderara and Viveka Lyberg Åhlander in Building Acoustics
Supplemental Material
sj-xlsx-3-bua-10.1177_1351010X251364493 – Supplemental material for Speaker’s comfort and vocal effort in different room acoustic conditions: A controlled field experiment in a university lecture room
Supplemental material, sj-xlsx-3-bua-10.1177_1351010X251364493 for Speaker’s comfort and vocal effort in different room acoustic conditions: A controlled field experiment in a university lecture room by Nicole Cansu, Greta Öhlund Wistbacka, Sofia Holmqvist-Jämsén, Roland Rydell, Pia Calderara and Viveka Lyberg Åhlander in Building Acoustics
Supplemental Material
sj-xlsx-4-bua-10.1177_1351010X251364493 – Supplemental material for Speaker’s comfort and vocal effort in different room acoustic conditions: A controlled field experiment in a university lecture room
Supplemental material, sj-xlsx-4-bua-10.1177_1351010X251364493 for Speaker’s comfort and vocal effort in different room acoustic conditions: A controlled field experiment in a university lecture room by Nicole Cansu, Greta Öhlund Wistbacka, Sofia Holmqvist-Jämsén, Roland Rydell, Pia Calderara and Viveka Lyberg Åhlander in Building Acoustics
Supplemental Material
sj-xlsx-5-bua-10.1177_1351010X251364493 – Supplemental material for Speaker’s comfort and vocal effort in different room acoustic conditions: A controlled field experiment in a university lecture room
Supplemental material, sj-xlsx-5-bua-10.1177_1351010X251364493 for Speaker’s comfort and vocal effort in different room acoustic conditions: A controlled field experiment in a university lecture room by Nicole Cansu, Greta Öhlund Wistbacka, Sofia Holmqvist-Jämsén, Roland Rydell, Pia Calderara and Viveka Lyberg Åhlander in Building Acoustics
Supplemental Material
sj-xlsx-6-bua-10.1177_1351010X251364493 – Supplemental material for Speaker’s comfort and vocal effort in different room acoustic conditions: A controlled field experiment in a university lecture room
Supplemental material, sj-xlsx-6-bua-10.1177_1351010X251364493 for Speaker’s comfort and vocal effort in different room acoustic conditions: A controlled field experiment in a university lecture room by Nicole Cansu, Greta Öhlund Wistbacka, Sofia Holmqvist-Jämsén, Roland Rydell, Pia Calderara and Viveka Lyberg Åhlander in Building Acoustics
Footnotes
Acknowledgements
The authors thank Svante Granqvist for his support during the experimental setup and analysis of vocal recordings, Anna Kautto for the support on the statistical analysis, and Blaine Taylor for language revision. The authors thank Saint Gobain Ecophon for collaborating on this project and financing the acoustic refurbishment. Special thanks to acousticians Emma Arvidsson, Per Hiselius, and Jonas Christensson for performing the room acoustic measurements and collaborating on this project. A warm thank you to all the participants who showed interest and gave their time to this project.
Data availability statement
Data is available upon reasonable request from the authors. The data are not publicly available due to ethical restrictions.
Declaration of conflicting interests
The author(s) declared no potential conflicts of interest with respect to the research, authorship, and/or publication of this article.
Funding
The author(s) disclosed receipt of the following financial support for the research, authorship, and/or publication of this article: This research was partly financed by the Swedish Research Council for Health, Working Life and Welfare (FORTE) for the project “Communication, a challenge for the older employee: Need for a communication supporting workplace,” project ID 201901329, and the Åbo Akademi University Foundation.
Ethics approval statement
This study was approved by the Research Ethics Committee for Psychology and Speech and Language Pathology at Åbo Akademi University on May 10th, 2023. All participants confirmed informed consent in writing before taking part in the study.
Supplemental material
Supplemental material for this article is available online.
References
Supplementary Material
Please find the following supplemental material available below.
For Open Access articles published under a Creative Commons License, all supplemental material carries the same license as the article it is associated with.
For non-Open Access articles published, all supplemental material carries a non-exclusive license, and permission requests for re-use of supplemental material or any part of supplemental material shall be sent directly to the copyright owner as specified in the copyright notice associated with the article.