
Abstract
The in situ characterization of materials is a crucial challenge in room acoustics, as laboratories measurement cannot always be applied in consultancy practices. In particular, there is a lack of method to characterize in situ systems with perforated facings, which are commonly encountered systems in room acoustics. In this paper, the in situ characterization of a rigidly-backed porous material behind a rigid perforated facing by means of pressure–velocity measurements is presented. The method includes an inverse impedance model fitting based on measurement in a limited frequency range. The applicability of this method was studied by measuring a variety of perforated facings, whether in front of an air cavity or backed by a porous layer, and comparing the obtained impedance model parameters to reference values. Good agreement was observed between the retrieved parameters and the references, with the errors in all retrieved parameters moving mass, facing thickness, cavity depth, porous layer thickness and porous layer flow resistivity not exceeding 15%.
Keywords
Introduction
The acoustic characterization of materials is one of the challenges in room acoustics, as the properties of the laid–out materials have a significant impact on the acoustics of an indoor space. In some cases, it is necessary to measure the material in situ, because the mounting conditions and deterioration over time can result in material properties different from those measured in a laboratory. Moreover, measuring data in situ avoids the problem of bringing a material sample to the laboratory for a standardized impedance tube measurement. 1
An in situ characterization method was introduced in a previous paper. 2 This method combines a pressure–velocity (PU) measurement for a sound wave with normal incidence to the surface to be characterized with an impedance model fitting procedure. In the same paper, it was shown that this approach allowed an accurate characterization of hard-backed porous layers. However, in most applications, the surfaces of the acoustic materials installed in a room are not left bare. Their visible surface is usually covered for mechanical and aesthetic purposes. While these facings can have a negligible effect on the acoustics, in some cases they are designed to be an integral part of the acoustic system, usually adding a resonant sound absorption mechanism to the porous absorption. One of the most common types of acoustic covering is a perforated wooden plate. 3
The influence of such facings can be predicted using various modeling approaches. One such approach uses a Helmholtz resonator to characterize the facing as an acoustic mass and an acoustic resistance, to account for the movement of air within the perforations and the associated losses. This model assumes that the wavelength is much larger than the dimension of the perforation. A separate model has been developed by Maa 4 for micro-perforated panels (MPPs), which have facing perforations with sub-millimetric dimensions. A more recently developed approach is the equivalent Johnson–Champoux–Allard (JCA) model, which considers the facing as a rigidly framed porous material whose properties are described with parameters related to the geometry of the facing. The JCA model was found to correctly predict the acoustic performance of both perforated facings and MPPs. 5 Other approaches to predict the performances of more complex perforated facing systems such as heterogeneous perforations or grooved facings have also been presented.6,7 These more complex geometries, as well as MPPs, are out of the scope of this paper.
This paper focuses on the inverse in situ characterization of systems with perforated facings either on an air cavity or a porous layer, in an in situ context. In a study from 2011. 8 such estimation of the acoustic parameters of two perforated facings was achieved by combining impedance tube measurements and comparisons of the results to the model of Atalla and Sgard. 5 This study was however based on laboratory measurements. In another publication, 9 an in situ measurement of a slotted panel absorber was done with the help of a small pressure–velocity, and yielded estimations of the complex surface impedance and absorption coefficient of the panel from measurements realized without an impedance tube and a special environment like an anechoic room. However, it presented no attempts to compare the results to an impedance model and obtain an inverse characterization of the panel. The same pressure–velocity apparatus was used in a third publication 10 to measure the absorption coefficient and the transmission loss of a micro-perforated panel in an anechoic room environment and the results compared to an impedance model, but no acoustic parameters were extracted through an inverse characterization. However, to the knowledge of the authors, there is no existing literature on the investigation of PU-based, in situ inverse characterization of perforated systems in an in situ context.
The goal of this study is to evaluate the applicability of an in situ inverse PU-characterization method for multilayered acoustic systems with rigid perforated facings. To assess their strengths and weaknesses with respect to the applicability and accuracy of in situ inverse characterization, two approaches to model the rigid perforated facings have been investigated: the Helmholtz resonator model and the equivalent JCA model. Various combinations of perforated panels and backings (air cavity and hard-backed porous layers) have been measured experimentally and the retrieved parameters obtained from the inverse characterization were compared to reference values. The measurements presented in this study are limited to perforated facings with backing layers consisting of either a porous layer (two types) backed by a hard wall or by an air cavity without material. Furthermore, this study is limited to square samples of perforated panels with dimension 0.6 m made of medium density fiberboard (MDF). Finally, the only perforation type measured was with circular holes, homogeneously spread in lattice patterns.
This paper is structured as follows. The method used to characterize the system in situ is first presented in section “Methods” and introduces the impedance models used for the fittings. Next the measurement setup employed to verify the validity of the approach is described in section “Practical implementation,” after which the results are presented and discussed in section “Results.” Finally, the conclusions of this work are given in section “Conclusion.”
Methods
Measurement procedure
The measurement procedure revolves around the acquisition of four impulse responses (IRs). The acquisition of IRs has an advantage over steady-state transfer functions in that it allows the removal of parasitic reflections via time-windowing. First, pressure and particle velocity in the direction of the source-probe axis (
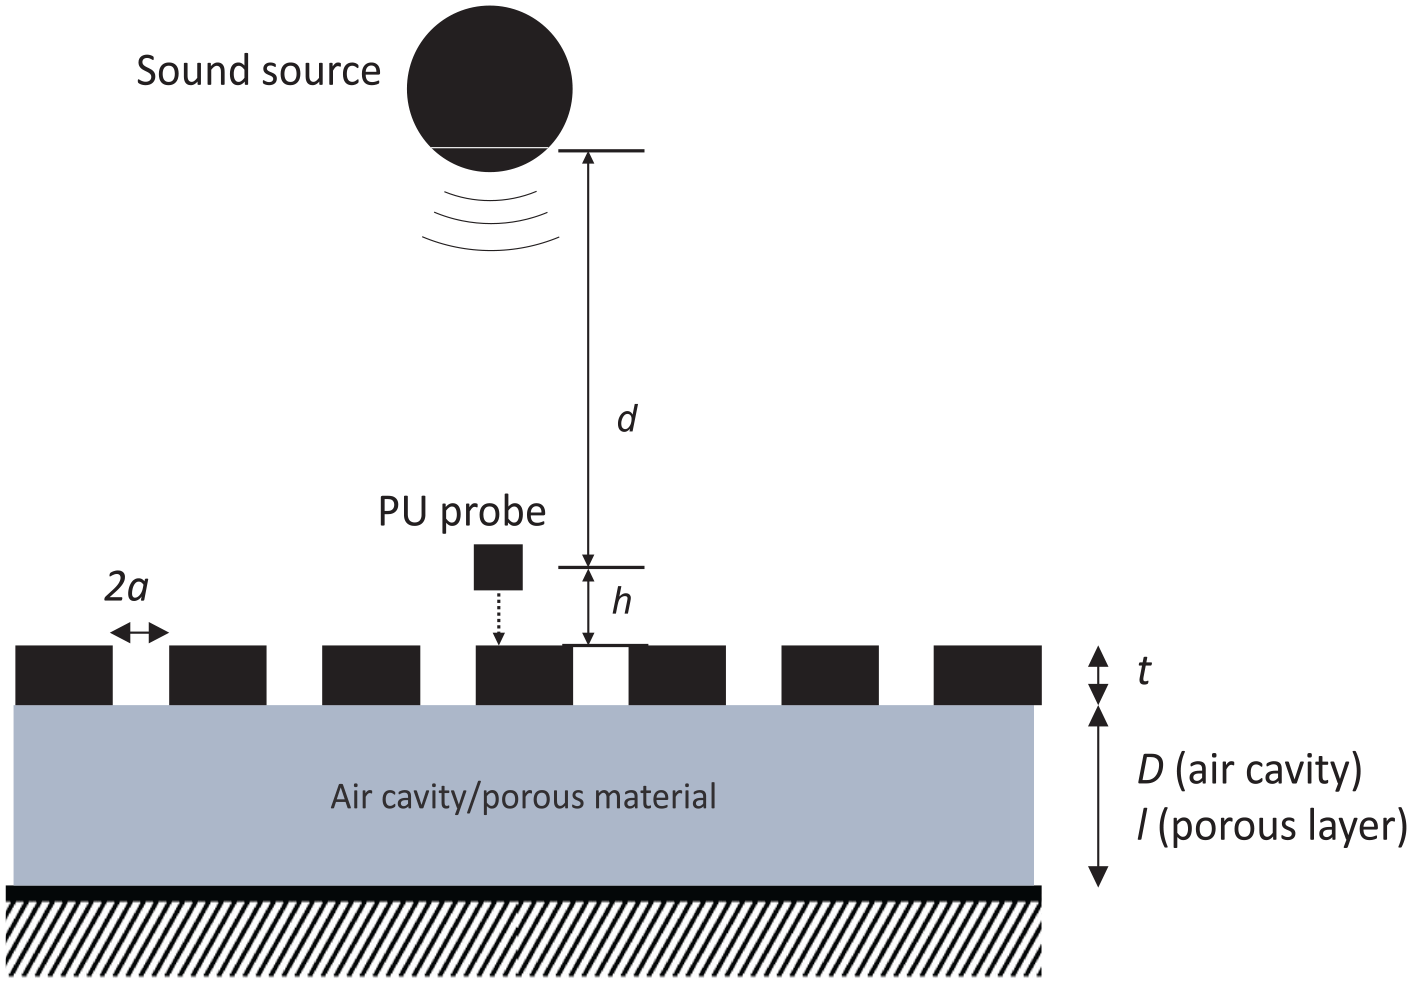
Arrangement of sound source and PU probe above the perforated facing system.
Subsequently, a Fourier transform is applied to the windowed signals and the complex reflection coefficient is calculated using the image-source model presented in Li et al.
12
and Alvarez and Jacobsen.
13
With the speaker-probe distance,
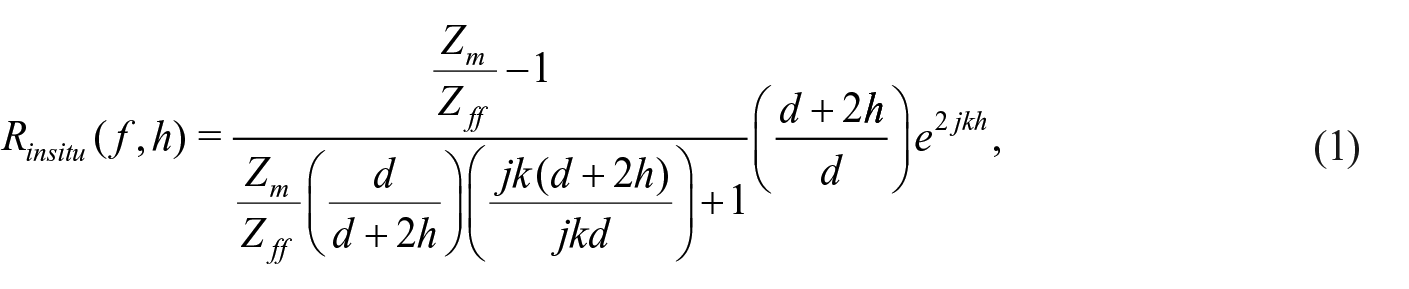
where
Model fitting procedure and error estimation
The reflection coefficient obtained from equation (1) depends on the probe-sample distance,
The complex reflection coefficients acquired from the in situ measurements are fitted to those predicted by impedance models via an optimization routine. The plane normal-incidence complex reflection coefficient at the surface of the system is related to the modeled surface impedance,
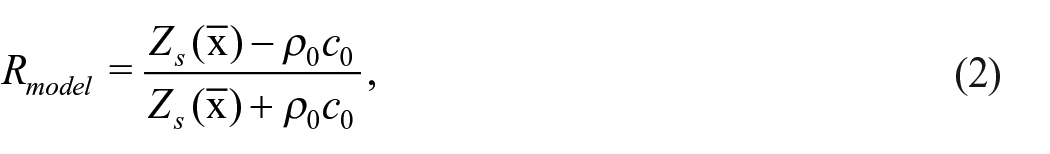
where
Two separate models are studied to characterize the perforated panel: the Helmholtz resonator approach and the equivalent JCA model approach. The various expressions of
By using equations (1) and (2), a cost function,
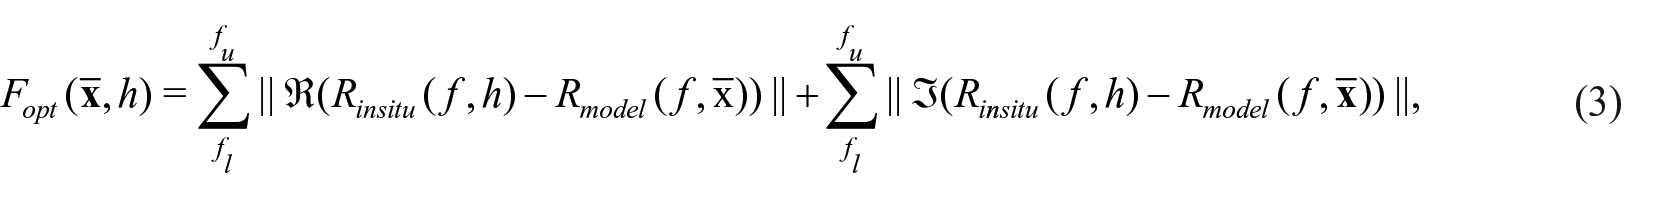
where
The reflection coefficient was chosen as the basis of the cost function because the absolute values of both the real and imaginary parts of reflection coefficients are bounded by 1, which provides a natural normalization of deviations between the fittings of the real and imaginary parts during the optimization process. The lower bound of the frequency range is determined by limitations related to the plane wave approximation used in equation (1), the type of source used in the setup, and the source-to-probe distance. For the experimental setup used in this study (see section “Practical implementation”), the assumption is valid down to around 500 Hz; the wavelength below this frequency becomes large compared to the source-to-probe distance used (260 mm) and thus invalidates the plane-wave assumption.
Based on this model fitting procedure, the final estimates of the measured and fitted reflection coefficients are extracted as


Physically,
Impedance models
Helmholtz resonator model
A rigid perforated facing can be modeled as the combination of a generic acoustic resistance term,

where
For reference, the moving mass within the perforations can be estimated in the case of circular perforations with:
where

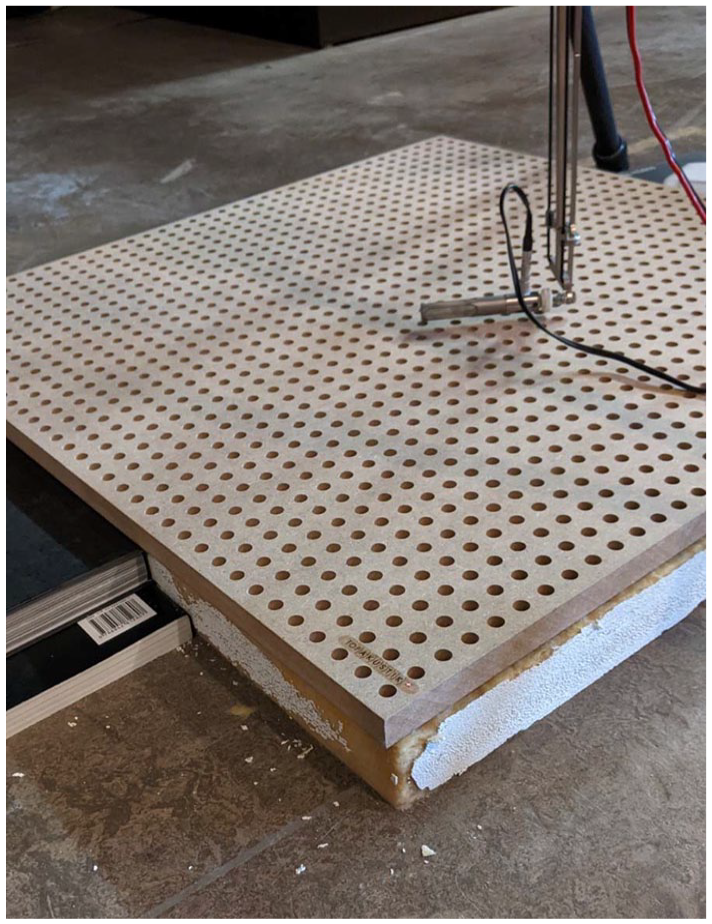
Picture of a perforated facing (Perf II) measured with Material A as backing.
Further expressions for more perforation shapes and patterns can be found in Chapter 7 of Cox and D’ Antonio. 3
A limitation of the Helmholtz resonator model (equation (8)) is that it is only valid as long as the dimensions of the perforations are very small compared to the wavelength.
A theoretical prediction for the loss within the perforated facing has been derived by Ingard 16 :
where
Equivalent JCA model
Another way to model a perforated facing was introduced by Atalla and Sgard.
5
Their method models the perforated facing with an equivalent propagation constant and characteristic impedance, based on the JCA theory. In this framework, the parameters of the equivalent JCA fluid (resistivity,


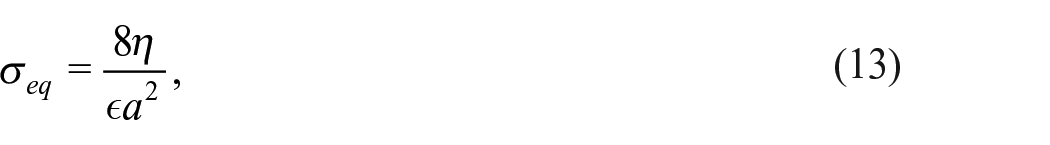
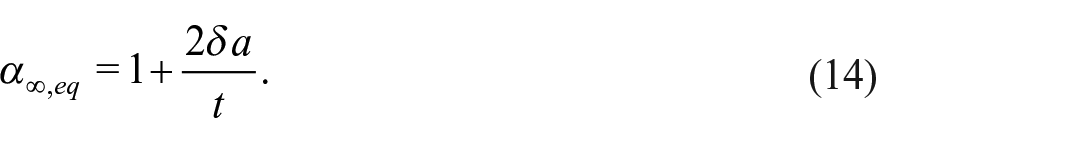
Following these formulas, the characteristic impedance,
This model of a facing depends on the perforation radius,
Air cavity backing
Where the perforated facing is backed by an air cavity, the surface impedance of the backing layer is computed with

where
Porous layer backing
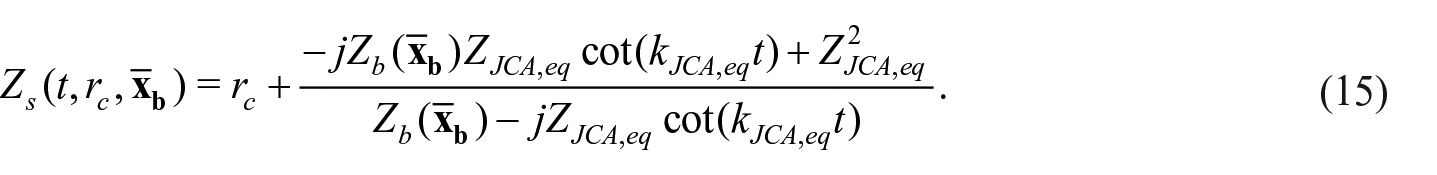
Where the perforated facing is backed by a porous layer, the surface impedance of the backing layer becomes:

where
Practical implementation
In situ measurements
Materials
Measurements were carried out to characterize a set of systems featuring perforated facings. The three perforated facings investigated were made of 16 mm thick MDF and featured straight circular perforations in lattice patterns, with varying perforation radii: 3, 4, and 5 mm. The geometrical properties of the three facings, as well as the predicted acoustic mass calculated from the Helmholtz resonator model from equation (8), are given in Table 1. The lateral dimensions of the samples were 0.6 × 0.6 m. Each of the panels was coupled with three rigidly backed conditions:
• a 45 mm air cavity, which was created by putting the facing on top of rubbers bars;
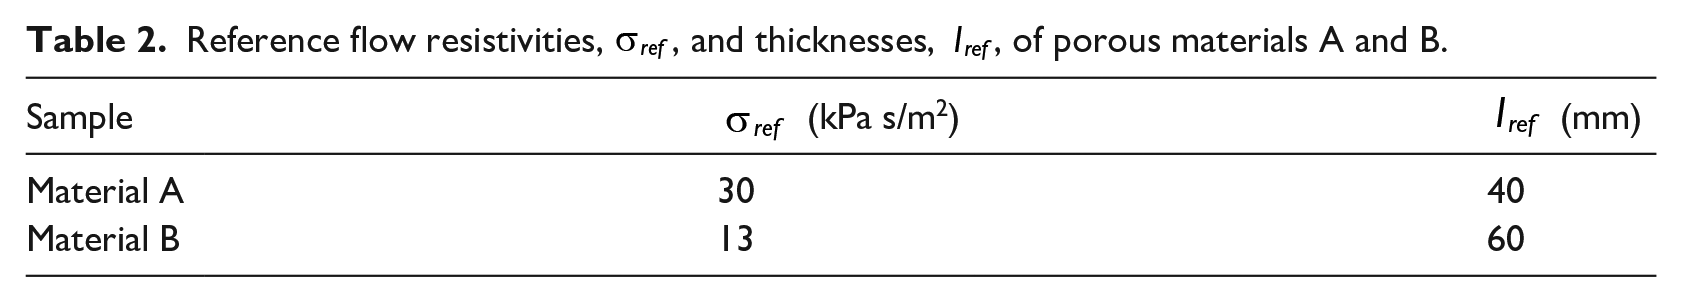
• a 40 mm glass wool layer (porous material A);
• a 60 mm rock wool layer (porous material B).
Reference radii, open ratios, thicknesses and moving masses (via Equation (8)) of the perforated facings measured.

Thus, there were nine acoustic systems to characterize. The reference thicknesses and flow resistivities of the two porous materials are shown in Table 2. The reference flow resistivities were obtained from the low-frequency limit of the imaginary part of the dynamic mass density, 18 extracted from impedance tube measurements via the two-cavity method. 19
Reference flow resistivities,
Procedure
The measurements took place in the workshop space of the Echo building at the Eindhoven University of Technology. The room was not empty, as measurement equipment and various objects were present, but a clearance radius of approximately 1.5 m around the measurement location was arranged. The systems to be characterized were mounted on the floor of the room, a 300 mm-thick smooth concrete slab, which served as rigid backing. Compression of the porous layers by the rigid facings was avoided by supporting the two opposite edges of the facing with piles of books of equal heights so that the facings were supported at a level less than 3 mm above the surfaces of the porous layers. This small air gap was neglected in the fitted models. The measurement conditions are shown in Figure 2.
The measurement device used was the “In Situ Absorption setup” by Microflown Technologies, which was mounted on a lightweight tripod. This device consisted of a PU probe attached to a small spherical loudspeaker via a structure that decouples vibrations between the loudspeaker and sensors. The PU probe comprises of an omnidirectional free-field microphone and a particle velocity sensor capturing the velocity in one direction. The two sensors are positioned close to each other in the probe such that they are considered to be in the same position. The decoupling structure sets the distance from the loudspeaker diaphragm to the probe,
For all recordings, the probe is oriented so that the velocity is recorded along the direction orthogonal to the panel’s surface. For the measurement of
The output of the PU probe was connected to the Microflown signal conditioner, which separated the pressure and velocity signals into two channels. The outputs of the conditioner, as well as the loudspeaker, were connected to a 2-in/2-out USB audio interface (Triton V2 Standard, Acoustics Engineering), connected to a laptop running the DIRAC 6 room acoustics acquisition software (Acoustics Engineering). The software was used to perform the de-convolution of sent and recorded signals to derive the impulse responses for both pressure and velocity channels. The source signal, a 5-s-long exponential sine sweep (ESS), was sent from DIRAC 6 to the speaker via an intermediate amplifier.
The distance from the source and receiver to the closest reflective surface of the measurement environment was measured at around 1.5 m. The approximate time delay between the incident sound peak and the first parasitic reflections was thus computed as
Model fitting
The cost function,
Lower
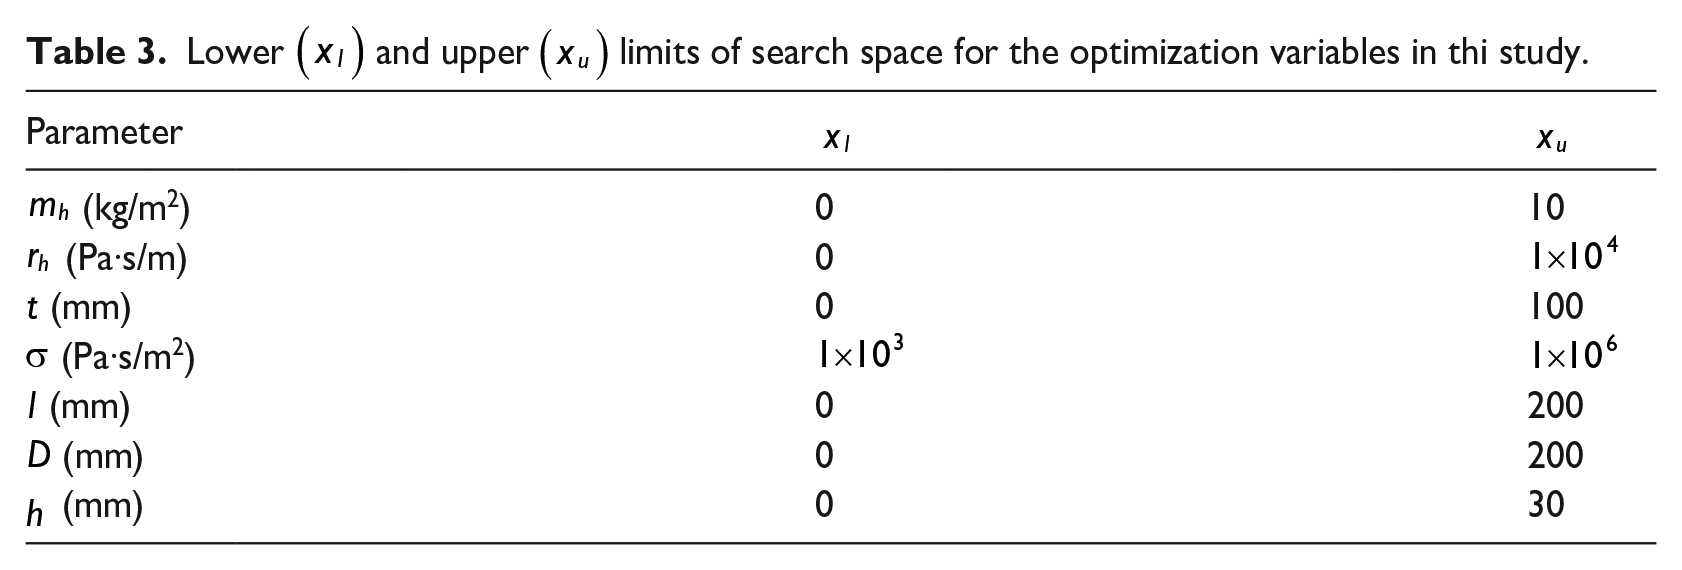
The number of starting points fed to the MultiStart procedure,
The frequency ranges of the model fitting were different for the two impedance models because the Helmholtz resonator model becomes invalid above 5 kHz, as the ratio between the wavelength
Results
In this section the results are presented. For each configuration, figures are shown comparing both real and imaginary parts of
Helmholtz resonator model characterization
This section presents the characterization results of the perforated facings with a Helmholtz resonator model fitting. Figure 3 shows the complex reflection coefficient curve fittings obtained for the three perforated facings backed by the air cavity. The model and measurement are in good agreement from 500 Hz to around 4 kHz. At higher frequencies, the measurements and fitted models deviate significantly from each other because the Helmholtz resonator model is valid only when the perforation size is small compared to the wavelength, a condition that begins to be violated at higher frequencies. The curves start to deviate from 4 kHz upwards, which corresponds to a wavelength of 86 mm, that is, more than 15 times the radii of the perforations.
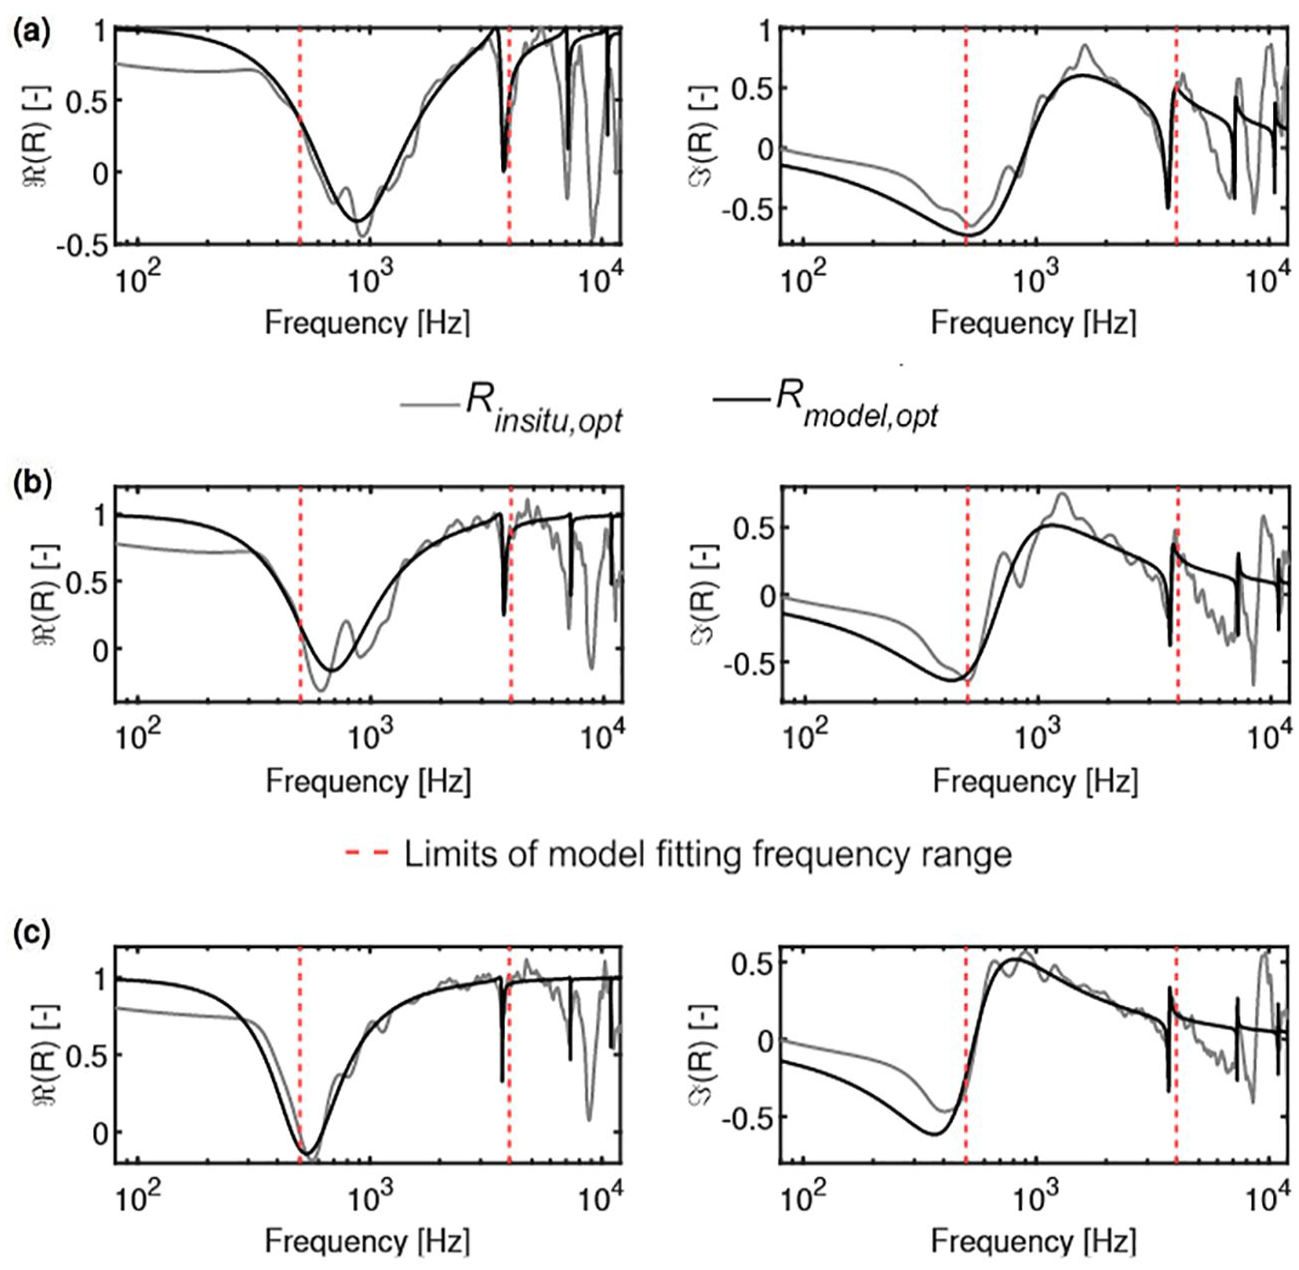
Measured and model fitted complex reflection coefficient of (a) Perf. I, (b) Perf. II and (c) Perf. III backed with a 45 mm air cavity, using the Helmholtz resonator model for the facing. Gray line:
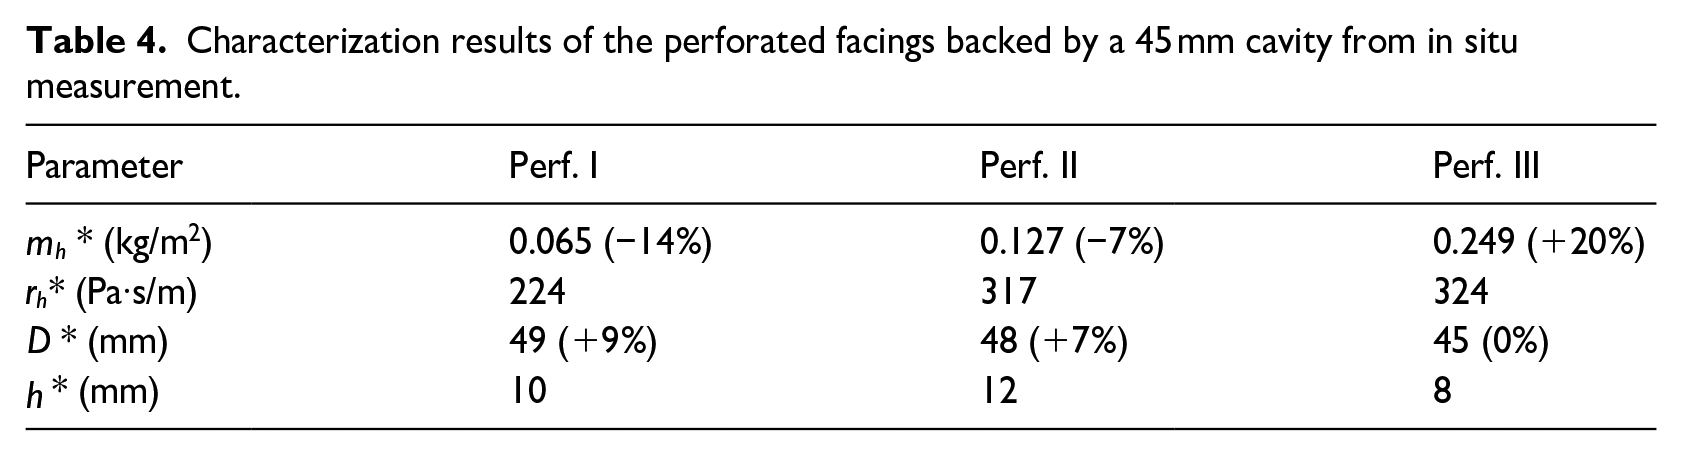
Table 4 shows the results obtained from the in situ measurements of the facings backed by a 45 mm cavity. Slight inaccuracies (smaller than 5 mm) are observed for the cavity depth retrieved in the case of Perf I and II, which are the facings with greater open areas. This could be due to small differences in height in the rubber bars used to create the cavities. It could also be because the greater perforation radii in Perfs I and II result in plugs of air of increased volume, thereby altering the effective depth of the cavities. The error in the retrieved moving mass varies depending on the facing: 20% for Perf. III and only 7% for Perf. II. The reason for these errors is not clear. The underestimates for Perfs. I and II could be due to a boundary layer effect in the perforations partially preventing the air from moving because of friction forces. Additionally, as seen in all the result tables presented in this section, the values retrieved for the probe-to-sample distance,
Characterization results of the perforated facings backed by a 45 mm cavity from in situ measurement.
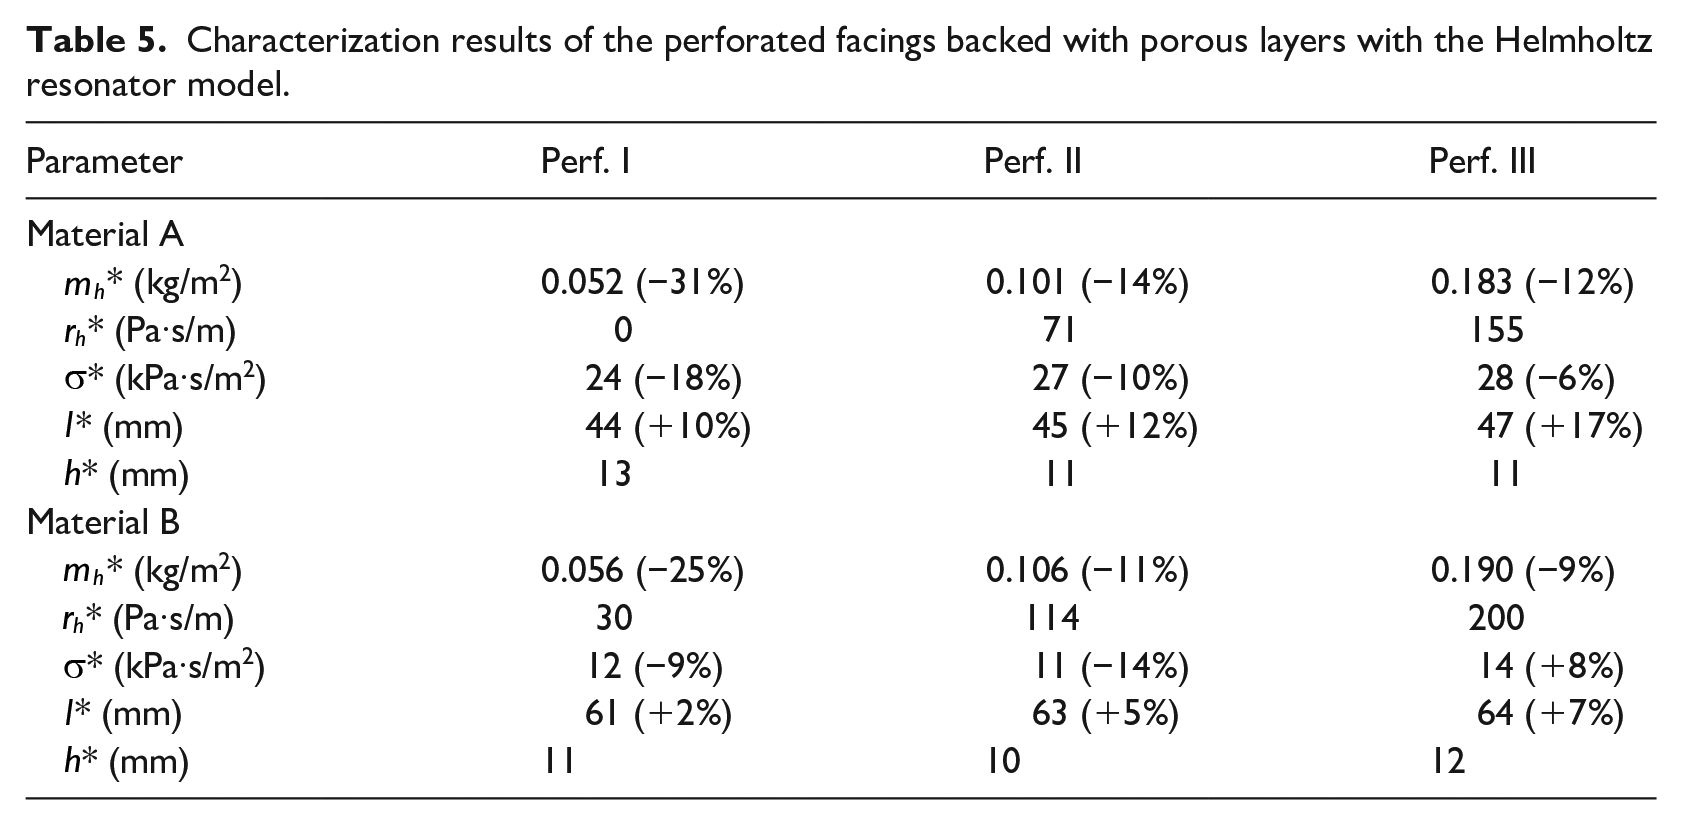
The characterization results of the facings when backed by porous layers are given in Table 5 and the curve fittings in Figures 4 (Material A) and 5 (Material B). Comparing these new plots with Figure 3 shows that the replacement of the air cavity with a porous layer changes greatly the resulting reflection coefficient. Two main differences can be observed: first, the multiple sharp cavity resonances above 3 kHz have disappeared with the introduction of a porous layer, as the layer prevents the formation of modes in the cavity. Moreover, the sharpness (or quality factor) of the Helmholtz resonance (lowest first dip on the plots) is decreased in the porous layer configuration because of the additional damping produced by that layer.
Characterization results of the perforated facings backed with porous layers with the Helmholtz resonator model.
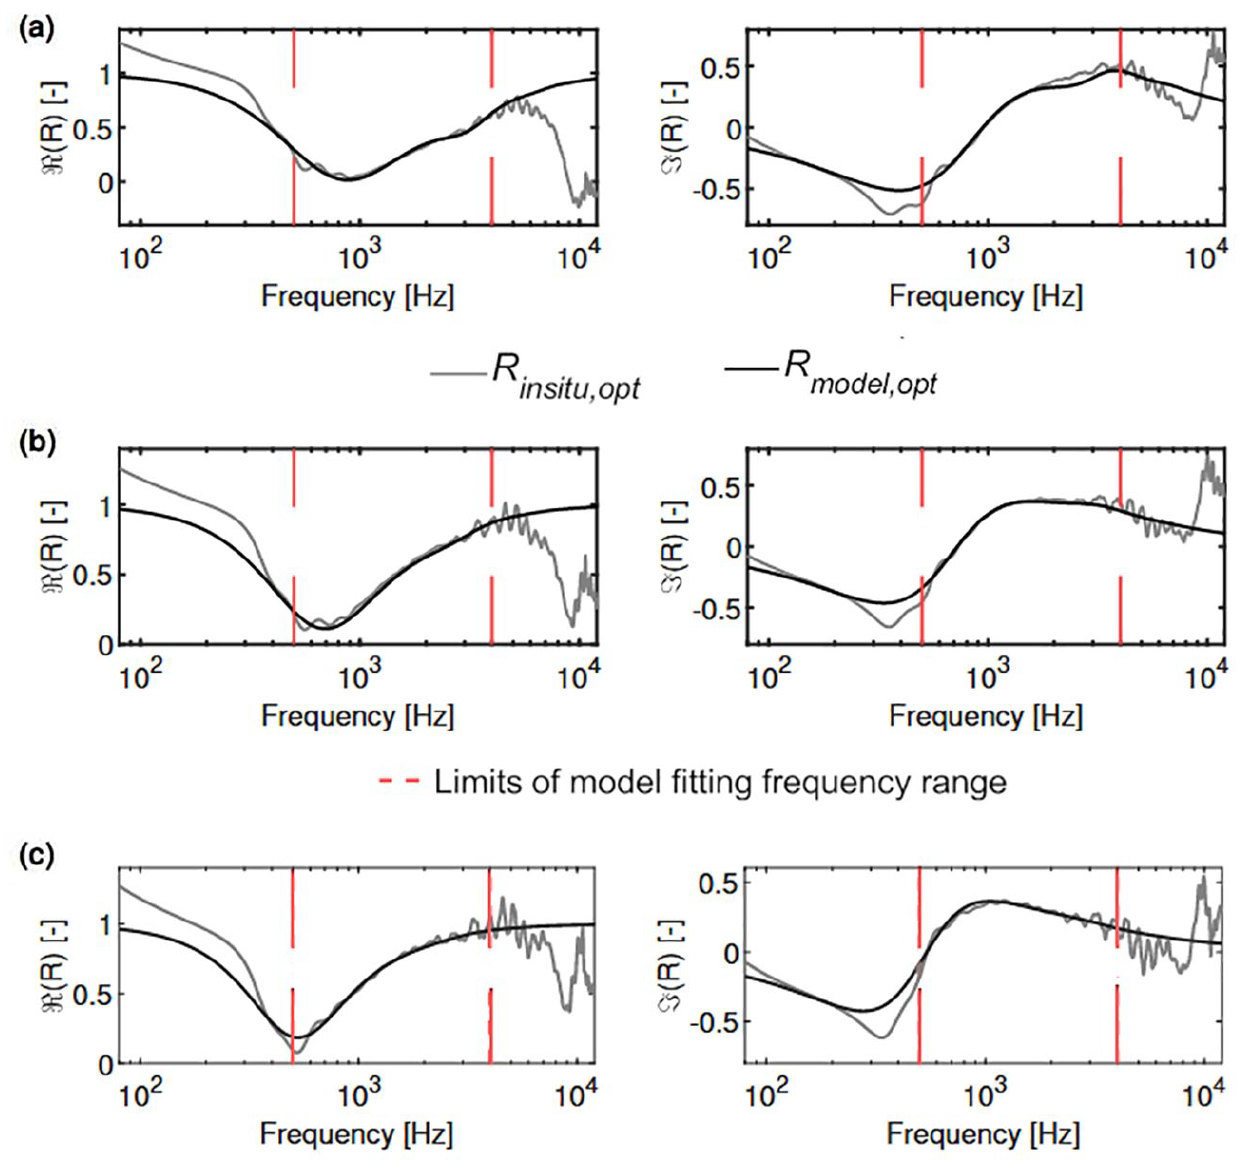
Measured and model fitted complex reflection coefficient of (a) Perf. I, (b) Perf. II, and (c) Perf. III backed with Material A, using the Helmholtz resonator model for the facing. Gray line:
Table 5 shows that the moving masses retrieved are about 30% smaller than those retrieved in the air cavity configuration. This could be caused by the presence of the porous layer behind the perforations, which reduces the effective length of the plug of air moving in the perforations, and hence the total moving mass. This is consistent with the fact that the masses retrieved when Material B is used as backing are slightly higher than those retrieved when Material A is used as backing. As material A is a “stiffer” material with a higher flow resistivity, it is expected to offer a greater resistance to the movement of the air out of the perforations. The acoustic resistances retrieved are also lower than those for the air cavity configuration, and a sharp increase in acoustic resistance is observed with the reduction of the perforation radius. The fact that the resistance values are lower than for the cavity configuration could be due to the inclusion of the porous layer in the model, which allows the attribution of a part of the damping to the porous layer instead of a generic resistance.
The retrieved porous layer parameters are in fair agreement with the references. However, the match is much better for Material B, whereas overestimates in thickness of about 10–17% (4–7 mm) and underestimates in resistivity of about 6–18% (2–6 kPa·s/m2) are found for Material A. This might be because the reflection coefficient is not very sensitive to the thickness of the porous layer. The curve fitting itself was in good agreement with the measurement from 500 Hz to 5 kHz for both porous backings, as can be seen from Figures 4 and 5.
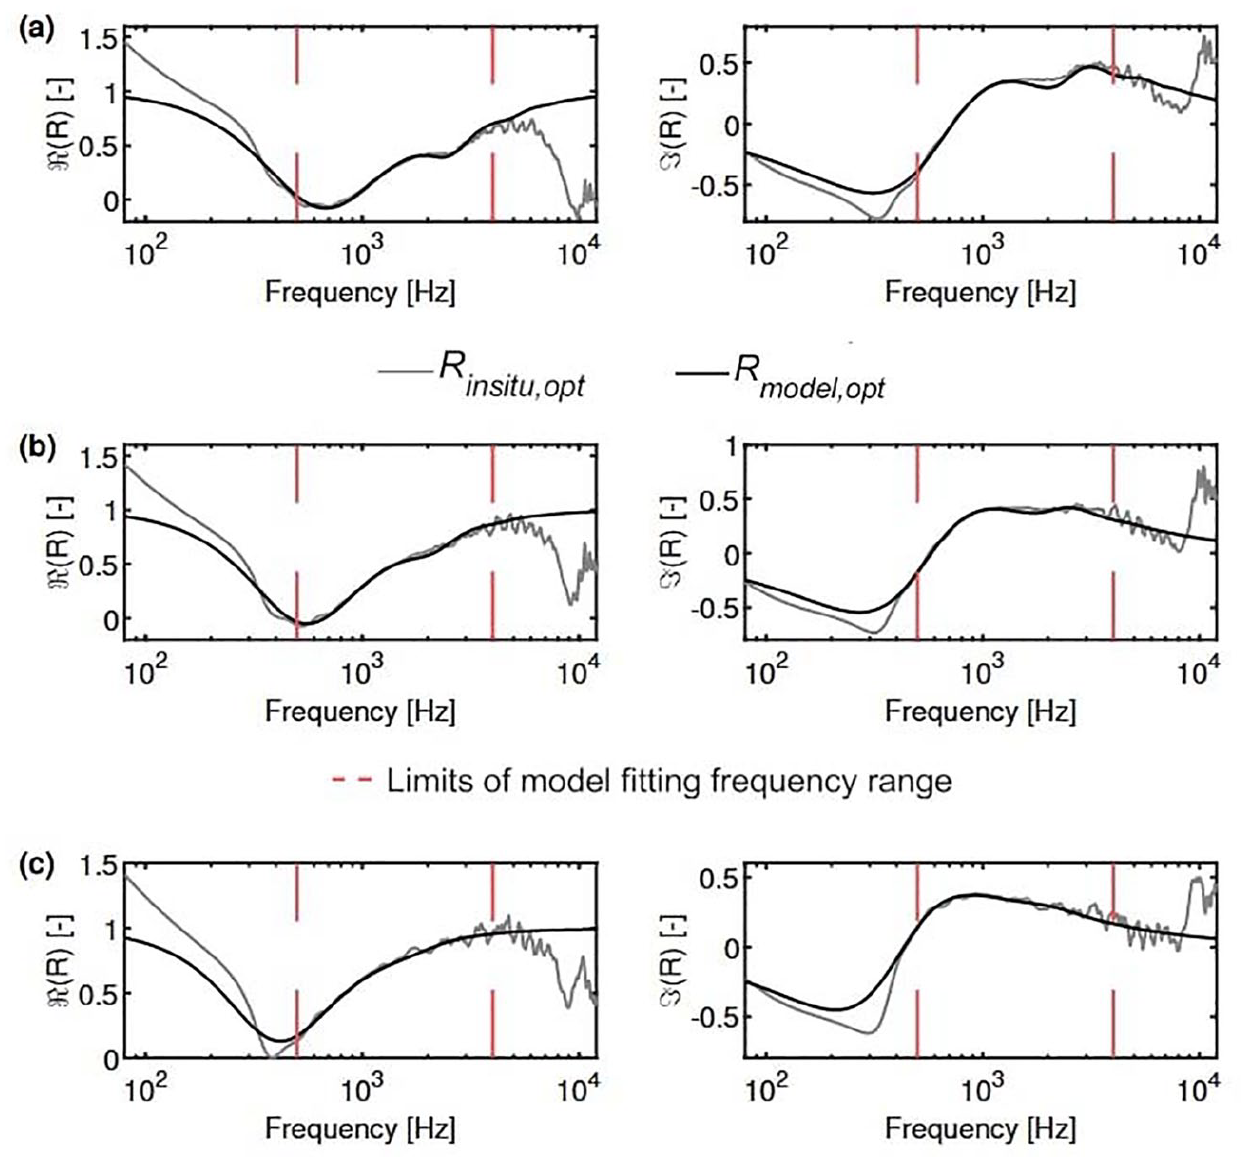
Measured and model fitted complex reflection coefficient of (a) Perf. I, (b) Perf. II, and (c) Perf. III backed with Material B, using the Helmholtz resonator model for the facing. Gray line:
Equivalent JCA characterization
The results obtained by using an equivalent JCA model for the facings are presented in this section. To limit the number of variables within the optimization process, and because these values can be easily retrieved by visual inspection, the open ratio,
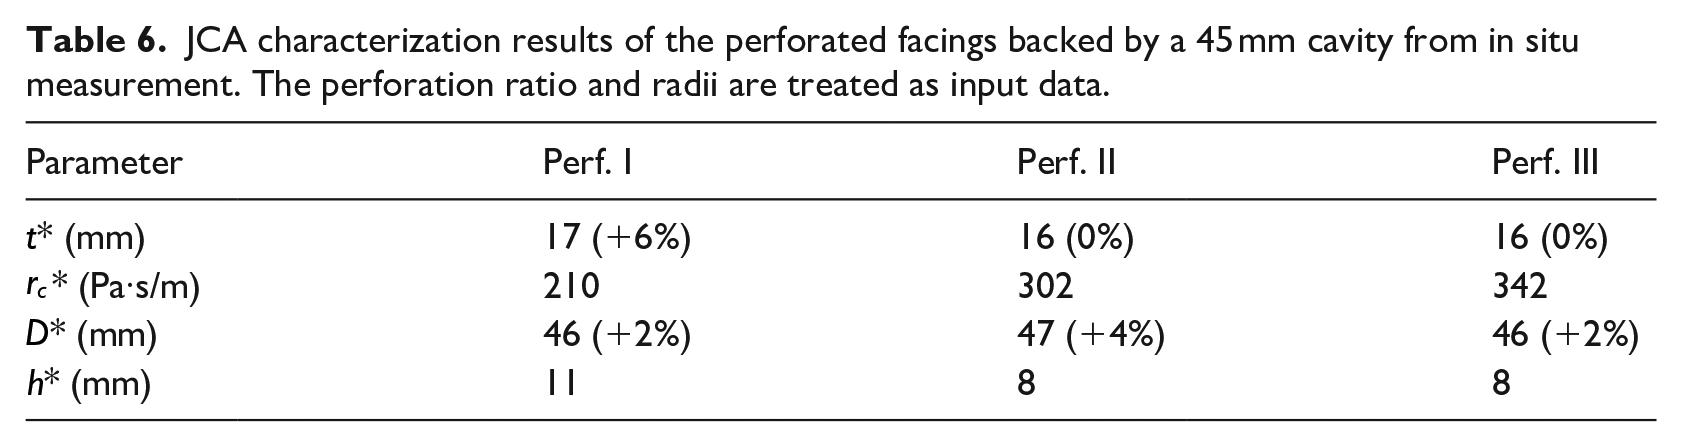
The results obtained for a 45 mm cavity backing are shown in Table 6. The retrieved values of the cavity depth and facing thickness are retrieved with very good accuracy, with maximum errors of 4% and 6%, respectively. The values of the generic resistances retrieved increase as the perforation radius decreases, as is the case for the resistances retrieved in the Helmholtz resonator modeling.
JCA characterization results of the perforated facings backed by a 45 mm cavity from in situ measurement. The perforation ratio and radii are treated as input data.
Looking at the curve fitting obtained from the JCA modeling of the facings in Figure 6, a very good agreement is obtained up to 10 kHz, which was not the case when using the Helmholtz resonator model. This is because the JCA model does not assume that the wavelength is large compared to the perforation size.
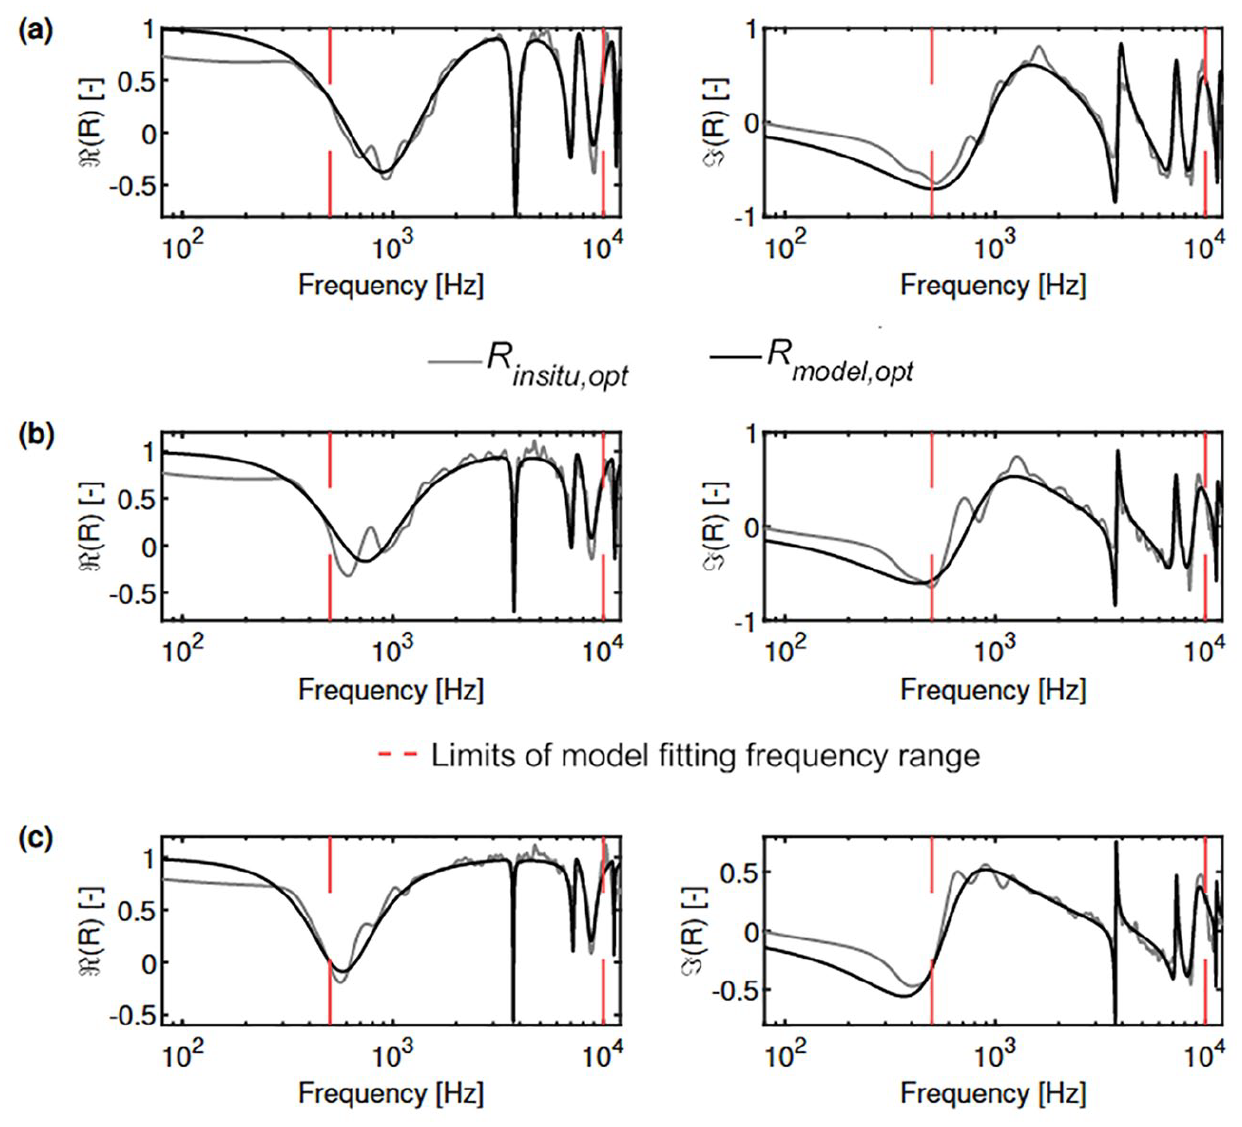
Measured and model fitted complex reflection coefficient of (a) Perf. I, (b) Perf. II, and (c) Perf. III backed with the 45 mm air cavity, using the equivalent JCA model for the facing. Gray line:
The characterization results obtained for measurements of the facings with porous layer backings are presented in Table 7. The error values are very low. The error for the facing thickness compared to the reference value is always less than 0.5 mm, which results in a relative error
JCA characterization results of the perforated facings backed by porous layers. The perforation radius and open ratio of each perforated panel are fixed for the fitting.
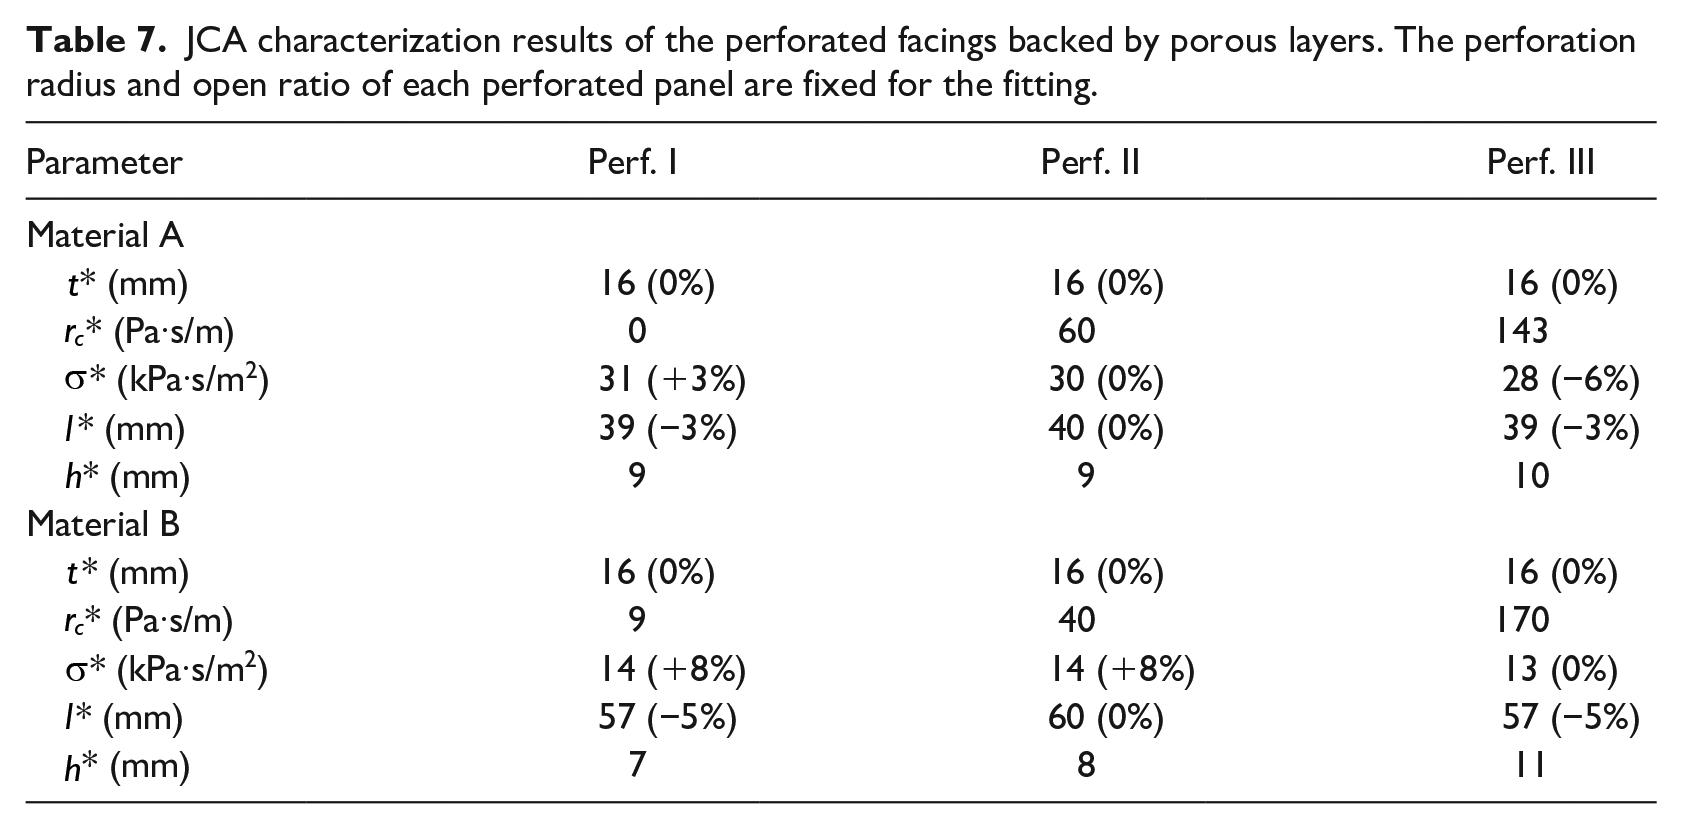
Figures 7 and 8 show that the model matches the measurement very well up to 10 kHz, demonstrating that the JCA equivalent model for the perforated facing allows for the prediction of the properties at higher frequencies than the Helmholtz resonator model when the facing is backed by a porous layer.
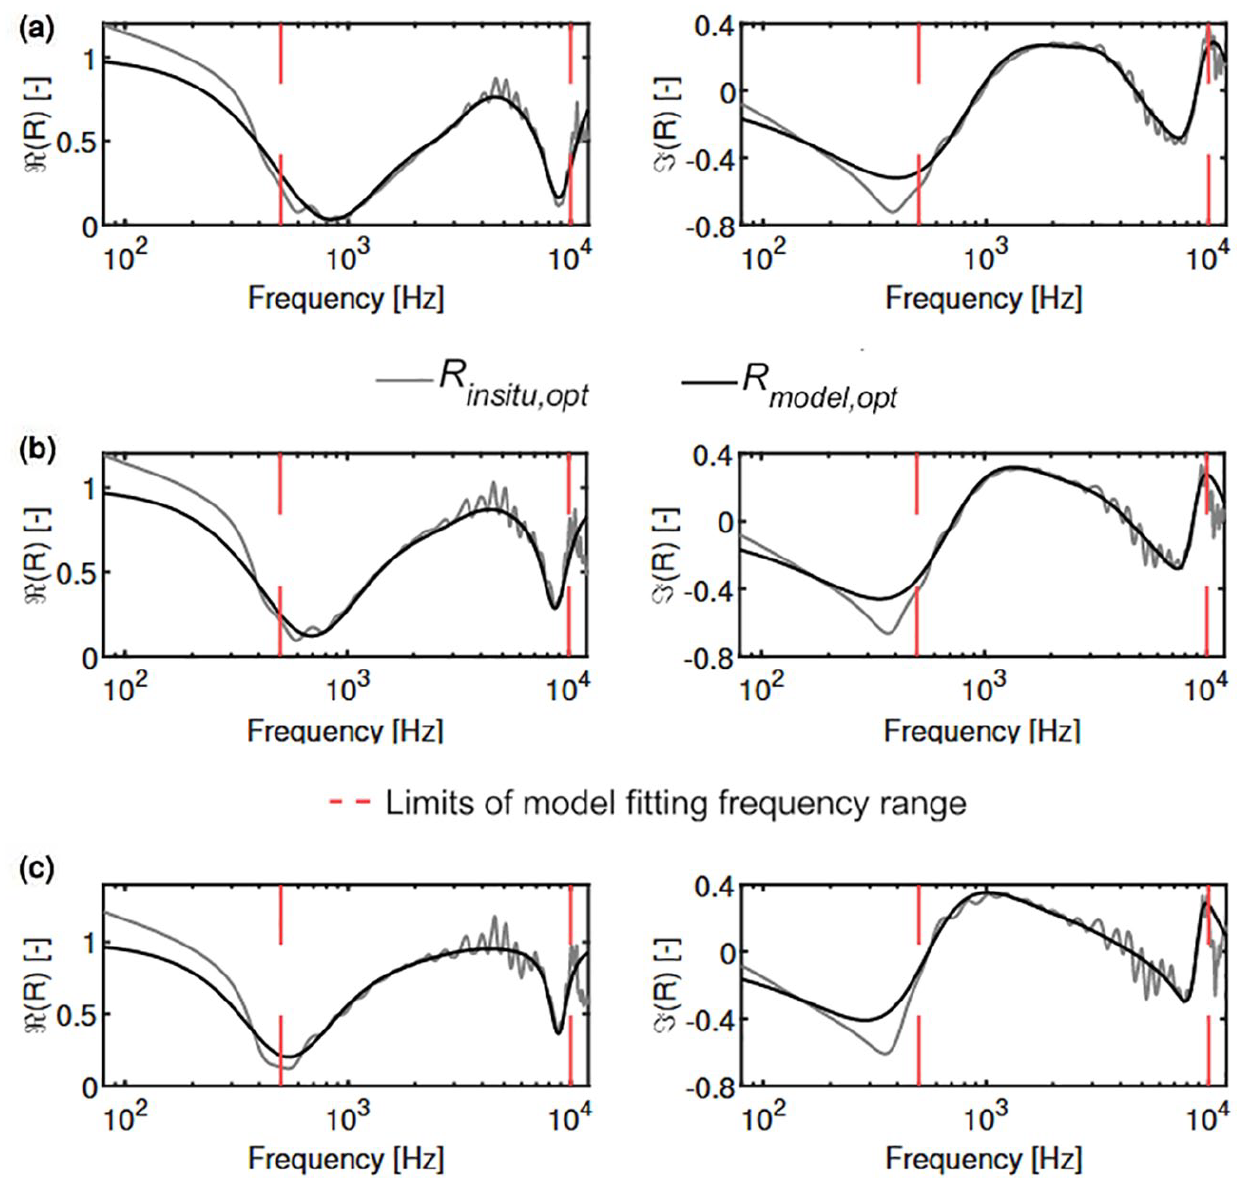
Measured and model fitted complex reflection coefficient of (a) Perf. I, (b) Perf. II, and (c) Perf. III backed with Material A, using the equivalent JCA model for the facing. Gray line:
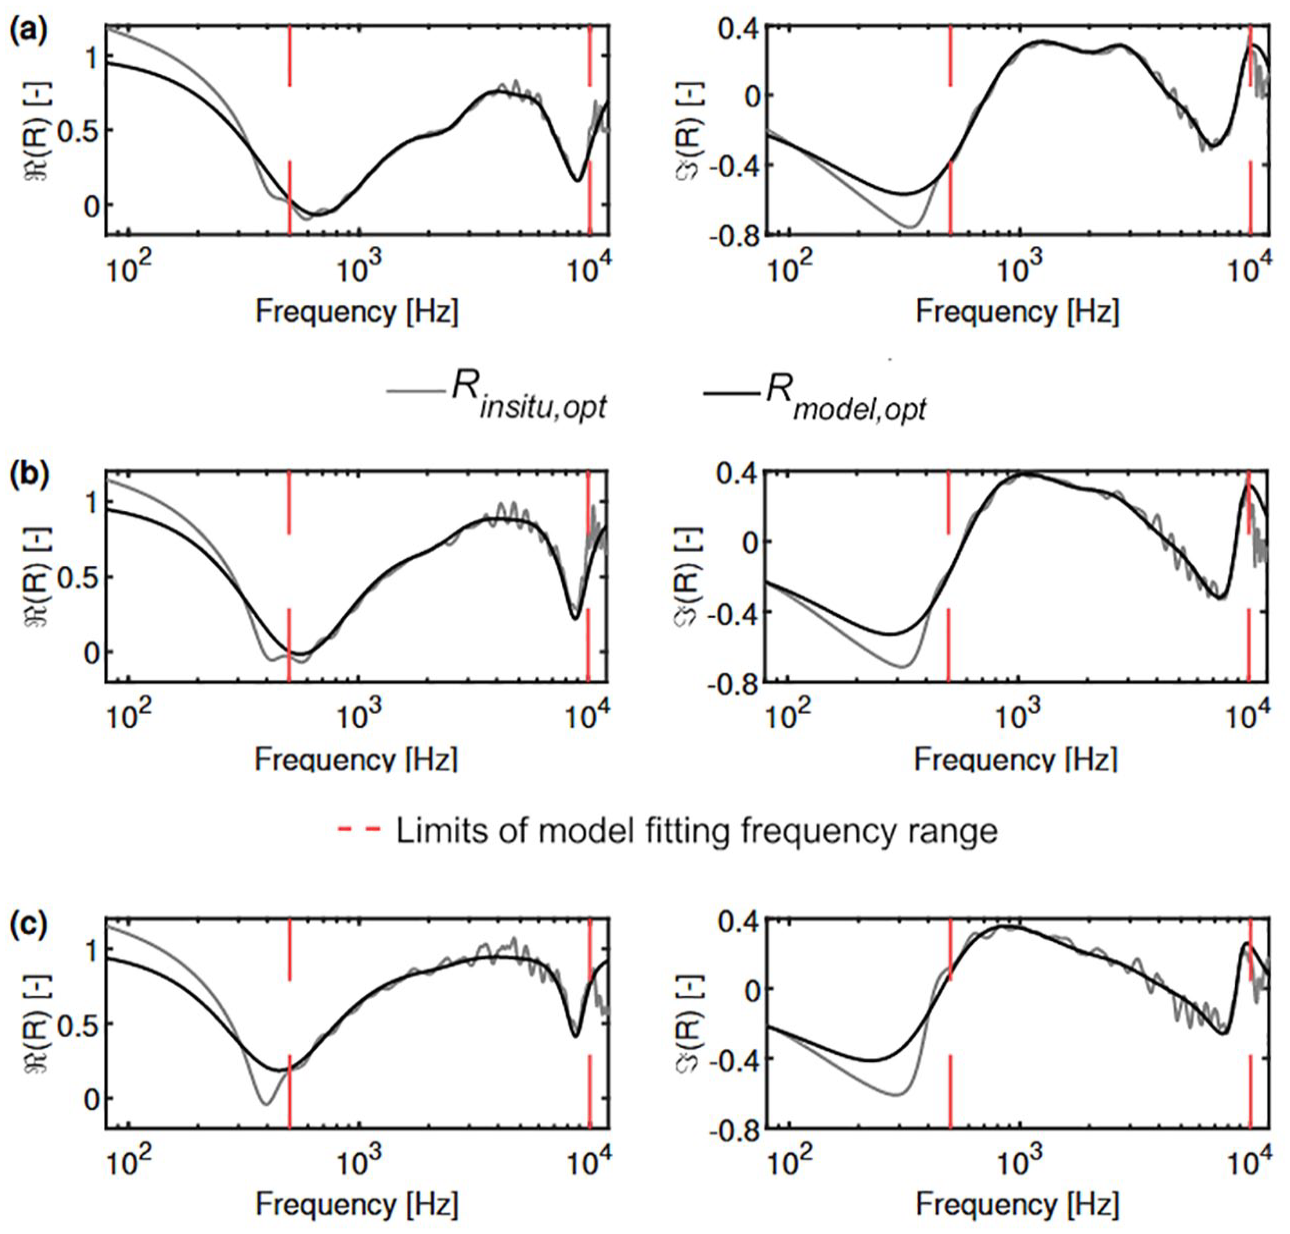
Measured and model fitted complex reflection coefficient of (a) Perf. I, (b) Perf. II, and (c) Perf. III backed with Material B, using the equivalent JCA model for the facing. Gray line:
Conclusion
In this paper, the in situ characterization of perforated panels when backed by an air cavity and two porous layers were experimentally investigated using a method combining a PU-based in situ measurement and an impedance model fitting procedure. Two models were investigated for the characterization of the perforated panels: the Helmholtz resonator model and the equivalent JCA model.
The characterizations performed with the Helmholtz resonator model provided a good agreement between the measurement and the fitted model between 500 Hz and 5 kHz, as well as a good estimation of the backing layer properties (air cavity or porous layers). However, the moving mass retrieved showed some deviation from the theoretical prediction. The retrieved acoustic damping (in the form of a generic acoustic resistance of the resonator model) accounting for the combined acoustic losses within the perforation and the cavity was significantly higher for an air cavity backing than for a porous layer backing, suggesting that non-negligible losses is occurring in the cavity. This may be because the air cavity allows the plug of air to move more freely, which increases the friction losses in the perforations. However, a close match between the measured data and the fitted model was observed in all cases.
The equivalent JCA model of the perforation allowed a much closer curve fitting at higher frequencies (up to 10 kHz). It also retrieved with excellent accuracy the thickness of the facing and the properties of the backing layers. The generic resistance term retrieved was non-zero in most cases, showing that besides the losses in the air cavity, not all losses in the facing can be predicted by the equivalent JCA model, because the MDF facings have a non-zero porosity value.
Overall, the equivalent JCA model allowed a better fitting and better retrieval of the parameters of the backing layer, especially in the case of a porous backing layer, and should thus be preferred. However, it should be noted that the geometry of the perforations (except for the tube length,
One potential drawback of the proposed method is that only the data in a certain frequency range is analyzed. This suggests that for systems where the defining absorption characteristic lies at beyond this range, the proposed methods will be less precise. For example, the characterization of a resonant absorber whose resonance lies below 500 Hz will most likely be inaccurate following the proposed method, as this is a frequency too low to be measured precisely enough with the proposed setup.
Regarding future works, it was noted that several manufactured perforated panel samples (not presented in this paper) had a thin fleece layer glued at their back. This additional thin layer was not modeled in this research. Future work could be done to describe the influence of the fleece on the overall performance of the perforated facing and to derive an effective impedance model for it. Also the rigid facing study addressed only the case of circular macro-perforations (i.e., radii of several millimeters). Investigation of the slotted, grooved and micro-perforated facings constitutes a potential future work of interest. Finally, studying the influence of the panel size on the results, and the influence of the room in which the measurement is carried are other future works of interest.
Footnotes
Appendix
Declaration of conflicting interests
The author(s) declared no potential conflicts of interest with respect to the research, authorship, and/or publication of this article.
Funding
The author(s) disclosed receipt of the following financial support for the research, authorship, and/or publication of this article: This project has received funding from the European Union’s Horizon 2020 research and innovation program under the Marie Sklodowska-Curie grant agreement number 721536.