
Abstract
In this paper, the acoustical quality in apartment housing is studied. The purpose is to find out to what extent occupants are annoyed by indoor noise and to compare the annoyance with measured airborne and impact sound insulation. The occupants in 38 building cases in Sweden, grouped into different construction categories, were asked in a questionnaire to rate their annoyance for a variety of potentially disturbing sound sources. In total, 1230 individual responses were used for the statistical analyses. The result shows that on average, the occupants are quite satisfied and reported low annoyance. This is taken as an indication that the present National legislation for sound insulation, airborne sound insulation included, works well. However, annoyance from footstep of walking neighbours is an exception, causing significantly greater annoyance compared to any other source, especially among occupants in lightweight buildings. The commonly used impact sound insulation descriptors are unable to match subjective experience. In combination with the sensitivity of lightweight floors to low-frequency sounds, improper building designs are likely to result in poor noise protection for the occupants. To overcome this issue, a new single number quantity taking frequencies as low as 25 Hz into account is suggested.
Keywords
Introduction
A good acoustic climate at home is essential for the health of its occupants. It is well known that regularly exposure to unwanted noise may lead to fatigue, 1 sleep disturbance 2 and cardiovascular diseases. 3 The home should be a place for rest and recovery and occupants therefore expect their apartments to have good sound insulation, protecting them from unwanted sounds coming from outdoors as well as from adjacent rooms.
Several studies about acoustic comfort in residential buildings have been reported in the literature, often in combination with data about the measured sound insulation. Examples from recent years are the field study in Canada of five multi-unit residential buildings with 50–288 units each, 4 the investigation of acoustic and non-acoustic factors in Korea of four apartment complexes with 400 resident responses in total, 5 the study of neighbour noise annoyance in Germany based upon 1973 completed questionnaires from four geographic areas, 6 the socio-acoustic investigation in Norway involving 600 dwellings, 7 and the acoustic comfort investigation in Sweden with 101 building units. 8 Other related examples are the acoustic comfort evaluation in France with multi-storey lightweight buildings, 9 the Finnish studies of occupants’ satisfaction with the sound insulation focused on wall constructions, 10 and the Swedish investigation about airborne sound insulation between dwellings. 11 Common conclusions in these studies are that occupants in general are rather satisfied by the acoustic comfort in their homes. Exceptions exist though, and impact sound is repeatedly pointed out as being a source of great annoyance. This is especially noted in lightweight buildings, often wood-based constructions, where the low-frequency content tends to dominate the sound spectrum. The issue of low-frequency impact sound related to lightweight constructions was confirmed in the review papers concerning the associations of acoustic field data to subjective response 12 and the acoustics of lightweight timber buildings. 13
To secure an appropriate sound insulation, many authorities state minimum requirements in their building regulations. In Sweden, the airborne sound insulation DnT,w + C50–3150 must not be lower than 52 dB and the impact sound insulation L′nT,w + CI,50–2500 is not allowed to exceed 56 dB. In addition, CI,50–2500 must not take a negative value, which could favour construction with relatively high impact sound levels at high frequencies, for example, concrete floors with ceramic tiles. Compared internationally, these requirements are rather strict, and it is not yet very common to incorporate the low-frequency spectrum adaptation terms into legislation, albeit some countries do recommend they be used. 14 Comparisons can also be made with ISO/TS 19488, 15 where a classification guideline specifying criteria for six classes, A–F, with class A being the highest, is given. Although the meaning of the different classes is described in words, it is not clear to what extent the occupants are annoyed or satisfied in their everyday life.
The acoustic indoor quality as perceived by occupants of multi-family houses has been investigated in Sweden through three successive research projects (AkuLite, Aku20 and AkuTimber) running from 2010 to 2021. Parts of the results, primarily focused on impact sound insulation,16–18 but to some extent also on airborne sound insulation, 11 have so far been presented by the authors. A unique feature with the impact sound related work16–18 is that frequencies as low as 20 Hz were considered in the measurements and in the relation to subjectively rated annoyance. Although many researchers agree that low-frequency impact sound is cumbersome to measure correctly, until now practically no other study has drawn attention to frequencies below 50 Hz, which may seem unexpected given the context.
The scope of this paper is, based upon the data collected in the mentioned research projects (2010–2021): (a) to report how occupants rate the acoustic quality in their home with respect to different types of sound sources, (b) to relate the measured data and the occupants’ rating to the ISO/TS sound classification scheme for airborne and impact sound insulation and (c) to evaluate the present Swedish airborne and impact sound insulation requirements and suggest – adjusted or preserved – limits for the applicable single number quantities, suggestions that may well be relevant to other countries as well.
Method
Building cases
All the building cases studied are apartment houses of two up to eight storeys. Three subcategories with respect to the construction technique have been identified: (1) lightweight – loadbearing structure of wooden joists (or steel joists) together with usually particle and/or gypsum boards, (2) cross laminated timber (CLT) – semi-lightweight structure based upon layers of timber, glued together to form slab elements and (3) concrete – homogenous or hollow core concrete slabs. Most buildings have a parquet floor with a resilient backing to attenuate high-frequency impact sounds, while a few cases have a plastic carpet instead.
In total, 38 building cases are included, of which 17 are lightweight, 11 are CLT, and10 cases are made of concrete. All buildings represent modern building technique, except for two comparatively older buildings with thinner concrete slabs, which were included for the purpose of getting a wider range of sound insulation performance within this construction category. The building cases are found in both large and small cities with a large geographic spread across Sweden.
Questionnaire survey
The questionnaire shown in Figure 1 was sent to all the households no earlier than 6 months after the completion of the building. A pre-paid return envelope was included to replying to the survey. A reminder was sent after approximately 3 weeks, but no further contact was made. Most replies were returned by ordinary postal services, and a few were returned as photograph via mobile text services or e-mail. As the questionnaire does not include any sensitive personal data, as defined by the Swedish Ethical Review Authority, ethical approval was not required.
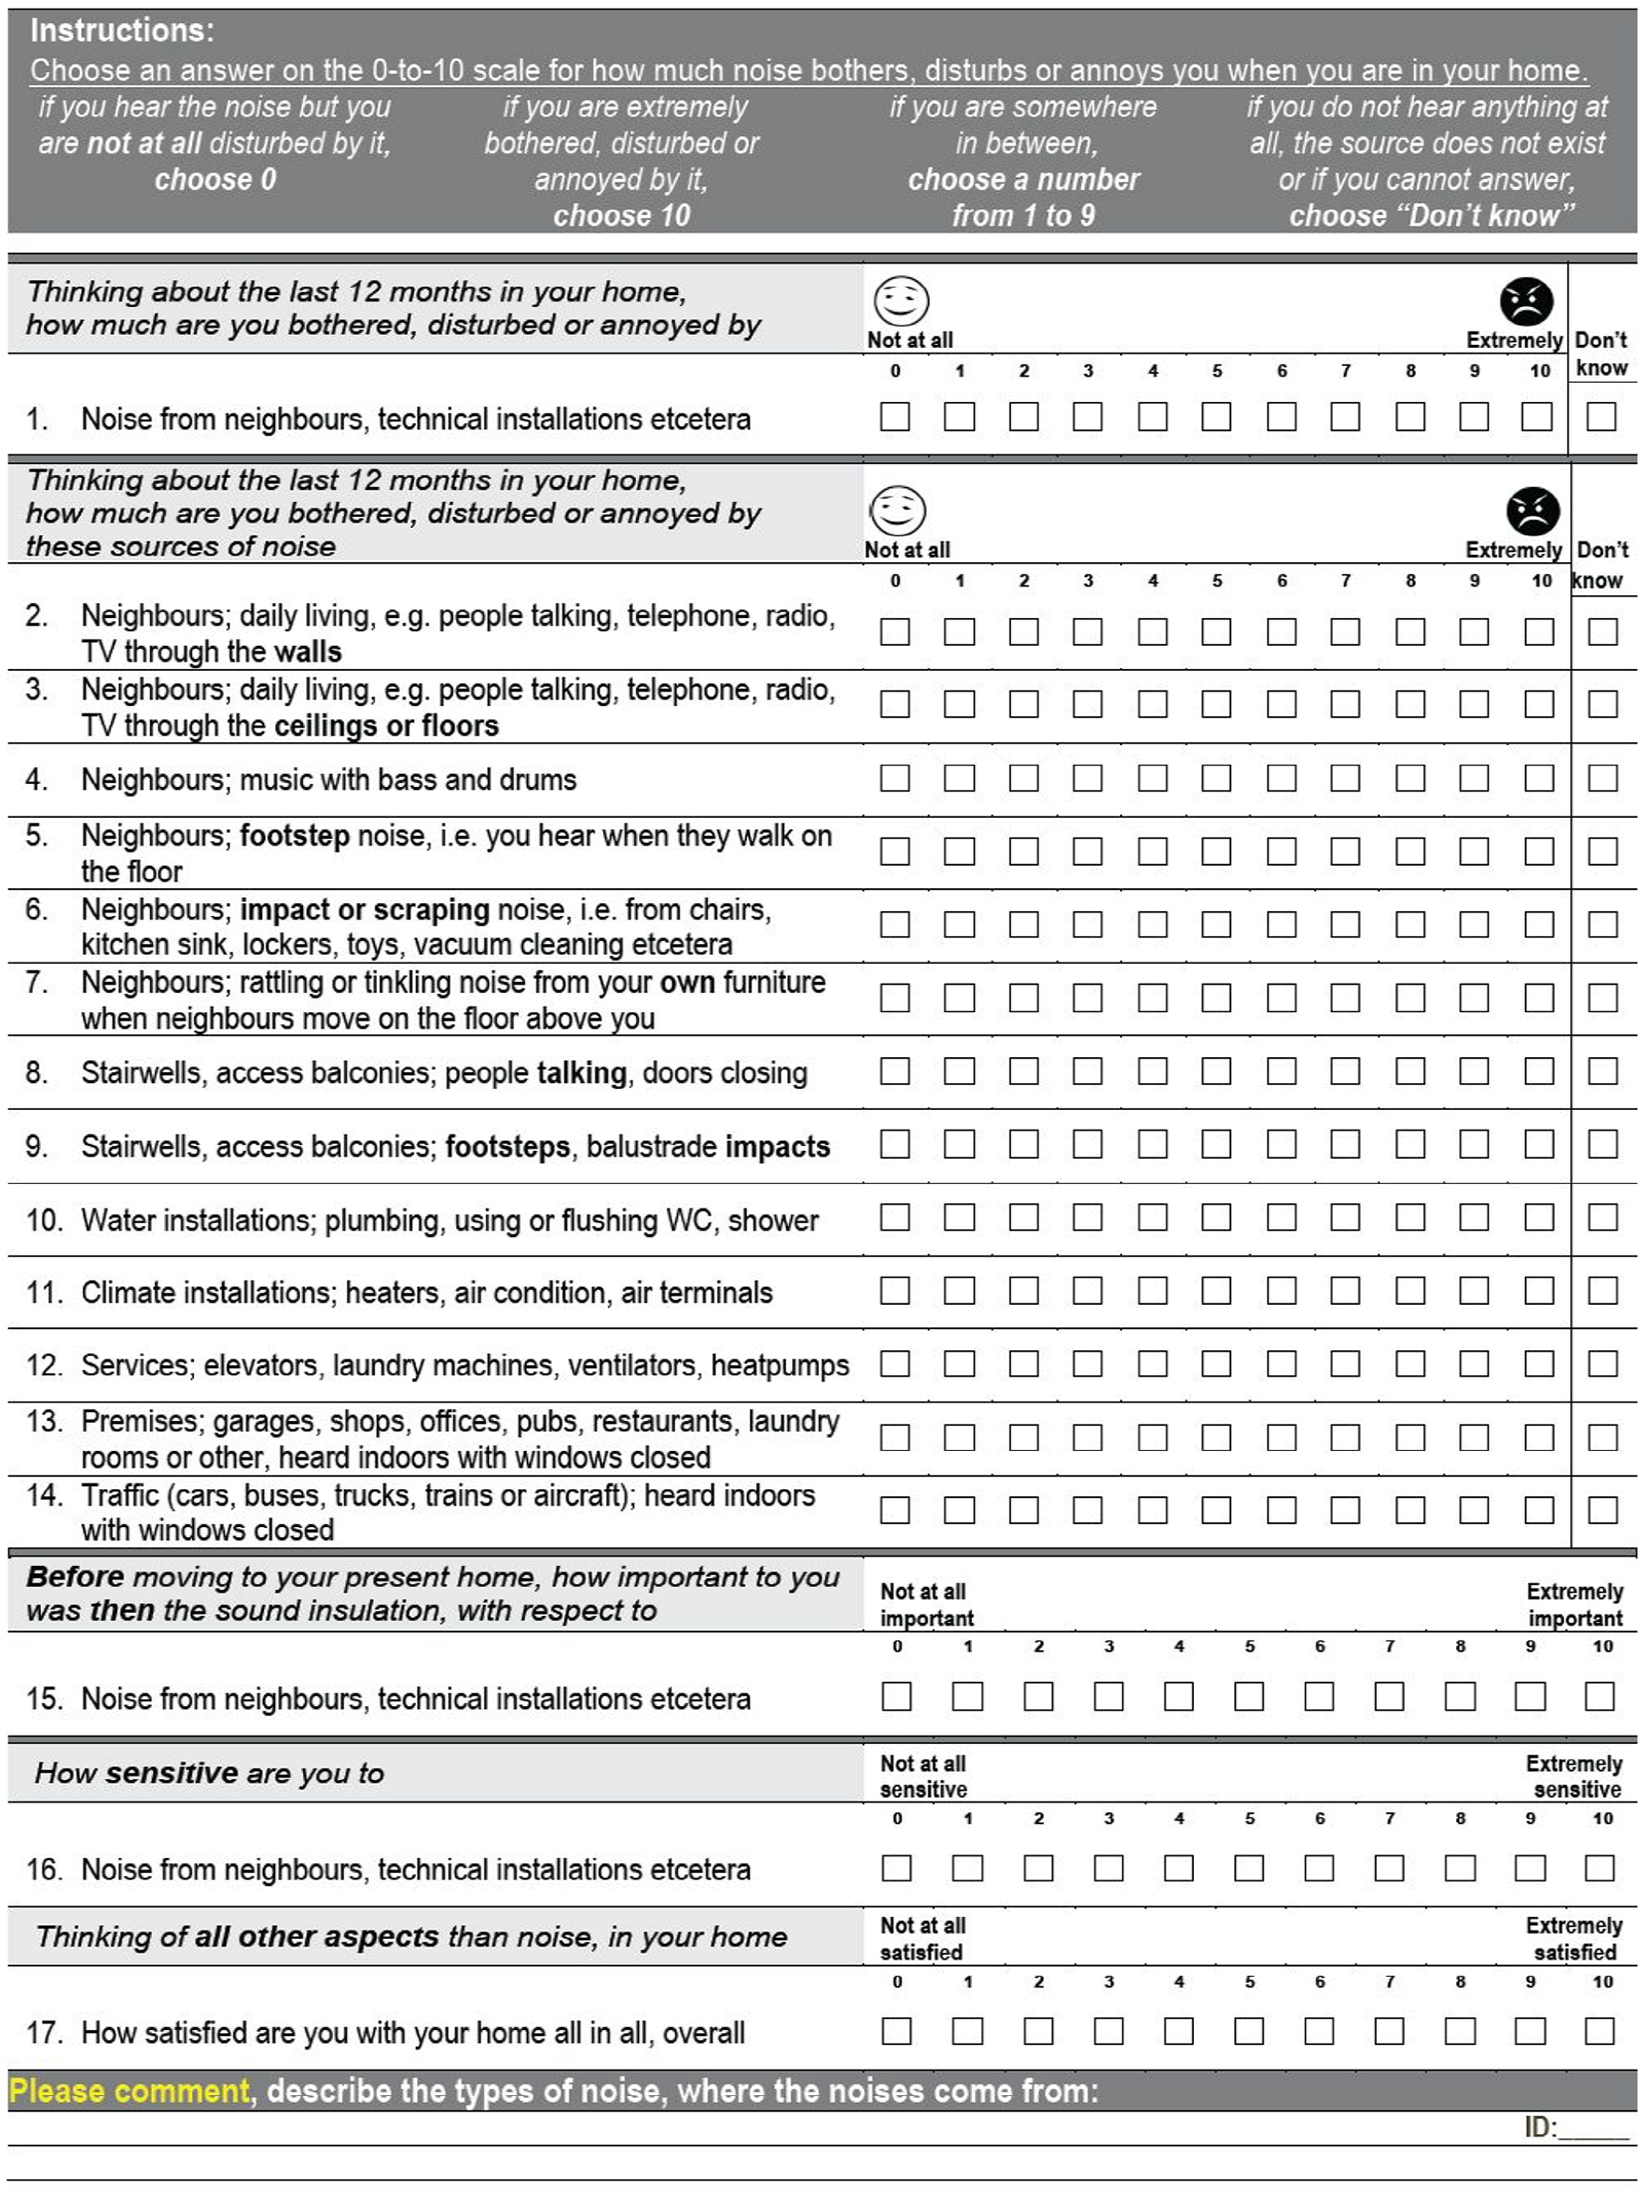
Questionnaire.
The questionnaire is based on the technical specification ISO/TS 15666 19 and was developed within the European COST action TU0901. 20 The questionnaire contains 17 questions in total. The occupants were also asked to supply information about their age, gender and number of people living in their household. There is also space to add complementary free text comments.
Question No. 1 is separated from the others. It is about the overall annoyance due to noise from neighbours, technical installations, etc. Questions No. 2–14 concern annoyance from specific sound sources. No. 2–4 are related to airborne sounds from the neighbours and refer to sounds of daily living, for example, talking, telephone and TV through the walls (No. 2) or through ceilings or floors (No. 3) while No. 4 is about music with bass and drums. Questions No. 5–7 deal with impact sound. No. 5 is specifically about footsteps from neighbours, No. 6 is about impact or scraping noise from chairs, kitchen utilities or toys, and No.7 is about rattling or tinkling noise from the occupants’ own furniture. Questions No. 8–9 cover airborne and impact sounds, respectively, from stairs or access balconies.
Questions No. 10–12 concern technical installations. No. 10 covers water appliances such as WC and shower, No. 11 refers to noise from climate equipment (e.g. heater and air conditioner) and No. 12 asks about noise from services like elevators, laundry machines and ventilators. Question No. 13 is about premises such as garages, shops and restaurants, and No. 14 is about traffic noise that can be heard indoors with windows closed. For these 14 questions, No. 1–14, the instruction is to rate the annoyance on a numerical scale ranging from 0 to 10 where 0 means not at all bothered, disturbed or annoyed and 10 means extremely annoyed, thinking about the last 12 months in the home. There is also the option to answer Don’t know.
Question No. 15 relates to how important the sound insulation was to the occupant, before moving to the present home and the ratings range from not at all to extremely important. In question No. 16, the occupant’s own sensitivity to noise is rated from not at all to extremely sensitive. Finally, in question No. 17, the satisfaction of the home from all other aspects except noise is rated from not at all to extremely satisfied. It is noted that two of the questions were added during the time when the Aku20 and AkuTimber projects were carried out. These two questions are about impact and scraping (No. 6) and overall satisfaction (No. 17); therefore, the responses to these questions are missing from 10 of the building cases in the AkuLite project.
In all analyses, the responses regarding the impact sound related questions (No. 5–7) have been filtered out for occupants living on the uppermost floor. As they do not have any neighbours living above, they are not supposed to be as affected as the other occupants.
In total, questionnaire replies from 1230 occupants are included, of which 461 (37%) are from occupants living in lightweight buildings, 354 (29%) from CLT and 415 (34%) from occupants living in concrete buildings. The response rate among the cases varied between 25% and 83% with an average of 54%.
For the statistical evaluations, two different parameters representing the ratings are used; (1) the arithmetic mean from the numerical 11-point interval scale ranging from 0 to 10, or (2) an ordinal scale with five alternatives: not at all, slightly, moderately, very and extremely annoyed. For the second case, the numerical scale was translated into the ordinal scale in line with previous research.21,22 The rating 0 on the numerical scale corresponds to not at all, ratings 1–3 correspond to slightly, 4–6 to moderately, 7–9 to very and 10 to extremely. The options not at all and extremely have a direct translation to their numerical counterparts as they are defined in the questionnaire, whereas the three ordinals in between have been chosen by experience, being aware of the possible non-absolute equivalence by statistical means. The purpose is mainly to compare different ways of establishing overall ratings, not to assess their absolute values.
Field measurements
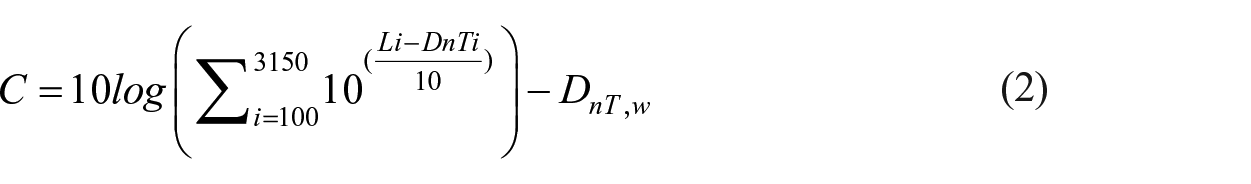
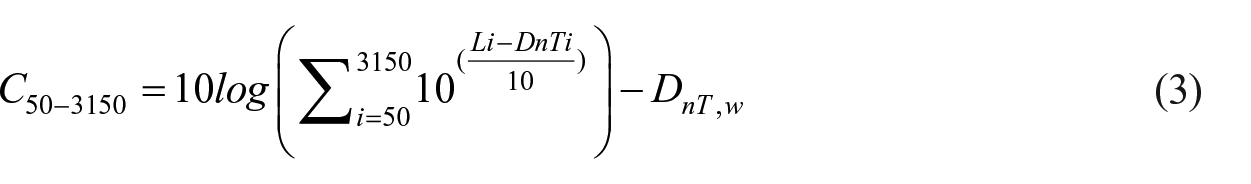
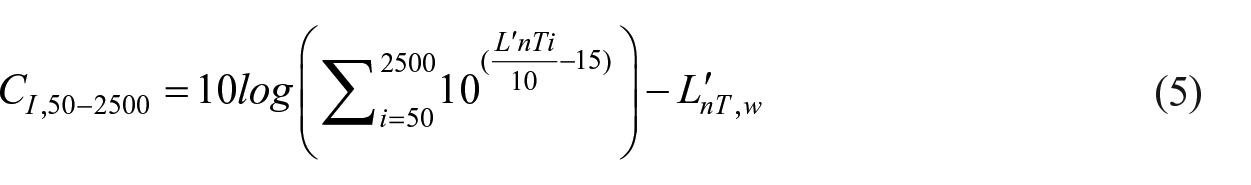
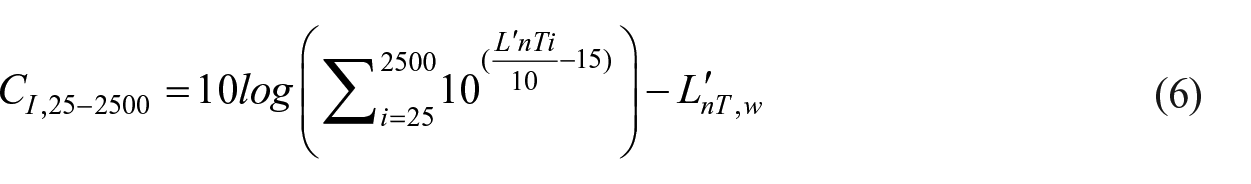
Vertical sound insulation in terms of weighted standardised level difference, DnT,w, and weighted standardised impact sound pressure level, L′nT,w,, are available for the building cases as well as relevant spectrum adaptation terms. All measurements have been performed in accordance with the ISO standard 16283 part 1 and 223,24 (or earlier editions of the ISO 140 series of standards), generally using five fixed microphone positions in each room, two loudspeaker positions and four tapping machine positions. The results have been evaluated according to the ISO standard 717 part 1 and 225,26 (or earlier editions). The spectrum adaptation terms used in conjunction with the weighted single number quantities are C (defined from 100 Hz) and C50–3150 (defined from 50 Hz) for airborne sound and CI,50–2500 and CI,25–2500 for impact sound. The latter term, ranging from 25 Hz (one-third octave band), is not defined by ISO but is a result of research based upon low-frequency impact sounds 18 where it was found that evaluation from 25 Hz gave stronger correlation to the rated annoyance compared to evaluation from 50 or 100 Hz. Definitions of standardised level difference (DnT) and standardised impact sound pressure level (L′nT), as well as the spectrum adaptation terms, all in one-third octave bands, follow from equations (1)–(6).
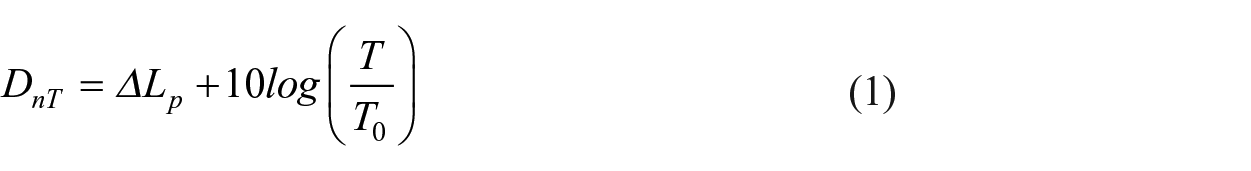
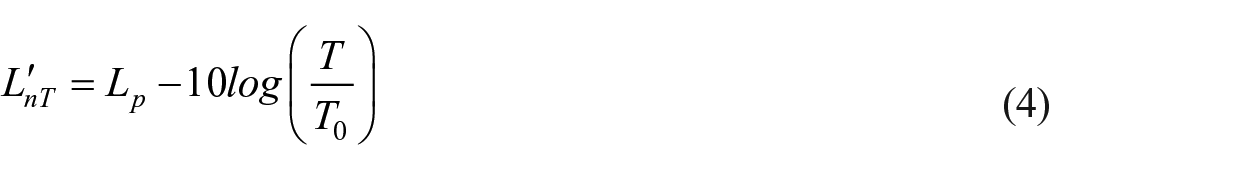
ΔLp is the sound pressure level difference between the source and receiving room, T0 = 0.5 s, L is the sound level according to ISO 717-1 25 and Lp is the impact sound pressure level.
The spectrum adaptation term CI,25–2500 is basically defined in the same way as CI,50–2500 but the following remarks should be noted. The frequency range is extended and starts from 25 Hz. The impact sound pressure levels are not normalised to the reverberation time of 0.5 s for the three lowermost one-third octave bands, 25, 31 and 40 Hz, 18 meaning that L′nT = Lp at these frequencies. Potential difficulties in measuring reverberation times below 50 Hz accurately are then avoided. In addition, studies have indicated that normal furniture does not contribute to the room absorption at such low frequencies, that is, the reverberation time is unaffected by any furniture. 27 Regarding the sound pressure level, previous studies28–31 have shown that performing measurements at 25–40 Hz is not as big problem as might be expected since the uncertainty is generally not larger than for 50–80 Hz third-octave bands.
By default, the sound insulation was measured in six rooms for each case with an equal mixture of bedrooms and living rooms, although a few exceptions exist in the database. If nothing else is stated, the mean value from the measurements represents the respective building case in the statistical evaluations. For simplicity, the abbreviated notations DnT,A, DnT,50, L′nT,50 and L′nT,25 are used to denote the standardised notations DnT,w + C, DnT,w + C50–3150, L′nT,w + CI,50–2500 and L′nT,w + CI,25–2500 respectively.
Sound insulation related to annoyance rating
The survey is assumed to reflect the overall perspective of the occupants’ satisfaction/annoyance with the acoustical comfort in modern apartments. But since the sound insulation varies considerably between the building cases, variation in the acoustical satisfaction as well as the rated acoustical annoyance is expected as a consequence. The relation between sound insulation and rated annoyance according to the ordinal scale is studied by logistic regression analysis. This is the probability that a given single number quantity of sound insulation will lead to annoyance within one or more of the ordinal categories. Mathematically, this is described by equation (7):
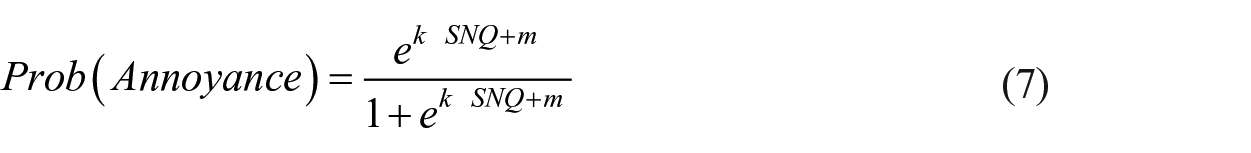
where k and m have their counterparts in the coefficients of the linear regression Y(x) = kx + m and SNQ refers to the dB-value of the single number quantity. Logistic regression analysis is applied to airborne and impact sound insulation separately. Multiple single number quantities and their respective probability to result in annoyance are studied for each specific survey question.
ISO sound insulation classification scheme
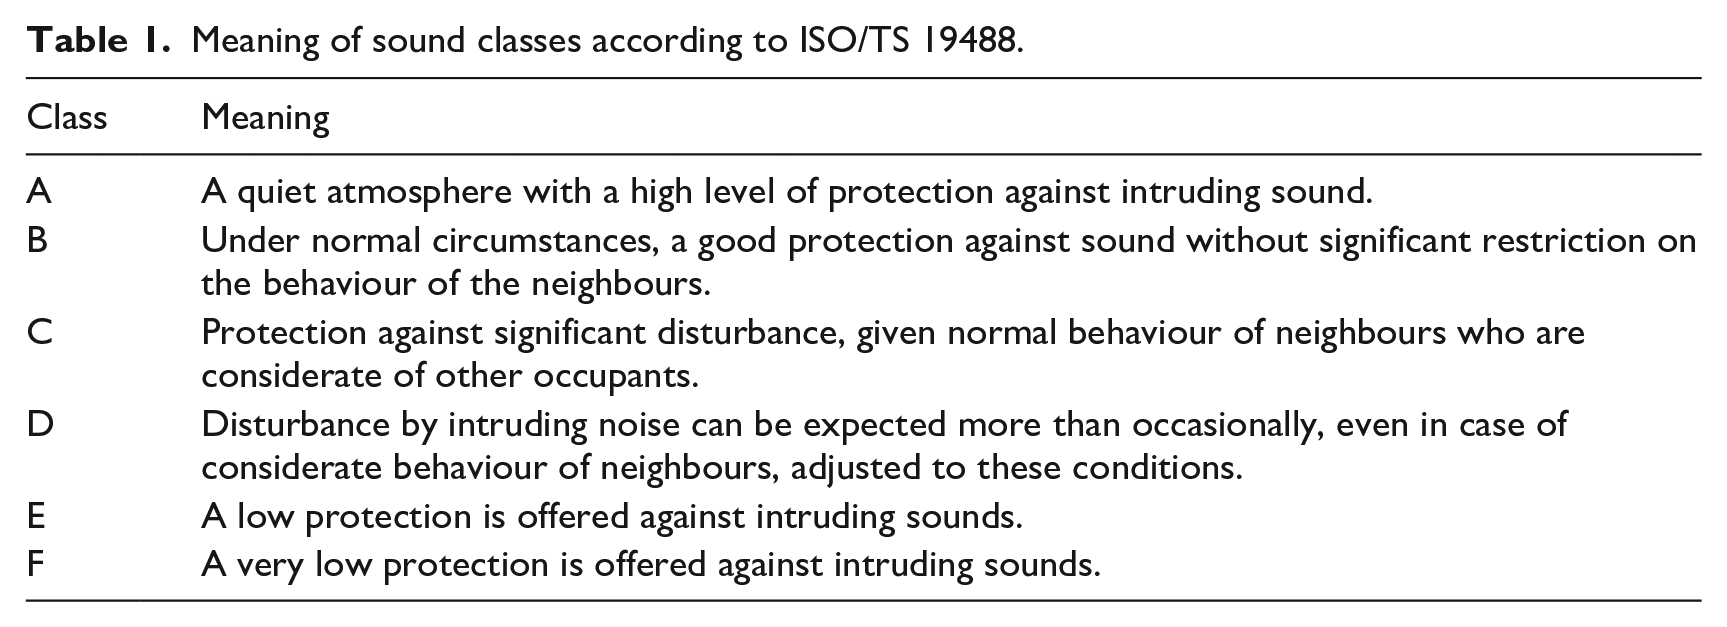
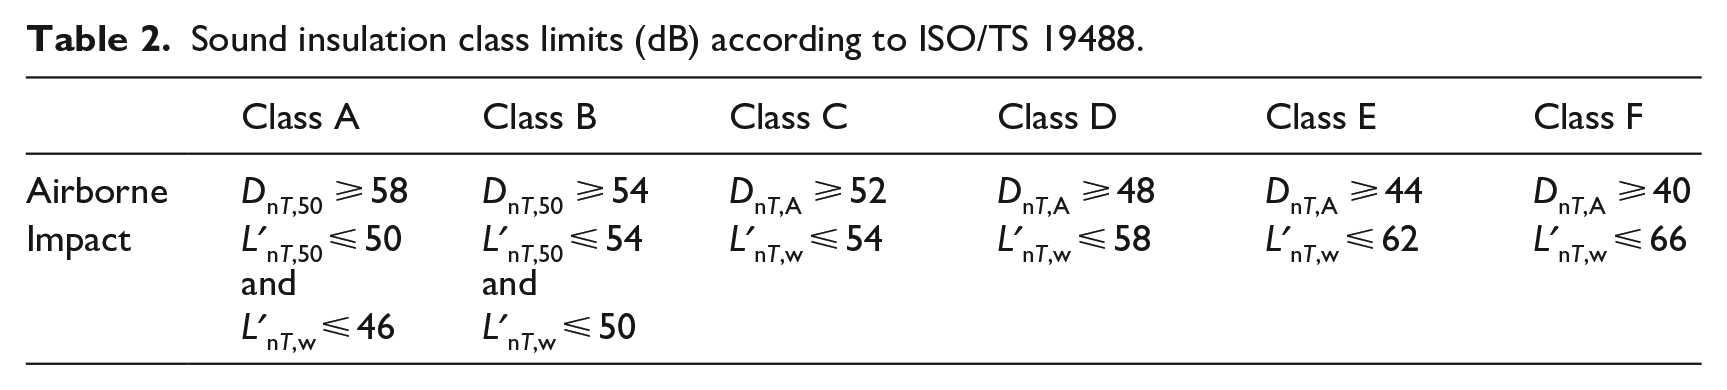
The present ISO/TS 19488 15 was launched in 2021 and deals with acoustic classification in dwellings. Airborne and impact sound insulation are defined for six acoustic sound classes, A–F, where the meaning of each class is cited in Table 1. The numerical limits for airborne sound transmission and impact sound pressure level between dwellings are given in Table 2.
Meaning of sound classes according to ISO/TS 19488.
Sound insulation class limits (dB) according to ISO/TS 19488.
Results and analysis
Questionnaire survey – overall
A close to equal representation of males (47%) and females (53%) was achieved among the questionnaire respondents. Small households are in the great majority since there is only one person living in 40% of the households, while 45% of the households consist of two people, 9% have three people and 6% have four or more people. These figures are in close agreement to the national level in Sweden. 32 The distribution of gender and household size only show small variations of a few percentiles, between the construction subcategories of lightweight, CLT and concrete. The response alternatives in the questionnaire were divided in four fixed age intervals: 18–25, 26–39, 40–64 and ⩾65 years. The distribution of age can be seen in Figure 2, as the total of all cases as well as within each building technique. All age categories are well represented but the distribution among the occupants in CLT buildings differs from the two other construction categories. The proportion of elderly occupants, ⩾65 years, living in the CLT buildings is 67% larger than for the lightweight or concrete buildings (30 vs 18 percentage points). At the same time, the size of the youngest group, 18–25 years, is just about half as large within the CLT buildings by comparison to the other constructions.
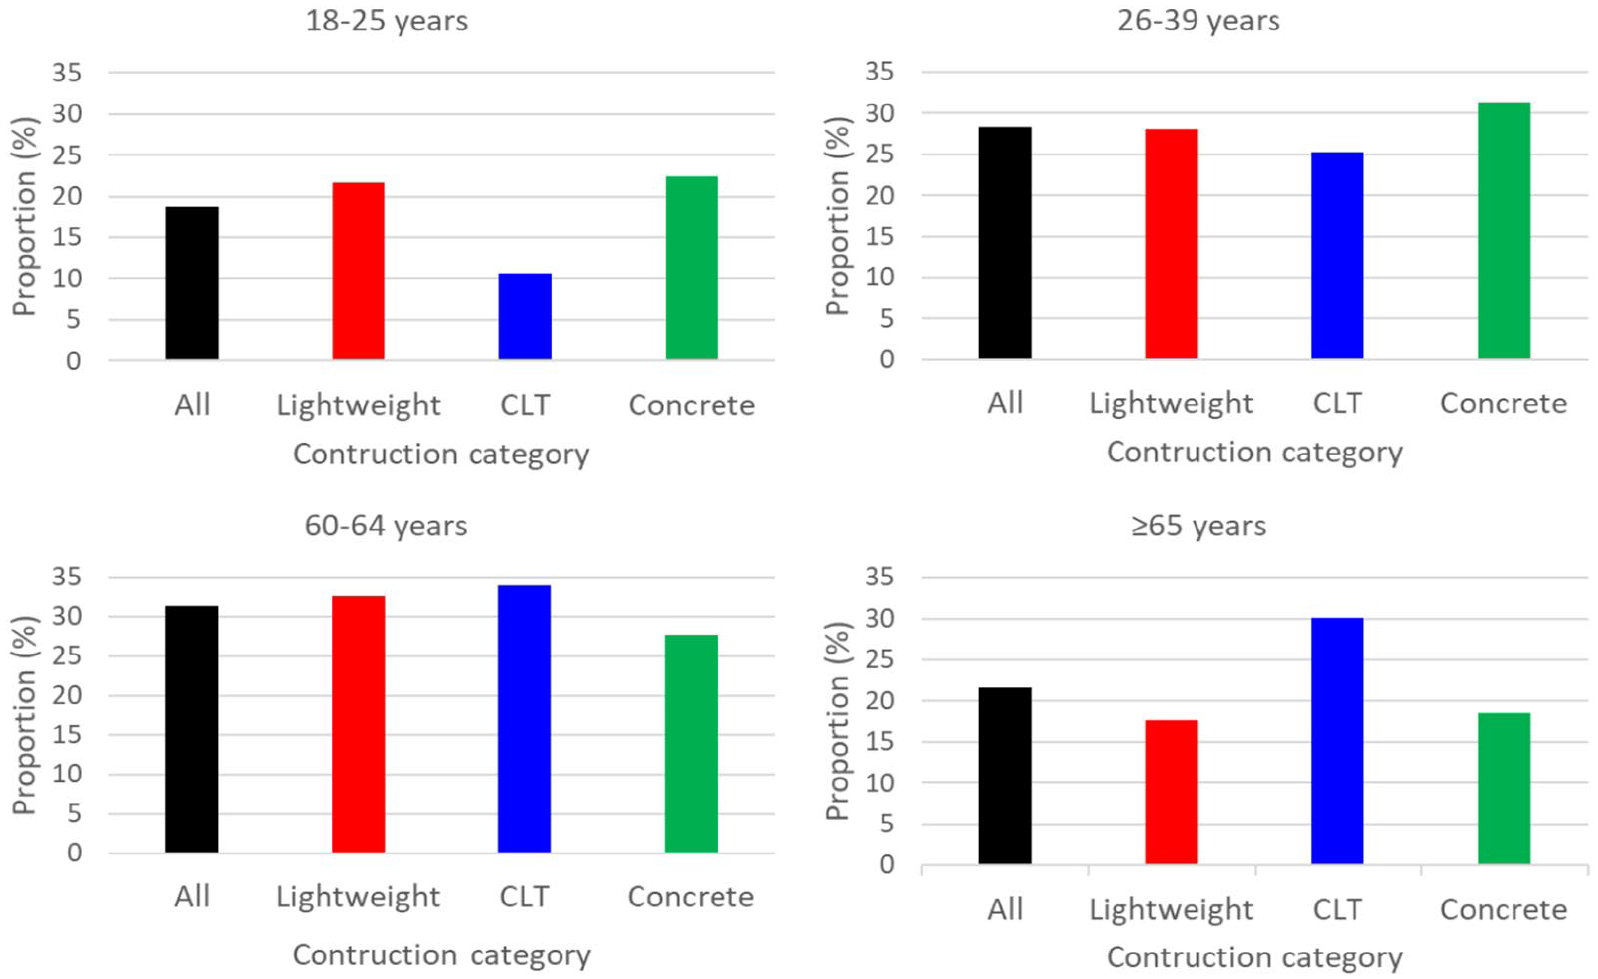
Distribution of age among the occupants for different construction categories.
The mean annoyance from the individual sound sources, questions No. 2–14, are presented in Figure 3. The total score, including all buildings as well as the three subcategories, are shown. On average, taking all the sound sources into account, the occupants seem to be fairly satisfied with the acoustical indoor climate. The mean annoyance rating is typically around 1.0–1.5 on the numerical scale ranging from 1 to 10. However, the question regarding footstep noise, No. 5, stands out with an annoyance rating being roughly twice as high for two of the construction categories. The mean annoyance rating of footstep noise from occupants is 3.8 in the lightweight buildings, 3.2, in the CLT buildings and 2.0 in the concrete buildings. Thus, even though impact noise is often a severe source of annoyance, this is not the case in the concrete buildings, for which the annoyance is comparable to the other sound sources.
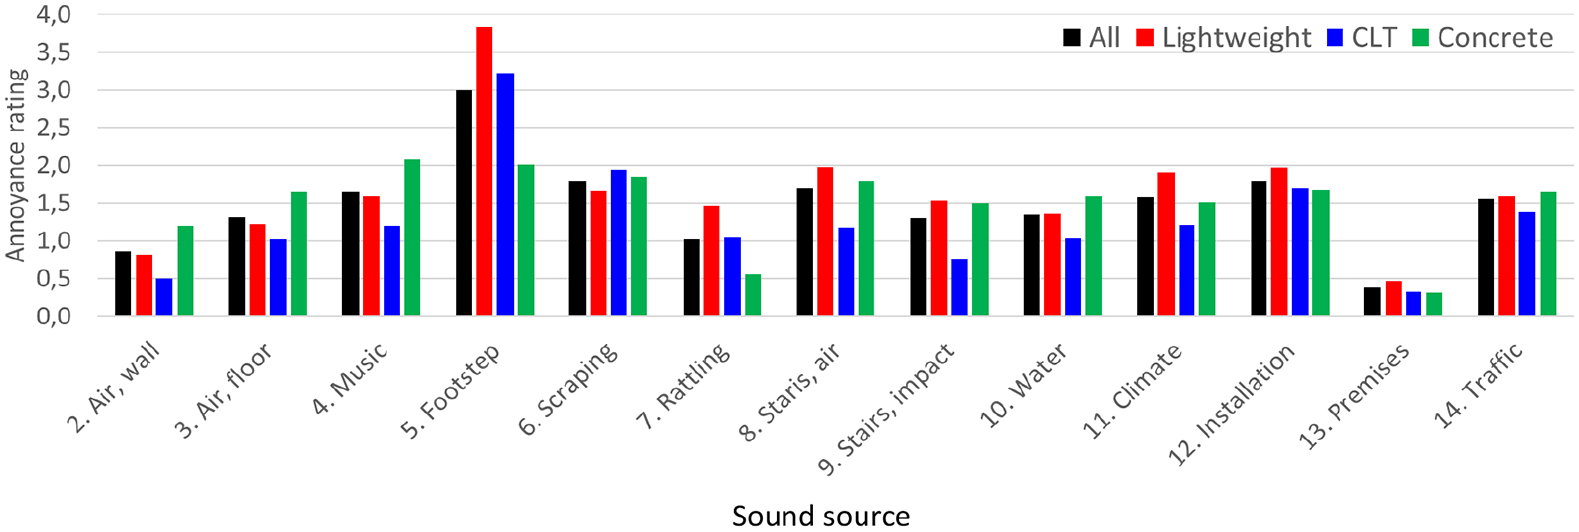
Mean annoyance rating for different building construction types from a variety of sound sources. The numerical annoyance scale ranges from 0 to 10.
The results in terms of mean value for the remaining questions, which are of a more general character, can be seen in Figure 4. It is evident that the occupants consider sound insulation to be an important matter since their average rating is about 7 out of 10. The sensitivity can be interpreted as being moderate, with an average rating of 4. The mean satisfaction rating is close to 8, which indicates the occupants are, on average, genuinely satisfied with their home, with respect to other matters than noise. Focusing upon the overall noise disturbance, the mean annoyance rating is 2.6. Note that only minor differences between the types of construction can be seen for these questions.

Mean rating for general acoustic annoyance (question No. 1), importance of sound insulation (No. 15), sensitivity to noise (No. 16) and satisfaction with all other living aspects than noise (No. 17).
Questionnaire survey – airborne and impact sound related questions
Airborne and impact sound insulations, as well as related survey questions, have been in focus within the three Aku-projects. As a complement, the responses from these questions are presented below in the alternative way of using the constructed ordinal scale described above. Three questions can be directly linked to airborne sound insulation. These include No. 2: daily-living sound from the neighbours through the walls, No. 3: daily-living sound from the neighbours through the floors or ceilings and No. 4: music with bass and drums. As can be seen in Figure 5, music is somewhat more annoying than the other daily-living sounds from neighbours. Taking all cases into account, 17% of the occupants are moderately, very or extremely annoyed by music, while 13% and 8% are the corresponding annoyance ratings for other daily-living sounds through floors and walls respectively. The occupants of the concrete buildings are generally slightly more annoyed by airborne sounds than occupants living in lightweight or CLT buildings.
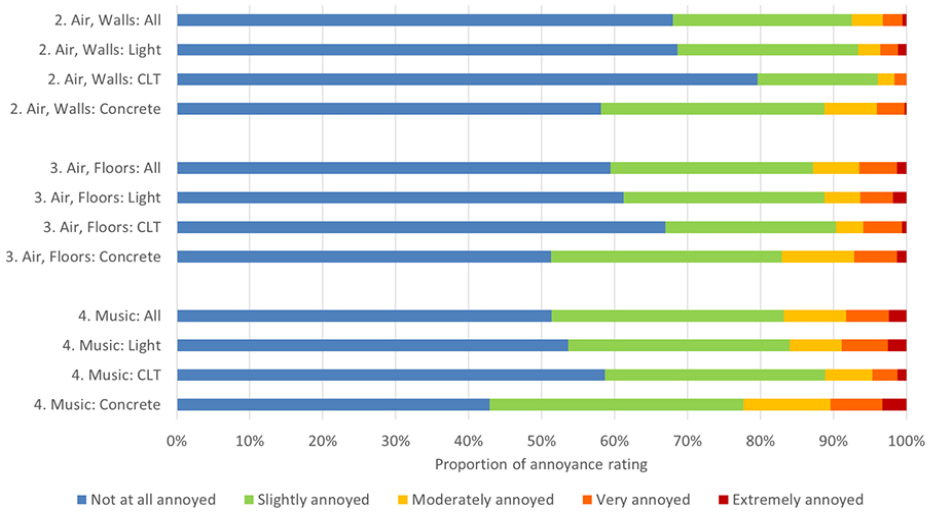
Proportion of annoyance rating from airborne sound sources; 2) daily-living sounds from neighbours through walls, 3) through floors and 4) music.
Impact sound insulation is directly associated with another three questions. They are No. 5: footstep noise, No. 6: impact or scraping noise and No. 7: rattling or tinkling noise from the occupants’ own furniture. According to Figure 6, rattling noise results in comparably low annoyance, but with greater annoyance in the lightweight buildings. Scraping noise is a source of a higher degree of annoyance than the rattling sounds but hardly any difference between the building categories can be seen for this issue. The highest annoyance is in the response to the question concerning footstep noise, where the difference between the lightweight and concrete categories is considerable. Results show that 2% of the occupants in the concrete buildings, but 12% in the lightweight buildings, are extremely annoyed. In the latter category, 29% are very or extremely annoyed while as many as 77% are annoyed by footstep to some extent, that is, being at least slightly annoyed.
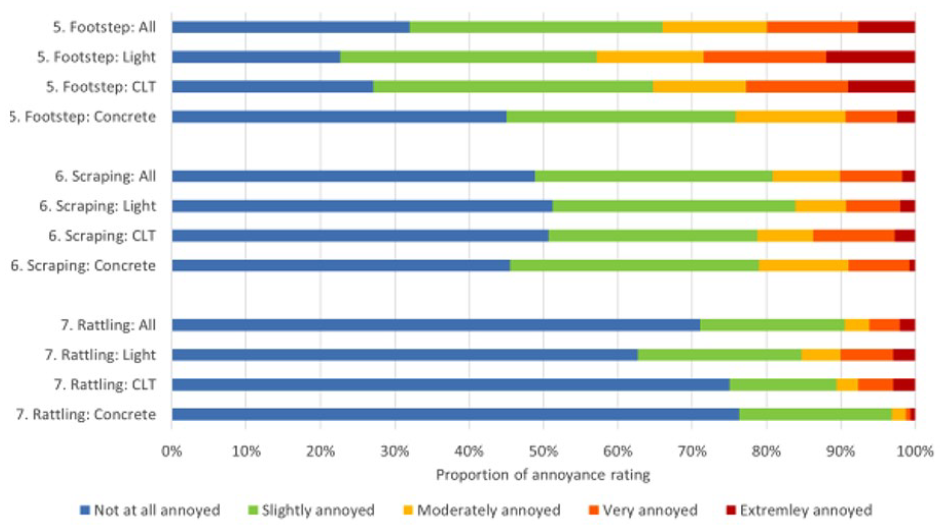
Proportion of annoyance rating from impact sound sources; 5) footsteps, 6) scraping and 7) rattling.
Field measurements
The range of single number quantities among the 38 building cases is 52–69 dB for DnT,w, 48–66 dB for DnT,A and 47–65 dB for DnT,50 concerning the airborne sound insulation. Regarding the impact sound insulation, the range is 38–62 dB for L′nT,w, 46–66 dB for L′nT,50 and 47–68 dB for L′nT,25. The histograms of the sound insulation are presented in Figure 7 Comparing D and DnT,wnT,A, a trend towards numerically lower airborne sound insulation is seen in the presence of the spectrum adaptation term C, that is, DnT,A, and successive lower values are seen for the frequency range from 50 Hz, that is, DnT,50. In a similar way, even more pronounced, the impact sound pressure level increases as the lowest frequency is shifted from 100 Hz (L′nT,w) to 50 Hz (L′nT,50). Applying the extended frequency range from 25 Hz (L′nT,25) can, according to the definition, only increase the weighted impact sound pressure level since more one-third octave band levels are added to the single number quantity, that is, the total amount of acoustic energy increases. However, the concrete buildings are almost unaffected by the frequency extension from 50 to 25 Hz whereas the CLT and lightweight buildings show a significant increase of single number, which is illustrated by comparing the histograms in Figure 7(d) and (e)).

Histograms of the mean sound insulation of the building cases with respect to category: concrete,  CLT and
  lightweight. Airborne to the left: (a) DnT,w, (b) DnT,A and (c) DnT,50. Impact to the right: (d) L′nT,w, (e) L′nT,50 and (f) L′nT,25.
Airborne sound insulation related to annoyance rating
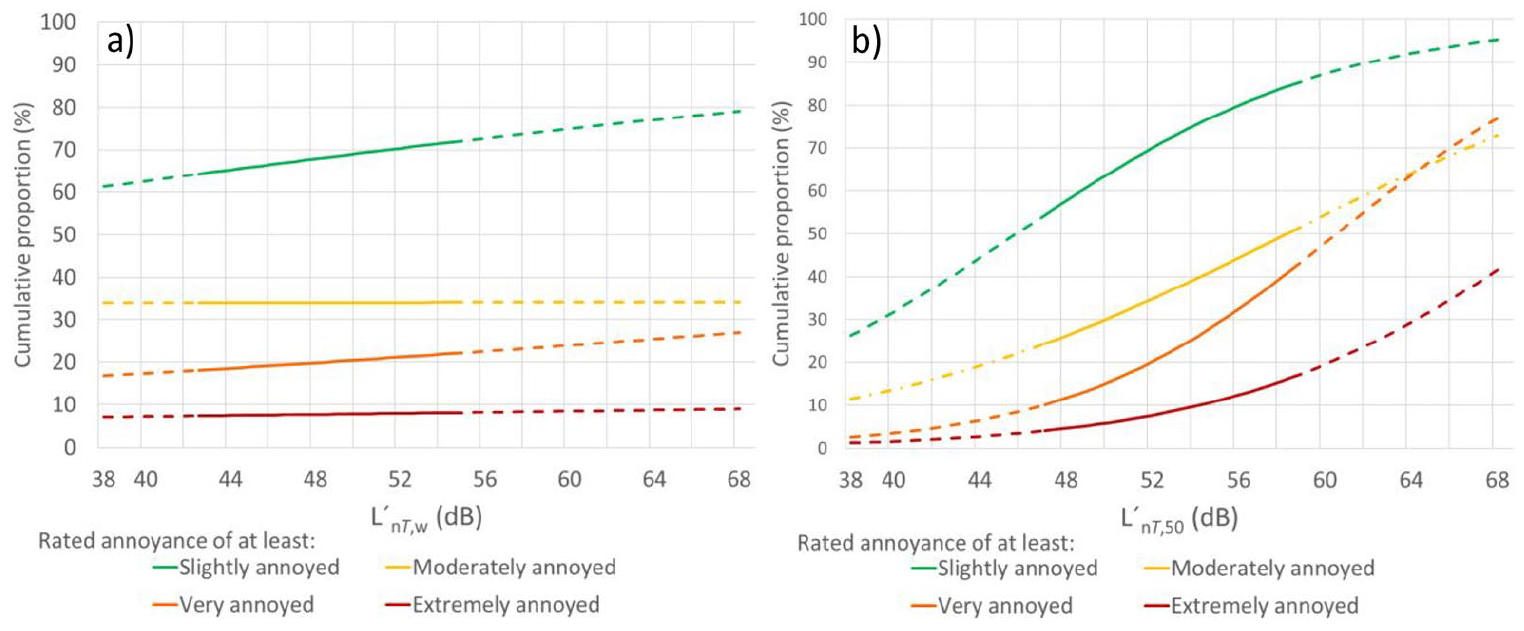
The annoyance ratings from question No. 3: daily-living sound through the floors or ceilings, and No. 4: music with bass and drums, are presented in Figures 8 and 9 as a function of the single number quantities DnT,w, DnT,A and DnT,50. In the following comparisons, the daily-living sound in the vertical direction (question No. 3), for which a higher annoyance level was reported than for the horizontal direction (question No. 2), is in focus. Music on the other hand represented by a single question (No. 4), relates to both vertical and horizontal direction. Each curve in this kind of diagram represents the cumulative proportion. This means, as an example, that being at least slightly annoyed refers to slightly or moderately or very or extremely annoyed. Due to too few answers in the category extremely annoyed, no statistical relation could be established to the single number quantities in any of the cases, which is indicated by the close to horizontal proportion lines. The numerically difference between the measured sound insulation, DnT,w, DnT,A and DnT,50, is not very large. On average, DnT,50 is 0.9 dB lower than DnT,A, which in turn is 1.9 dB lower than DnT,w. Note that DnT,50 by definition always takes a lower value than DnT,A (or equal, due to rounding) and that positive values of C rarely occur. This means that DnT,50 results in somewhat greater annoyance expectancy compared to DnT,A, which in turn results in marginally greater annoyance expectancy than DnT,w, given the same numerical value.
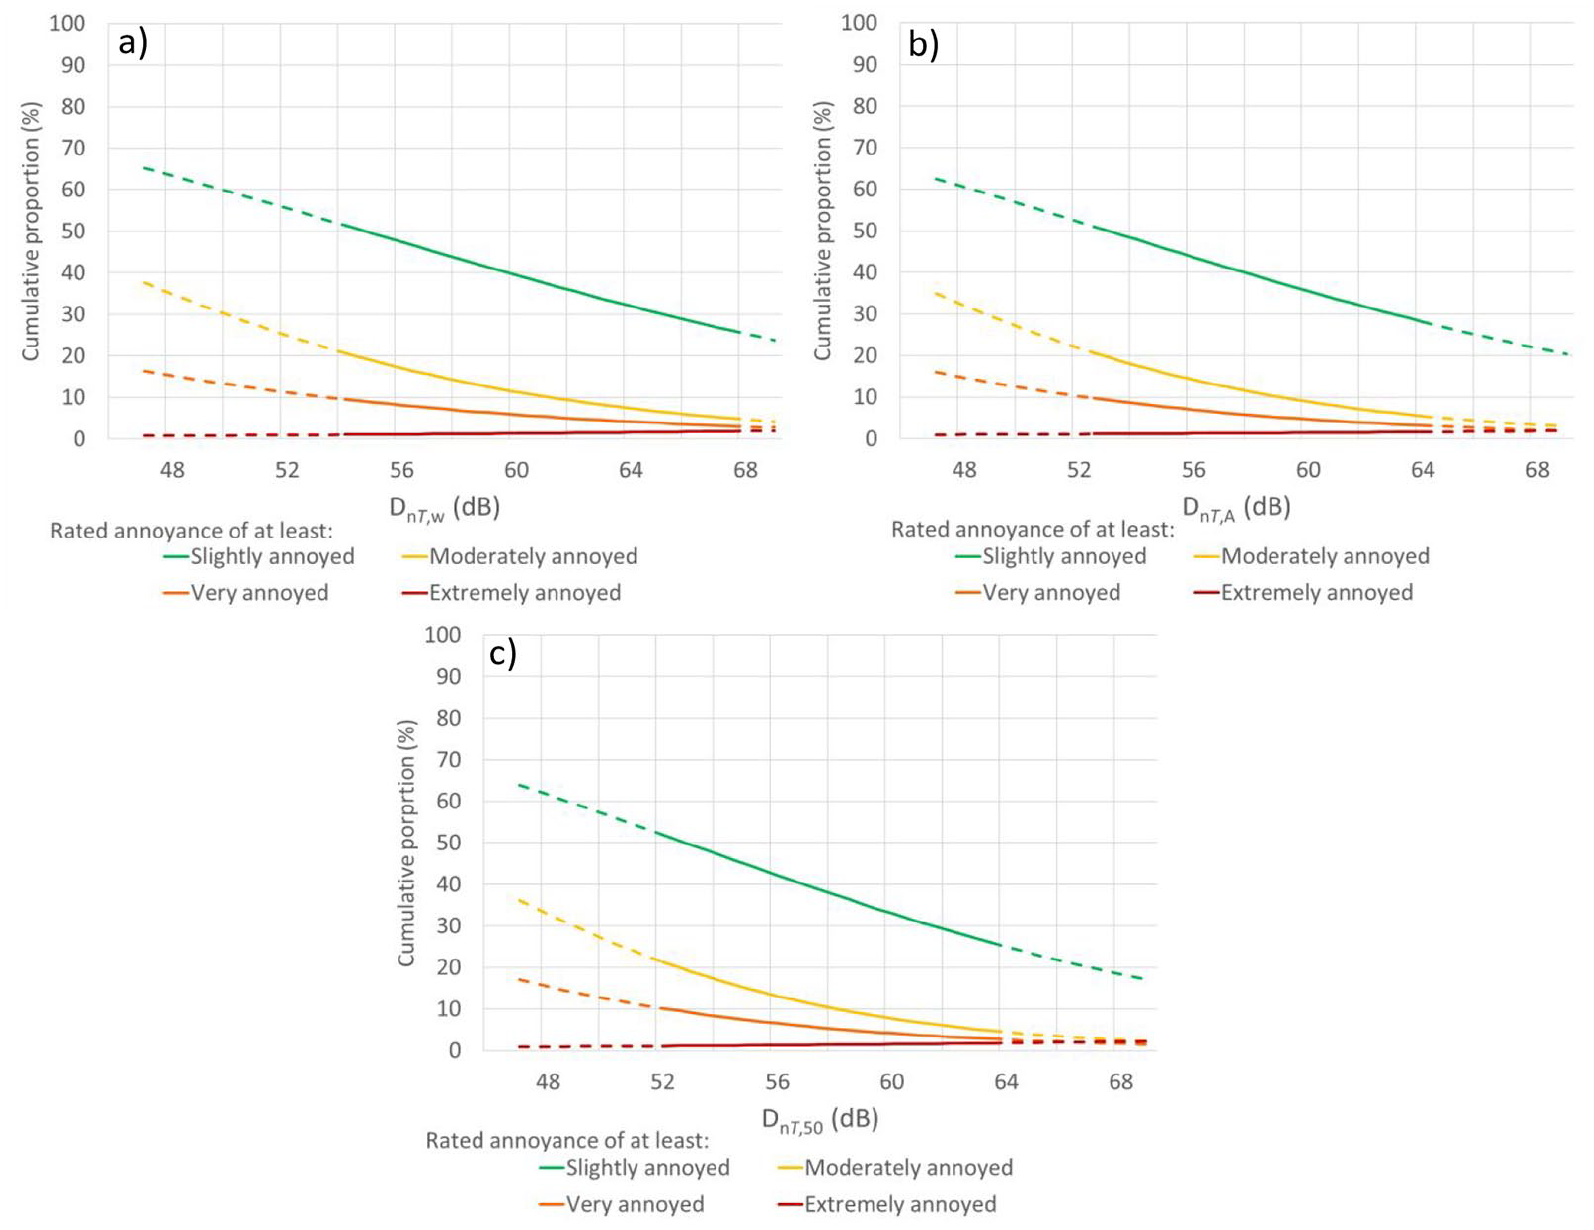
Cumulative proportion of rated annoyance due to daily-living sounds through floors and ceiling as a function of (a) DnT,w, (b) DnT,A and (c) DnT,50. Solid lines represent 95% of the available data.
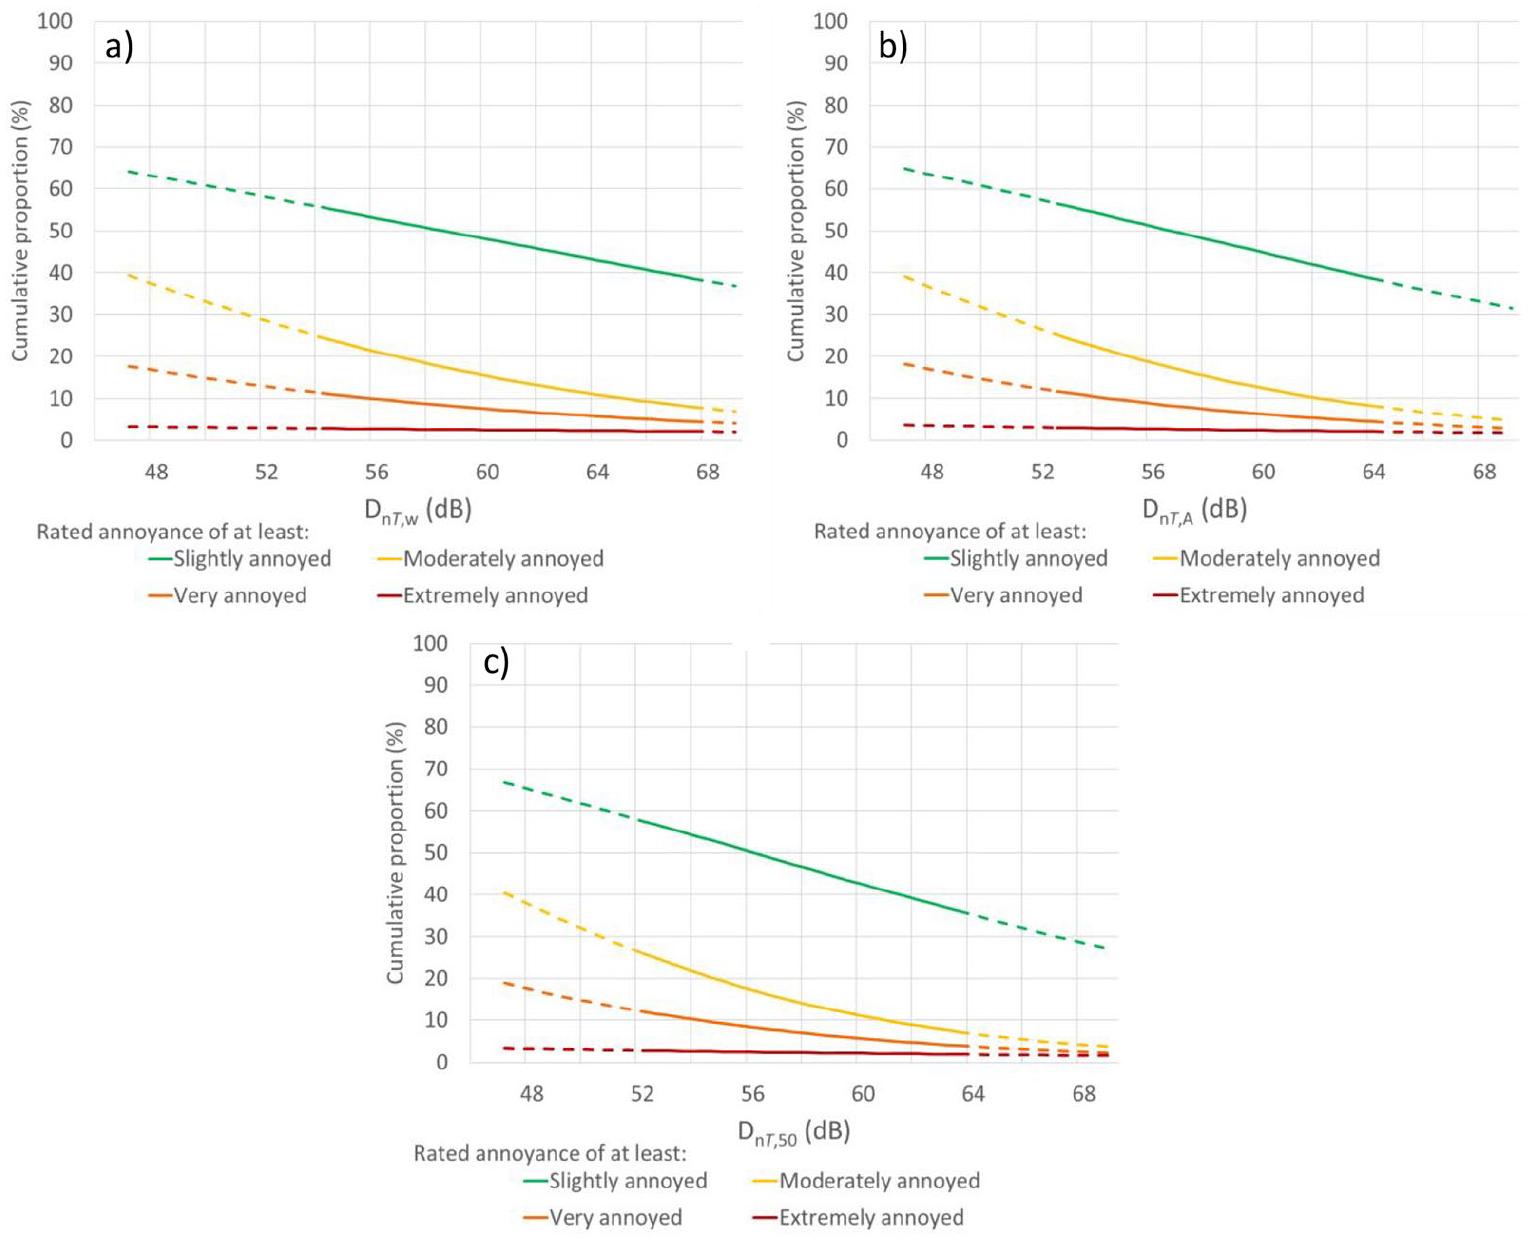
Cumulative proportion of rated annoyance due to music with bass and drums as a function of (a) DnT,w, (b) DnT,A and (c) DnT,50. Solid lines represent 95% of the available data.
In general, music is reported as being somewhat more annoying than daily-living sounds. For DnT,50 = 52 dB, the airborne sound insulation minimum requirement according to the Swedish legislation, suggests that 21% are expected to be at least moderately annoyed with respect to daily-living sounds whereas 26% are at least moderately annoyed with respect to music. The corresponding annoyances for DnT,A = 52 dB (Class C in ISO/TS 19488) are 22% and 26%, and for DnT,w = 52 dB the expected annoyance is 25% and 28%, for daily-living sounds and music respectively. A common goal for newly built apartments in Sweden is DnT,50 = 56 dB (Swedish sound class B according to SS 25267 33 ). At this sound insulation, 13% will be at least moderately annoyed by daily-living sounds and 17% by music. Thus, applying a 4 dB stricter goal than the minimum requirement reduces the amount of at least moderately annoyed occupants from daily-living sounds by 38% (from 21% to 13%) and the effect on music annoyance is close to similar, with a 35% reduction (from 26% to 17%). If instead the occupants that are annoyed to any extent at all, that is, being at least slightly annoyed, are in focus, the shift from DnT,50 = 52 dB to 56 dB results in a drop from 52% to 42% for daily-living sounds and from 58% to 50% for music.
Impact sound insulation related to annoyance rating
The annoyance from question No. 5: footstep noise, is presented in Figure 10 as a function of the single number quantities L′nT,w and L′nT,50. In the case of L′nT,w, the close to horizontal lines for most of the annoyance categories are a result of a weak correlation to the reported annoyance with a coefficient of determination R2 of just 12%. 18 This tendency is not explained by too few respondents but by the lack of correlation between annoyance and the single number quantity. Rated annoyance shows practically no relation to impact sound insulation evaluated from 100 Hz through the single number L′nT,w. This may seem surprising, but the tendency has been reported previously.7,16
Cumulative proportion of rated annoyance due to footstep noise as a function of (a) L′nT,w and (b) L′nT,50. Solid lines represent 95% of the available data.
A significant difference is seen when the low-frequency spectrum adaptation term is added. L′nT,50 shows a stable statistical correlation with the rated annoyance. It is noticed that the reported annoyance is considerably larger compared to the airborne sound sources. The Swedish regulation states L′nT,50 = 56 dB as the maximum level although the goal in many cases is set to 52 dB (Swedish sound class B). Starting with L′nT,50 = 56 dB, 44% of the occupants expect to rate the annoyance as at least moderate while 32% expect to be very or extremely annoyed due to footstep noise from the neighbours. For the stricter goal L′nT,50 = 52 dB, 35% will be at least moderately annoyed while 20% may be very or extremely annoyed. Although rarely used today, an 8 dB stricter goal may be applied, meaning that L′nT,50 must not exceed 48 dB (Swedish sound class A). For such a case, 26% of the occupants will still be at least moderately annoyed and 12% very or extremely annoyed.
Complementary analyses and discussions
Representative single number quantities for airborne sound insulation
The rated annoyance following the survey questions on airborne sound insulation is relatively low when DnT,50 fulfils the Swedish minimum requirement of 52 dB. For daily-living sound sources and for music, 10% and 12% of the occupants respectively are expected to rate those sources as very or extremely annoying, and 21% and 26% respectively as at least moderately annoying. The expected proportion of occupants being annoyed at this level of sound insulation, DnT,50 = 52 dB, is practically identical to the case when DnT,A = 52 dB, that is, the limit of sound class C according to ISO/TS 19488 meaning ‘protection against significant disturbance, given normal behaviour of neighbours who are considerate of other occupants’. Expected proportion of occupants being annoyed by daily living sound sources and music is summarised in Tables 3 and 4 for all sound classes according to ISO/TS 19488 and Swedish requirements respectively.
Expected proportion of occupants being at least slightly-, moderately- and very annoyed by daily living sounds and music respectively related to Airborne sound insulation class limits (dB) according to ISO/TS 19488.
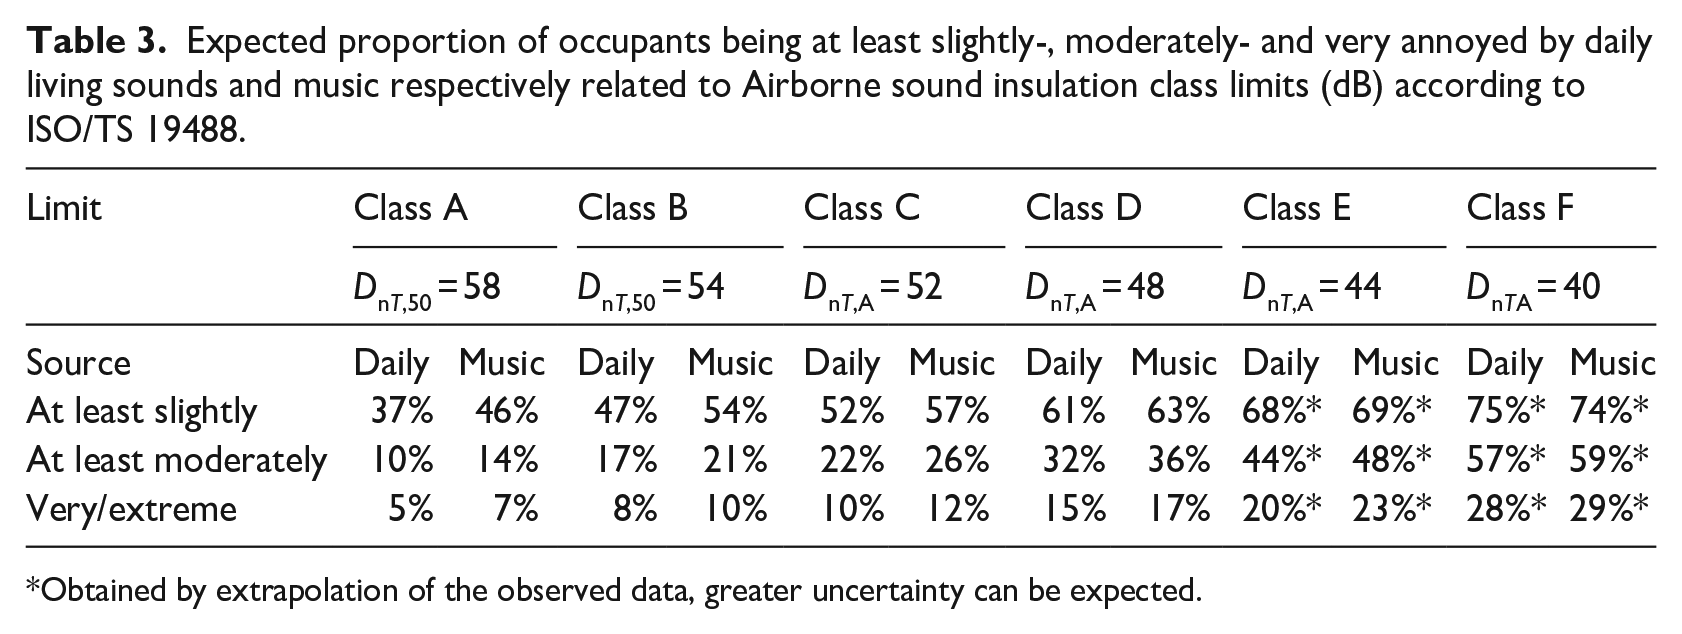
Obtained by extrapolation of the observed data, greater uncertainty can be expected.
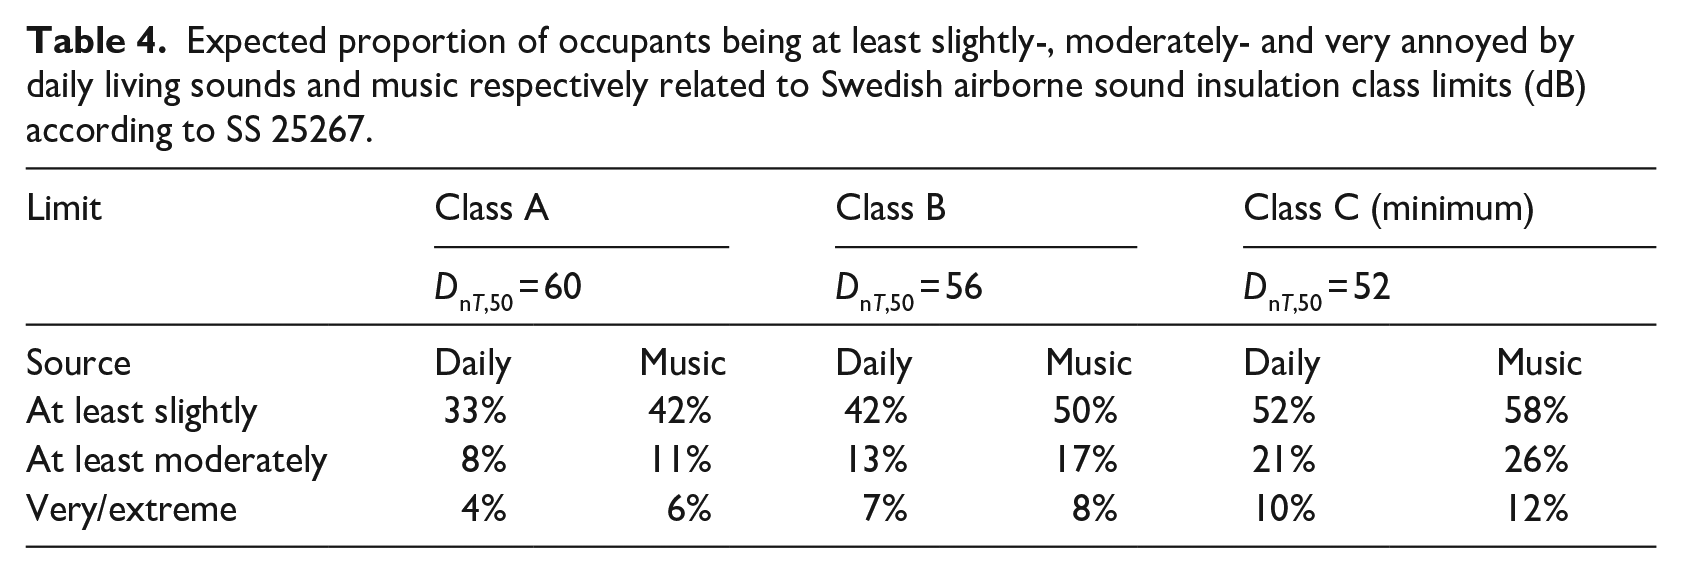
Expected proportion of occupants being at least slightly-, moderately- and very annoyed by daily living sounds and music respectively related to Swedish airborne sound insulation class limits (dB) according to SS 25267.
It is noted that the expected annoyance given the same numerical value for the descriptors DnT,A and DnT,50 is close to identical, see Figure 11 where the two parameters are compared for ratings of being very or extremely annoyed. As long as DnT,A and DnT,50 take the same numerical value, the same annoyance is expected regardless if daily living sounds or music is considered. As DnT,A and DnT,50 are defined from 100 and 50 Hz respectively, the result may seem unexpected, especially in the case of music which often includes significant energy within the range of 50–100 Hz. However, evaluation of sound insulation from 50 Hz has been mandatory in Sweden ever since 1999. This means the buildings are designed to give adequate sound insulation at low frequencies, which in turn give a very small contribution to the summation of C50–3150 (DnT,50) compared to C100–3150 (DnT,A), also observed by comparing the histograms of Figure 7(b) and (c). Similar studies conducted in markets where evaluation from 50 Hz is not mandatory, could possibly result in a different way.
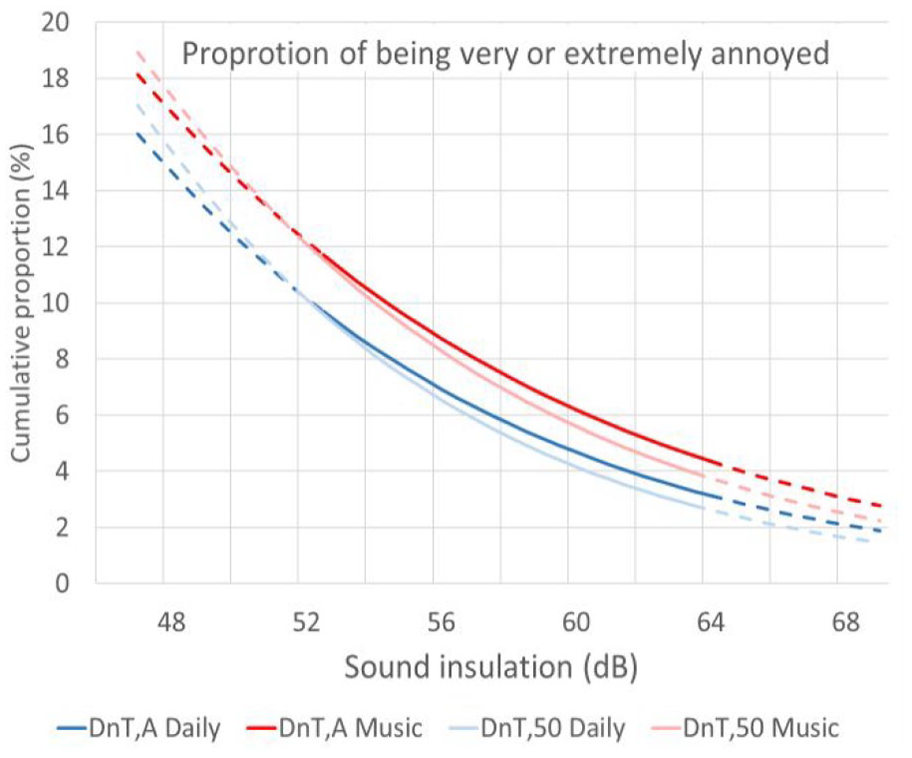
Cumulative proportion of rated annoyance due to daily living sound sources and music as functions of DnT,A and DnT,50. Solid lines represent 95% of the available data.
Recall that the rating of the different airborne sound related sources presented in Figure 5 shows that 13% are moderately, very or extremely annoyed by daily-living sounds through floors and ceilings. The corresponding proportion for daily-living sounds through walls is 7% and for music is 17%.
Overall, it is therefore suggested that the current legislation, DnT,50 ⩾ 52 dB, works satisfactorily and offers adequate airborne sound protection to the occupants. Even though the actual data indicates that evaluation from 100 Hz, DnT,A ⩾ 52 dB, will work equally well, it can be argued that evaluation from 50 Hz offers extra protection from low frequency sources and should be to prefer. Then, class B according to ISO/TS 19488, 15 DnT,50 ⩾ 54 dB, is in good agreement as it under normal circumstances gives ‘a good protection against sound without significant restriction on the behaviour of the neighbours’.
Representative single number quantities for impact sound insulation
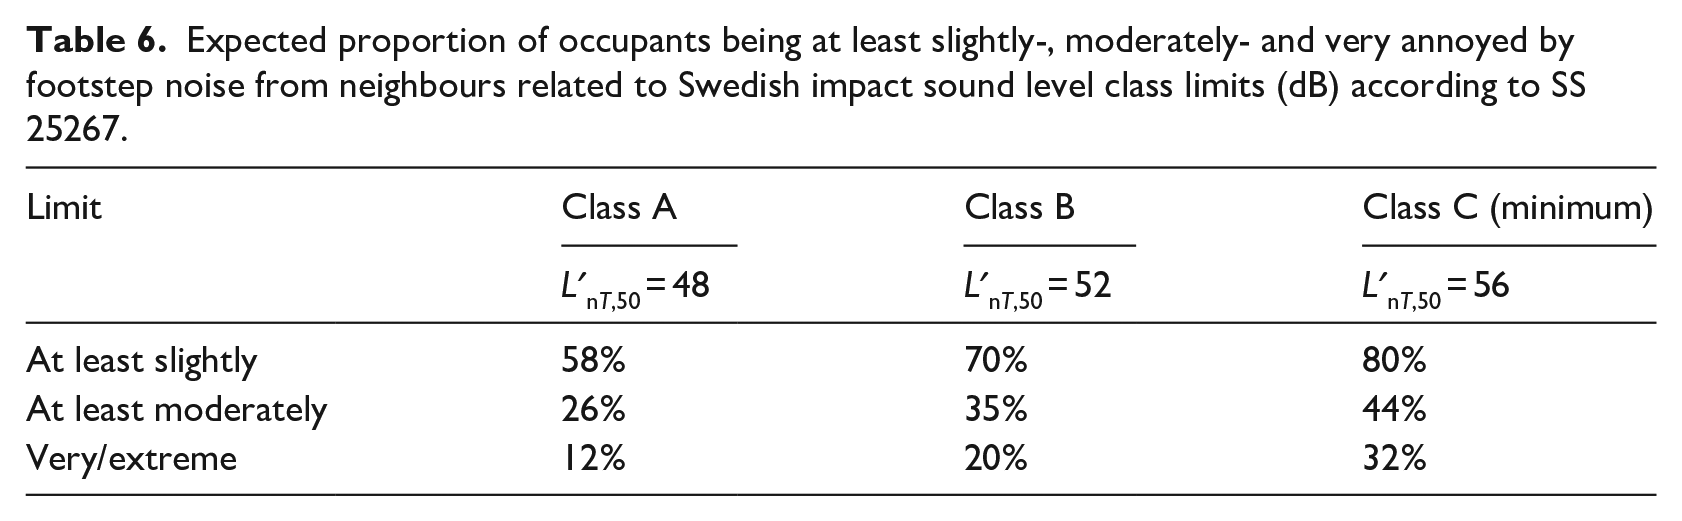
Impact sound in terms of footstep noise generated significantly higher reported annoyance in the survey compared to the airborne sound sources. For example, fulfilling the Swedish minimum requirements, 32% of the occupants are expected to be very or extreme annoyed by the sound of neighbours’ footstep, but only 10%–12% due to airborne sound sources. The expected proportion of occupants being annoyed by footstep noise is summarised in Tables 5 and 6 for sound classes according to ISO/TS 19488 and Swedish requirements respectively. No data is given for the ISO/TS classes C–F, due to the week statistic relation between L′nT,w and annoyance. 18 For the same reason, the expected annoyance in sound class A and B according to ISO/TS 19488 relies solely upon L′nT,50 (not L′nT,w).
Expected proportion of occupants being at least slightly-, moderately- and very annoyed by footstep noise from neighbours related to Impact sound level class limits (dB) according to ISO/TS 19488.
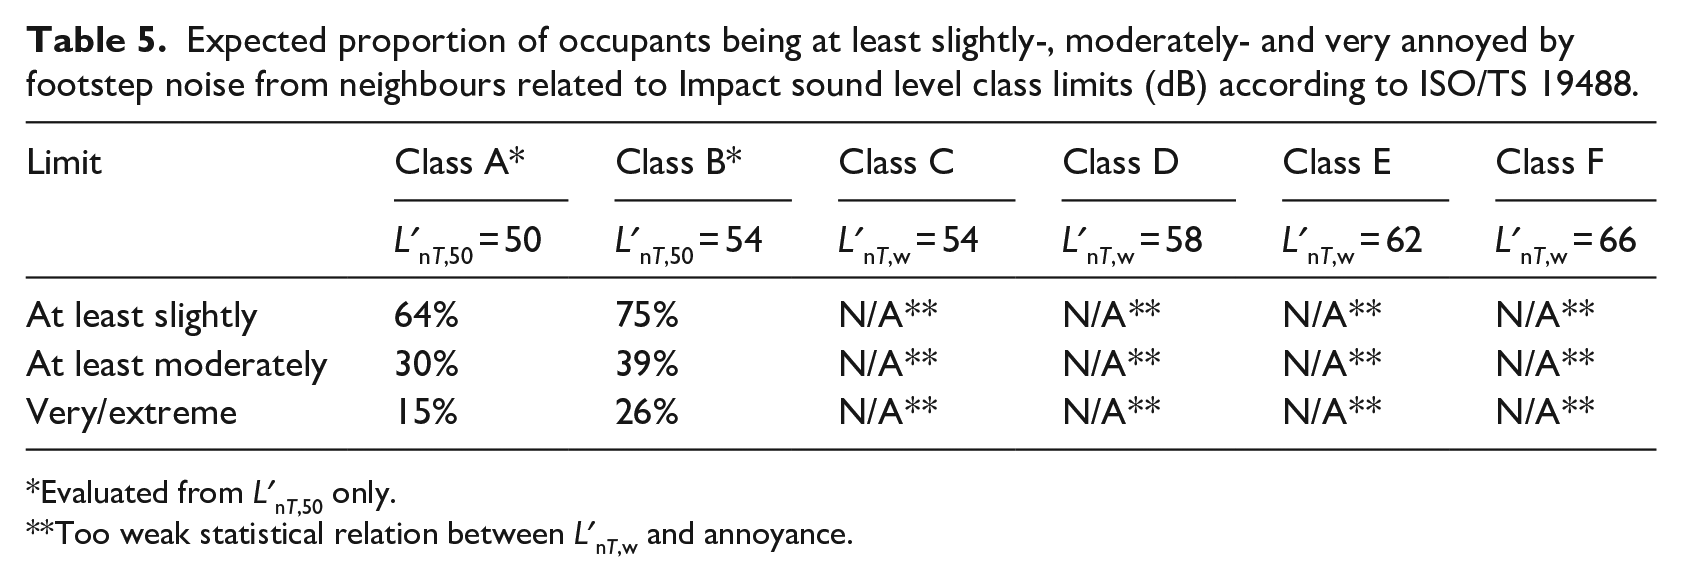
Evaluated from L′nT,50 only.
Too weak statistical relation between L′nT,w and annoyance.
Expected proportion of occupants being at least slightly-, moderately- and very annoyed by footstep noise from neighbours related to Swedish impact sound level class limits (dB) according to SS 25267.
As was concluded in the separate study regarding the correlation between the measured impact sound insulation and the rated annoyance, L′nT,25 appears to give a stronger correlation than L′nT,50. 18 The coefficient of determination, R2, was reported to be 40% for L′nT,50 and 62% for L′nT,25. As shown in the previous section, despite fulfilling the present Swedish impact sound insulation class A (L′nT,50 = 48 dB), which is in close agreement with class A according to ISO/TS 199488 (L′nT,50 = 50 dB and L′nT,w = 46 dB), the annoyance will be greater than for airborne sound insulation that only meets the minimum requirement (DnT,50 = 52 dB). This indicates the need for a more restrictive requirement that offers a higher degree of protection against unwanted impact sounds, and for this purpose L′nT,25 is preferred.
Where to set the numerical limit of a requirement based upon L′nT,25 may be discussed. First, the logistic regression analyses involving L′nT,50 in Figure 10(b)) is compared with the corresponding analysis using L′nT,25 in Figure 12. For L′nT,50 = 56 dB, the Swedish minimum requirement, 32% of the occupants are expected to rate the annoyance as very or extremely annoying and 44% as at least moderately annoying. This level of annoyance corresponds to L′nT,25 = 59 dB, which may be used if a similar satisfaction/annoyance rating as for the present minimum requirement is the target. However, to achieve greater acoustical protection, the numerical value must be lower than 59 dB. A convenient choice would be L′nT,25 = 56 dB, that is, the same numerical value as the Swedish requirement for L′nT,50 of today. Such a choice expects to generate the proportion of 21% being very or extremely annoyed, and 36% being a least moderately annoyed.
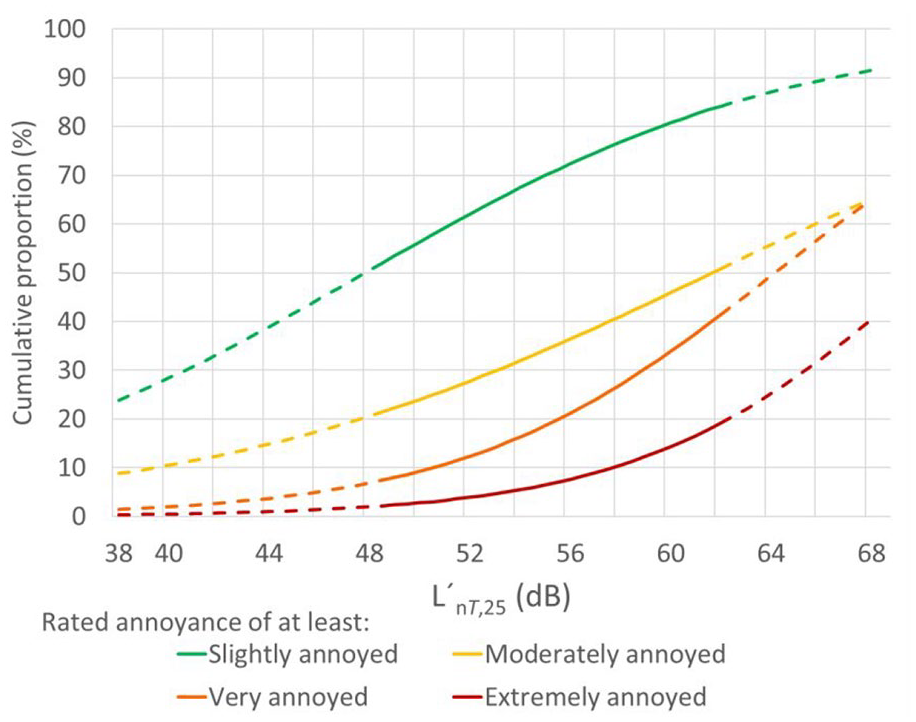
Cumulative proportion of rated annoyance due to footstep noise as a function of L′nT,25. Solid lines represent 95% of the available data.
A further step is to find a level of expected annoyance from impact noise that equals the annoyance from airborne daily-living sounds. Then the annoyance should match 21% and 10% being at least moderately, and very or extremely annoyed, occupants respectively. This level of annoyance corresponds to L′nT,25 being as low as about 50 dB. Even though arguments exist, such a dramatic shift compared to today’s standard would probably be too difficult for the building industry to handle.
Another approach is to use the overall annoyance ratings from Figures 5 and 6 as the starting point. Considering all the buildings, 34% of the occupants are at least moderately annoyed by footsteps while 13% and 17% are at least moderately annoyed by daily-living sounds from floors and music respectively. Concerning the group that is very or extremely annoyed, the proportions are 20% due to footstep and 6% and 8% due to daily-living sounds and music respectively. It could then be claimed that annoyance from impact noise bothers – roughly – about twice as many as are annoyed by airborne sound sources. To decrease the footstep noise annoyance by half, L′nT,25 must shift from 59 dB to 54 dB for the group being very or extremely annoyed, but from 59 to 49 dB for the at least moderately annoyed. The large difference in annoyance corresponds to the steeper slope of the curve representing the group being very or extremely annoyed compared to at least moderately annoyed in Figure 12.
A possible new minimum requirement for impact sound insulation reading L′nT,25 = 54 dB, will probably not reduce the total annoyance from footstep to the same level as for airborne sound sources, but it will have a great effect for the occupants that are very or extremely annoyed, a relatively large group: 20% of all occupants. Comparing L′nT,25 = 54 dB with the measured impact sound pressure levels presented in Figure 7(f)), it is seen that all the concrete buildings in this study meet that requirement already, as well as almost half of the CLT buildings. For the lightweight buildings though, only one case fulfils this limit. On average, the lightweight buildings exceed the target by 6 dB.
Because ISO/TS 19488 15 does not consider frequencies below 50 Hz, an exact comparison is difficult to make, but relying upon the diagrams in Figures 10 and 12, L′nT,25 = 54 dB should be in close agreement with class A, L′nT,50 ⩽ 50 and L′nT,w ⩽ 46 dB, ‘a quiet atmosphere with a high level of protection against intruding sound’. The suggestion of L′nT,25 = 54 dB may seem tough to fulfil for lightweight constructions, but it is by no mean impossible. One of the lightweight building cases in the study does meet the suggested limit and two of the cases exceed it by just 1 dB. Nevertheless, if the requirement should be implemented in the building regulations, there is a need for research and development to strengthen lightweight buildings’ sound insulation at low frequencies.
Conclusions
A comprehensive survey study involving 38 apartment buildings has been performed. The buildings show a diversity in construction techniques involving lightweight, CLT and concrete-based constructions. The choice of building cases gives a good representation of the Scandinavian market of multi-family houses. In total, 1230 questionnaires were returned from the occupants and analysed. The questions were in regard to rated annoyance for various common sound insulation issues.
Overall, the occupants seem to be fairly satisfied with the acoustical quality in their homes. The mean value of the rated annoyance, following the numerical scale ranging from 0 to 10 is around 1.0–1.5 for most of the survey’s sound sources. One important exception, which concerns the annoyance from footstep noise, is found. Transforming the numerical scale into an ordinal scale suggests that 68% of the occupants are annoyed to some extent by sounds from footsteps and that 34% are at least moderately annoyed. The rating of footstep noise shows a great variation depending on the type of construction, with 24% of the occupants in concrete buildings expected to be at least moderately annoyed, and 9% to be very or extremely annoyed. For occupants in lightweight buildings, 43% and 28% are expected to be at least moderately and very or extremely annoyed respectively.
The airborne and impact sound insulation were measured in all the buildings and related to the survey responses. It was found that the present numerical minimum requirement for airborne sound insulation according to the Swedish legislation, DnT,50 = 52 dB, somewhat milder than class B according to ISO/TS 19948, DnT,50 = 54 dB, serves for adequate protection to the occupants against unwanted noise from airborne sound sources.
The impact sound insulation does not seem to work equally well in all cases. The present Swedish minimum requirement, L′nT,50 = 56 dB, again somewhat milder than class B according to ISO/TS 19948, L′nT,50 = 54 dB, works well for heavy concrete constructions but does not give occupants in lightweight buildings satisfactory protection. An alternative suggestion to a single number quantity is therefore given, which differs in two respects compared to present standards:
(1) L′nT,50 is replaced by L′nT,25, that is impact sound is evaluated from 25 Hz instead of 50 Hz, which serves for stronger correlation between measurement and the perceived sound insulation in terms of rated annoyance. If found to be negative, the spectrum adaptation term CI,25–2500 is set to zero.
(2) The requirement becomes stricter, L′nT,25 = 54 dB is suggested. This will give a higher degree of protection to the occupants against impact sound related sources, primarily footstep noise.
The possible introduction of a requirement in line with the suggestion will be challenging for building industries focusing upon lightweight constructions. On the other hand, among the buildings of this study, some of the lightweight constructions would meet that requirement, or be very close to it, already. A positive effect is that if the suggested limit is fulfilled, the occupants will gain better sound protection against annoying impact sounds leading to a more satisfactory indoor acoustic climate, which in turn will strengthen the competitiveness of lightweight housing.
Overall, the suggested evaluation method for impact sound will work equally well regardless of the building’s construction type, that is, it is technique-neutral which is not the situation with todays’ methods and regulations.
Footnotes
Declaration of conflicting interests
The author(s) declared no potential conflicts of interest with respect to the research, authorship, and/or publication of this article.
Funding
The author(s) disclosed receipt of the following financial support for the research, authorship, and/or publication of this article: This work was supported by the Swedish Research Council Formas [grant number 2018-01084]; and the Swedish Energy Agency [grant number 46771-1].