
Abstract
Journal bearings are essential machine elements that are widely used in the bearing of rotating or oscillating machine parts. Many studies in the literature examine the tribological properties of journal bearings. Most of these studies focus on polymer journal bearings and testing the tribological performances of different bearing materials with the same surface quality. In this article, radial journal bearings produced from ultra-high molecular weight polyethylene (UHMWPE) material and polyoxymethylene (POM) material in two different surface qualities in the range of N7–N8 and N10–N11 were tested under different load and different speed scenarios and their tribological performances and relationship of this performance between material and surface roughness were investigated. For this purpose, first of all, bearing samples were designed and manufactured. All samples’ tribological and physical properties before the tests were measured, and then tests were carried out according to the determined scenarios. Different loads, different speeds, and different sliding distances were used in the scenarios. As a result, 96 tests were carried out by testing each situation three times in eight scenarios, with two different surface qualities from two different materials. In the tests, the friction coefficient, temperature, and weight loss values of all samples were measured, and after the tests, surface roughness measurements and SEM analyses were made. As a result, all the data obtained from the tests and measuring devices were compared with the pre-test conditions and material and surface quality. The results obtained from the comparisons and the evaluations of tribological performance are discussed in the conclusion part. The study results show that the material and the surface quality significantly affect the tribological performance.
Introduction
Journal bearings are machine elements that permit a relative motion between the contact surfaces and prevent movement in the direction of the force of rotating and oscillating elements. 1 Researchers have recently made journal-bearing designs with materials known to have good tribological properties by utilizing the developing polymer material technology.2,3 They also reported that tribological characteristics depends on not only the mechanical and structural properties of the materials used but also the technique of testing.4,5 Most research on the tribological properties of polymers is measured with devices commonly referred to as pin-on-disc and pin-on-ring.6,7 Wear mechanisms can be studied under lab conditions using these devices, reducing the material cost and improving the environmental sustainability.8,9 However, since radial journal bearings have unique geometry and operating conditions, pin-on-disc and pin-on-ring studies only give us a basic idea about journal-bearing materials. Pin-on-disc test rig used for studies was designed for accurate measurement of tribological performance such as friction, wear and lubrication. In dry test conditions of solid pair, sliding occurs between a static surface that is loaded onto a rotating disc. It is possible to change the normal load, wear diameter, test time and rotational speed to match the test conditions.10,11 Therefore, bearing geometry and operating conditions should also be considered in studies on the tribological properties of polymer journal bearings. Tevruz, 12 for this reason, stated that it would be more appropriate to carry out studies on radial journal bearings with a radial bearing test rig that includes this geometry and conditions. This situation motivated the use of a particular test device in this study.
Steels, ceramics, and polymers are widely used in industrial machine elements. Especially since polymers are self-lubricating with increasing technology, their use is increasing. When we examine industrial applications, the fact that polymer materials are light, resistant to environmental conditions, and have low manufacturing costs has enabled them to be used frequently as power transmission elements today. Gears, belts, tires, and bearings are produced from polymer and polymer composites. 13 The operation of self-lubricating polymers in low temperature conditions between working material pairs is desirable and contributing. 14 Polymer bearings are frequently used in machine elements due to their low friction coefficient and insensitivity to chemical effects in dry sliding conditions. 15 The wear resistance of polymer materials varies with temperature, load, and sliding speed, especially in bearings.16,17 In addition, it is known that the variability of the surface qualities of the samples also affects the tribological test results to be performed on polymer materials. Most tribological applications with polymeric materials involve pairs where one element is made of metallic materials and the other is polymeric. Studies show that UHMWPE18,19 and POM 20 materials are frequently used in the industry areas specified in the references (biomechanical applications for UHMWPE, automotive industry for POM). There are also applications where the polymeric material moves against a body made of the same materials (such as gear transmissions).21,22 Bouhabila et al., 23 in their studies, determined that the tribological properties were improved by decreasing the surface roughness values (Ra). The tribological performance of wear and friction behavior can be increased with the better surface quality motivated to carry out this study.
Cong et al. 24 examined the test specimens made of polyamide 66, polyphenylene sulfide (PPS), and polytetrafluoroethylene (PTFE) material from a tribological point of view, using the same abrasive surface material in a pin-on-disc assembly. Experiments were carried out at a sliding speed of 0.2 m/s and four different loads (0.5-1.0-1.5-2 N). After the experiment, the highest friction coefficient was observed in PPS material, while the lowest friction coefficient was observed in PTFE. It has been determined that the friction coefficient increases with increasing load. Claveria et al. 25 investigated tribological performance of nylon composites. Results show that better outcomes are obtained for composites based on PA12. Ünlü et al. 26 operated the bearing samples made of polyethylene, polyamide, POM, PTFE, and bakelite materials for 2.5 hours in a dry journal bearing test device under sliding speed of 0.13 m/s and 20 N load, and a total sliding distance of 1177.5 m. As a result of the experiments completed with SAE 1050 spindle, they calculated the friction coefficient values in the range of 0.15–0.25 and the temperature values in the bearings in the range of 30–35 °C. The friction coefficient of the bakelite and Teflon (PTFE) bearing samples was found to be the lowest, while the highest friction coefficient was obtained in the polyethylene bearings. While the maximum wear was in bakelite material, the minimum wear was determined in POM material. In addition, surface roughness measurements were also completed, and it was observed that Ra values increased in polyethylene and polyamide materials but decreased in bakelite, POM, and PTFE materials. Feyzullahoğlu and Şafak 27 evaluated the tribological performance of bearing samples made of POM, PETP, cast polyamide, and devatex materials with AISI 440C abrasive material. As experimental scenarios, four different speeds (0.5-1.0-1.5-2.0 m/s) and seven different loads (60-80-100-120-140-160-180 N) were chosen. The experimental results found that the friction coefficient increased with increasing sliding speed and the temperature increase was also observed with increasing sliding distance. Temiz, 28 evaluated the tribological performances of the samples made of cast POM, cast PA, UHMWPE, PTFE + 15% glass fiber, PTFE + 25% carbon, PTFE + 35% carbon, PTFE + 40% bronze and PTFE + 60% materials in the journal bearing test rig. As a result of the experiments, it was observed that the friction coefficient increased with increasing sliding speed in 15% glass fiber reinforced PTFE and decreased under some load conditions in 25% glass fiber reinforced PTFE. It has been observed that the friction coefficient decreases with the increase in sliding speed in 25% and 35% carbon fiber-reinforced PTFE journal bearings. It also has been determined that there is a smaller increase in the friction coefficient with increasing speed in PTFE journal bearings with 40% and 60% bronze filled. Ünal and Yetgin 29 investigated the tribological performance of UHMWPE and PA6 bearing samples in a pin-on-disc device. Experiments were carried out with 3 different load conditions (50-100-150 N) and 4 different sliding speeds (0.5-1.0-1.5-2.0 m/s). As a result of the experiment, it was observed that the friction coefficient of the bearing samples decreased with the load, while the friction coefficient of the samples increased with increasing sliding speed. Sarı and Nteziyaremye 30 examined the bearing samples made of kestamide, kestamide/HS, kestoil, kestlub, and UHMWPE in a journal bearing test rig using 316 stainless steel as the shaft material. Three different sliding speeds, loads, and test times were used in the experimental scenario. They found that the friction coefficients increased with the increase of the test time, and the lowest friction coefficient was found in the kestoil sample.
The literature discussed above and mainly authors of Refs.26,27,29 motivated us to use UHMWPE and POM materials which are found to have good tribological properties by pin-on-disc and pin-on-ring tests. Authors of Ref. 23 also motivated us to examine how the radial journal bearings designed and manufactured from these materials in different surface quality would perform. Therefore, in this study, samples produced from both UHMWPE and POM materials with two different surface qualities 31 in the range of N7–N8 and N10–N11 were tested under two different loads (10–20 N) and four different speeds (0.5-1.0-1.5-2.0 m/s). In the tests, the friction coefficient (µ), temperature (T), weight loss (ΔW), and specific wear rate (W) values of all samples were measured, and after the tests, surface roughness measurements and SEM analyses were made. Tribological performance was evaluated by comparing all the obtained data with the pre-test and each other. In the second section of the study, information about the test studies is given. In this context, the design and manufacture of radial journal-bearing specimens are emphasized, followed by the experimental setup and test scenarios. The third section presents all the data obtained from the samples before and after the tests, surface roughness measurements, and SEM images. In addition, in this section, all data are compared in detail with the pre-test conditions of the samples and with each other. The last part examined the study's results, and evaluations were made regarding the design and tribological features specific to journal bearings. The last part examined the study's results, and evaluations were made regarding the design and tribological features specific to journal bearings.
Experimental study
Materials and sample preparation
The radial journal-bearing specimens used in the experiments were produced from two different materials and different surface qualities. UHMWPE and POM materials, which were found to have good tribological properties by pin-on-disc and pin-on ring tests, were selected as materials.
The surface roughness values of all bearing samples were measured before and after the test. The values are given below in Table 1.
Surface roughness values for bearings.
The wear properties of ultra-high molecular weight polyethylene (UHMWPE) and polyoxymethylene (POM) materials are influenced by their crystallinity, chain directions, and molecular weight distribution. In terms of crystal chain directions, if both UHMWPE and POM materials exhibit a high degree of alignment in their polymer chains, it enhances their mechanical properties and imparts a high resistance to wear. The aligned chain directions provide a more efficient barrier against wear and deformation. Moreover, the aligned chains aid in the even distribution of stress throughout the material, thereby reducing the likelihood of wear and failure. Regarding molecular weight distribution, a narrow distribution of molecular weights in UHMWPE and POM materials is desirable.32,33 A narrow distribution implies a more uniform chain length distribution, which improves the wear properties. A narrower distribution reduces the presence of low molecular weight regions in the material, resulting in enhanced wear resistance. By minimizing the presence of weaker regions within the material, the overall wear performance is improved.
As for the surface quality, it was decided to produce the inner surfaces of the bearing samples with the surface roughness values of N7–N8 and N10–N11. In this way, it is desired to understand the effect of both the bearing material and the surface quality on the tribological performance. As a result, four different bearing samples were designed. These are (1) N7–N8 quality samples made of UHMWPE, (2) N10–N11 surface roughness samples of UHMWPE material, (3) N7–N8 quality samples of POM material, and (4) N10–N11 surface roughness samples of POM material.
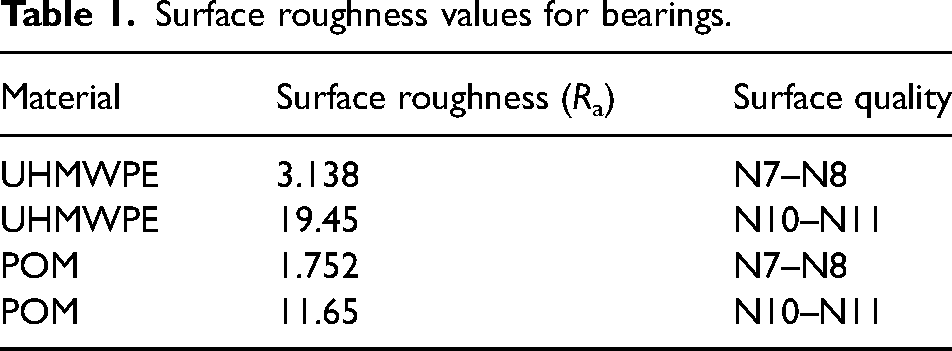
The exact dimensions and tolerances were observed in the design of all samples, and the samples were manufactured in these geometries. In the design of the bearing, firstly, the calculations of the bearing space were made, and the following expressions were used in the design.
34


In the above expressions, Δl is the bearing clearance reduction amount, s is the bearing thickness, ɛf is the moisture expansion coefficient, α is the thermal expansion coefficient, Δt2 is the temperature difference between the bearing surface and the outside environment, lmin is the minimum bearing clearance, d is the bearing diameter, l is the bearing clearance. As a result, the bearing samples were designed as in Figure 1 and manufactured according to these dimensions.
Experimental setup
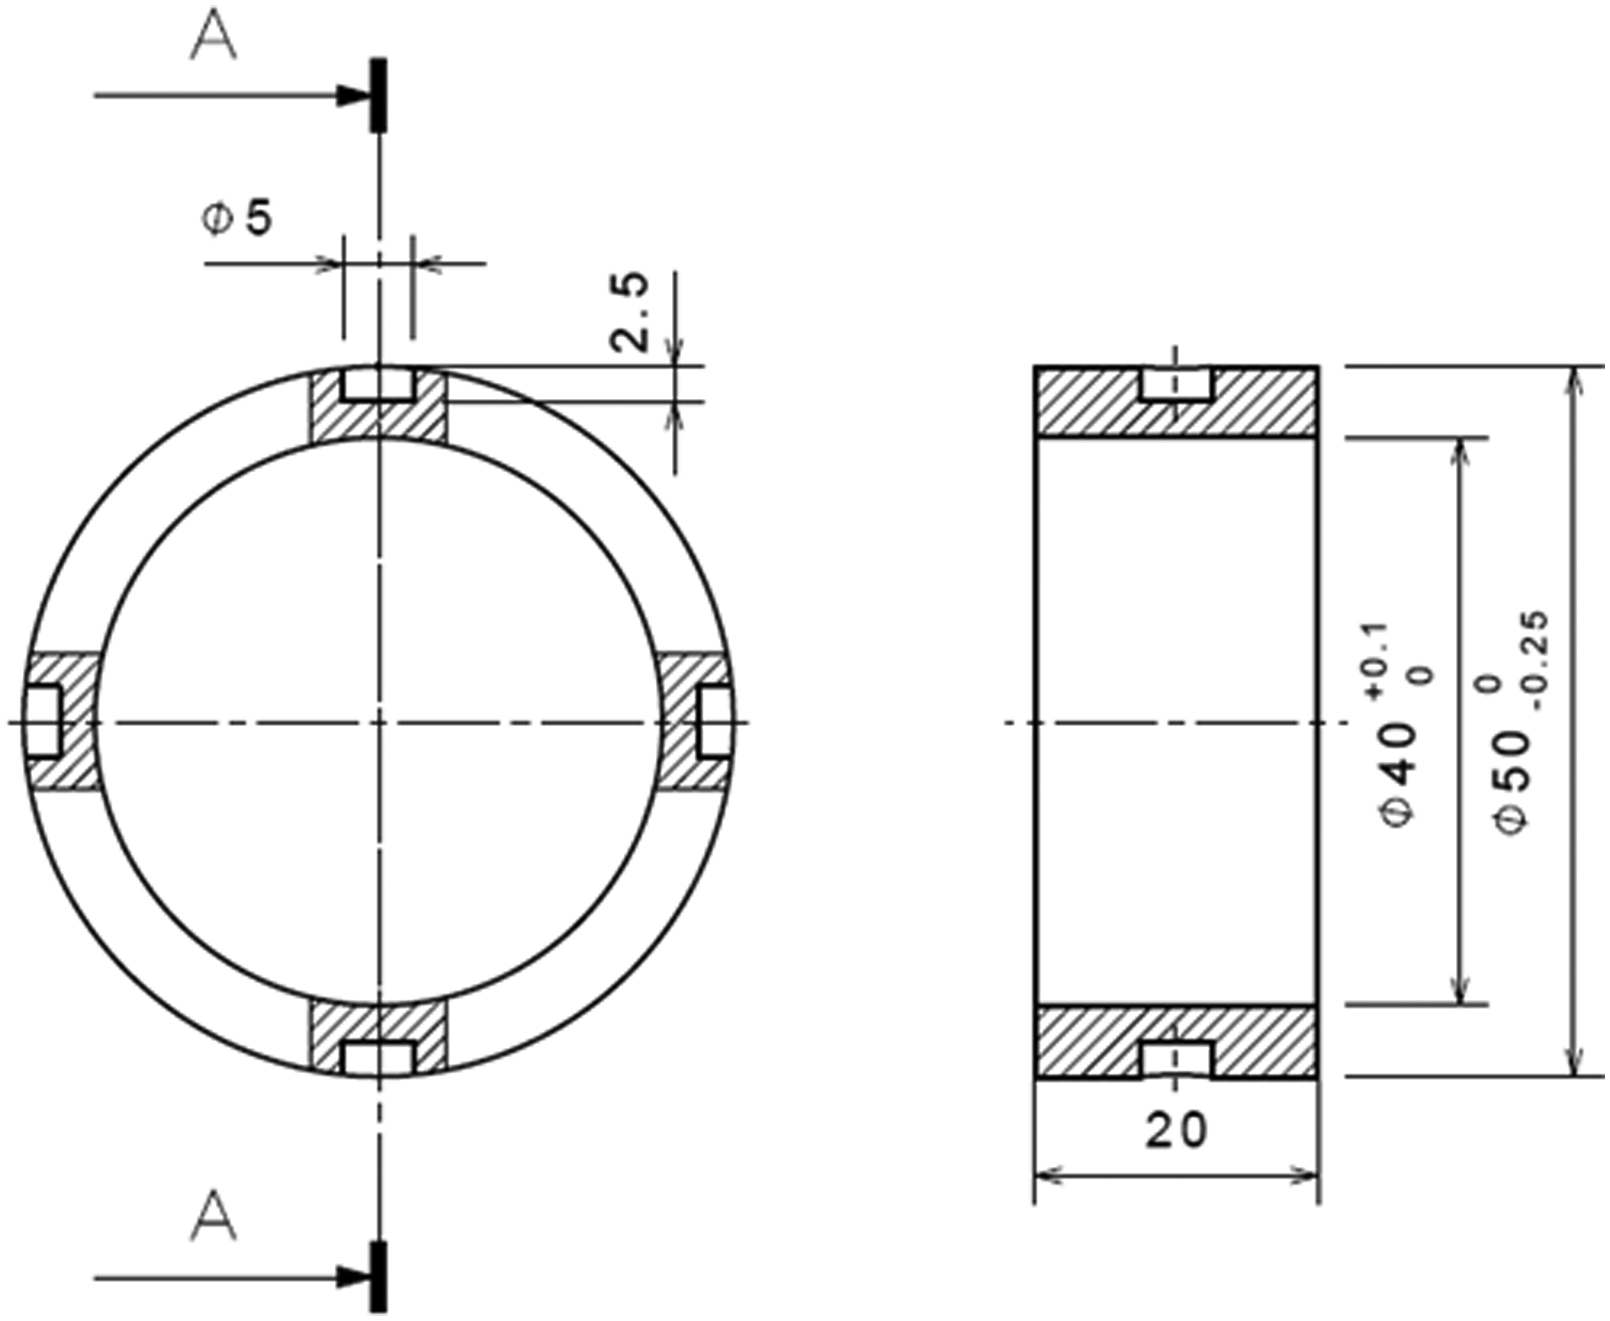
Since radial journal bearings have unique geometry and operating conditions, the prepared samples and the test setup were designed according to this geometry and conditions. The schematic view of the radial journal-bearing test rig to be used in the experiments is given in Figure 2. The tester has a power of 2.2 kW and a maximum speed of 1500 rpm. Testing speed was adjusted to obtain values for different experimental scenarios. Sliding speed can be adjusted from control panel, which is shown as 1 on Figure 2.
Bearing dimensions.
(a) Radial journal bearing test rig; (1) motor and control panel, (2) journal-bearing specimen, (3) shaft, (4) pressure bar, (5) load cell, and (6) load hanger. (b) Test measurement area.
In the tests, the material of the shaft cooperating with the bearing samples was chosen as SAE 1050 and the surface roughness value before the tests was measured as Ra = 0.582 µm (with surface quality between N5 and N6). No wear was observed on the shaft after the tests.
Test scenarios
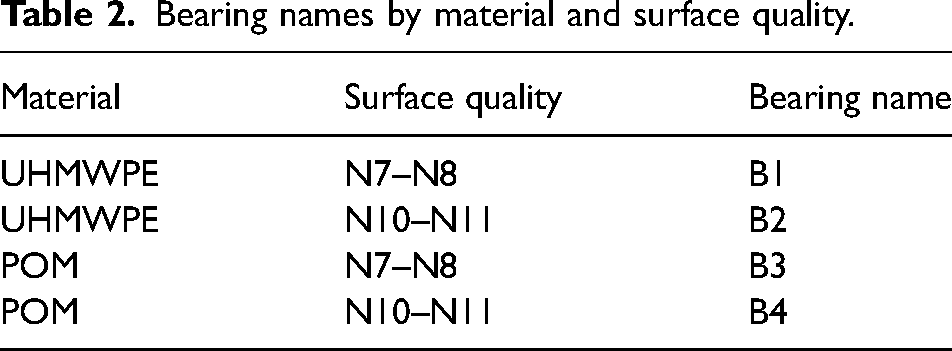
In the study, four of journal-bearing specimens with two different materials and two different surface qualities were designed, and three were manufactured. Therefore, in the tests, samples that (1) made of UHMWPE with surface quality between N7 and N8, (2) made of UHMWPE with surface quality between N10 and N11, (3) made of POM with surface quality between N7 and N8 and (4) made of POM with surface quality between N10 and N11 were used. In more accessible terms, bearings will be referred to as “B1” which is made of UHMWPE with surface quality between N7 and N8, “B2” which is made of UHMWPE with surface quality between N10 and N11, “B3” which is made of POM with surface quality between N7 and N8 and “B4” which made of POM with surface quality between N10 and N11. This nomenclature is indicated in Table 2.
Bearing names by material and surface quality.
As test scenarios, 10 N and 20 N loads were hung on the load hanger, and eight were carried out at 0.5-1.0-1.5-2.0 m/s sliding speeds, respectively. As a result, 96 tests were carried out from two different materials with two different surface qualities and eight scenarios, each case being tested three times. The friction coefficient and temperature values were measured for 500-1000-1500-2000 m sliding distance, and the material losses due to abrasion were determined by measuring the sample weights before and after the tests. In addition, the surface roughness values of each sample were also measured.
As a result, from the tests made, friction coefficient (µ), temperature (T), surface roughness (Ra), weight loss (ΔW), and specific wear amount (W) values were obtained. In the third section, all details regarding these data are presented in graphics and tables. In addition, SEM images of the samples were also obtained. Afterward, graphs, tables, and images of the data obtained from all tests were interpreted both within and by comparing them.
Test results
In this section, the results of a total of 96 tests performed under different scenarios on journal bearings which we have named B1, B2, B3, and B4, are given under the subtitles of friction coefficient, temperature, surface roughness, wear, and weight loss, and SEM images, respectively.
Friction coefficient
The friction coefficient values are arranged according to each material's relevant load and speed scenarios. Sliding forces were obtained from a probe on the load cell for all experiments. To calculate friction coefficient values, the formula is given below: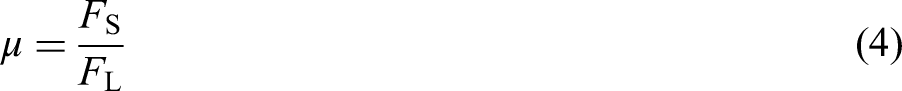
Friction coefficient–sliding distance graphs of test samples under 10 N load: (a) 0.5 m/s sliding speed, (b) 1 m/s sliding speed, (c) 1.5 m/s sliding speed and (d) 2 m/s sliding speed.
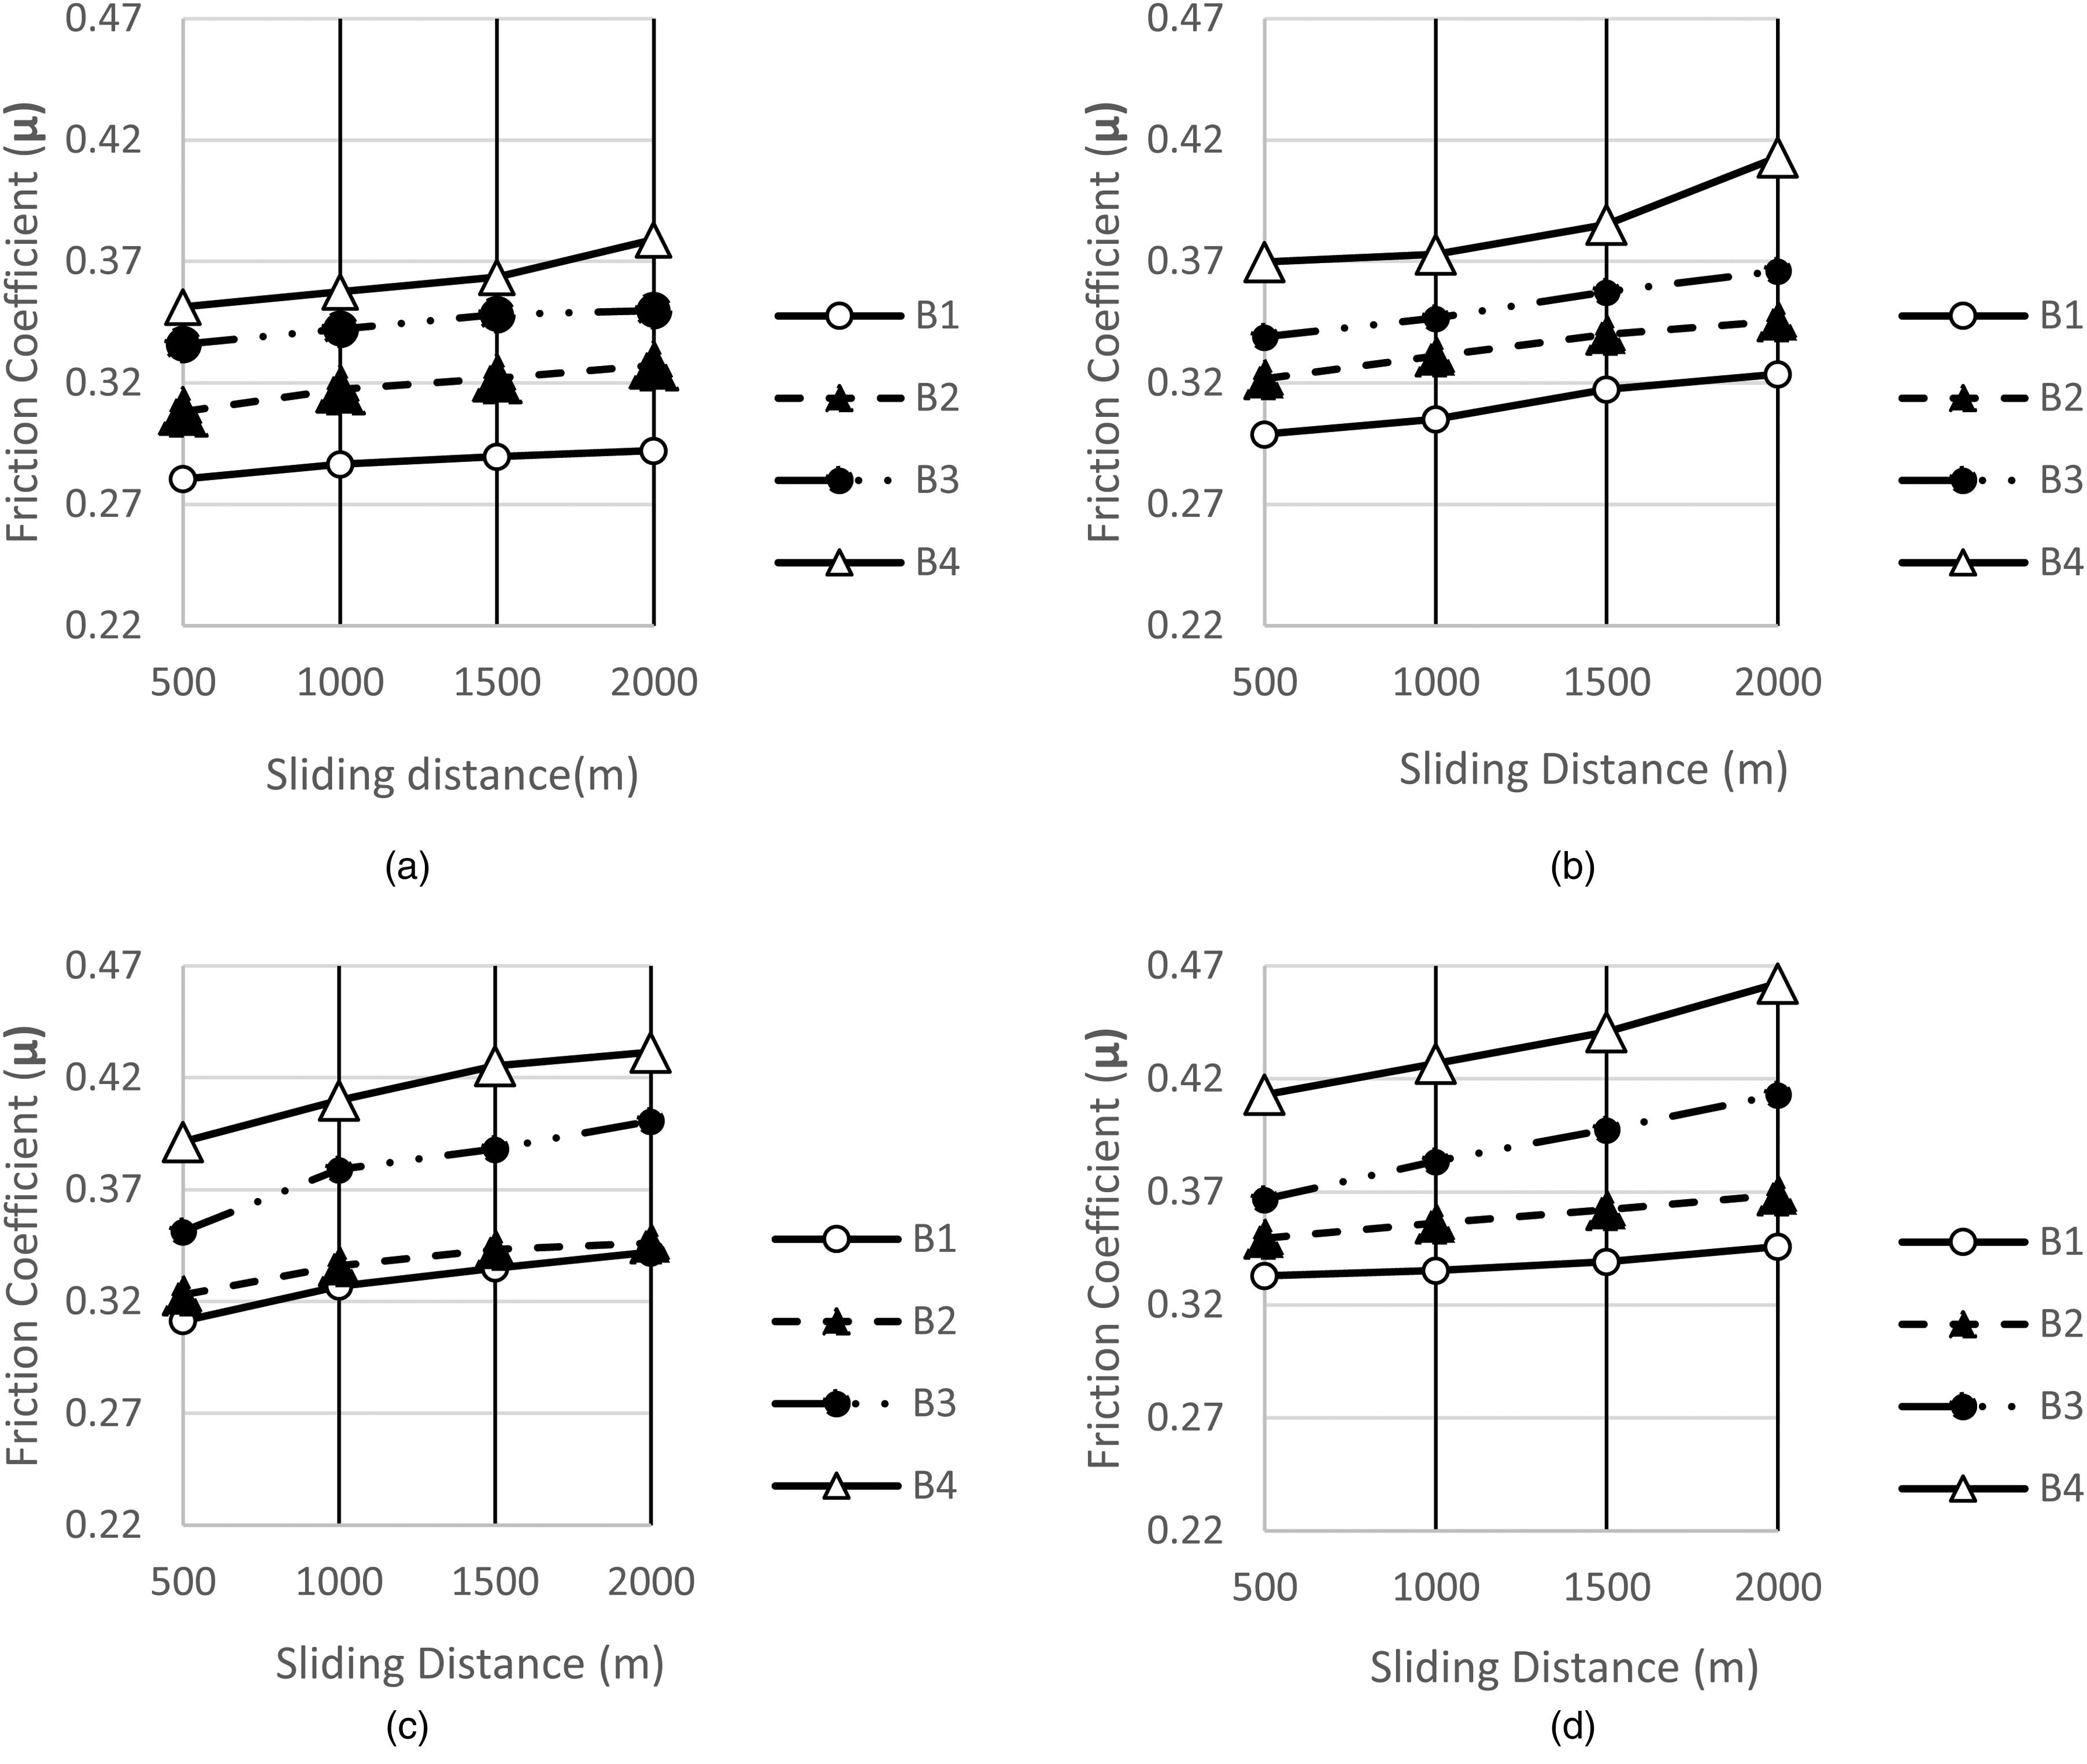
Friction coefficient–sliding distance graphs of test samples under 20 N load: (a) 0.5 m/s sliding speed, (b) 1 m/s sliding speed, (c) 1.5 m/s sliding speed and (d) 2 m/s sliding speed.
The test results showed that the friction coefficient of the processed UHMWPE sample with surface quality N7–N8 (B1) increased by 5–10% between 0.5 m/s and 2 m/s sliding speeds under 10 N load. It was also observed that between 500 m and 2000 m, sliding distance increased by 4.5% for 0.5 m/s and 7–11% for other speeds. For the UHMWPE sample processed with N7–N8 surface quality (B1), the friction coefficient increased by 6–12% between 0.5 m/s and 2 m/s sliding speeds under 20 N load and 0.5 m/s between 500 m and 2000 m sliding distance. It was also observed that it increased by 4.5% and 7–11% for other speeds. It was found that the friction coefficient of the UHMWPE sample with N10–N11 surface quality (B2) increased by 5–6% between the sliding speeds of 0.5 m/s and 2 m/s under 10 N load and by around 5–6% between the sliding distance of 500 m and 2000 m. It was found that the friction coefficient of the UHMWPE sample with N10–N11 surface quality (B2) increased by 4–6% between the sliding speeds of 0.5 m/s and 2 m/s under 20 N load and by around 4–9% between the sliding distance of 500 m and 2000 m. It was calculated that the friction coefficient of the POM sample with N7–N8 surface quality (B3) increased by 4–9% between the sliding speeds of 0.5 m/s and 2 m/s under 10 N load and by around 3–12% between the sliding distance of 500 m and 2000 m. It was also calculated that the friction coefficient of the POM sample with N7–N8 surface quality (B3) increased by 3–5% between the sliding speeds of 0.5 m/s and 2 m/s under 20 N load and by around 7–9% between the sliding distance of 500 m and 2000 m. It was found that the friction coefficient of the POM sample with N10–N11 surface quality (B4) increased by 4.5–8% between the sliding speeds of 0.5 m/s and 2 m/s under 10 N load and by around 8–12% between the sliding distance of 500 m and 2000 m. It was found that the friction coefficient of the POM sample with N10–N11 surface quality (B4) increased by 2–6% between the sliding speeds of 0.5 m/s and 2 m/s under 20 N load and by around 3.5–9% between the sliding distance of 500 m and 2000 m.
As can be seen, when the friction coefficient-sliding distance graphs of the test samples are examined, it has been determined that the lowest friction coefficient (under 20 N load and 2 m/s sliding speed) is observed in B1 with a value of 0.28. The highest friction coefficient (under 10 N load and 2 m/s sliding speed) was found in B4, with a value of 0.462. As the sliding distance increased, the friction coefficient for each material increased, and the friction coefficient values decreased as the load increased. The wear behavior of B3 and B4 bearings made from POM material, subjected to loading forces of 10 N and 20 N at the contact point, differs due to the formation of the friction film at varying distances. Specifically, at the lower loading of 10 N, the formation of the friction film takes a longer time compared to the higher loading of 20 N. This discrepancy arises from the material's characteristics and production quality. In the case of B1 and B2 bearings made from UHMWPE material, the presence of higher surface roughness compared to B3 and B4 bearings made from POM material causes variations in the friction coefficient depending on the applied loading. These differences can be attributed to the distinctive material properties and the level of production quality. In summary, the dissimilar wear behavior observed between B3 and B4 bearings from POM material under different loading conditions can be attributed to the delayed formation of the friction film at lower loads. Similarly, the discrepancies in the friction coefficient between B1 and B2 bearings from UHMWPE material, in comparison to B3 and B4 bearings from POM material, arise from variations in surface roughness and the inherent characteristics of the respective materials, as well as the quality of their production. The studies in these three papers35–37 illustrate the physical mechanism of the effect of contact pressure on adhesion coefficient (force), which could support this conclusion well.
Temperature
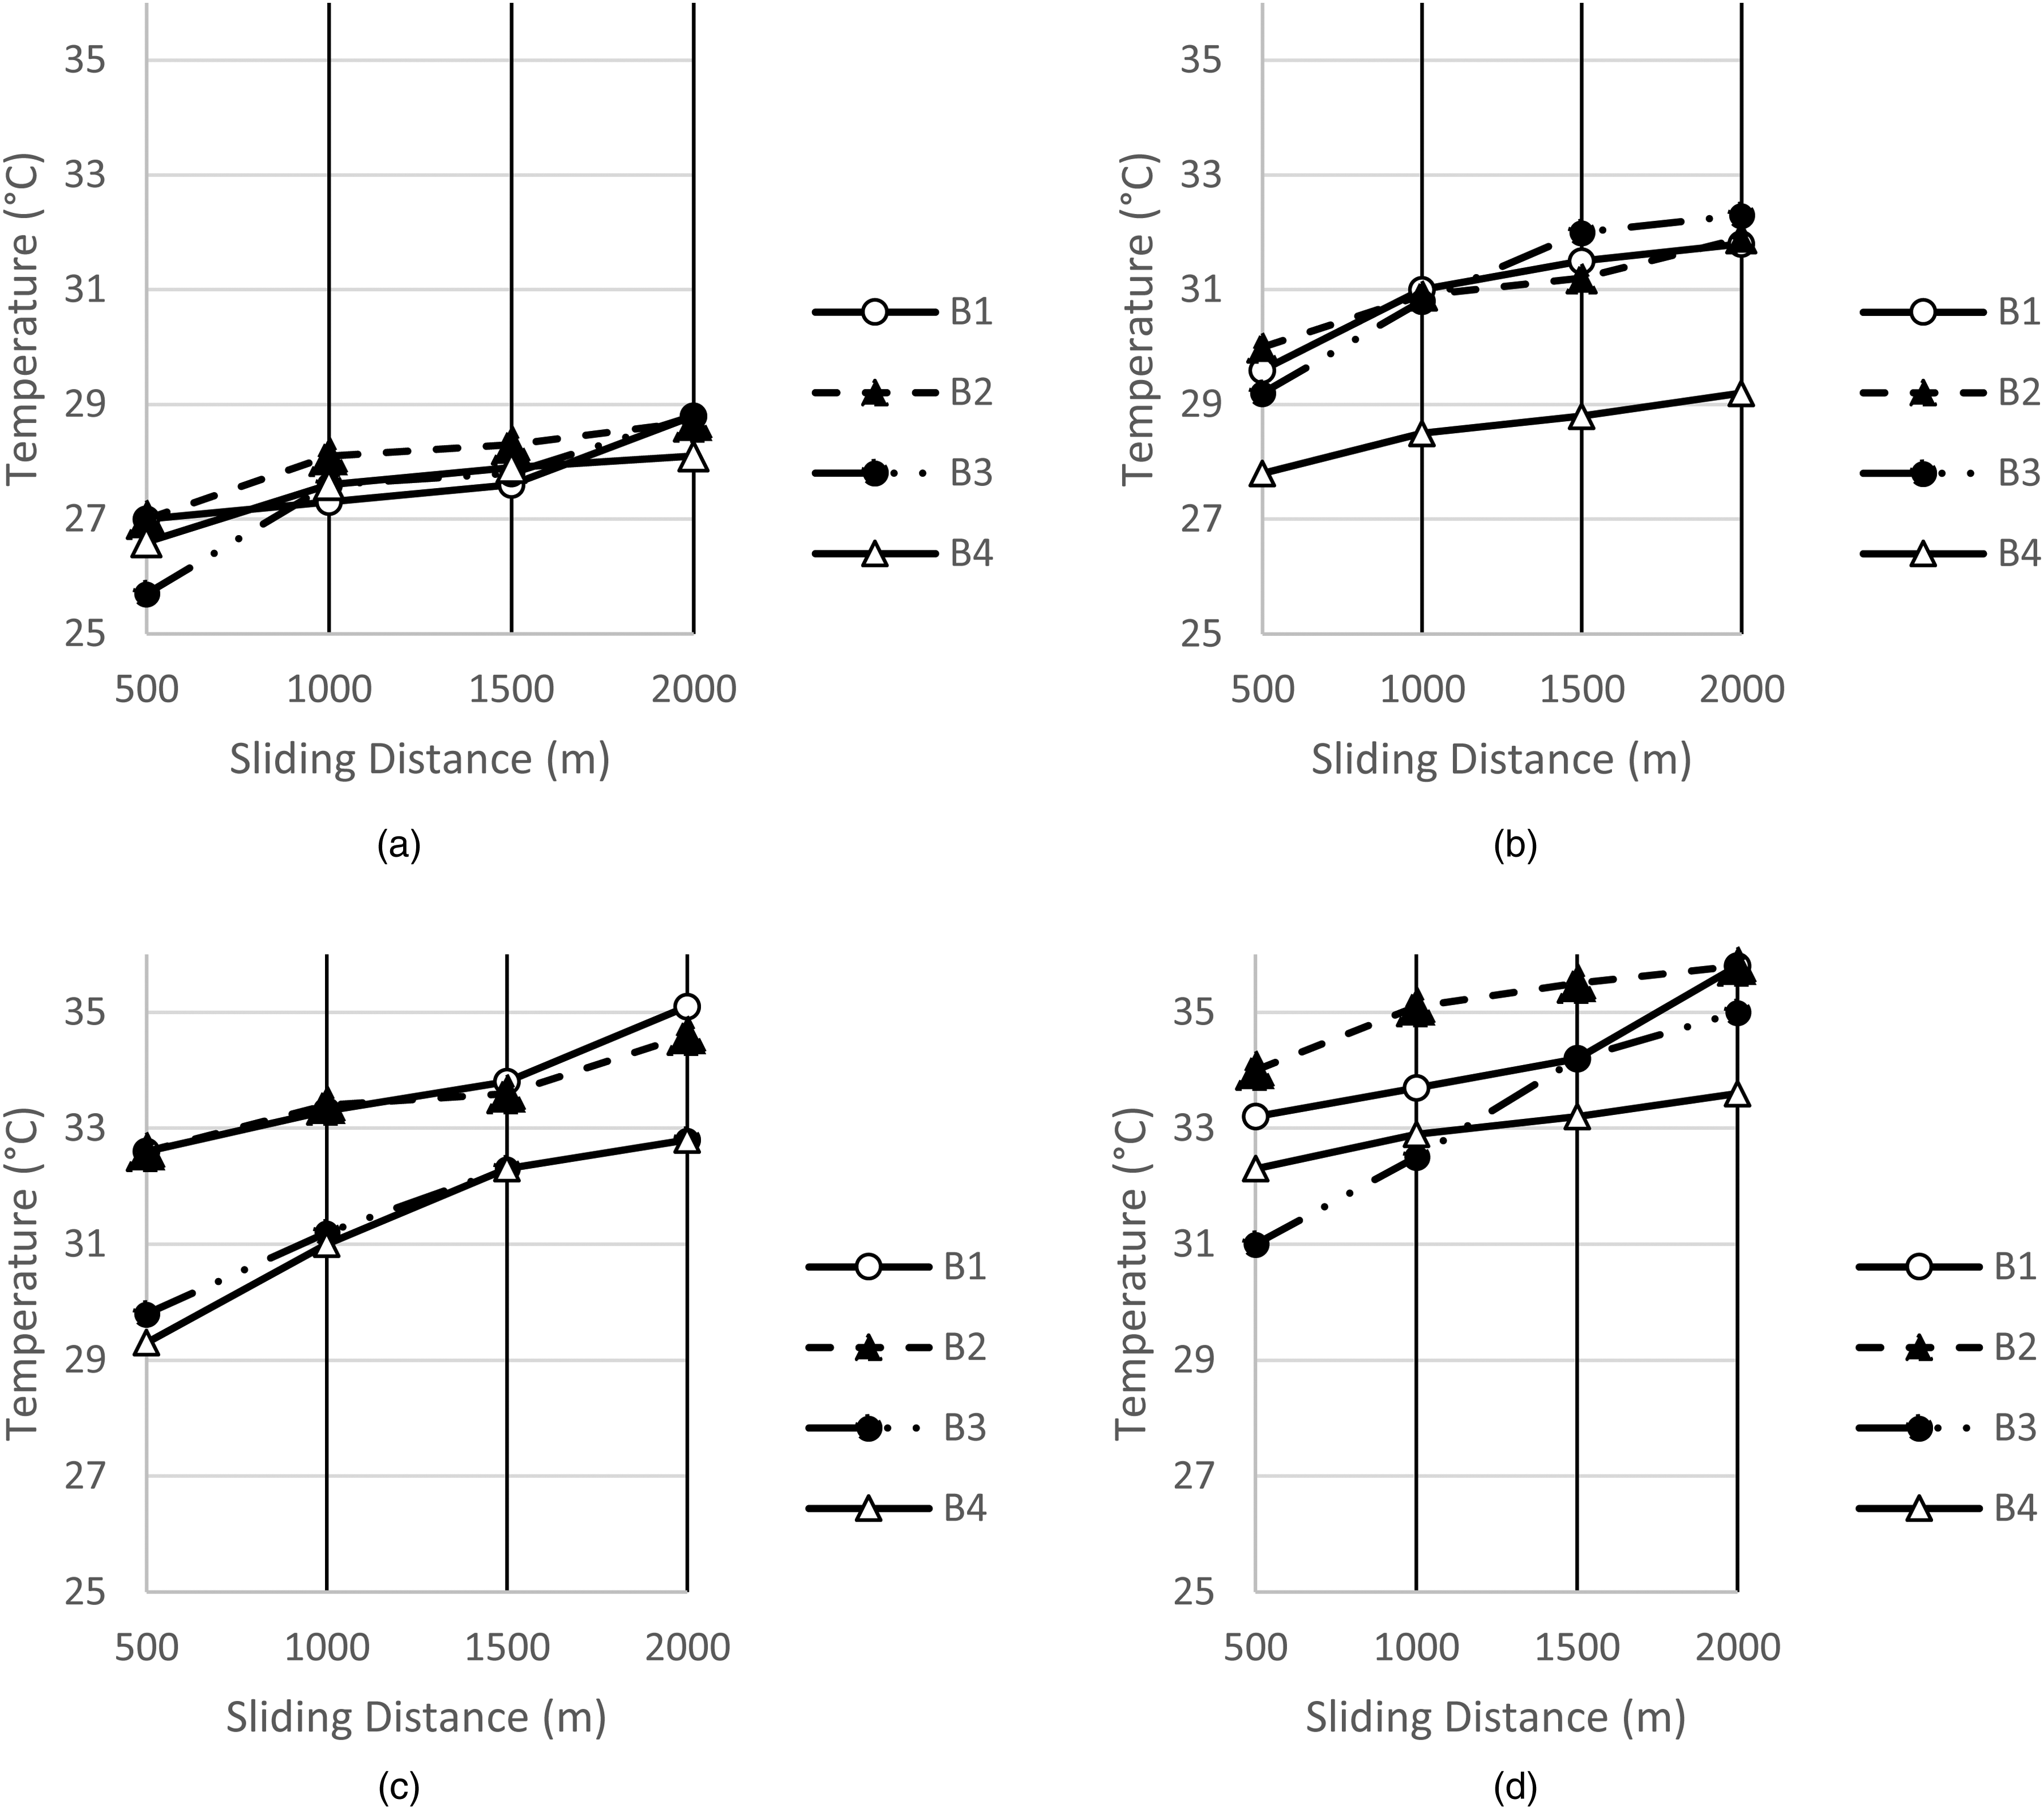
The graph of the variation of the temperature values along the sliding distance was drawn with the data obtained from the test results. Test temperature measurements were obtained with an infrared thermometer in the test measuring area shown in Figure 2(b). Bearing temperature values were calculated with using thermal conduction formula which is shown below. As the shaft rotates and the bearing is in a fixed position, the top of the bearing is in contact with the shaft. Since the peak of the bearing is the part where wear and temperature changes occur, temperature measurements were made from this contact point of the shaft and the bearing. In order to monitor the temperature change, temperature data for 500-1000-1500-2000 m sliding distances are used.
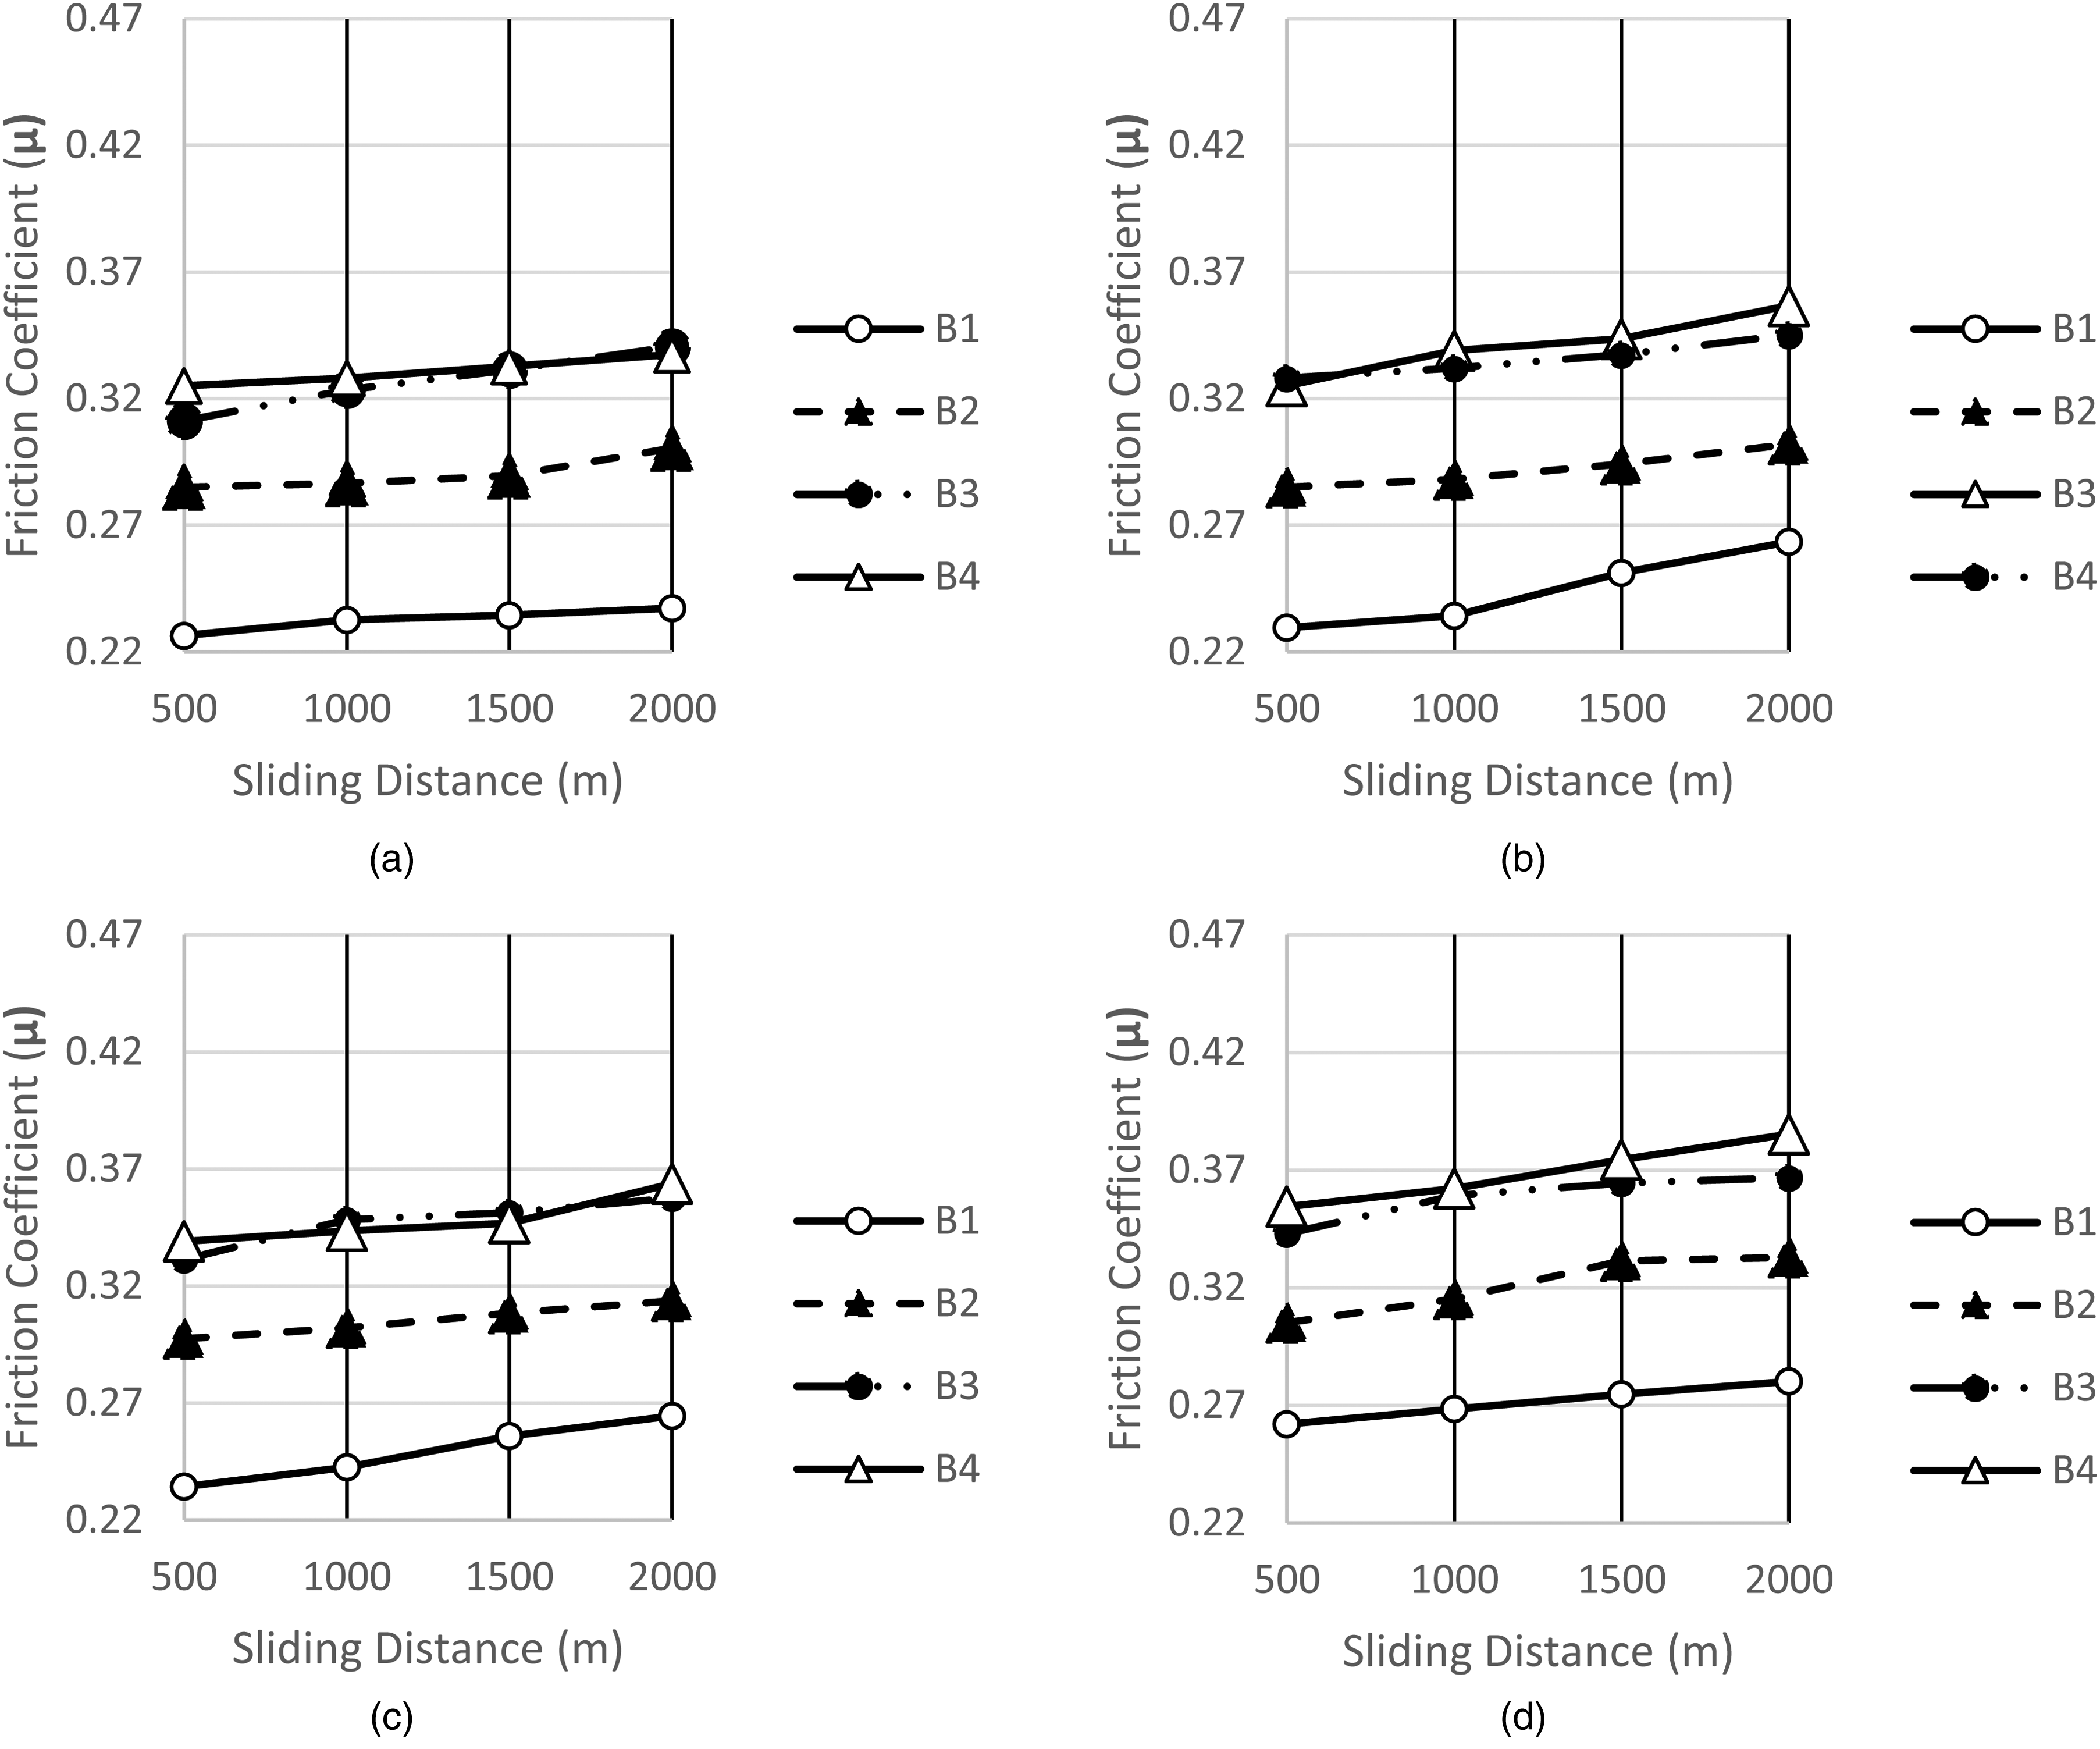
Figure 5 shows the test specimens’ temperature-sliding distance graph under 10 N load and 0.5-1.0-1.5-2.0 m/s sliding speed. Figure 6 shows the graph at the same sliding speeds under 20 N load.
Temperature–sliding distance graphs of test samples under 10 N load.
Temperature–sliding distance graphs of test samples under 20 N load; (a) 0.5 m/s sliding speed, (b) 1 m/s sliding speed, (c) 1.5 m/s sliding speed and (d) 2 m/s sliding speed.
When the graphs were examined, a significant relationship could not be established between temperature rise and bearing material or surface quality. When the temperature increases, the values were found close to each other. However, in general, it has been observed that the temperature also increases as the sliding speed and sliding distances increase for each sample.
Surface roughness
The post-experimental surface roughness values (Ra2) for all bearings are given in Table 3.
Post-experimental surface roughness values for all bearings.
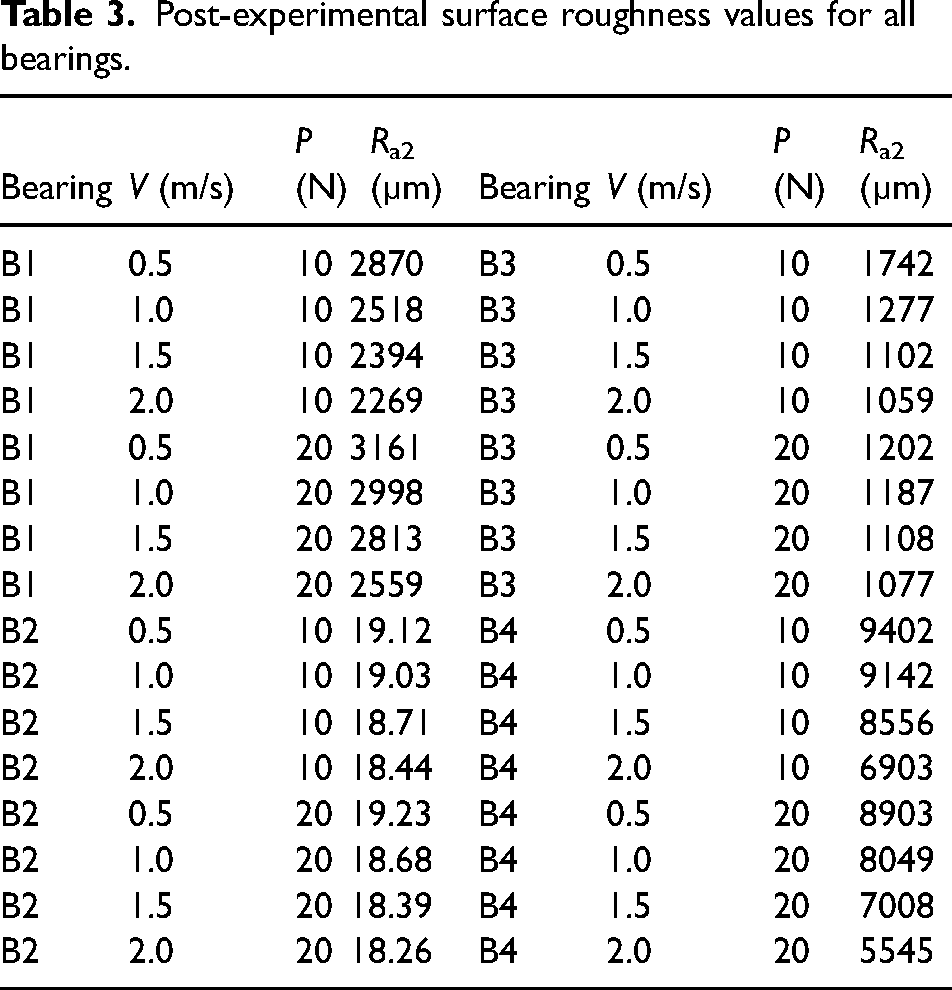
According to the measurements, for the bearings made of UHMWPE (B1 and B2) material, the change in the surface roughness values after the test was found to be related to both the sliding speed and the amount of load. The results show that the surface roughness values decrease as the sliding speed increases, and the surface roughness values decrease as the load increases. When the measurements made for the bearings made of POM material (B3 and B4) are examined, it is seen that the surface roughness values decrease as the sliding speed increases, and the surface roughness values decrease for B3 and increase for B4 as the load increases.
Wear and weight loss
Weight measurements of all bearing samples were made before and after the experiment according to the relevant scenarios. After calculating the post-experimental weight losses for the bearings made of UHMWPE material, the specific wear rate (W) was obtained with the help of the following formula. The sliding distance (L) is used as the path.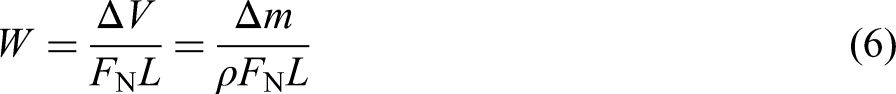
Weight and specific wear rate values for UHMWPE bearings.
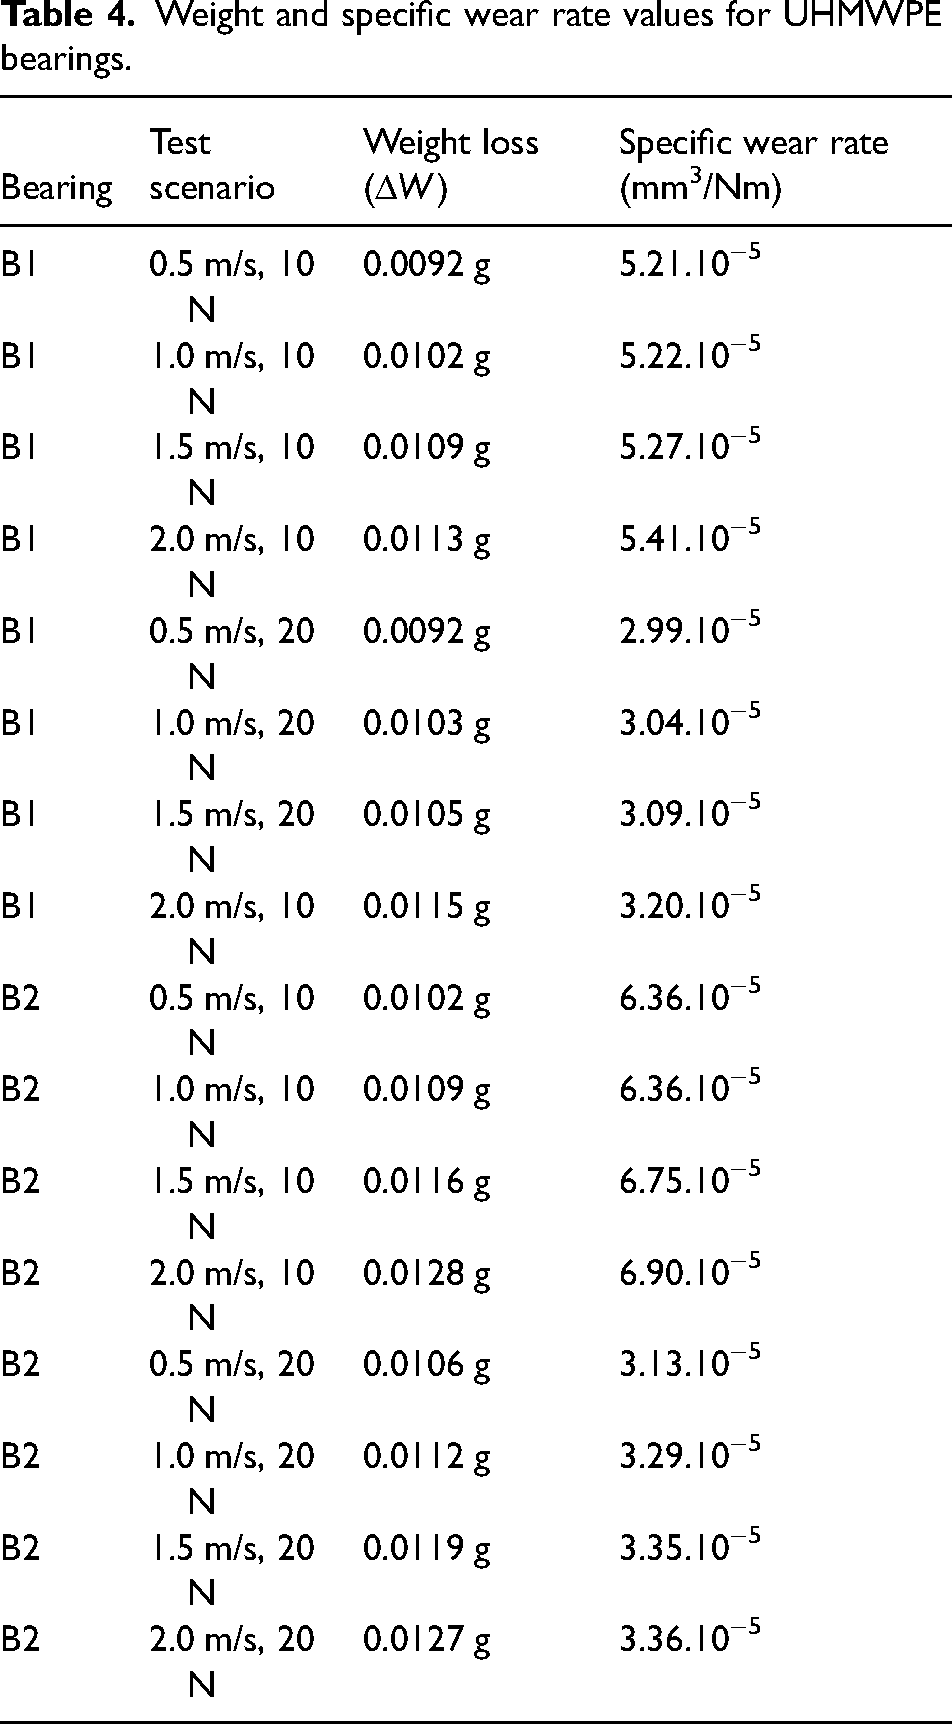
As can be seen, in bearings made of UHMWPE materials (B1 - B2), the increase in sliding speed and load increased the weight loss values. It is seen that the specific wear rate increases as the sliding speed increases and decreases when the load increases.
The weight and specific wear rate values for the bearings produced from POM material (B3 - B4) are presented in Table 5.
Weight and specific wear rate values for POM bearings.
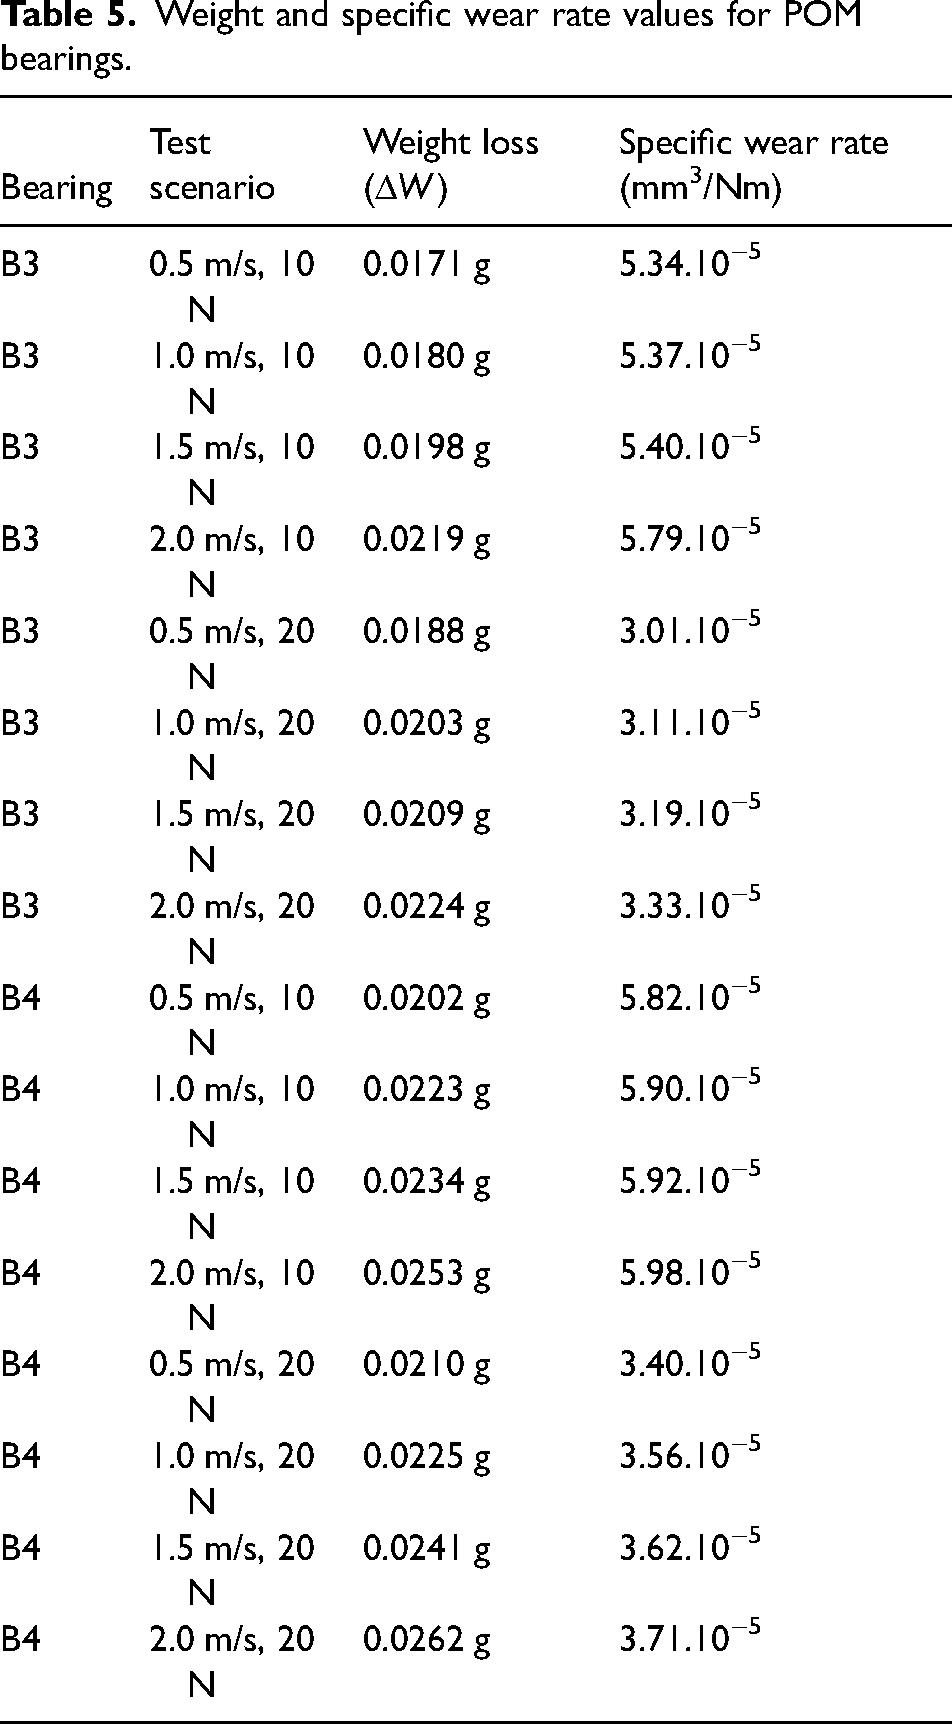
In line with the results, the increase in sliding speed and load increased the weight loss values in the bearings made of POM material (B3 - B4). When the specific wear rates are examined, it is seen that the increase in the sliding speed increases this value, while the increase in the load causes a decrease in this value.
The test results showed no noticeable weight loss in both materials. Weight loss was found to be less than 1% for all bearings. Weight loss in POM bearings (B3 - B4) was higher than in UHMWPE (B1 - B2).
SEM images
In this section, SEM images of radial journal-bearing specimens produced from UHMWPE and POM material in two different surface qualities in the range of N7–N8 and N10–N11 and tested under two different loads (10–20 N) and four different speeds (0.5-1.0-1.5-2.0 m/s) were taken. Figure 7 shows SEM images of the bearings tested at 2 m/s sliding speed and 20 N load. The direction of the wear marks is indicated by the arrows. Abrasive wear marks are shown in ellipsoidal shape and adhesive wear marks are shown in circular shape.
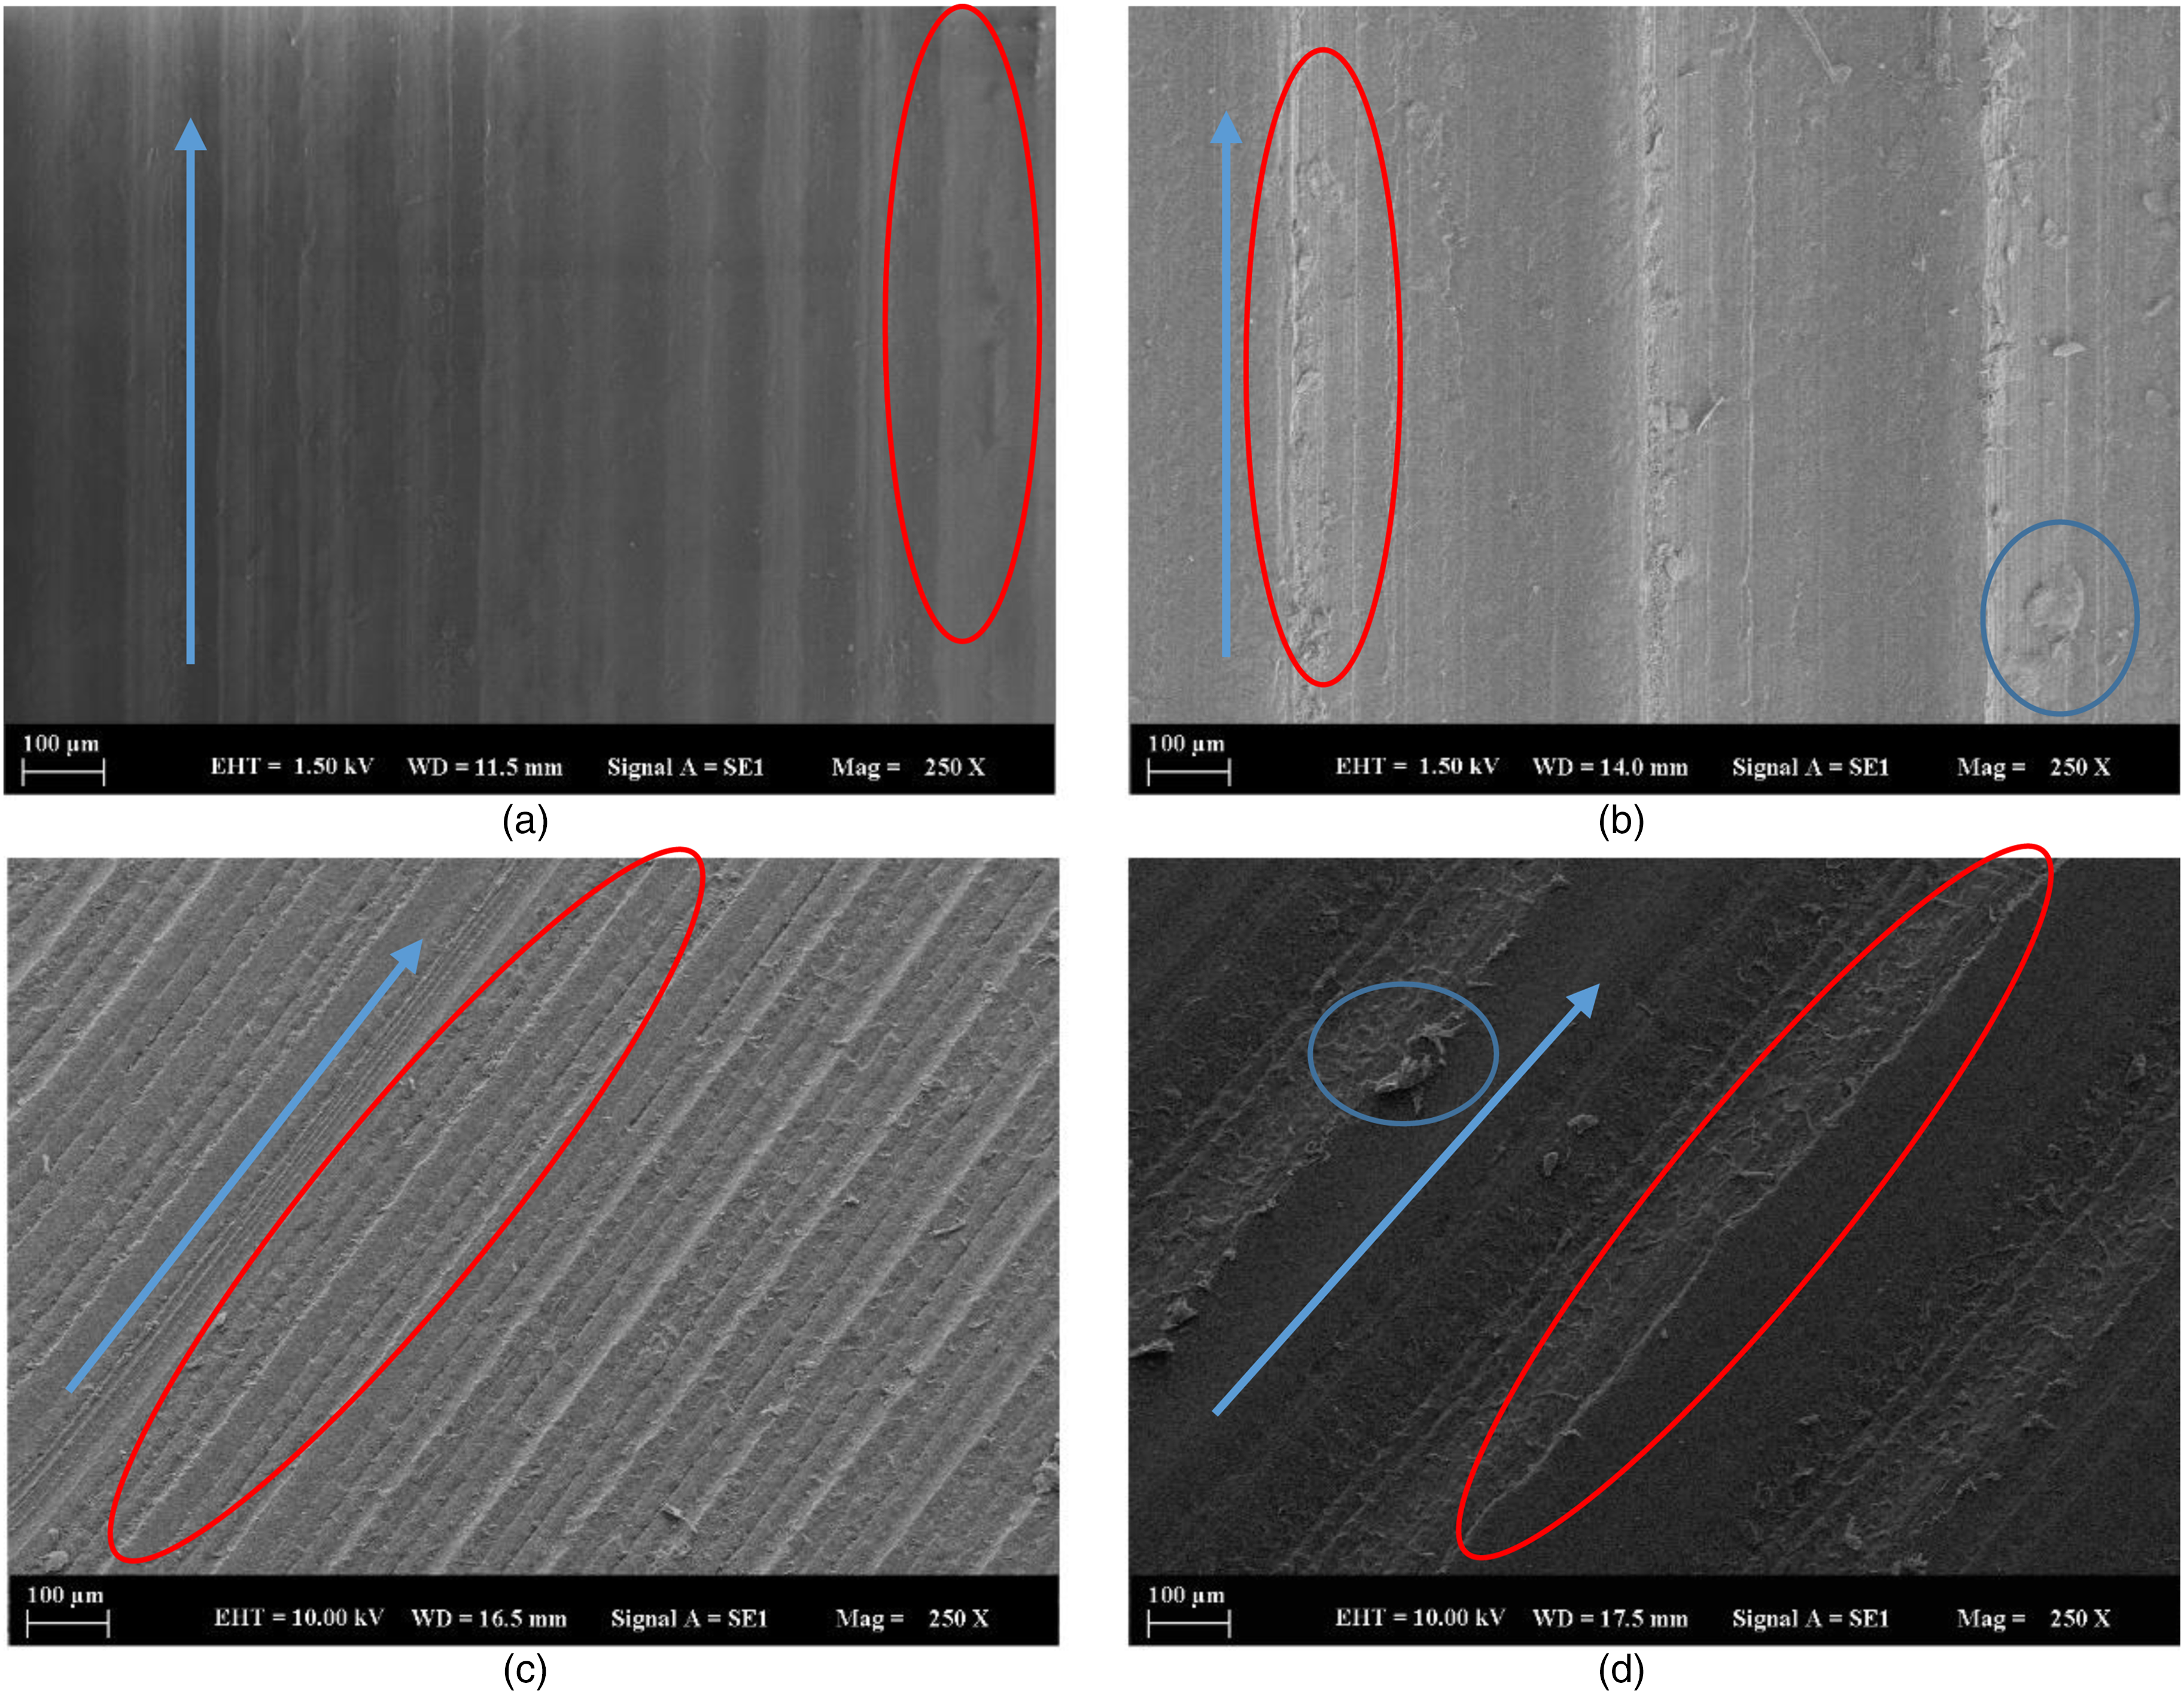
SEM images of test samples; (a) B1, (b) B2, (c) B3 and (d) B4.
In Figure 7(a), adhesive wear marks are seen when the SEM images of the bearings (B1) produced from UHMWPE with surface quality N7–N8 are examined. Low surface roughness and the hardness of the UHMWPE material caused these marks to be less. When the SEM images of the bearings (B2) produced from UHMWPE material in N10–N11 surface quality, given in Figure 7(b), are examined, both abrasive and adhesive wear are observed. When these two images are compared, it can be said that the wear marks increase as the sliding speed increases in bearings made of UHMWPE material. Similarly, it was observed that these traces increased with the increase in load. In terms of surface roughness, it is understood that the wear of the bearings with N10–N11 surface quality (B2) is more visible compared to the bearings with N7–N8 surface quality (B1).
In Figure 7(c), when the SEM images of the bearings (B3) produced from POM in N7–N8 surface quality are examined, adhesive wear marks are seen. The fact that these marks are less can be explained by the high wear resistance of POM and the low surface roughness. When the SEM images of the bearings (B4) produced from POM in N10–N11 surface quality were examined, it was observed that both adhesive and abrasive wear occurred. These values became more evident with increasing speed. When the samples produced from POM material were examined, it was observed that the wear marks increased as the sliding speed increased.
When the SEM images given in Figure 7 and the specific wear rate values given in Tables 4 and 5 are examined together, it is seen that minor wear occurs in UHMWPE bearings processed with N7–N8 surface quality (B1). Again, when SEM images and specific wear values were analysed, it was seen that the most wear occurred in POM bearings processed with N10–N11 surface quality (B4). Significant adhesive wear marks were observed in these samples. Increasing speed values led to an increase in wear marks. Increasing the load also increased these wear marks. The tribology analysis in these two papers38,39 explain the effect of testing load on the tribological damage features. These two papers perfectly support this conclusion.
Conclusions
In this article, radial journal bearings produced from UHMWPE material and POM material in two different surface qualities in the range of N7–N8 and N10–N11 were tested under different load and different speed scenarios, and their tribological performances and the relationship of this performance with material and surface roughness were investigated. For this purpose, first of all, bearing samples were designed and manufactured. Tribological and physical properties of all samples were measured before the tests, and then tests were carried out according to the determined scenarios. Two different loads (10–20 N) and four different speeds (0.5-1.0-1.5-2.0 m/s), and different sliding distances (500-1000-1500-2000 m) were used in the scenarios, and each case was tested three times. In the tests, coefficient of friction (µ), temperature (T), weight loss (ΔW), and specific wear amount (W) values of all bearings were obtained, surface roughness values (Ra) was measured, and SEM images were taken. Based on these data, the results can be evaluated as follows:
It has been observed that the friction coefficients increase when the sliding speed of the bearings from both materials in both surface qualities increases. However, these friction coefficient values decreased with increasing load. The increase in surface pressure decreased the friction coefficient values. For both materials, it has been determined that the friction coefficients of the bearing materials with surface quality N7–N8 (B1 and B3) are lower than the bearing materials with N10–N11 surface quality (B2 and B4). It was observed that the friction coefficients between the bearing samples made of POM material (B3 and B4) were approximately 20–25% higher than the bearing samples made of UHMWPE material (B1 and B2). It was observed that the temperature values of the samples from both materials in both surface qualities increased as the sliding speed increased. This temperature increase was greater with increasing load. It was determined that the temperature values were close to each other for both surface quality samples. It was observed that a meaningful comparison could not be made between different materials and different surface qualities in terms of temperature. It was observed that the surface roughness values of all samples decreased as the sliding speed increased. It was observed that these surface roughness values decreased more with increasing load, except for the UHMWPE samples with N7–N8 surface quality (B1). The surface roughness of the bearing samples made of POM material (B3 and B4) was less than that found to be less than that of UHMWPE material (B1 and B2). These values are approximately 50% less for samples with N7–N8 surface quality (B1 and B3) and approximately 60% less for samples with N10–N11 surface quality (B2 and B4). All bearings post-test weight loss values increased as the sliding speed increased. It was observed that these values increased with increasing load. The weight loss in the samples with N10–N11 surface quality (B2 and B4) is greater compared to the samples with N7–N8 surface quality (B1 and B3). The weight loss values in the bearing samples made of POM material (B3 and B4) were calculated 10–25% more than those of UHMWPE material (B1 and B2). While the specific wear rate was 3–7% higher in N10–N11 surface quality samples (B2 and B4), this value decreased by 35–40% with the load increase. When the SEM images were examined, less wear was observed in the UHMWPE samples with surface quality N7–N8 (B1) compared to the other samples. Adhesive wear marks are generally observed in all images. It was observed that the most wear occurred in POM bearings with N10–N11 surface quality (B4). Increasing speed values led to an increase in wear marks. Increasing the load also increased these wear marks.
As a result, it has been observed that surface quality significantly affects the friction coefficient and wear resistance in the tests performed. For both UHMWPE and POM materials, the friction coefficient and wear resistance of the samples with N7–N8 surface quality (B1 and B3) were better. There was no significant effect of surface quality on temperature changes. The best friction coefficient and wear resistance results were obtained with UHMWPE bearings with N7–N8 surface quality (B1). Therefore, the results obtained from this study showed that UHMWPE bearings are an excellent alternative to the POM bearings widely used in the industry. For this reason, it can be said that it is appropriate to decide by making technical and economic evaluations for these two materials in radial journal bearing applications that do not have the possibility of lubrication and, therefore, will operate in dry conditions.
Footnotes
List of symbols and notations
Acknowledgements
Experiments were carried out in the radial plain bearing test setup in Yıldız Technical University Construction Department laboratory. The experience and facilities of Yıldız Technical University's central laboratory were also used to measure and analyse the mattress samples before and after the experiments.
Declaration of Conflicting Interests
The authors declared no potential conflicts of interest with respect to the research, authorship, and/or publication of this article.
Funding
The authors received no financial support for the research, authorship, and/or publication of this article.