
Abstract
The effect of the metal coating on the machinability of cubic silicon carbide was investigated by molecular dynamics simulation. The effect of the metal coating on the surface of the workpiece was explained using cutting force, friction coefficient, surface morphology, stress, temperature, and tool wear. The results show that the influence of metal type on cutting force, surface morphology, and stress is insignificant for coating thickness. However, the model with Cu coating has a tool suspension key number of 400 at the maximum cutting distance. The number of tool suspension keys for the Ni-Ti coating model is around 1700, indicating that the type of coating has a significant impact on tool wear. Furthermore, the results also show that in the three metals of Cu, Ni and Ni -Ti, Cu coating has the greatest impact on improving cutting performance. Among them, the average cutting force of 1.5 nm Cu coating is about 33.3% lower than that of without coating, and the tool wear is about 26.7% lower. These results demonstrate the effects of the metal coating on the workpiece surface from a theoretical point of view.
Introduction
Thanks to the continuous development of advanced processing technologies, now there is a better understanding of the processing of difficult-to-machine materials. Silicon carbide (SiC) is a third-generation semiconductor material. It has been used in 5G communications, new energy vehicles, transistor applications, and optoelectronics due to its high thermal conductivity, wider band gap, high saturated electron speed, high mechanical strength, and other useful mechanical properties.1,2 However, some of its characteristics in turn restrict its processing. The surface quality of the macro machined workpiece can no longer meet the required increasing levels of surface integrity and machining accuracy. The machined surface accuracy requirement has changed to nanometer levels.3–5 One of the nano-machining methods is nano-cutting. Nano-surface finish, submicron geometric accuracy, and complex machining shapes can be obtained through nano-cutting.6–9 For instance, Oluwajobi, AO et al. 10 studied the influence of cutting velocity and cutting depth on surface roughness and found that the surface roughness can reach 0.1–0.3 nm by the nano-cutting method. Because of its difficult machining characteristics and high cost, the existing experimental methods are no longer the best processing methods for brittle and hard materials like SiC. Moreover, the deformation of SiC cannot be dynamically observed in macro experiments. Therefore, it is necessary to explore new processing methods.
In recent decades, there has been a situation in which the three processing methods theory, experiment, and simulation are independently used. Among them, molecular dynamics simulation (MDS) is widely for difficult-to-process materials like SiC, silicon, and metallic glass.11–15 MDS is a new interdisciplinary subject, which includes physics, chemistry, material science, and mechanics. The research objects are microstructures including phase transition, dislocation, grain boundary, and micro crack. In contrast to theoretical and experimental processing methods, MDS can directly observe the phase transition, dislocation generation and annihilation, and changes in the plastic transition zone during processing at the atomic level. Furthermore, MDS is more economical than experiments, and there is no constraint on the simulation time. Therefore, the MDS method is more favored by researchers than the other two methods. Zhou et al. 16 used MDS to investigate the influence of internal cracks in monocrystalline silicon on nanoindentation. Dai et al.17–19 used the MDS method to study stress change, the evolution of dislocation, and the variation of cutting force during the polishing of monocrystalline silicon. MDS can simulate a wide range of processes, and the materials that can be simulated are virtually limitless.
Many researchers use MDS to explain various machining mechanisms, which provides a strong theoretical basis for promoting advanced manufacturing. The deformation process at the nanoscale can be dynamically observed by MDS. Although nano-machining can reduce the machined surface roughness to the nanoscale, previous studies have found that defects like dislocations, cracks, and stress concentration may still occur in the workpiece during the processing.6–8,20 Therefore, several methods have been proposed to improve the surface quality of the workpiece. Surface modification is the process of changing the original structure of the atoms on the workpiece, destroying the atomic structure of the workpiece before processing, causing the long-range ordered atoms on the workpiece's surface to become long-range disordered atoms, or adding a defending film to the workpiece to improve the processing surface of the workpiece. The feasibility of this surface modification method has been proved by many scholars.21,22 In addition to the method of surface modification by destroying the atomic structure of the workpiece surface, the effect of surface modification can also be achieved by adding a coating on the workpiece surface. Choong et al. 23 achieved surface modification by covering the surface of monocrystalline silicon with an amorphous copper layer. It has been proposed that covering the workpiece surface with water film can greatly improve the processing quality.24,25 It is also well known that covering the tool surface with coating materials can improve tool wear and tool life.26–28 However, the research regarding coating materials on the workpiece surface is very limited because the hardness of SiC is much higher than that of most metals. Therefore, it is very necessary to coat the SiC surface with various metals and explore the impact of metal coatings on SiC nano-cutting.
To improve the cutting performance of hard and brittle material SiC and obtain an ideal machining surface, this paper proposes a new nano-cutting technology by adding a metal coating on the substrate material. The mechanical properties of SiC itself restrict its machining, and traditional cutting methods are no longer able to produce ideal workpiece surfaces. The current research has established SiC models covering different metal coatings using MD simulation software LAMMPS. Study whether the difference in thermal conductivity of metals can improve tool wear and whether the interface effect between metals and SiC substrate can reduce the hardness and subsurface damage of workpieces, achieving the goal of improving the surface quality of machining.
Research methods
Selection of metallic coatings
The MD simulation method was used to study the surface improvement effect of different metal coatings on the workpiece, the improvement of cutting efficiency by coatings, and the improvement of internal stress concentration in the workpiece. The hardness of SiC is very high, and most metals are softer than SiC. Metal coatings have been shown to improve the quality of machined surfaces and reduce cutting forces. 29 In addition, coating the tool surface can protect the tool and reduce tool wear. 26 However, the selection of metal coating materials is mainly based on the following two factors: (a) Too complex metals have high computing and modeling software requirements, which will make the model more unstable. (b) The selected metal should have a proper potential function to describe the interaction between the SiC substrate and metal coating material. Based on these considerations, Cu metal, Ni metal, and Ni-Ti alloy, which are common and have well-defined potential functions, are selected as the metal coatings.
Model establishment
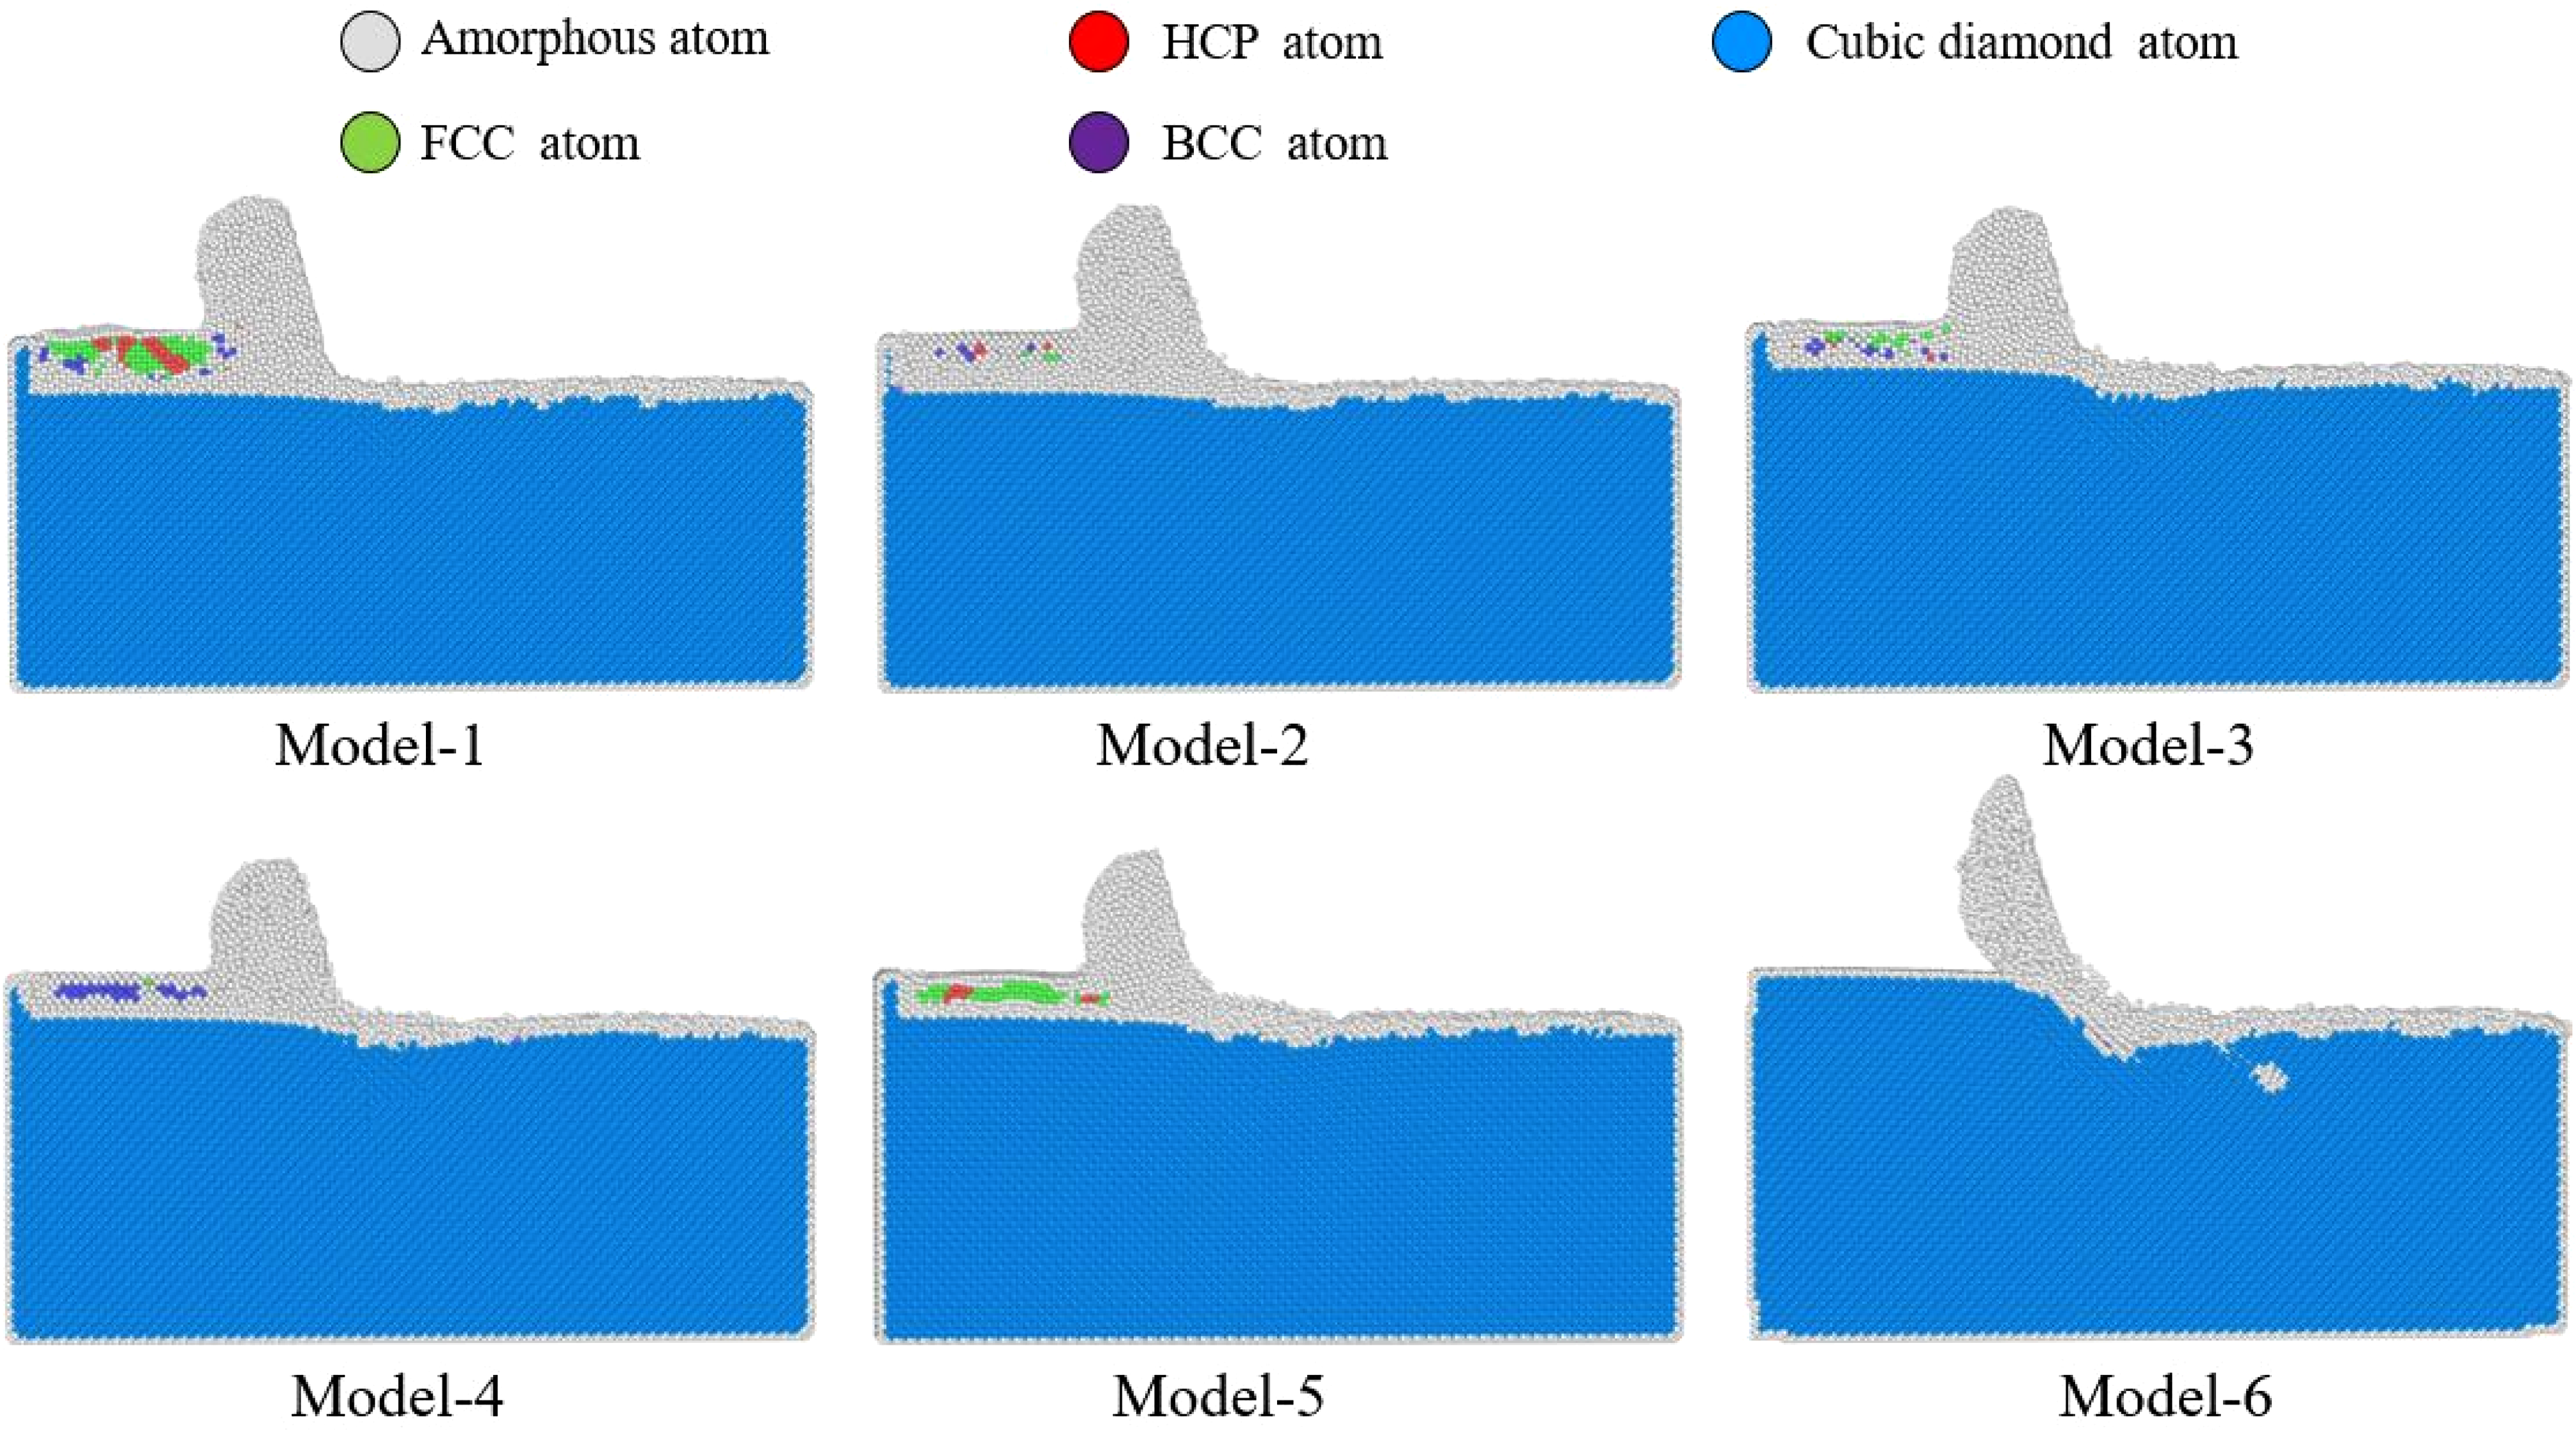
Figure 1 shows 3D MD models, which are based on the Cu, Ni, and Ni-Ti alloys coatings. Model 6 is the uncoated model, which is used to compare the metal-coated and uncoated processing mechanisms. Meanwhile, in order to investigate the influence of metal coating thickness, comparative models with thicknesses of 1 nm and 1.5 nm were established for Cu coating and Ni-Ti coating, respectively. Due to the simulation software defects, it is found that when the coating thickness is less than twice the lattice constant value, the metal coating is no longer the original lattice structure after relaxation, and all coating atoms become disordered structures. The minimum thickness of the metal coating is kept at 1 nm to ensure the correct lattice structure of the metal coating and to bring the simulation results closer to reality. The maximum coating thickness is taken equal to 1.5 nm to control the variables and standardize the cutting thickness.
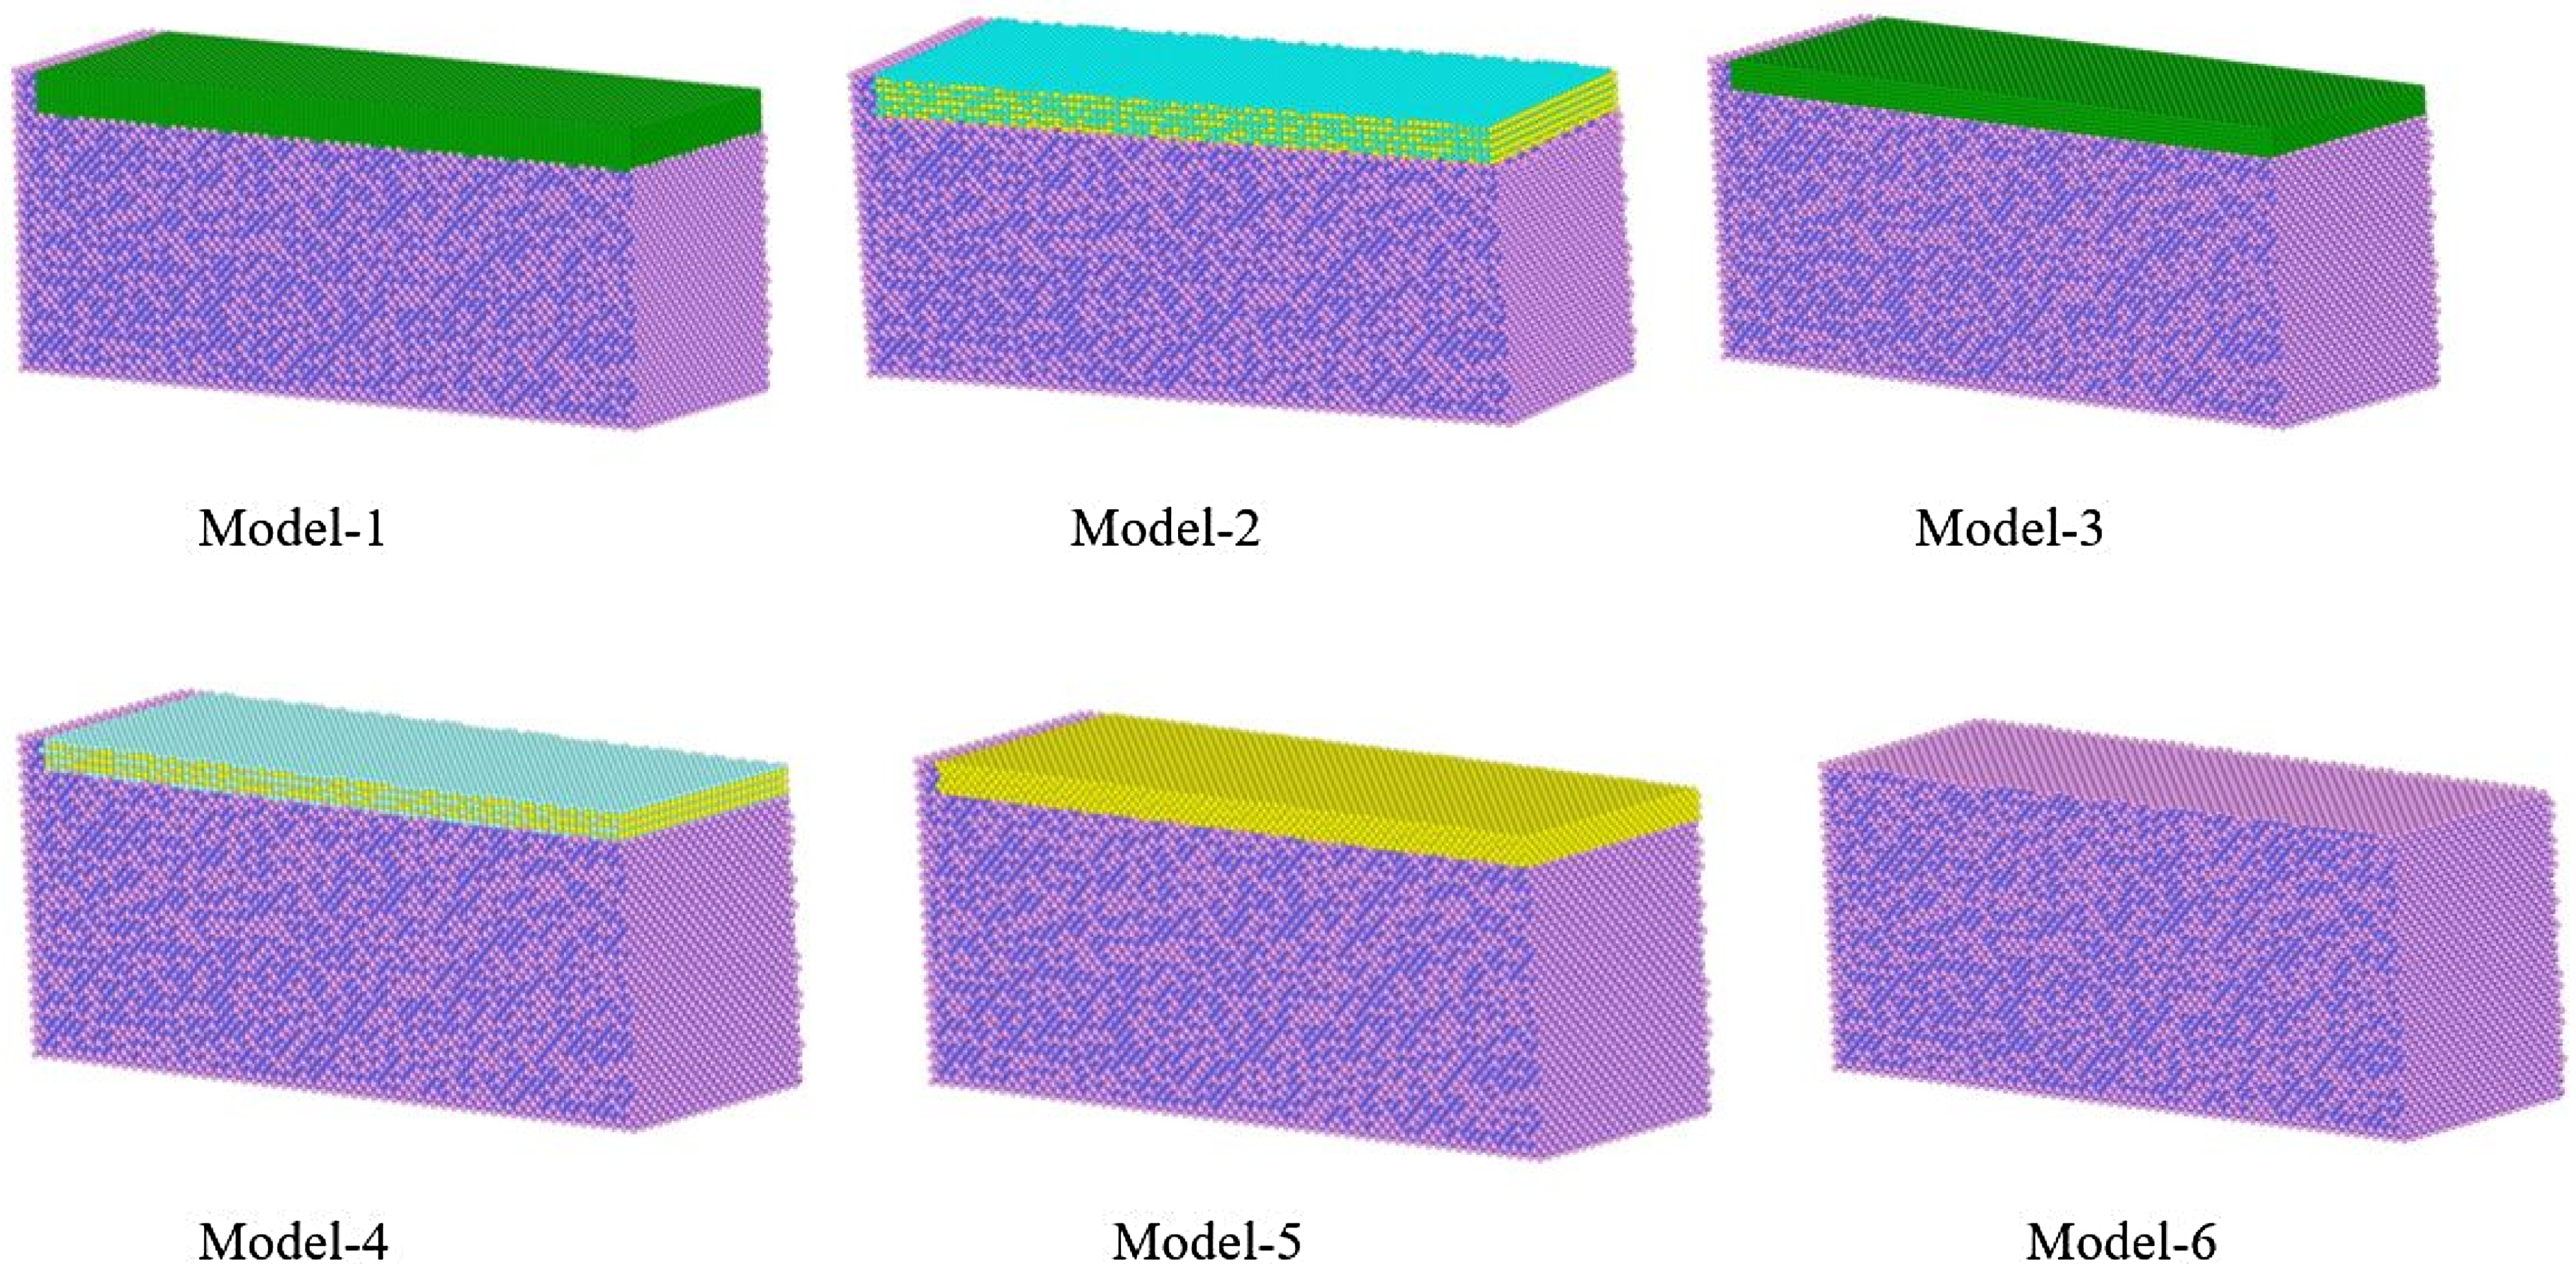
All 3D models. Model-1.1.5 nm Cu coating; Model-2.1.5 nm Ni-Ti alloy coating; Model-3.1 nm Cu coating; Model-4.1 nm Ni-Ti alloy coating; Model-5.1 nm Ni coating; Model-6. No coating.
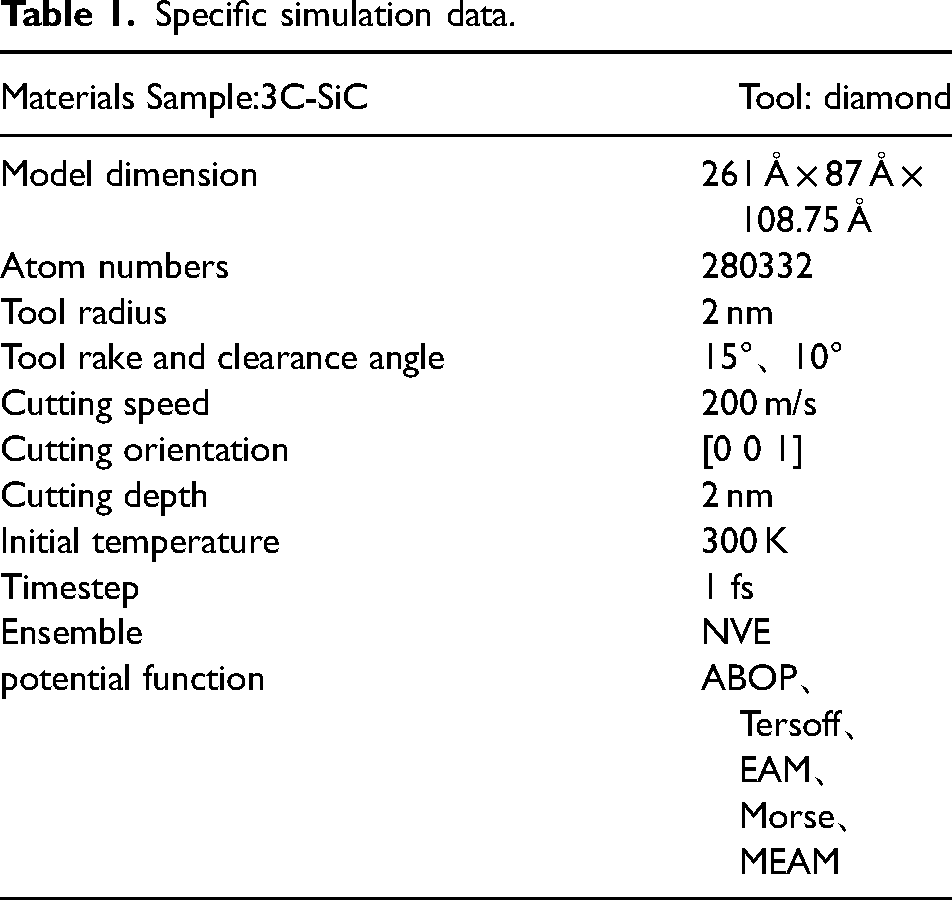
Figure 2 shows the specific MD nano-cutting model. The model consists of three parts: SiC workpiece, metal coating, and diamond tool. The coating is on the (001) side of SiC. Due to the limitation of computing power, the number of atoms used in MD modeling is generally set between 100 thousand and 1 million.30,31 However, the too-small model and the size effect lead to inaccurate results. 32 Therefore, the y direction of the model is set as a periodic boundary to reduce the size effect. As it is previously reported,33,34 the outermost layer of the workpiece is set as a fixed layer to prevent the workpiece from moving. The thermostatic layer is used to dissipate excess heat, while the atoms in Newton's layer and coating follow Newton's second law. The temperature, energy, and interaction force of atoms in the Newtonian layer are the outputs of this model. The performance of nano-cutting can be more accurately described by tool wear. Therefore, in contrast to earlier studies, the tool is set as a variable.30,35 Table 1 lists the main simulation parameters.
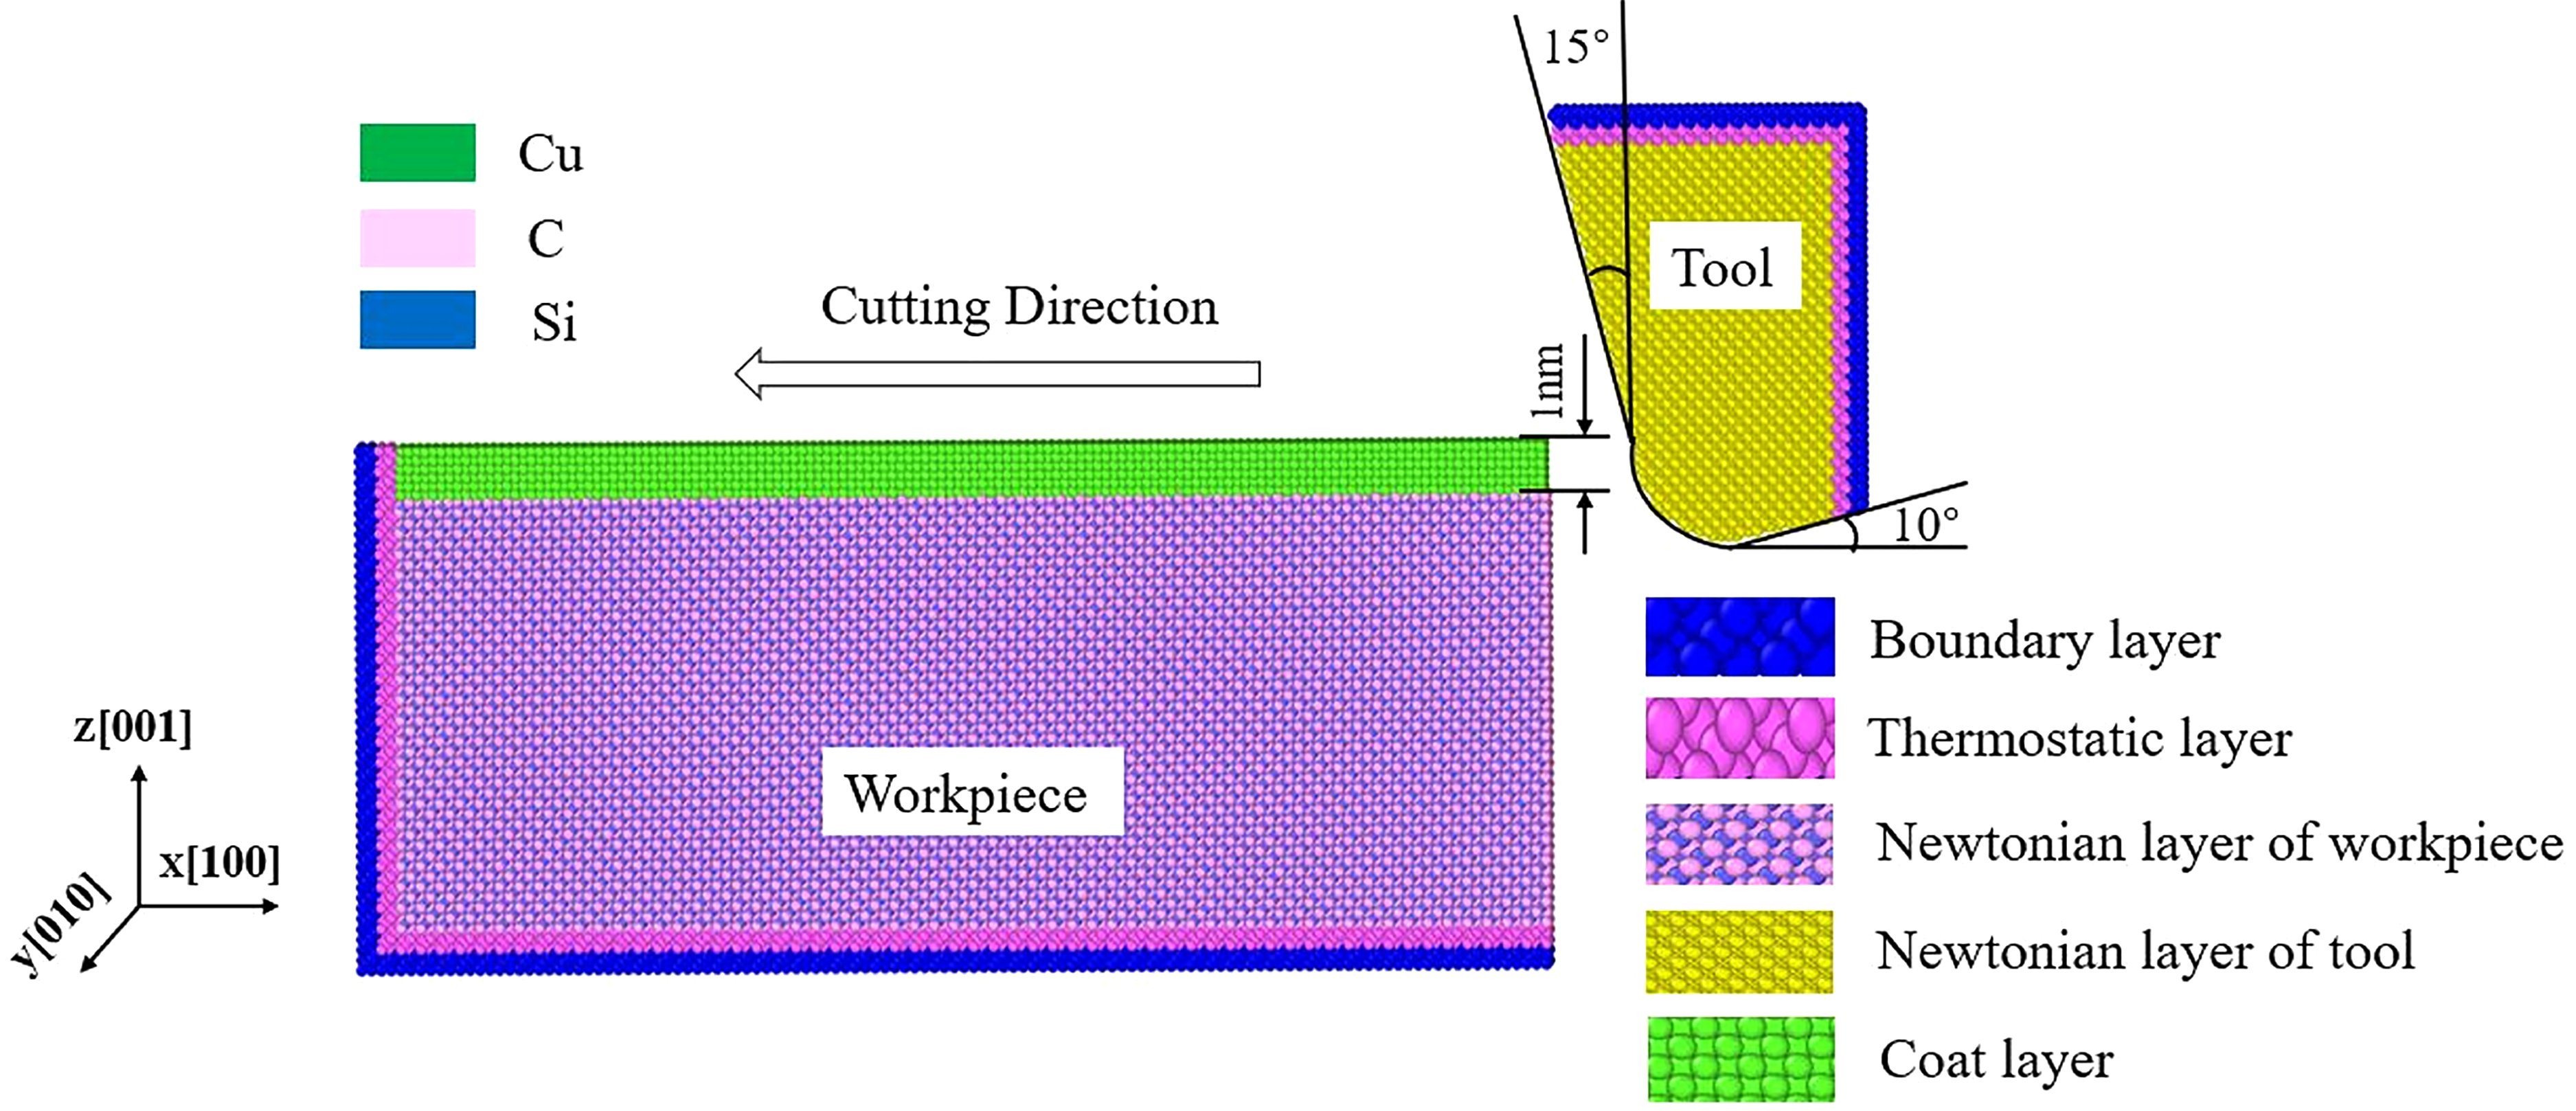
3D model.
Specific simulation data.
Selection of potential function
A suitable potential function determines the reliability of the simulation results. 36 However, it is difficult to develop a potential function. Due to the limited potential functions that have been developed, we chose common coatings to ensure that there is an appropriate potential function between the SiC workpiece and coating atoms to characterize the interaction between atoms. The improved ABOP potential function of Erhart and Albe is used to define the interaction between atoms in the SiC workpiece. 11 The potential function used between the coated Cu atom and the Si atom in the workpiece in Model 1 and Model 3 is the Tersoff potential function improved by Zhang et al. 37 The two-body potential Morse is used between all tool atoms, workpiece atoms, and coating atoms, and its parameters are taken from literature.23,38,39 For Ni-Ti alloy coating and Ni coating, the MEAM potential function is used between metal atoms. 40 Finally, all models and data output are implemented using MDS software LAMMPS. 41 The visualization software OVITO 42 is used for data processing.
Results and discussion
Cutting force and friction coefficient
Whether it is macro-cutting or micro-cutting, the cutting force and friction coefficient are important factors to measure the machinability of the workpiece. 43 In the nano-cutting model, the variation of cutting force can be used to characterize the inter-atomic structure transformation in the machining progression, and it can be used to predict the tool wear instantly. 44 Figure 3 shows the variation of tangential force and normal force as a function of cutting distance and average cutting force predicted by various models. Tangential force and normal force both increase after 2 nm because the tool has not made contact with the workpiece before 2 nm. The change in cutting force is related to the fracture and recombination of inter-atomic bonds in the workpiece and the number of interacting atoms between the tool and the workpiece. Therefore, a linear increase of tangential force and normal force of the model with or without metal coating from 2 nm to 5 nm cutting distance indicates that the number of atoms in contact between the tool and the workpiece gradually increases. As shown in Figure 3(a), when the cutting distance is greater than 5 nm, the tangential force no longer increases but instead fluctuates around a fixed value. Clearly, the tangential force of the model without metal coating is much higher than that of the model with a metal coating. The tangential force of the model without coating is 33.3% greater than that of the model with 1.5 nm Cu coating. Furthermore, the thickness of the metal coating has a very clear influence on the cutting force but the influence of the metal coating material on the cutting force is not obvious. It can be seen in Figure 3(a) and 3(b) that the cutting force of 1.5 nm Cu coating and Ni-Ti alloy coating is significantly lower than that of 1 nm metal coating. The cutting force of Cu, Ni-Ti alloy, and Ni metal coating with the same thickness is not significantly different, but it is still lower than the model without coating.
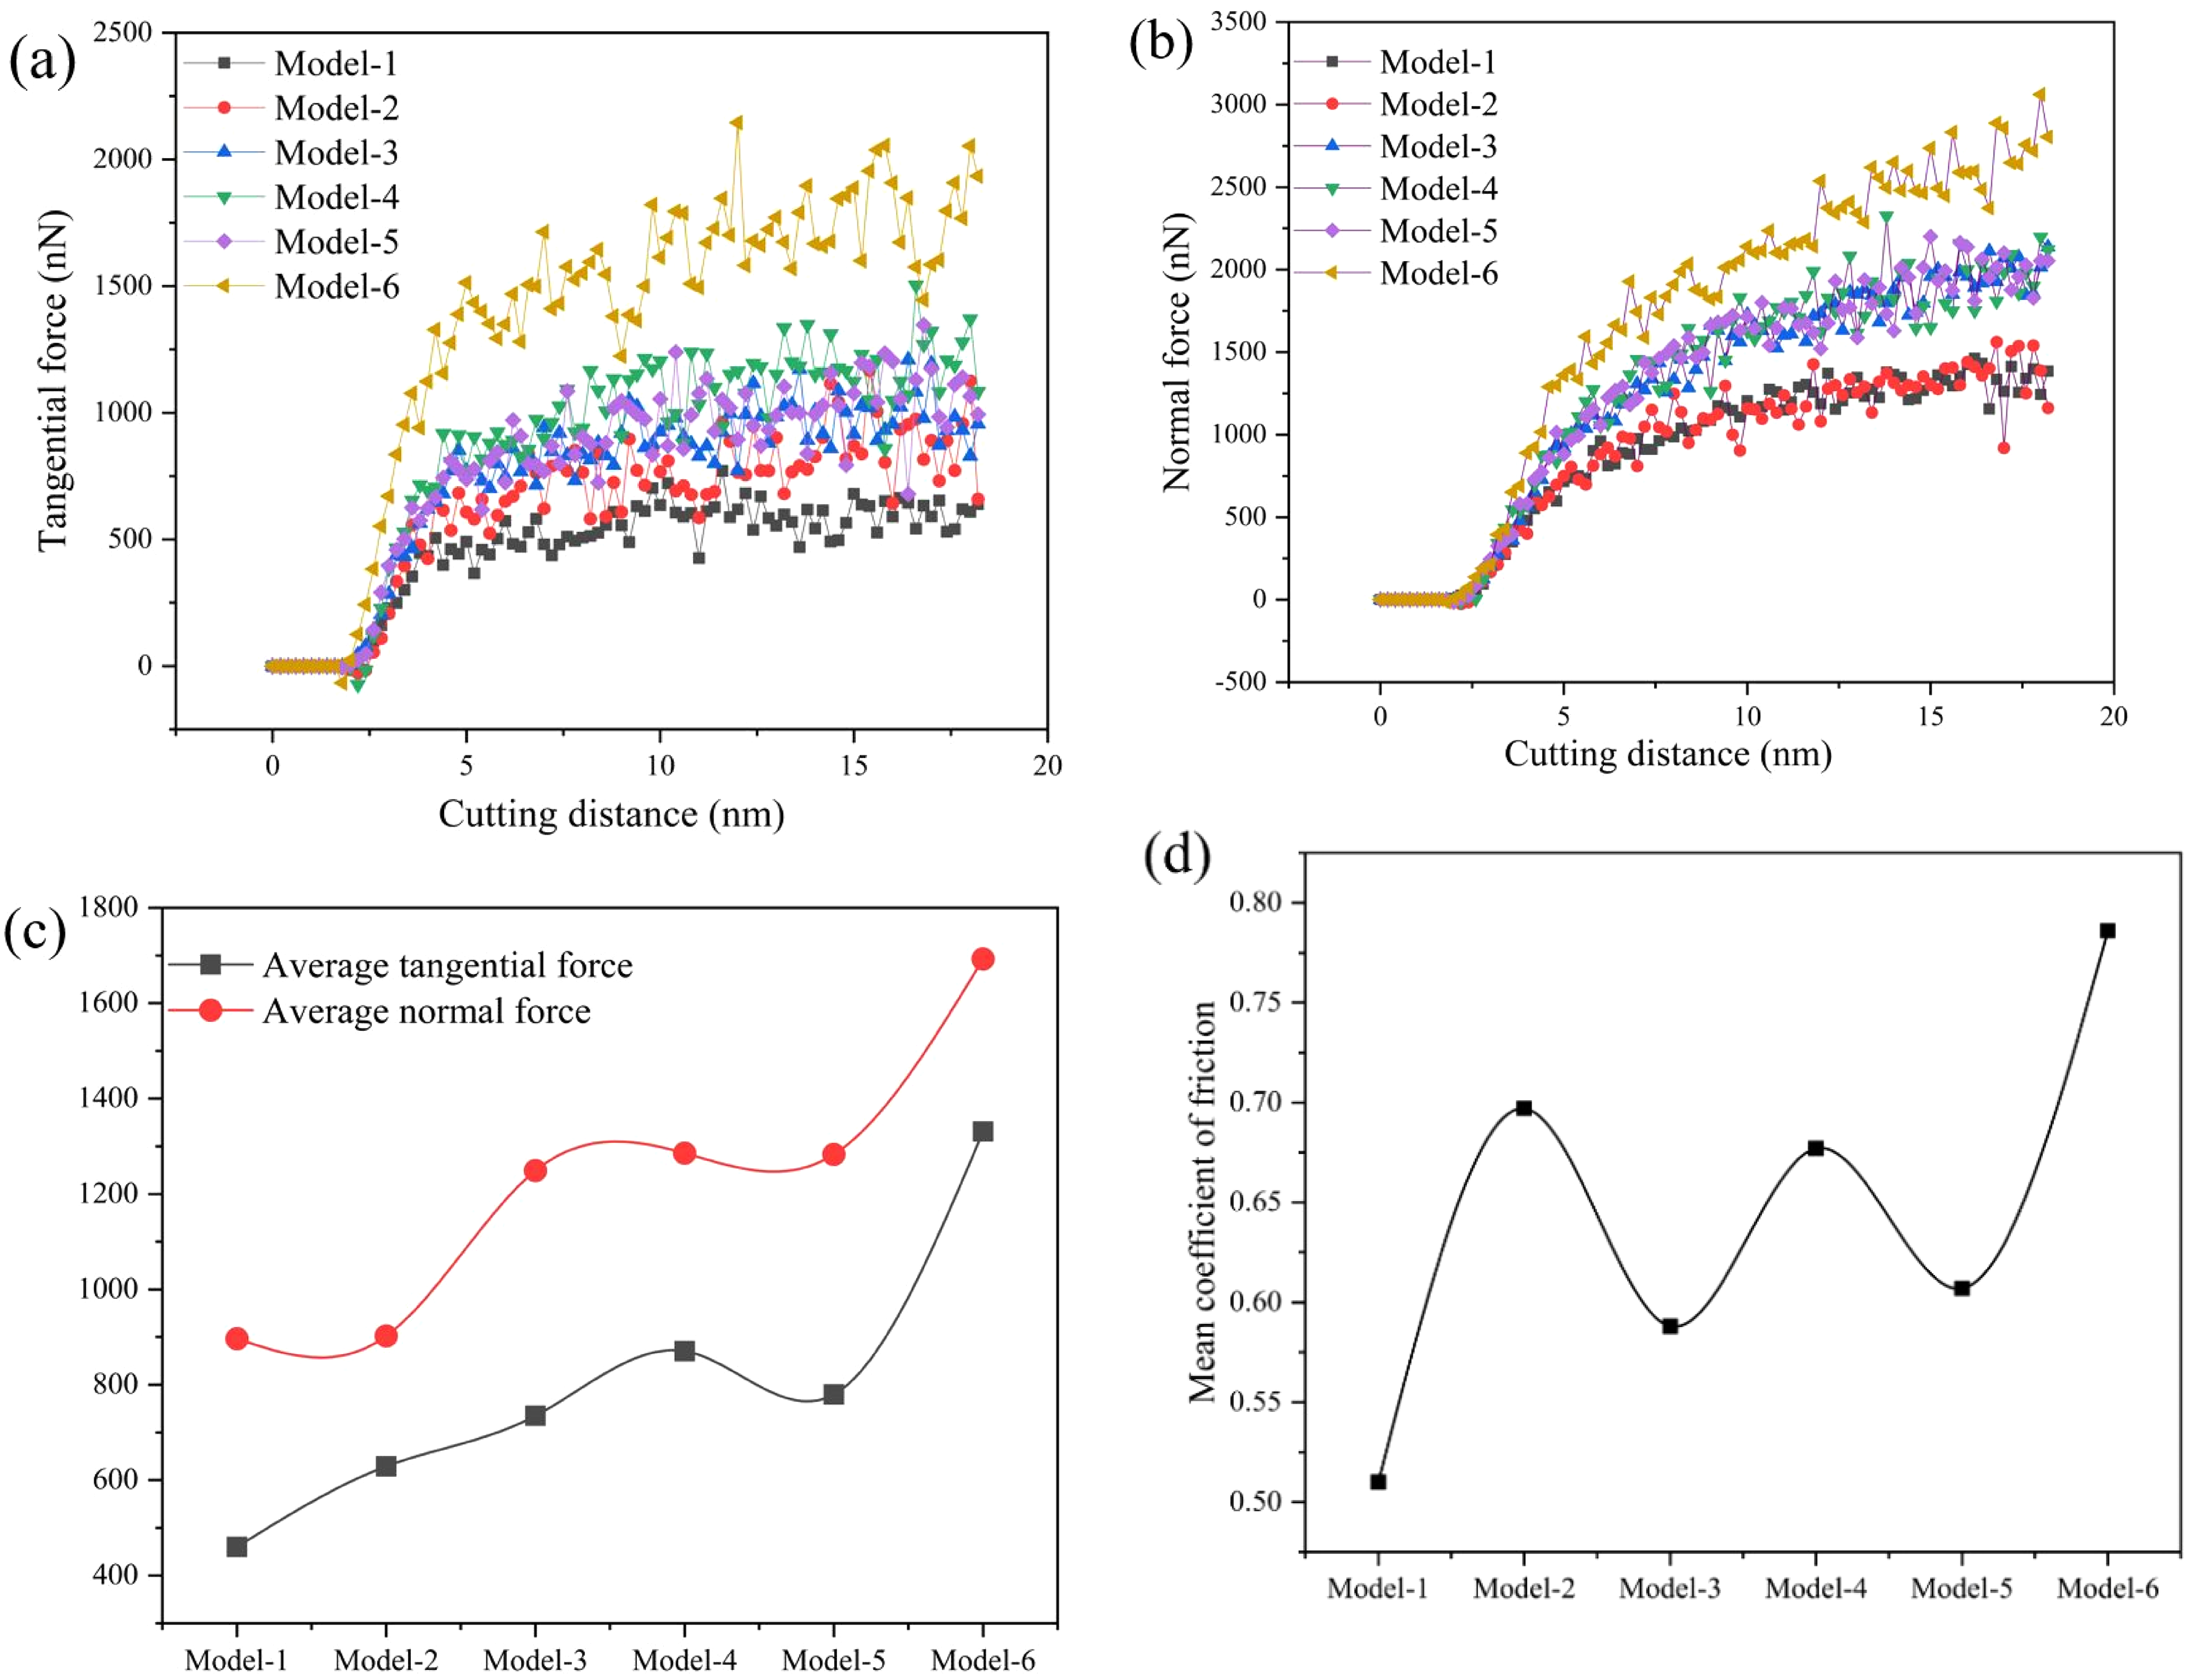
Change of cutting force and friction coefficient. (a) Change trend of tangential force; (b) change trend of normal force; (c) change trend of average tangential force and average normal force; (d) average friction coefficient.
It has been reported that the violent fluctuation of cutting force is related to the phase transformation and the formation of a brittle-plastic transition zone in the workpiece. 32 In addition, the fluctuation of cutting force can also predict tool wear. As the fluctuation range of cutting force increases, tool wear, tool edge passivation, and the friction effect with the workpiece become more severe. The impact of cutting forces on tool wear will be discussed in Section 3.4. As can be seen in Figure 3(a) and 3(b), the fluctuation of cutting force in the uncoated model is much higher than that in the model with metal coating, which indicates that the metal coating can improve the brittle-plastic deformation in the workpiece and achieve the purpose of plastic removal. Figure 3(c) shows the variation of the average tangential force and the mean normal force in various models. The normal force is always greater than the tangential force; these findings are consistent with previous studies.3,34 However, regardless of whether the coating thickness is 1.5 nm or 1 nm, the cutting force of Cu coating is always lower than that of other metal coatings when the coating thickness is the same. The tangential force of the uncoated model is about 800 nN greater than that of the 1.5 nm Cu coating and 450 nN greater than that of the 1 nm Cu coating. The tangential force of 1.5 nm and 1 nm Cu coatings decreased by about 61.5% and 34.6%, respectively, while the normal force decreased by about 47% and 35.3%, respectively. Similarly, the normal force of the uncoated model is 850 nN higher than that of the 1.5 nm Cu coating and 600 nN higher than that of the 1 nm Cu coating. Figure 3(d) shows the variation of the average friction coefficient in various models. An interesting phenomenon is that the average friction coefficient does not vary linearly with the coating thickness, and the average friction coefficient of 1.5 nm Ni-Ti alloy coating is slightly lower than that of the uncoated model. It shows that there is some uncertainty in the Ni-Ti alloy and there is a relationship between the friction coefficient and coating material. However, for Cu coating, the average friction coefficient decreases with the increase of coating thickness. For 1.5 nm Cu coating, the average friction coefficient is 0.51, while the average friction coefficient of the workpiece without coating is 0.78. The average friction coefficient is reduced by 65% compared to the uncoated model. Based on the above analysis of cutting force and average friction coefficient, it can be concluded that the metal coating improves the nano-cutting of SiC.
Structural damage and material deformation
Cutting force, hydrostatic stress and von Mises stress, and surface quality all have a significant impact on the shape of the chips removed from the workpiece surface. Therefore, the cutting mode of the workpiece can be understood from the chip shape. Zigzag chips indicate that the workpiece has a shear deformation, while continuous chips indicate that the workpiece has extrusion deformation. Generally speaking, the extrusion deformation of the workpiece represents the full plastic distortion of the workpiece. It is well understood that SiC is an anisotropic material, whereas most metals are isotropic. Therefore, as can be seen in Figure 4, the chips stacked in front of all model tools with metal coating are in a symmetrical state. Figure 4(f) is a top view of the chips accumulation on the surface of the workpiece without metal coating, and the anisotropy of the base material is very obvious. The flow direction of the chip is mostly towards the [111] direction, which is the sliding direction of the base atoms. 8 Meanwhile, the metal coating can better protect the machined surfaces on both sides of the tool because the metal coating is more flexible and can flow plastically with the tool edge during the cutting process. As shown in black circle 2 in Figure 4(f), without the protection of metal coating, fine flying chips will appear on both sides of the tool, which is very unfavorable to the machined surface. In general, the metal coating can prevent the formation of burrs on both sides of the groove of the workpiece.
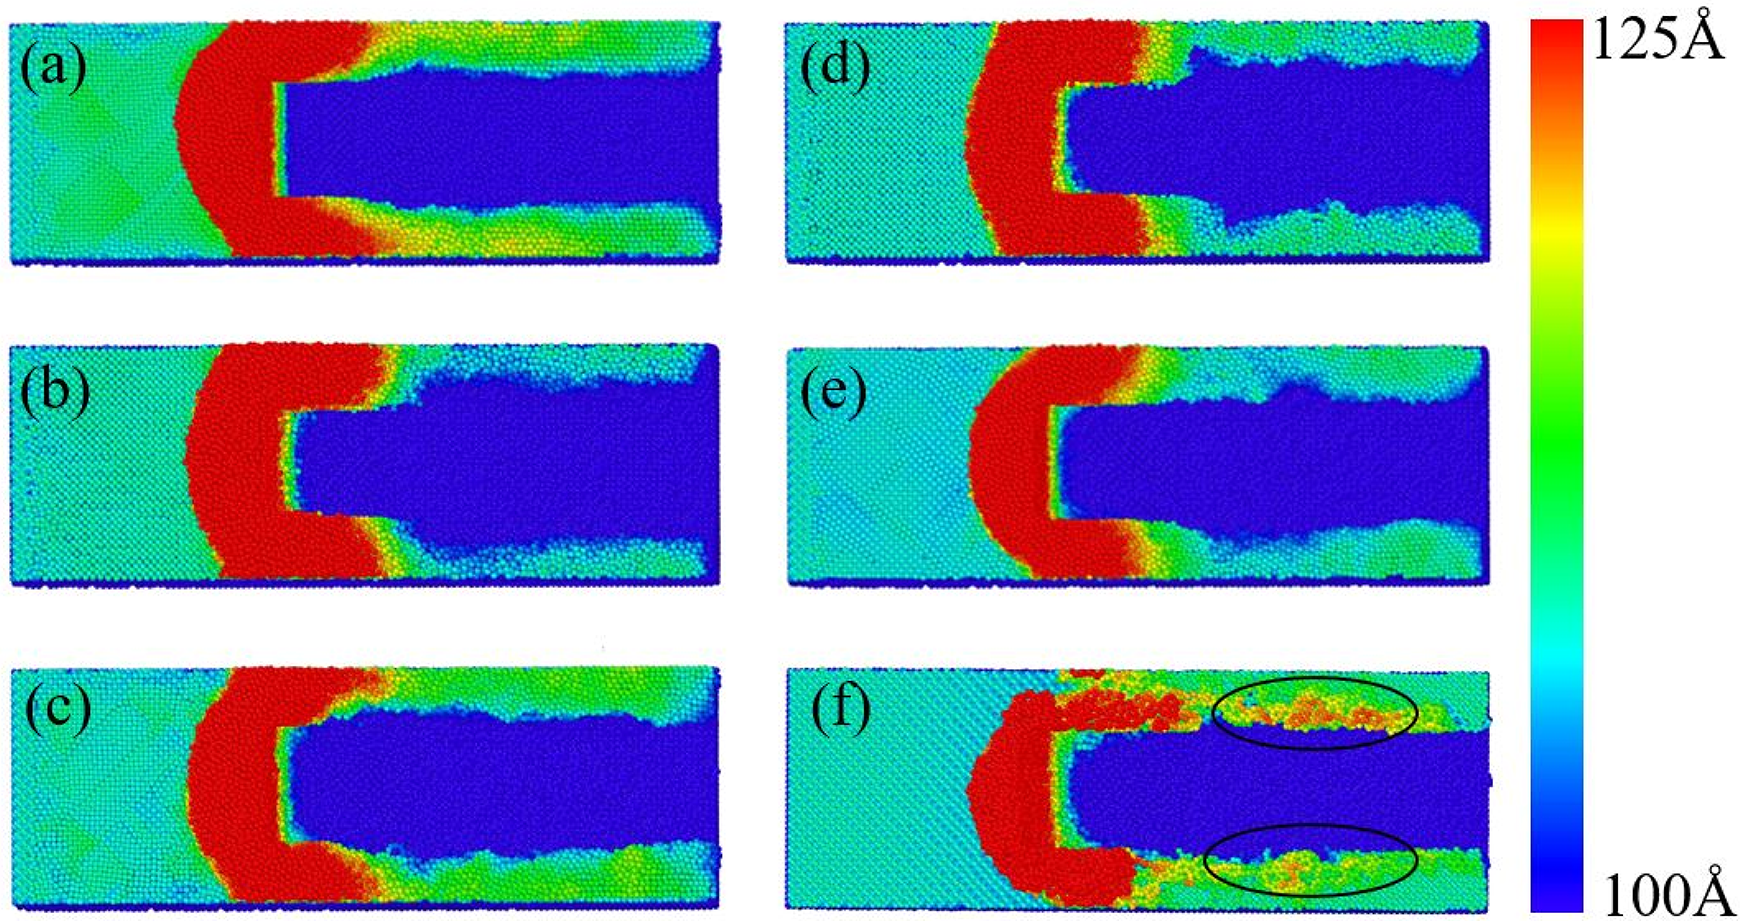
Surface deformation. (a) 1.5 nm Cu coating; (b) 1.5 nm Ni-Ti coating; (c) 1 nm Cu coating; (d) 1 nm Ni-Ti coating; (e) 1 nm Ni coating; (f) no coating.
The phase transition of the atoms in the substrate is related to the formation of dislocations. During the cutting process, the atoms in the substrate undergo plastic deformation by transforming from a cubic diamond structure to an amorphous structure. The structural deformation diagram can provide information on the depth of subsurface damage after machining. The structural deformation diagram in Figure 5 shows that due to the small cutting depth, the workpiece mainly undergoes extrusion deformation, so the atomic phase transition mostly occurs in the metal coating. The greater the number of phase change atoms in the metal coating, the higher the degree of plastic deformation, which helps in the formation of the workpiece surface. Moreover, it can also reduce the cutting force and friction coefficient, which have been discussed in Section “Cutting force and friction coefficient”. Because the plasticity of metal is better than that of brittle materials, the chip accumulation is more fluid than that of the uncoated model. This is reflected in the chip accumulation of the model with a metal coating, which is wider but lower in height than the uncoated model. It is worth noting that the interface atoms between the metal coating and the substrate have changed to disordered atoms before processing, thus reducing the cutting force.
Workpiece structure deformation diagram.
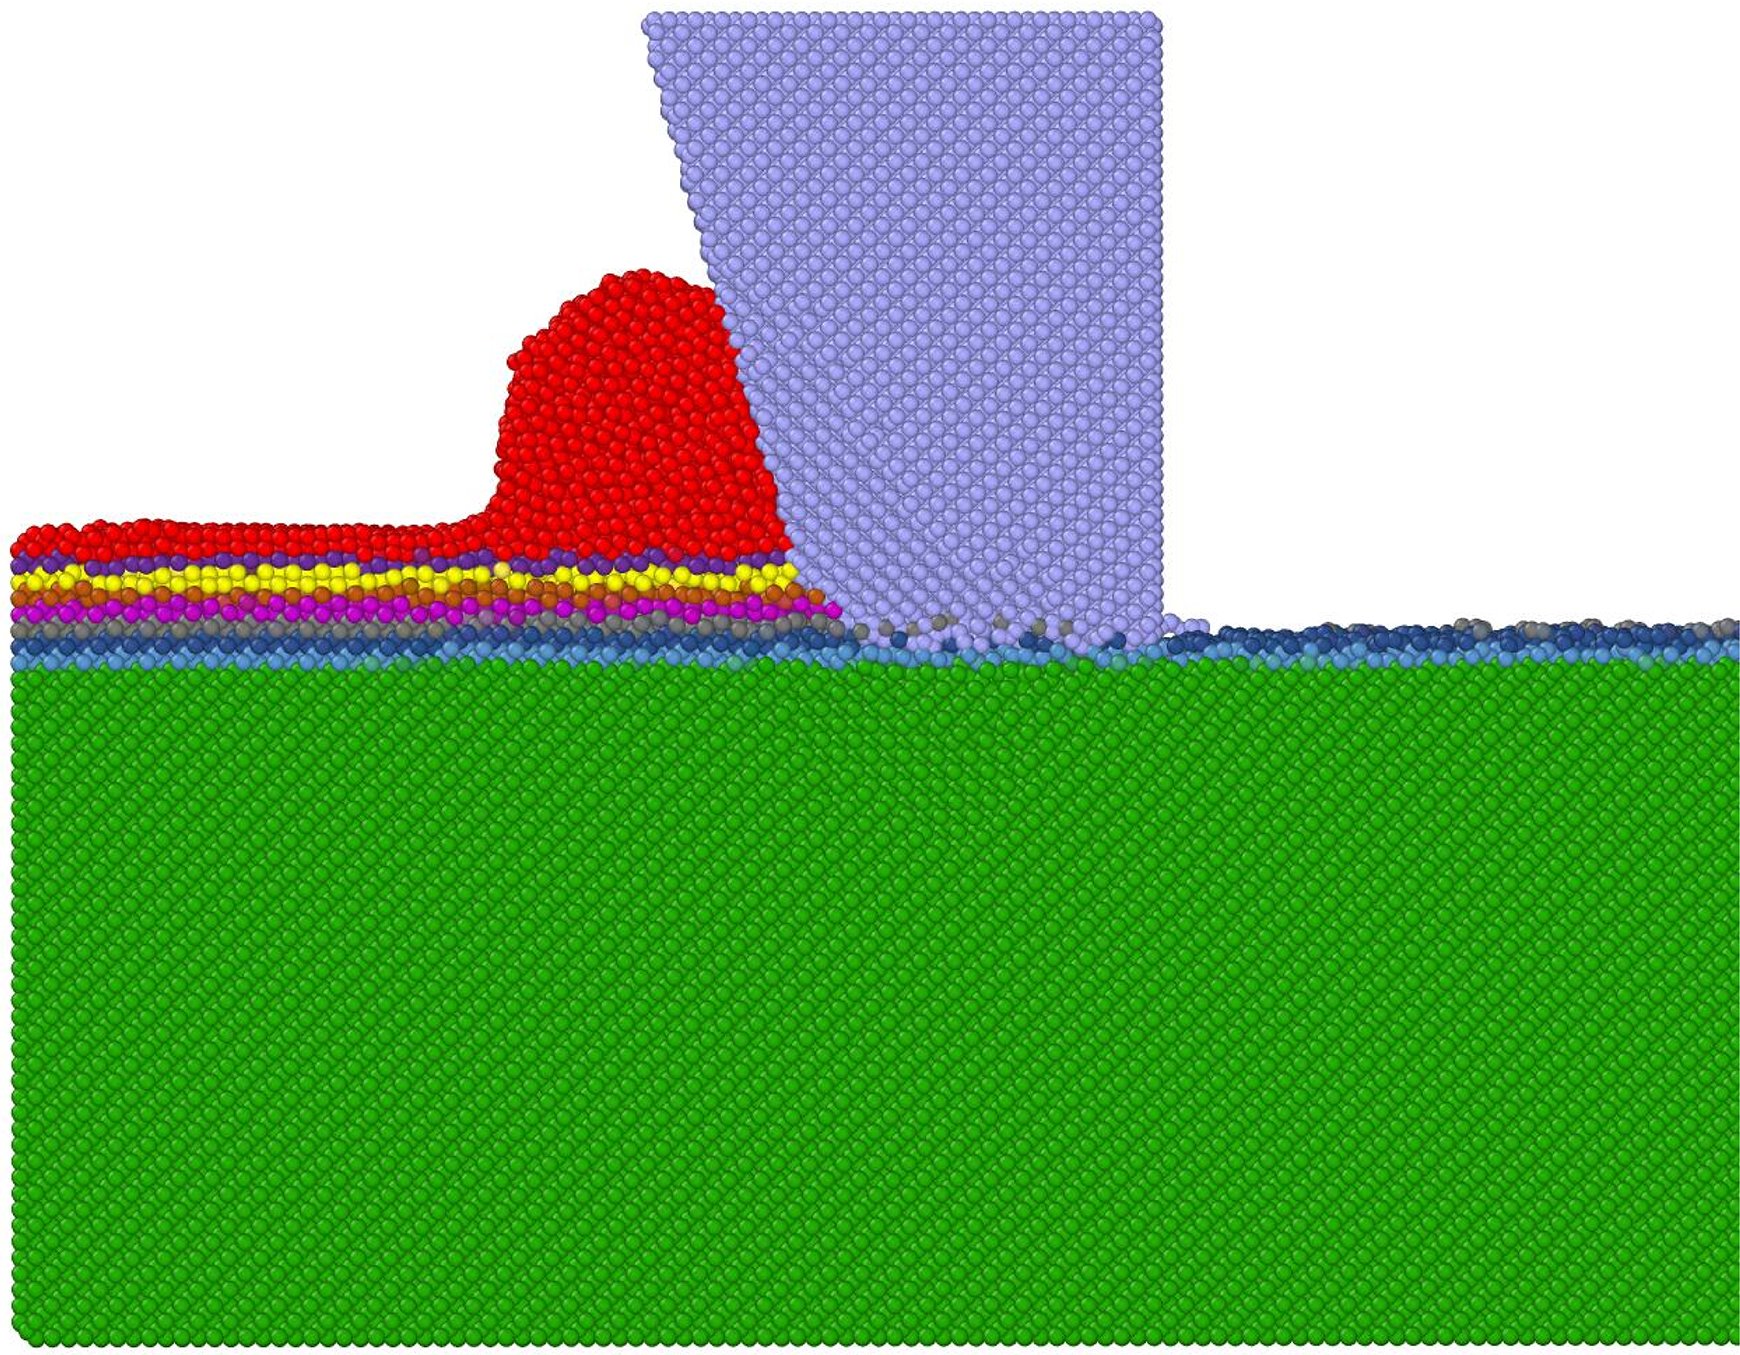
Figure 6 shows the atomic displacement diagram of the metal coating model for a cutting distance of 16 nm. The displacement distance is relative to the last output. It is found that under the tool, most of the base atoms move forward and downward to form the machined surface, while the forward-moving base atoms form the stagnation area, and the downward-moving atoms form the machined surface. However, all metal coating atoms move upward to form chips. This shows that under the influence of the metal coating, the base atoms undergo extrusion deformation. The coating atoms take away a lot of cutting heat while forming chips due to the high thermal conductivity of the metal. The temperature concentration in the workpiece is reduced, making cutting easier. The influence of the metal coating on the temperature will be discussed below. Due to the shallow cutting depth, the deformation of the substrate belongs to extrusion deformation, and the machined surface after cutting by the tool has a certain degree of elastic recovery. From Figure 7, it can be observed that the dark blue atoms are completely pressed down by the tool as it passes by. However, dark blue atoms rebound to some extent on the formed machined surface. Consistent with the results in Figure 6, most of the chips are formed by coating atoms, indicating that, although the metal coating reduces the cutting force and cutting temperature, the removal rate of the substrate is decreasing. At the same time, the wear atoms of the tool move backward (Figure 7), which is harmful to machining surface accuracy.
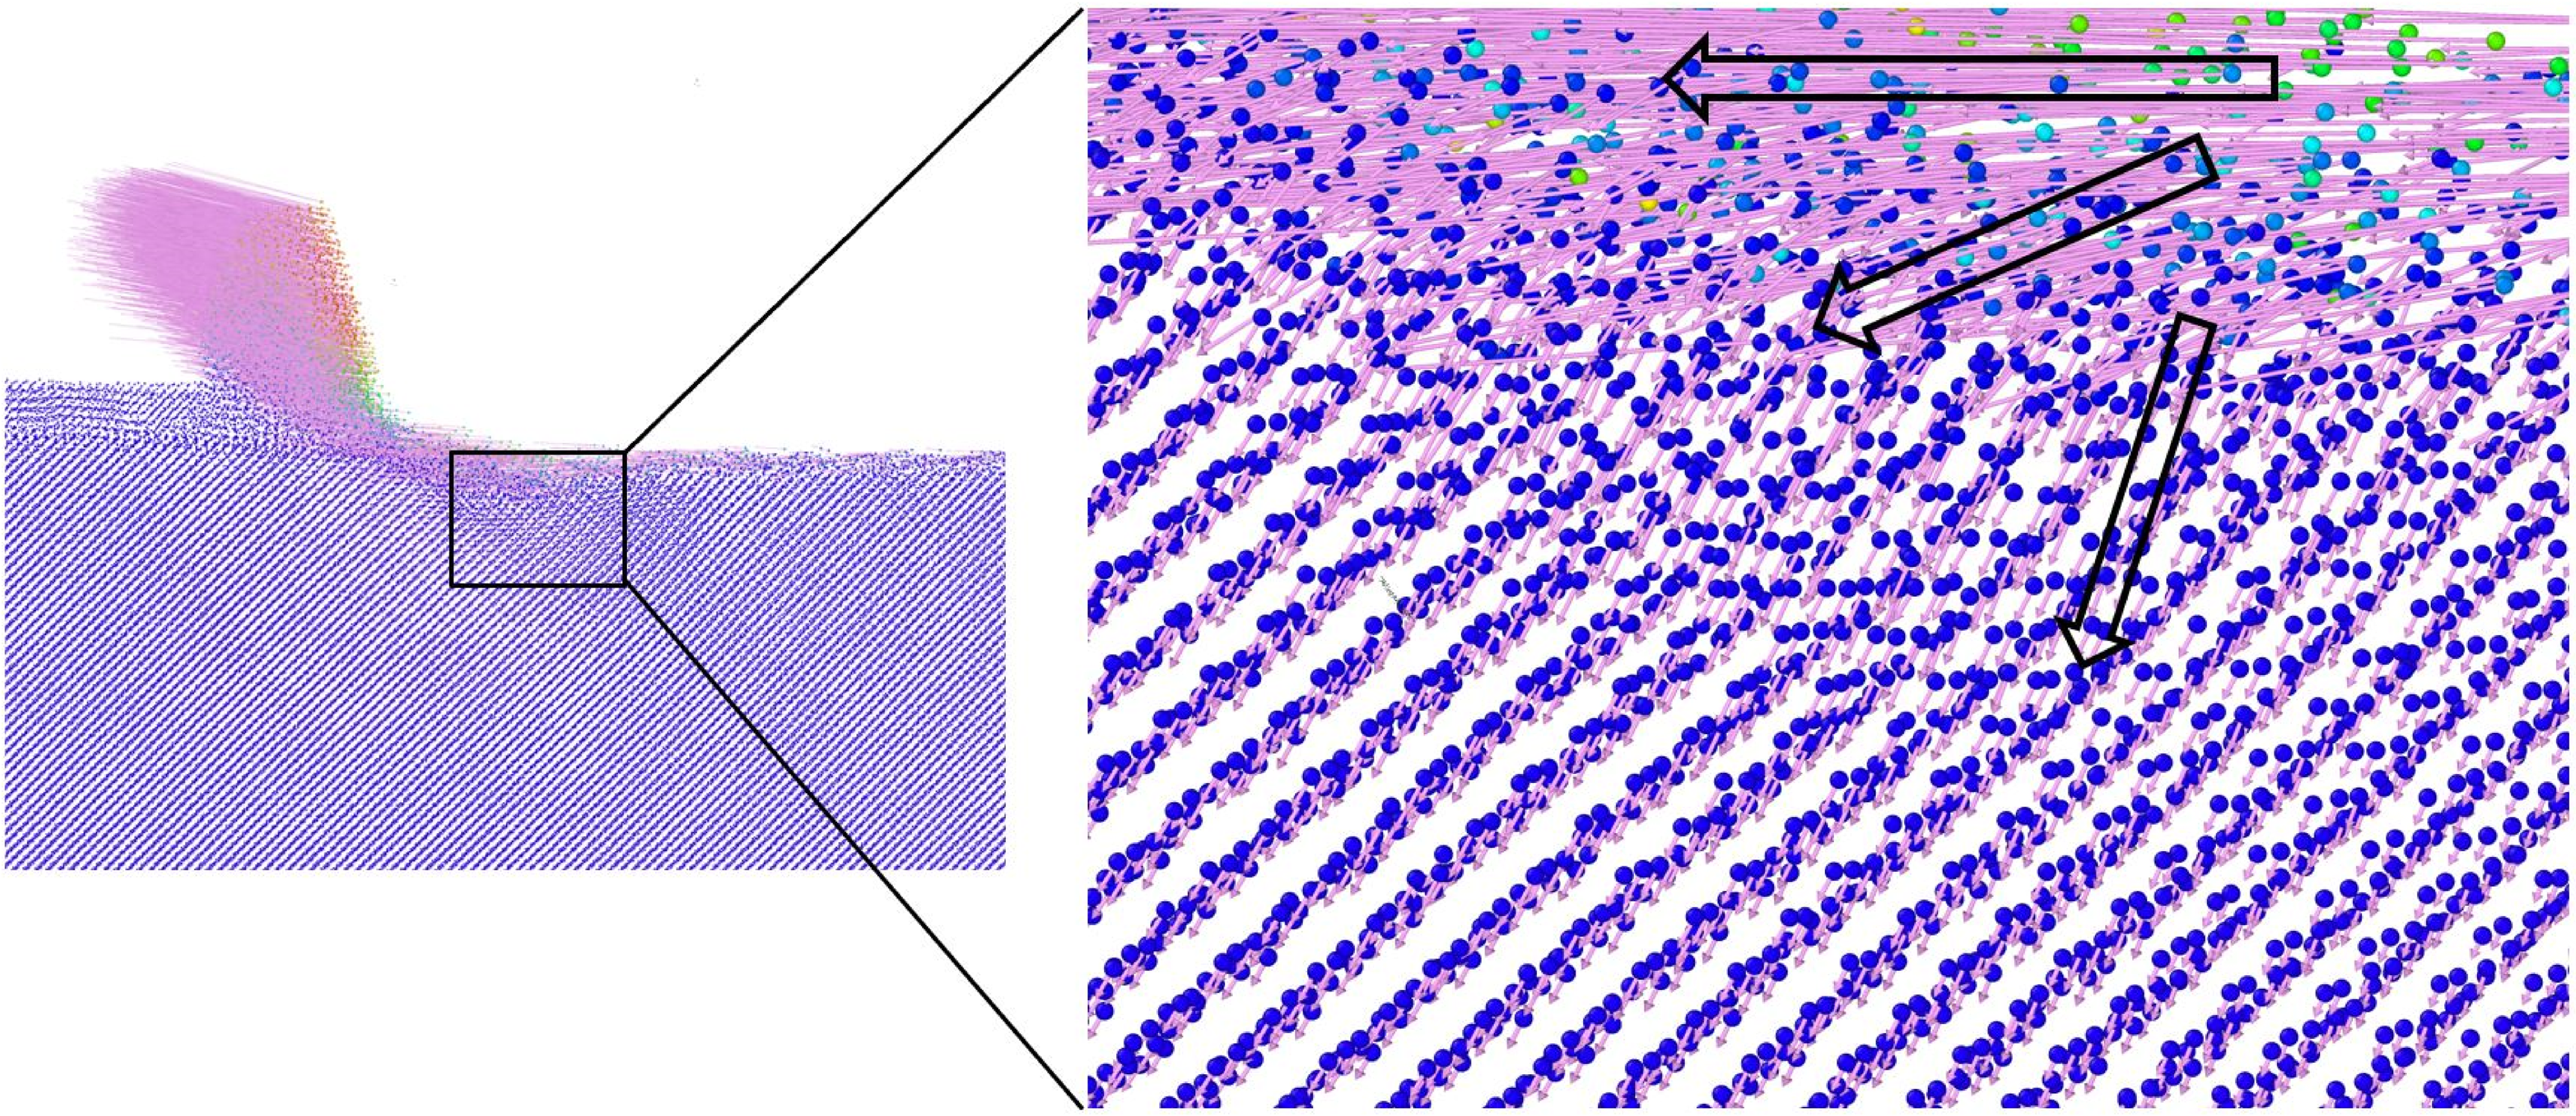
Atomic displacement.
Atomic flow diagram in cutting area.
Temperature and stress
Temperature and stress are two important features in revealing the plastic deformation of the workpiece. Localized high temperatures cause thermal softening of the workpiece, thus strengthening its ductile deformation. However, the internal temperature of the workpiece is too high, which is not good for the workpiece surface after machining. Therefore, it is expected that the temperature will be kept within a certain range during cutting, and at the same time, the excess heat will be absorbed by the chip. Figure 8 is the cloud diagram of instantaneous temperature distribution when the cutting distance is 16 nm. The temperature distribution trend of all models is the same, that is, the elevated temperature is distributed in the lower front of the tool and the chip. However, it is interesting that the coated model dissipates heat faster after processing. Also, the heat dissipation of the workpiece is faster as the coating thickness increases. As shown in Model 1 and Model 2 of Figure 8, the heat dissipation of the metal Cu coating is faster than that of the Ni-Ti alloy when the coating is 1.5 nm. When the coating thickness is 1 nm, the heat dissipation effect of Cu coating is the best among Cu, Ni-Ti alloy, and Ni coatings. At the same time, because the thermal conductivity of metal is higher than that of ceramic materials, it is found that the temperature in the chip of the model with a metal coating is higher. Because the metal coating absorbs the excess heat, the internal temperature of the model workpiece with a metal coating is lower, making plastic removal of the workpiece easier. As a result, as the thickness of the metal coating increases, the local high temperature at the lower front of the tool disappears.
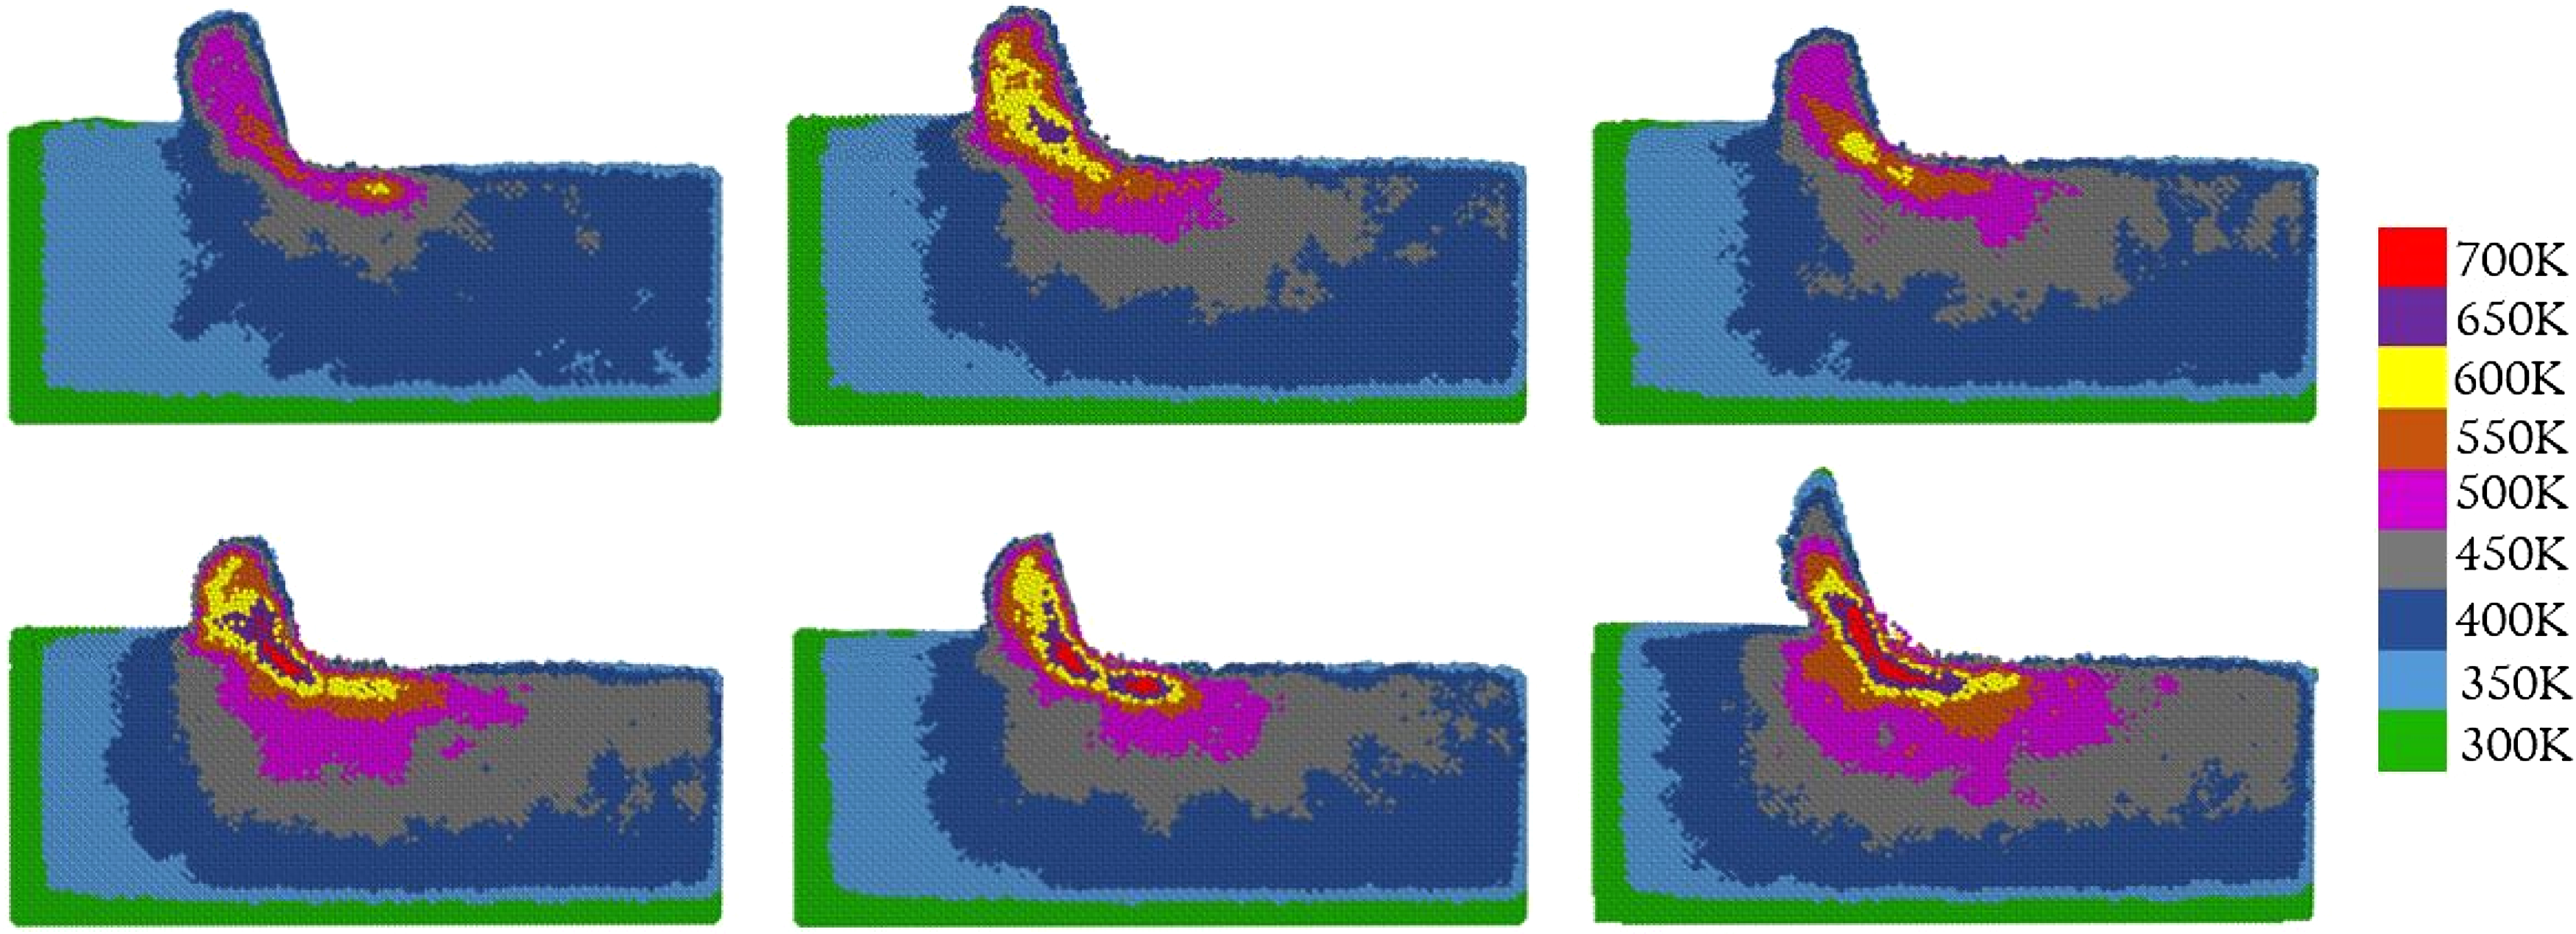
Temperature nephogram.
Figure 8 shows the instantaneous temperature distribution when the cutting distance is 16 nm. To understand the temperature variation during the cutting process, Figure 9 (a) displays the temperature variation curve of each model in the whole cutting process. As the change in temperature is closely related to the change in internal energy of the workpiece, the curves showing the relationship between cutting distance and potential energy are shown in Figure 9(b). In agreement with previous studies, 45 temperature increases with the increase of cutting distance. It should be noted that during the whole cutting process, the temperature did not decrease with the increase in coating thickness. The temperature of 1.5 nm NiTi alloy coating is higher than that of 1 nm Cu and Ni coating. At already discussed in Section“Cutting force and friction coefficient”, the tangential force of Ni-Ti alloy coating is greater than that of other coatings at the same depth, and the intensity of fluctuation is only slightly lower than that of a model with no coating. This is because the hardness of Ni-Ti alloy is higher than the other coated metals, and the thermal conductivity is relatively low. Figure 9(b) shows the potential energy curves of various models. The potential energy curves of the models with metal coating are relatively smooth. When the thickness of the metal coating is 1 nm, the potential energy of the Ni-Ti alloy coating is higher because the breaking and recombination of atomic bonds in the Ni-Ti alloy release more energy.
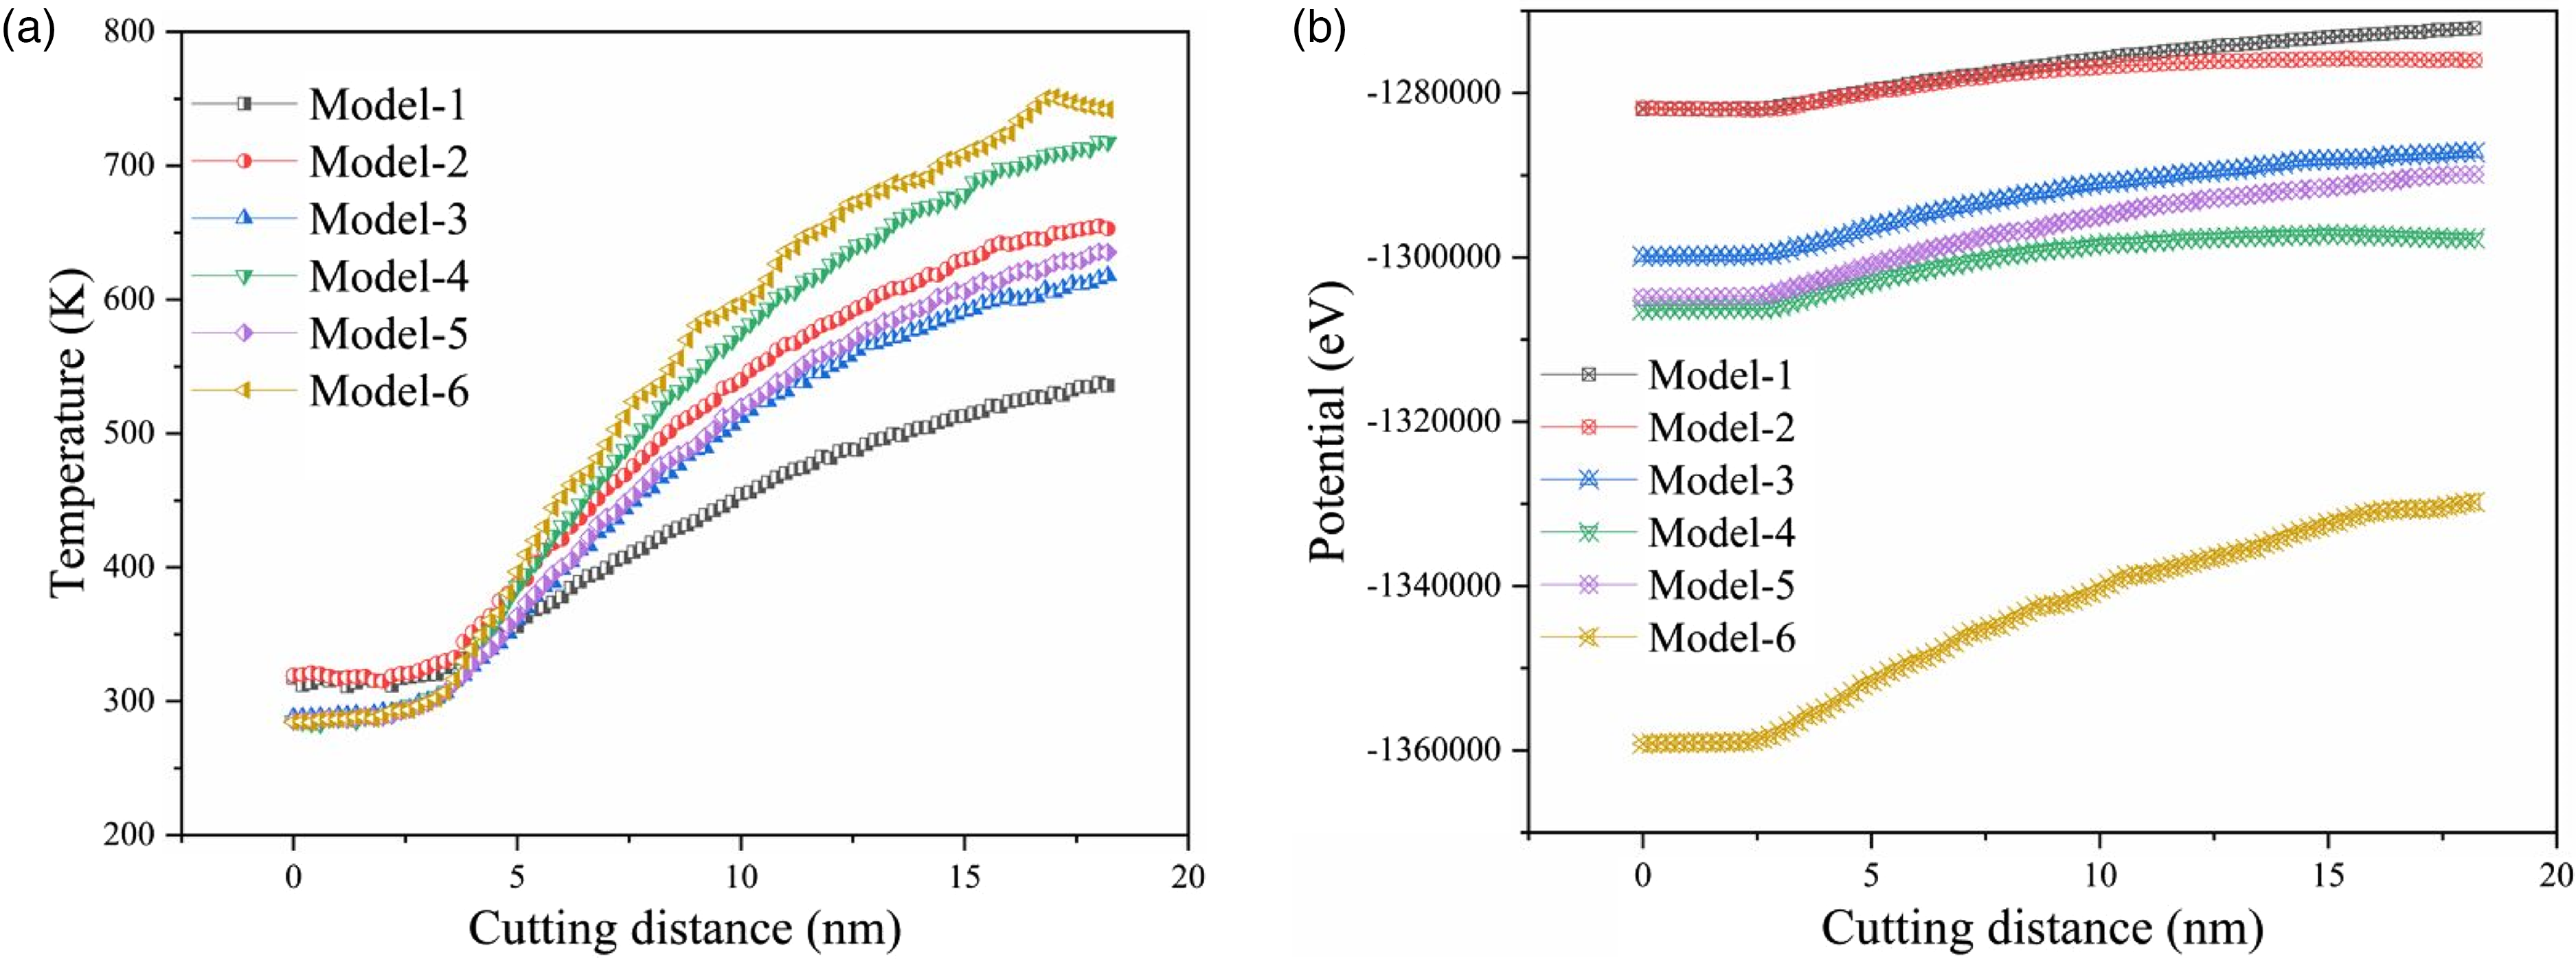
(a) Temperature curve; (b) potential energy curve.
It has been demonstrated that stress is an important factor in nano-machining, reflecting the plastic deformation of the workpiece. 3 In this regard, hydrostatic stress, Von Mises stress, tangential stress, and normal stress are widely studied.46,47 Figures 10 and 11, respectively, show the Von Mises stress nephogram and the hydrostatic stress nephogram for different metal coating thicknesses when the cutting distance is 16 nm. Von Mises stress distribution mainly characterizes the concentration of shear force in the workpiece and the region of plastic deformation in the workpiece. As shown in Figure 10, Von Mises stress has the widest distribution range in model 6 (without metal coating), with the maximum stress concentrated at the lower front of the tool, which is about 21.6 GPa. Interestingly, as metal coating thickness increases, the high-stress concentration area decreases. The Von Mises stress cloud diagram also shows the initial Von Mises stress diagram of the workpiece before cutting at the bottom of each model shown in Figure 10. However, because of the huge difference in thermal conductivities of metal coating and the workpiece, Von Mises stress appears at the mixed interface between the metal coating and the workpiece after the workpiece relaxes. The different thermal conductivity of metal coating and the workpiece will also cause a difference in cutting temperature, which has been discussed in a previous article. 48 It is worth noting that the initial von Mises stress does not have a negative impact on cutting. It can be seen that the initial stress in Model 1 is the largest, but the stress concentration after cutting is the smallest.
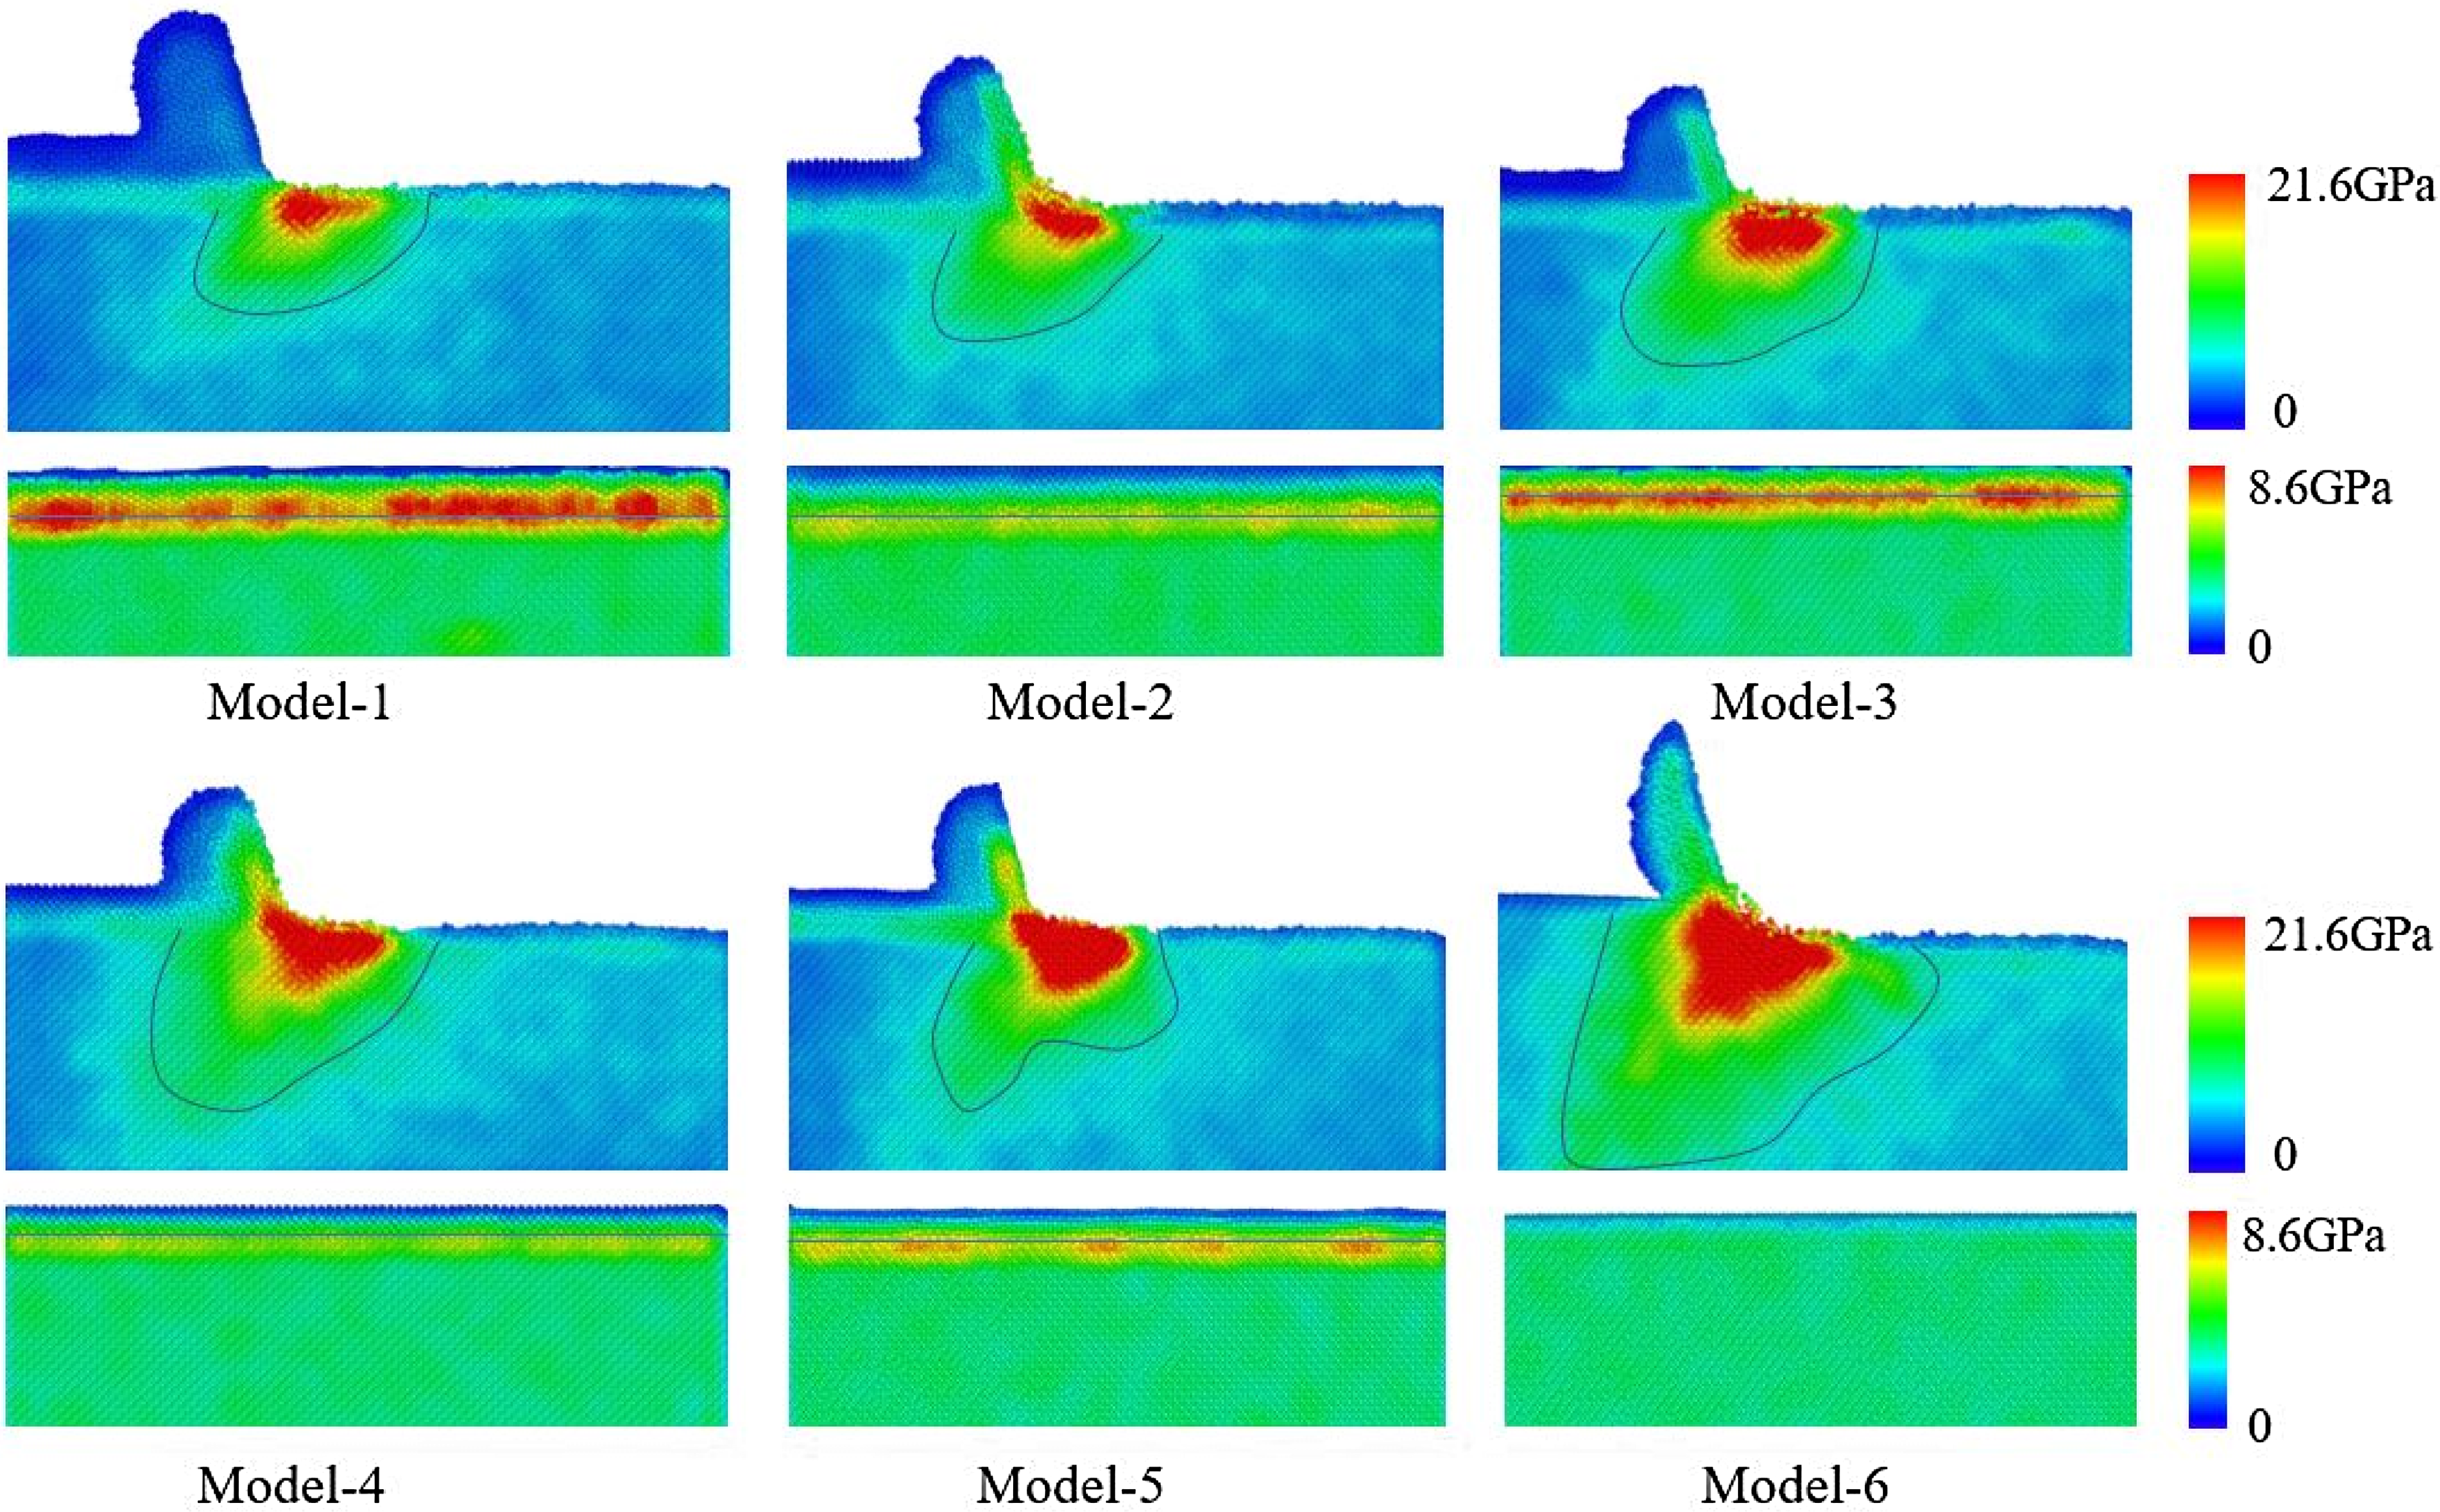
Von Mises stress nephogram.
Hydrostatic stress.
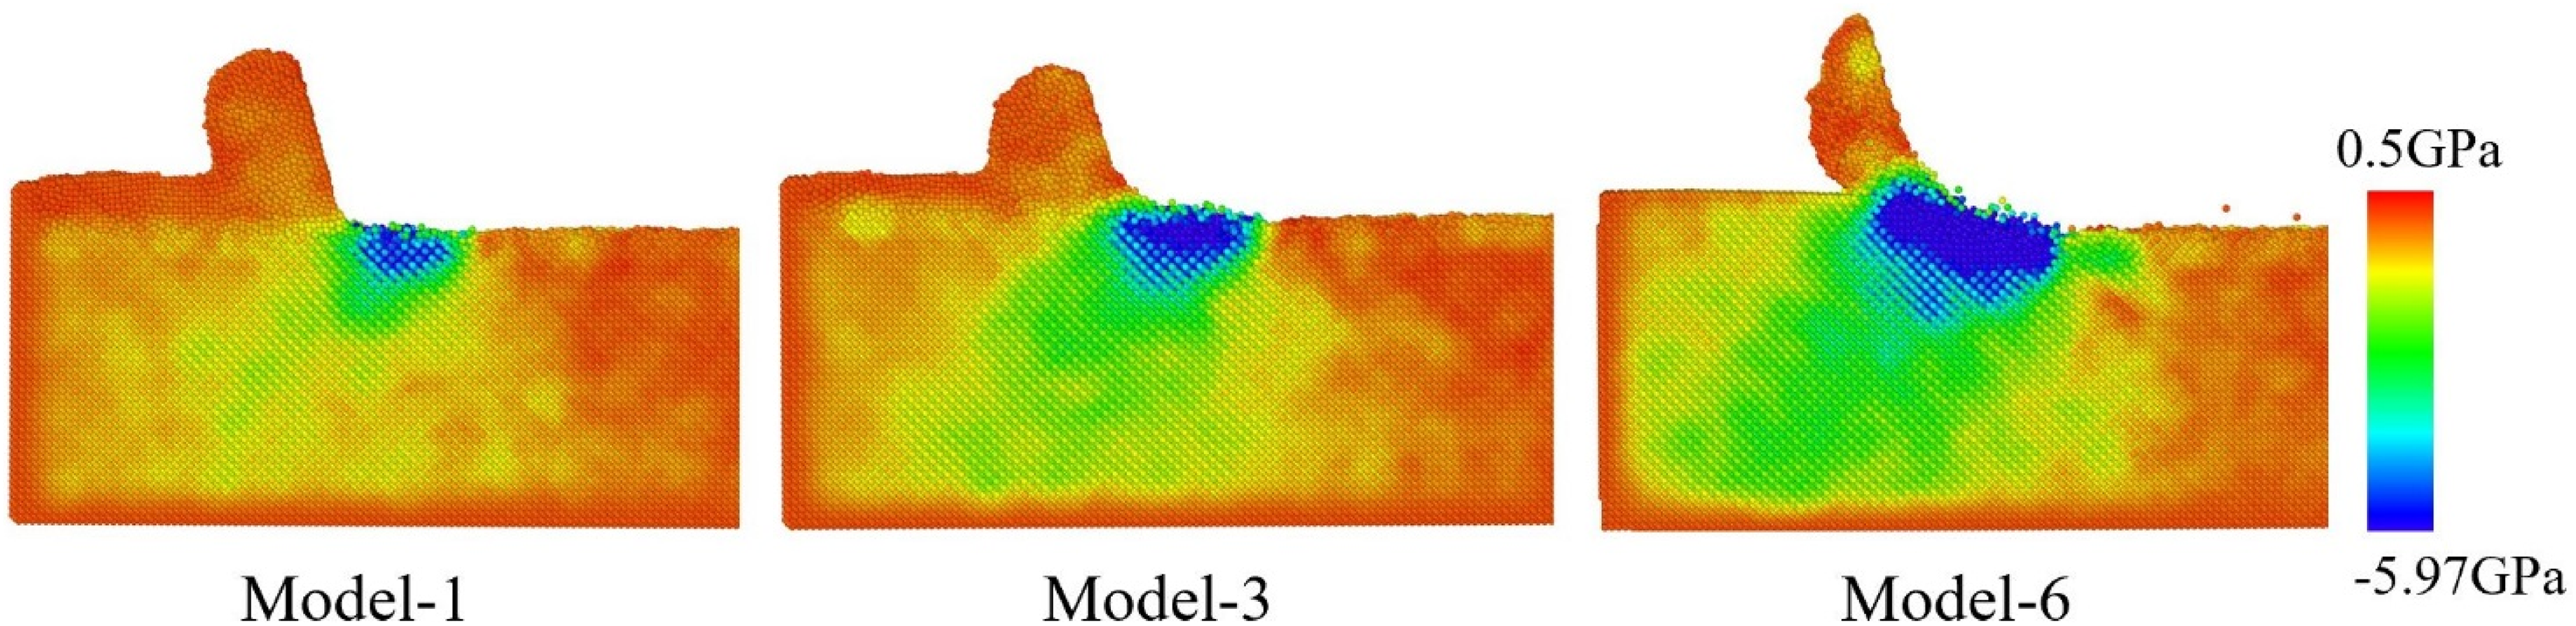
Hydrostatic stress is closely related to the volume change and atomic phase transformation of the workpiece and the plastic deformation in the workpiece occurs at the place where the hydrostatic stress is concentrated. Figure 11 shows the hydrostatic stress distribution of Cu-coated and uncoated models with different thicknesses. The tensile stress generally occurs on the surface of the workpiece after machining. If the tensile stress is too high, flying chips and small cracks will appear on the machined plane, reducing the precision of the machined surface. However, in our study, the maximum tensile stress is 0.5 GPa, which is insufficient to cause flying chips on the edge of the machined surface. It is worth noting that as the thickness of the metal coating increases, the hydrostatic stress gradually decreases, and like von Mises stress, the stress concentration distributed in front of the tool gradually disappears.
Figure 12 shows the variation of the shear stress and normal stress of each model as a function of the cutting distance. The negative sign with the values of shear stress and normal stress represents the direction. The tangential stress and normal stress are lower than 1 GPa before the cutting distance of 2 nm. However, when the tool makes contact with the workpiece and completely enters the workpiece, the tangential stress suddenly increases, which is related to the formation and accumulation of chips in front of the tool. Regardless of shear or normal stress, the stress curve fluctuation of the model with coating is smaller than that of the model without coating. This is related to the fracture and recombination of atomic bonds in the workpiece, indicating that the energy required for the fracture and recombination of metal bonds is much lower than that required for SiC. This is one of the reasons why the final stable stress value of the uncoated model is higher than that of the coated model.
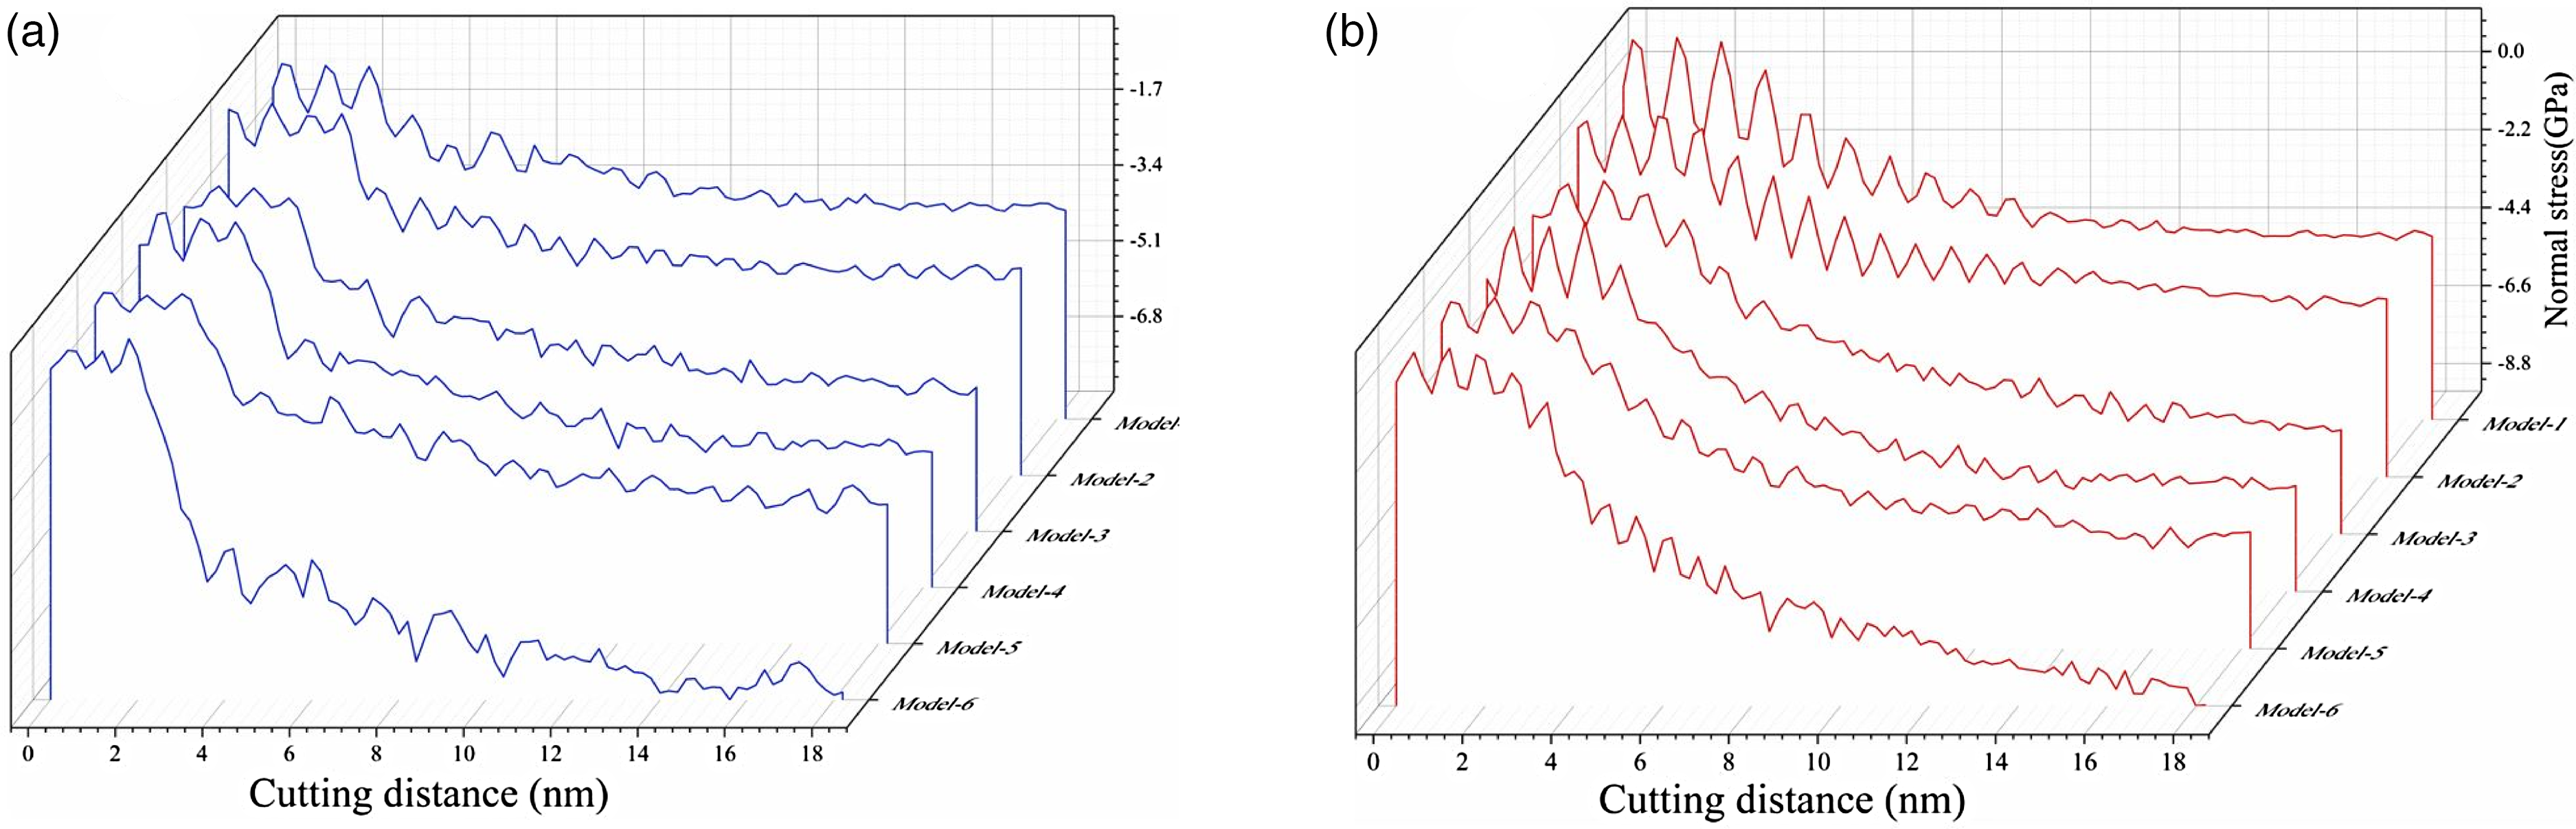
Stress change curve. (a) shear stress; (b) normal stress.
Tool wear
The radial distribution function (g (r)) can be used to characterize the bond length between atoms.2,3 The change in bond length between atoms indicates that the atomic structure has changed. Therefore, g(r) is used to determine the tool wear. The expression is as follows:
Figure 13 shows the radial distribution function g(r) of Models 1 to 6 for a cutting distance of 16 nm. The first peak appears at 1.54 Å, which is the bond length of atoms in a diamond structure. When the tool is worn, the structure of diamond atoms will undergo sp3-sp2 transformation. A low-intensity peak at 1.43 Å represents the bond length of atoms in the graphene structure. Graphene has a layered structure, so its hardness is lower than that of the diamond. It should be noted that with the increase of coating thickness, the intensity of the peak representing graphene increases with respect to the initial structure. However, its value without coating is the largest, indicating that the tool wear is the largest. The other three peaks have the same trend. The number of diamond structures retained by the tool when cutting the model with coating is greater than that of the model without coating. The maximum value of the peak represents the number of diamond structure atoms in the initial state of the tool. As the cutting progresses, its diamond structure undergoes an atomic phase transition, resulting in a decrease in the number. It is worth noting that, except for the uncoated model, the Ni-Ti alloy coating has the largest wear, which corresponds to Figure 14 of the number of tool suspension keys. Due to the sudden termination of the crystal lattice at the surface, each atom in the outermost layer of the surface will have an unpaired electron, which is an unsaturated bond called a suspension keys. Its quantity reflects the degree of wear and tear.
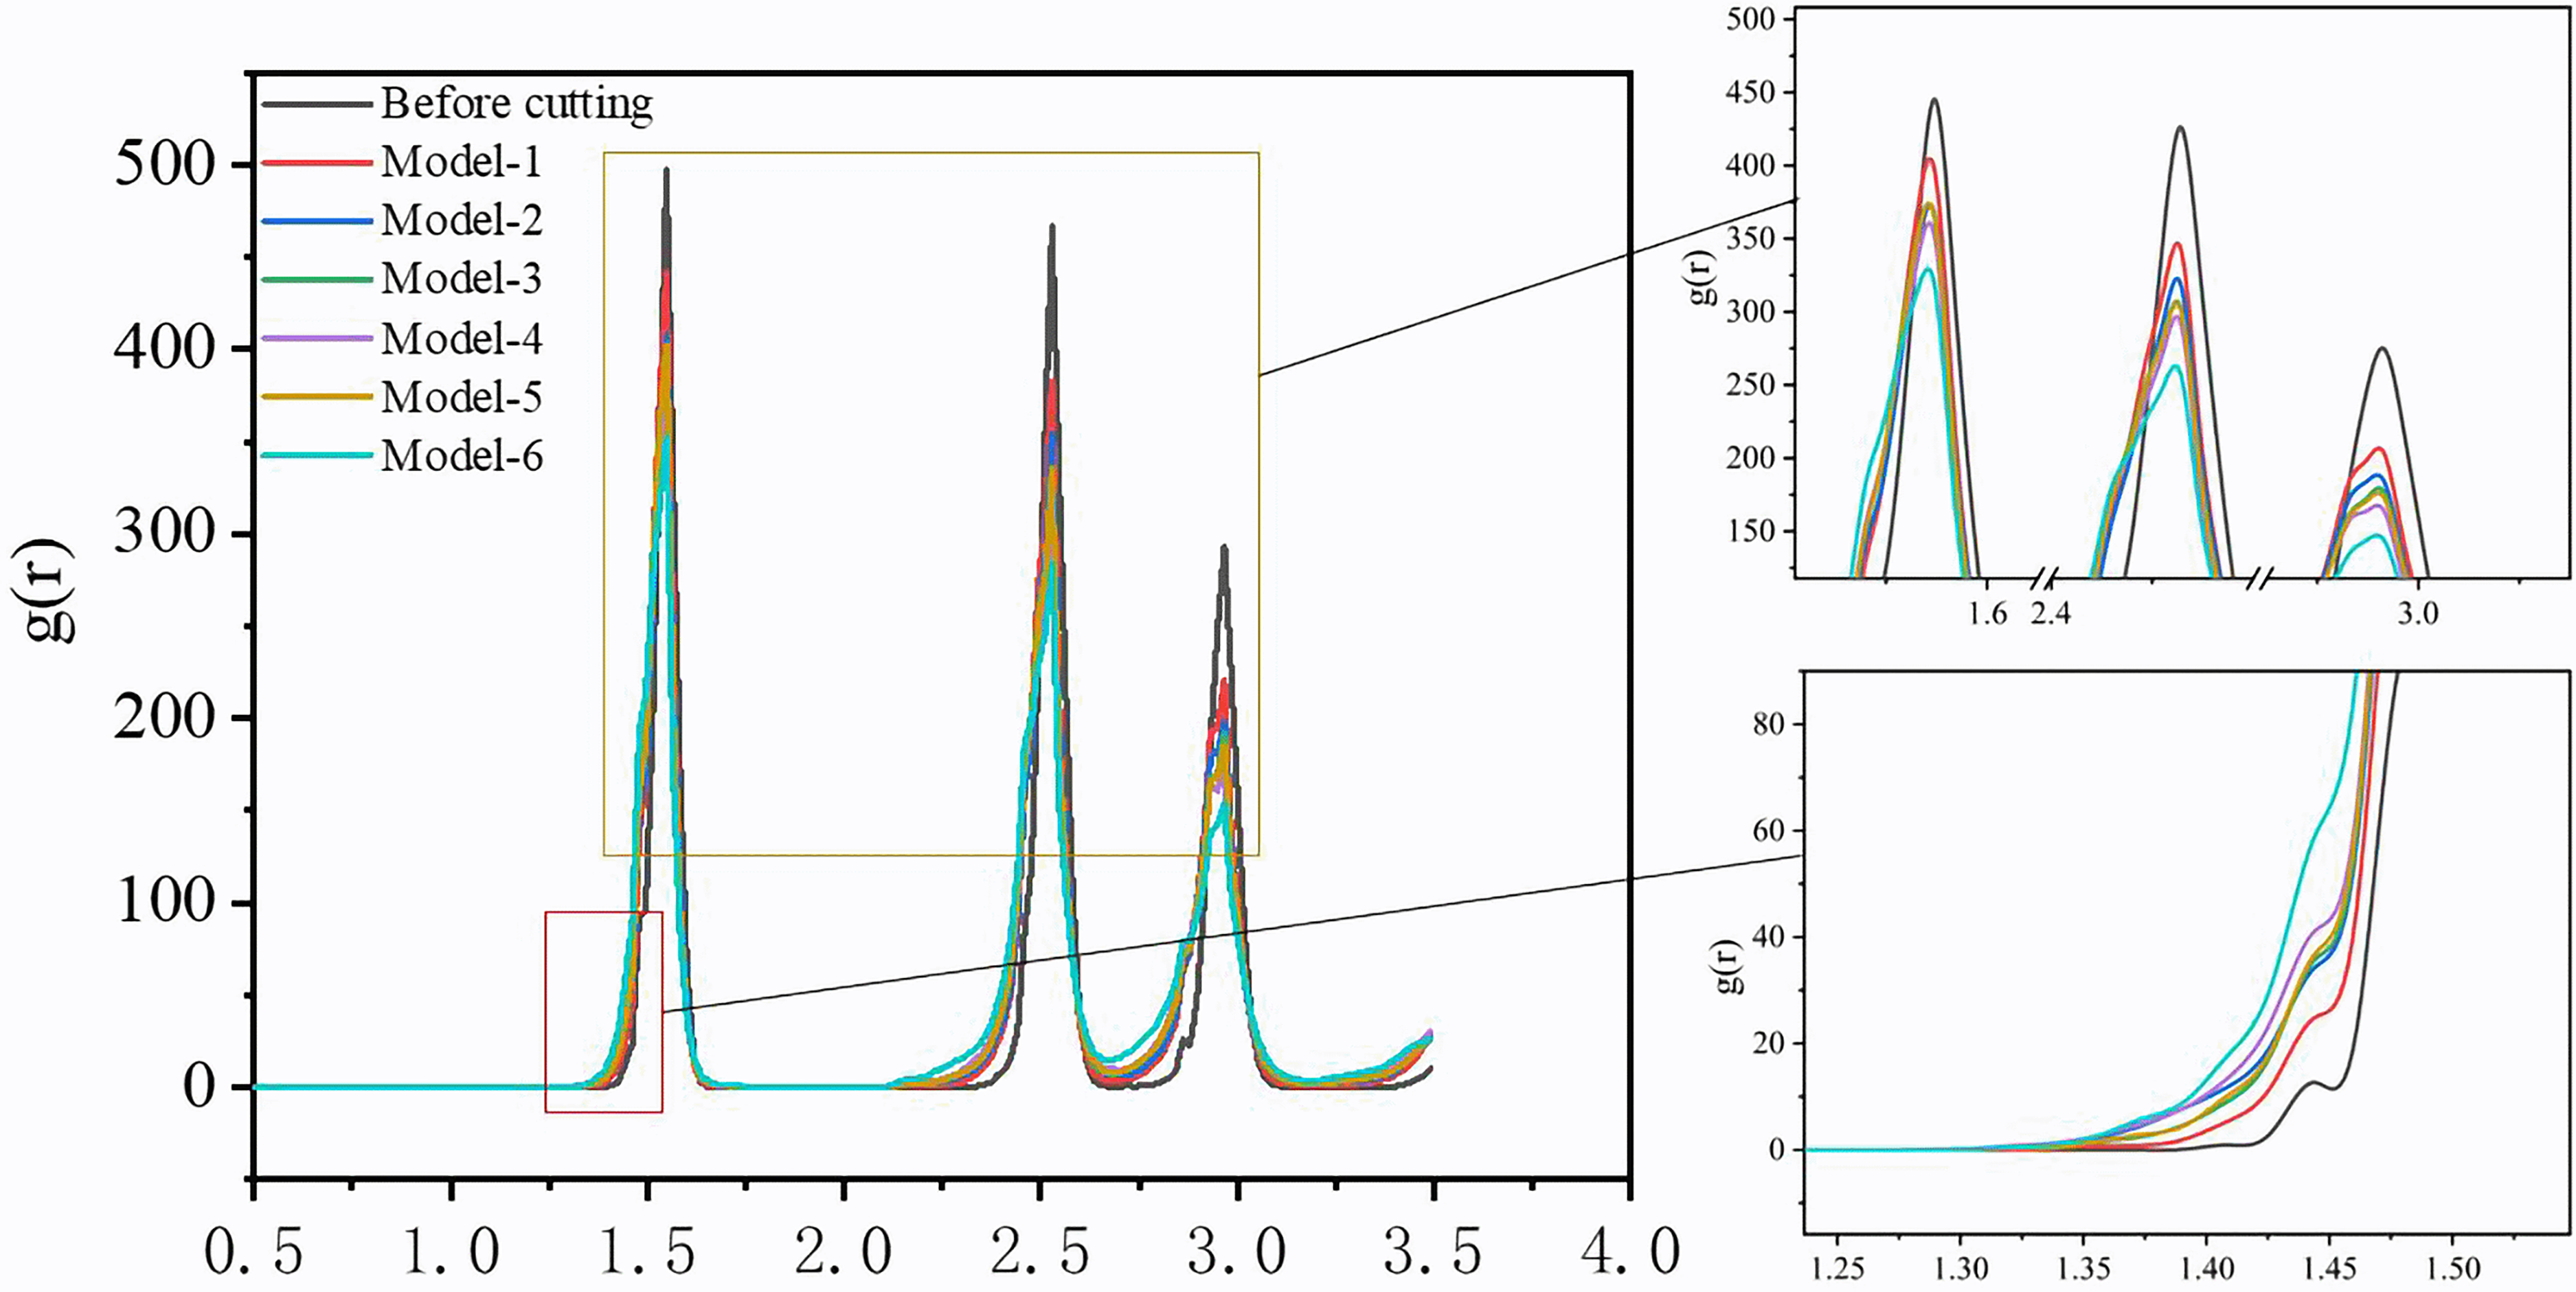
Radial distribution function.
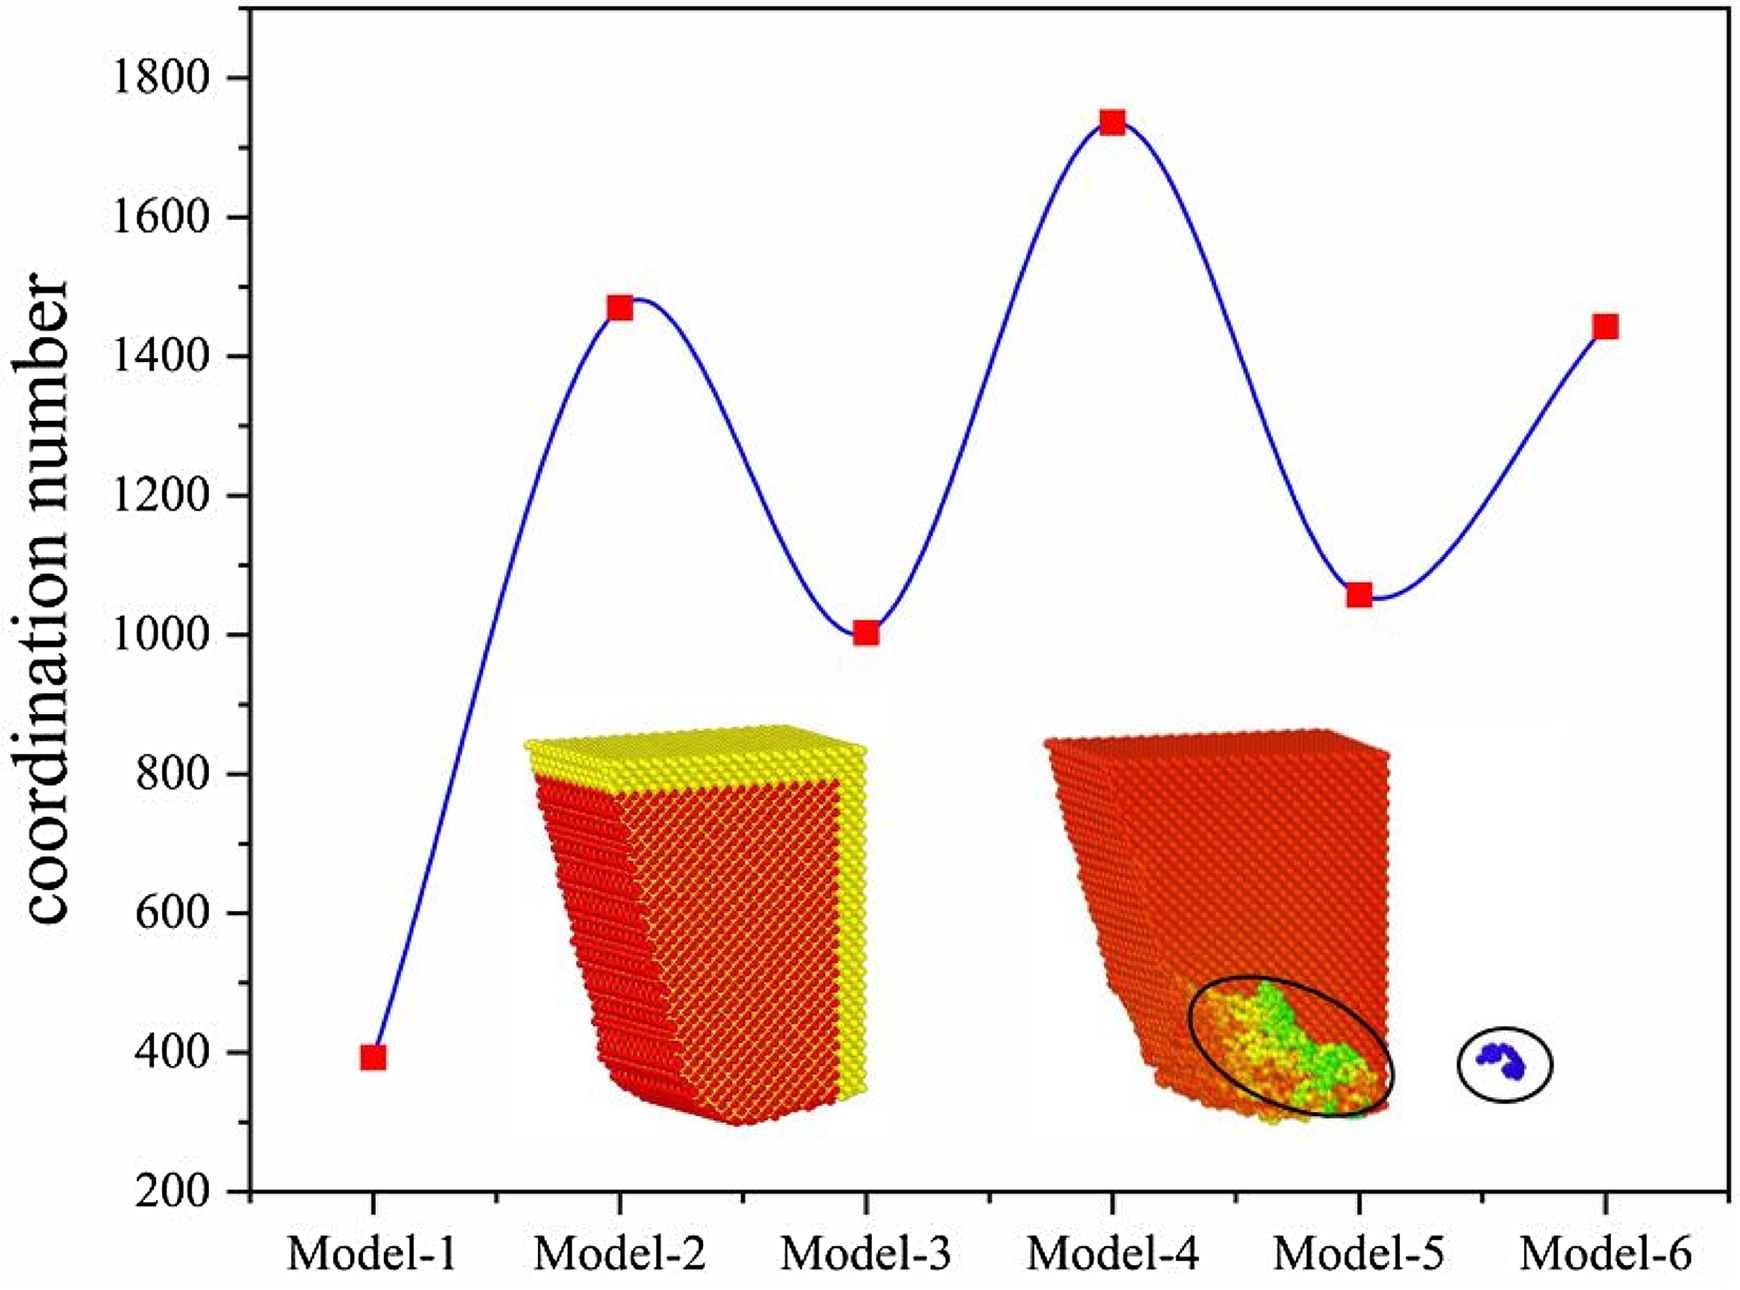
Number of tool suspension keys.
The two largest peaks in Figure 14 are Ni-Ti alloy coating. When the coating thickness is 1 nm, the number of suspension keys exceeds the uncoated model, and the overall trend is similar to the previously mentioned change in friction coefficient. Because the tool wear is determined by the contact and temperature between the workpiece and the tool, the previous analysis of temperature and cutting force shows that the thermal conductivity of the Ni-Ti alloy coating is lower than that of the other two metal coatings. When compared to the other two metal coatings, the tangential force of the Ni-Ti alloy coating is greater, resulting in greater tool wear. Moreover, as shown by the red atoms in Figure 14, the atoms on the tool surface have no adjacent atoms before cutting, forming a hanging bond layer. In the cutting process, the most seriously worn parts are the rake face and the cutting edge of the tool. The number of final suspension keys with 1.5 nm Cu coating is 26.7% lower than that without coating. It shows that the coating can greatly improve tool wear. At the same time, as shown by the black circle in the figure, most of the wear atoms of the tool flow backward from the side of the tool, following the same trend as the flow of the chip atoms of the workpiece. The more severe the tool wear is, the more atoms on the tool surface come into contact with the workpiece, which is less favorable for improving machining surface accuracy.
Conclusion
In this study, MDS is used to compare and analyze the effects of different thicknesses of Cu, Ni, and Ni-Ti metal coatings on the nano-cutting process of 3C-SiC. The main conclusions are as follows:
The cutting force decreases with the increase of coating thickness. Compared with uncoated model, the average cutting force of 1.5 nm Cu coating decreased by 33.3%. Among the three metal coatings studied, Cu metal has the best improvement effect on cutting force and friction coefficient. The metal coating can improve the machining surface precision. The plastic deformation of the metal coating on the workpiece surface can inhibit chip side flow, reduce tool edge passivation, and thus reduce the burr and flash at the groove edge. The von Mises stress and hydrostatic stress decrease with the increase of metal coating thickness. In addition, metal coatings can reduce the fluctuation of shear stress and normal stress. Cu, Ni, and Ni-Ti metal coatings can all accelerate the heat dissipation of SiC substrates, among which Cu metal coatings have the best heat dissipation effect. Furthermore, the heat dissipation effect increases with the increase of coating thickness. With the assistance of metal coating for heat dissipation and wear reduction, tool wear can be significantly reduced. Meanwhile, the 1.5 nm Cu metal coating has the most significant effect on improving tool wear.
Footnotes
Authors contributions
Guanglan Hu contributed to writing the original draft, visualization, and formal analysis. Houfu Dai contributed to data curation, investigation, methodology, resources, supervision and validation.
Consent to publish
All authors have seen the manuscript and approved to submit to your journal, and we would greatly appreciate for your attention and consideration.
Consent to participate
Not applicable
Declaration of Conflicting Interests
The author(s) declared no potential conflicts of interest with respect to the research, authorship, and/or publication of this article.
Ethical approval
Ethical approval was obtained from the College of Mechanical Engineering of Guizhou University.
Funding
The author(s) disclosed receipt of the following financial support for the research, authorship, and/or publication of this article: National Natural Science Foundation of China (12162008, 52105178), Natural Science Foundation of Hunan Province (2022JJ40056), and Technology Foundation of Guizhou Province of China [JC(2020)1Y229].
Research data policy and data availability statements
Not applicable.