
Abstract
The lubricating effectiveness of an oil film in a journal bearing depends on the dynamic viscosity of the oil. The viscosity in turn depends on the local operating temperature, pressure, and shear rate. Reproducing these conditions in a laboratory viscometer to investigate the lubricant behaviour is a challenging task. As a result, methods that allow oil viscosity measurement in-situ in a film, would be preferred.
Ultrasound technology utilising shear bulk acoustic waves (BAW) has been used to measure liquid viscosity in the bulk, as well as in-situ in a film; the reflection of a shear BAW from a solid-liquid interface depends on the liquid viscosity. Surface acoustic waves (SAW) have been also used for measuring bulk liquid viscosity. In this paper, shear-horizontal surface acoustic waves (SH-SAWs) were explored for measuring oil film viscosity, as they present good coupling with liquids and sensitivity to surface changes. The main objectives of this work were to generate SH-SAWs on metallic media, investigate the wave response at the metal-oil interface, relate the wave response to viscosity with the aim to apply this knowledge to a journal bearing application for measuring viscosity in-situ the lubricant film.
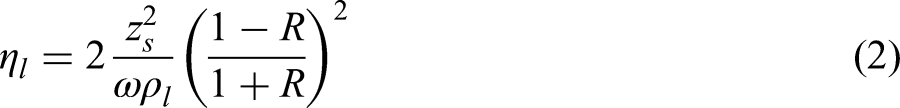
Initially, the SH-SAW response was investigated at a solid-liquid interface. SH-SAWs attenuate at the solid-liquid interface, due to the liquid viscosity. This was modelled as a function of the liquid properties, material and geometry of the medium, and wave frequency. The SH-SAW attenuation-viscosity model was used to calculate the viscosity (in the range of ∼3 to 4600 cP) of different oils at a free surface, which agreed with the viscosity values from datasheets and bench-top viscosity measurements.
This approach was then implemented in-situ in a journal bearing application. A bearing sleeve was instrumented with a pair of SH-SAW transducers and a shear BAW transducer installed inside the rotating journal. These two approaches were used to measure the film viscosity of 4 lubricants blended with different additives in two ways; the former by the leakage of the surface wave, and the latter by the reflection of the bulk wave. Both approaches were found to be in good agreement. They successfully distinguished the chemistry of the oil test samples according to their viscosities under various loading conditions and constant speed, and were able to monitor changes in the oil film viscosity in the loaded region.
The SH-SAW sensors used were low cost and small sized and so can be fitted relatively conveniently into a bearing sleeve, requiring nothing but a function generator and digitiser to operate. This approach could then be used to evaluate lubricant formulations for their performance actually inside a bearing, rather than through the extrapolation of data from a conventional bench top viscometer.
Keywords
Introduction
The dynamic viscosity of a lubricant film in a machine element is strongly affected by the operating conditions of pressure, temperature, and shear rate. Reproducing these conditions in a laboratory viscometer is challenging. It would be preferable to measure the viscosity in-situ in an oil film. Both bulk acoustic waves (BAWs) and surface acoustic waves (SAWs) have been used to measure the viscosity at a solid-liquid boundary and so have the potential for use inside a lubricated contact.
When a shear BAW is incident on a solid-liquid boundary, it is partly transmitted inside the liquid, and partly is reflected back. Wave energy is lost at the solid-liquid interface by shear of the liquid molecules. The energy loss is manifested as a reduction in the amplitude of the reflected wave and is directly related to the liquid visco-elastic properties. Greenwood et al.
1
observed this amplitude reduction from solid-air and solid-liquid boundaries. The reflection coefficient, R (the proportion of the incident wave reflected) was determined from the ratio of these two amplitudes. R then depends on the acoustic impedance mismatch between the solid

One practical issue is that since most bearing materials are metallic, this is acoustically dissimilar to oil
Surface acoustic waves can also be used to measure viscosity of liquids at a boundary. Compared to shear BAWs, SAWs are not susceptible to the acoustic mismatch and can be used in direct contact with liquids.
Gitis and Sauer 7 studied the effect of liquid viscosity on the decay of the zero mode of a shear horizontal surface acoustic wave (SH0 mode) in a metallic waveguide immersed in liquid. The wave amplitude decayed due to the shear viscosity of the liquid, which was estimated from the ratio of the liquid shear impedance to the shear impedance of the waveguide. Analytical as well as numerical results were provided for a range of viscosities up to 500 cP and for three different plate materials steel, aluminium and acrylic glass, and found to be in good agreement. Further research is required to verify the theoretical results with experimental measurements. Gitis and Churpin 8 experimentally validated the use of the SH0 mode to measure viscosity of liquids, using an aluminium medium and various solutions of saccharose in distilled water to vary viscosity from ∼1 to 60 cP. The results reported good agreement between the measured and calculated viscosity values for the various mixtures.
Viscosity was measured by Kielczynski et al., 9 using SH-SAWs propagating along a metallic waveguide. The shear impedance and hence viscosity of the liquid was evaluated by measuring the change in the time of flight and amplitude between two wave impulses. Three different samples were tested at 21 °C, with viscosities varying from 220 cP to 2230 cP, and the results were found to be in reasonable agreement with the values obtained from a capillary viscometer. Kazys et al. 10 also used the SH-SAWs propagating on a metallic medium for measuring the viscosity of highly viscous non-Newtonian liquids, in the range of 200 to 250,000 P. The method was theoretically and experimentally proved, but viscosity measured with SH-SAWs was found to be lower than the datasheet values, which was attributed to the high shear rate induced by ultrasound and the non-Newtonian nature of the liquids.
SH-SAWs are very similar to the QCM (Quartz Crystal Microbalance) devices as they both employ shear-horizontally polarised waves, parallel to the surface of the propagating medium and the Quartz crystal, respectively, to measure viscosity of liquids and physical adsorption of various species. However, there are some differences between the two methods and the equations that govern them.
The QCM devices use continuous waves and employ the dissipation factor (amplitude change) and resonant frequency (frequency change) to measure viscosity of liquids and physical adsorption of species, respectively,.11–13 In contrast, the SH-SAW method uses short duration bursts when coupled with metallic media to distinguish the main wave from boundary reflections. Similar to the QCM, it employs a wave amplitude change to measure oil viscosity. According to [7–10], the resonant frequency method presented low to no sensitivity for measuring liquid properties, compared to the amplitude method, because the high frequency SH-SAWs that were generated were impossible to make the metallic substrates resonate.
SH-SAWs have reported some benefits over shear BAWs for measuring liquid viscosity; the measurements were independent of the liquid film thickness and could be performed directly on metal surfaces, since SAWs are not as susceptible to the acoustic mismatch as BAWs. The purpose of the present work has been to evaluate the use of SH-SAW decay at a solid-liquid boundary as a physical principle to measure oil viscosity both at a free surface and inside a bearing lubricating film.
SH-SAW propagation at a solid-liquid interface
A SH-SAW causes the particles of the medium to oscillate perpendicularly to the direction the wave propagates in the plane of the surface, as shown schematically in Figure 1(a).
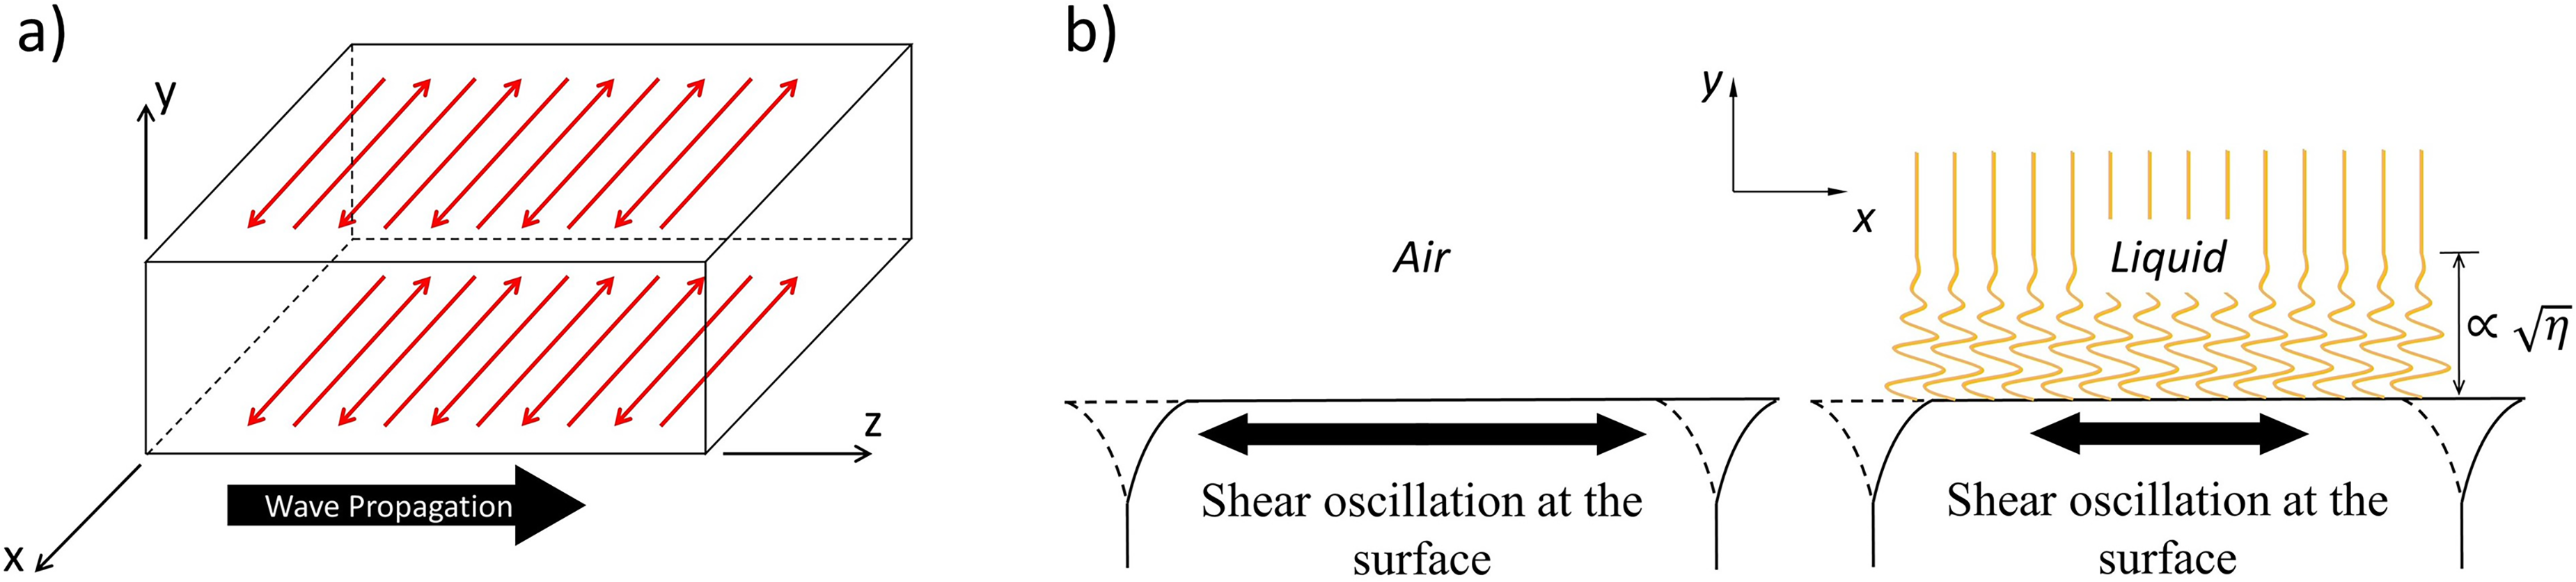
(a) SH-SAW propagation and particle movement (in red), 14 (b) SH-SAW energy loss at the solid-liquid interface due to the liquid viscosity.
When a liquid is deposited on the propagating surface, it resists shear particle movement, energy is lost, and thus the amplitude of the wave decreases (Figure 1(b)). This attenuation due to the viscous properties of a liquid is used as a means to measure the lubricant viscosity.
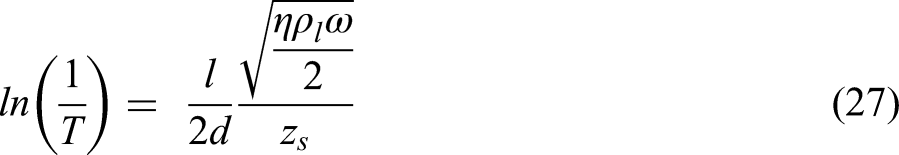
By definition, wave attenuation is the decrease in the particle oscillation of a wave after it has propagated a distance l in a medium, and is expressed by:

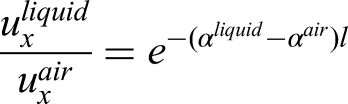
When the medium is coupled with air, the wave is fully transmitted through the solid-air interface, with negligible energy loss. When a liquid is coupled with the medium, the wave loses energy by viscous attenuation, and the wave amplitude reduces.
The medium is a plate of length l, width b and thickness d bounded by a viscous liquid on one side (
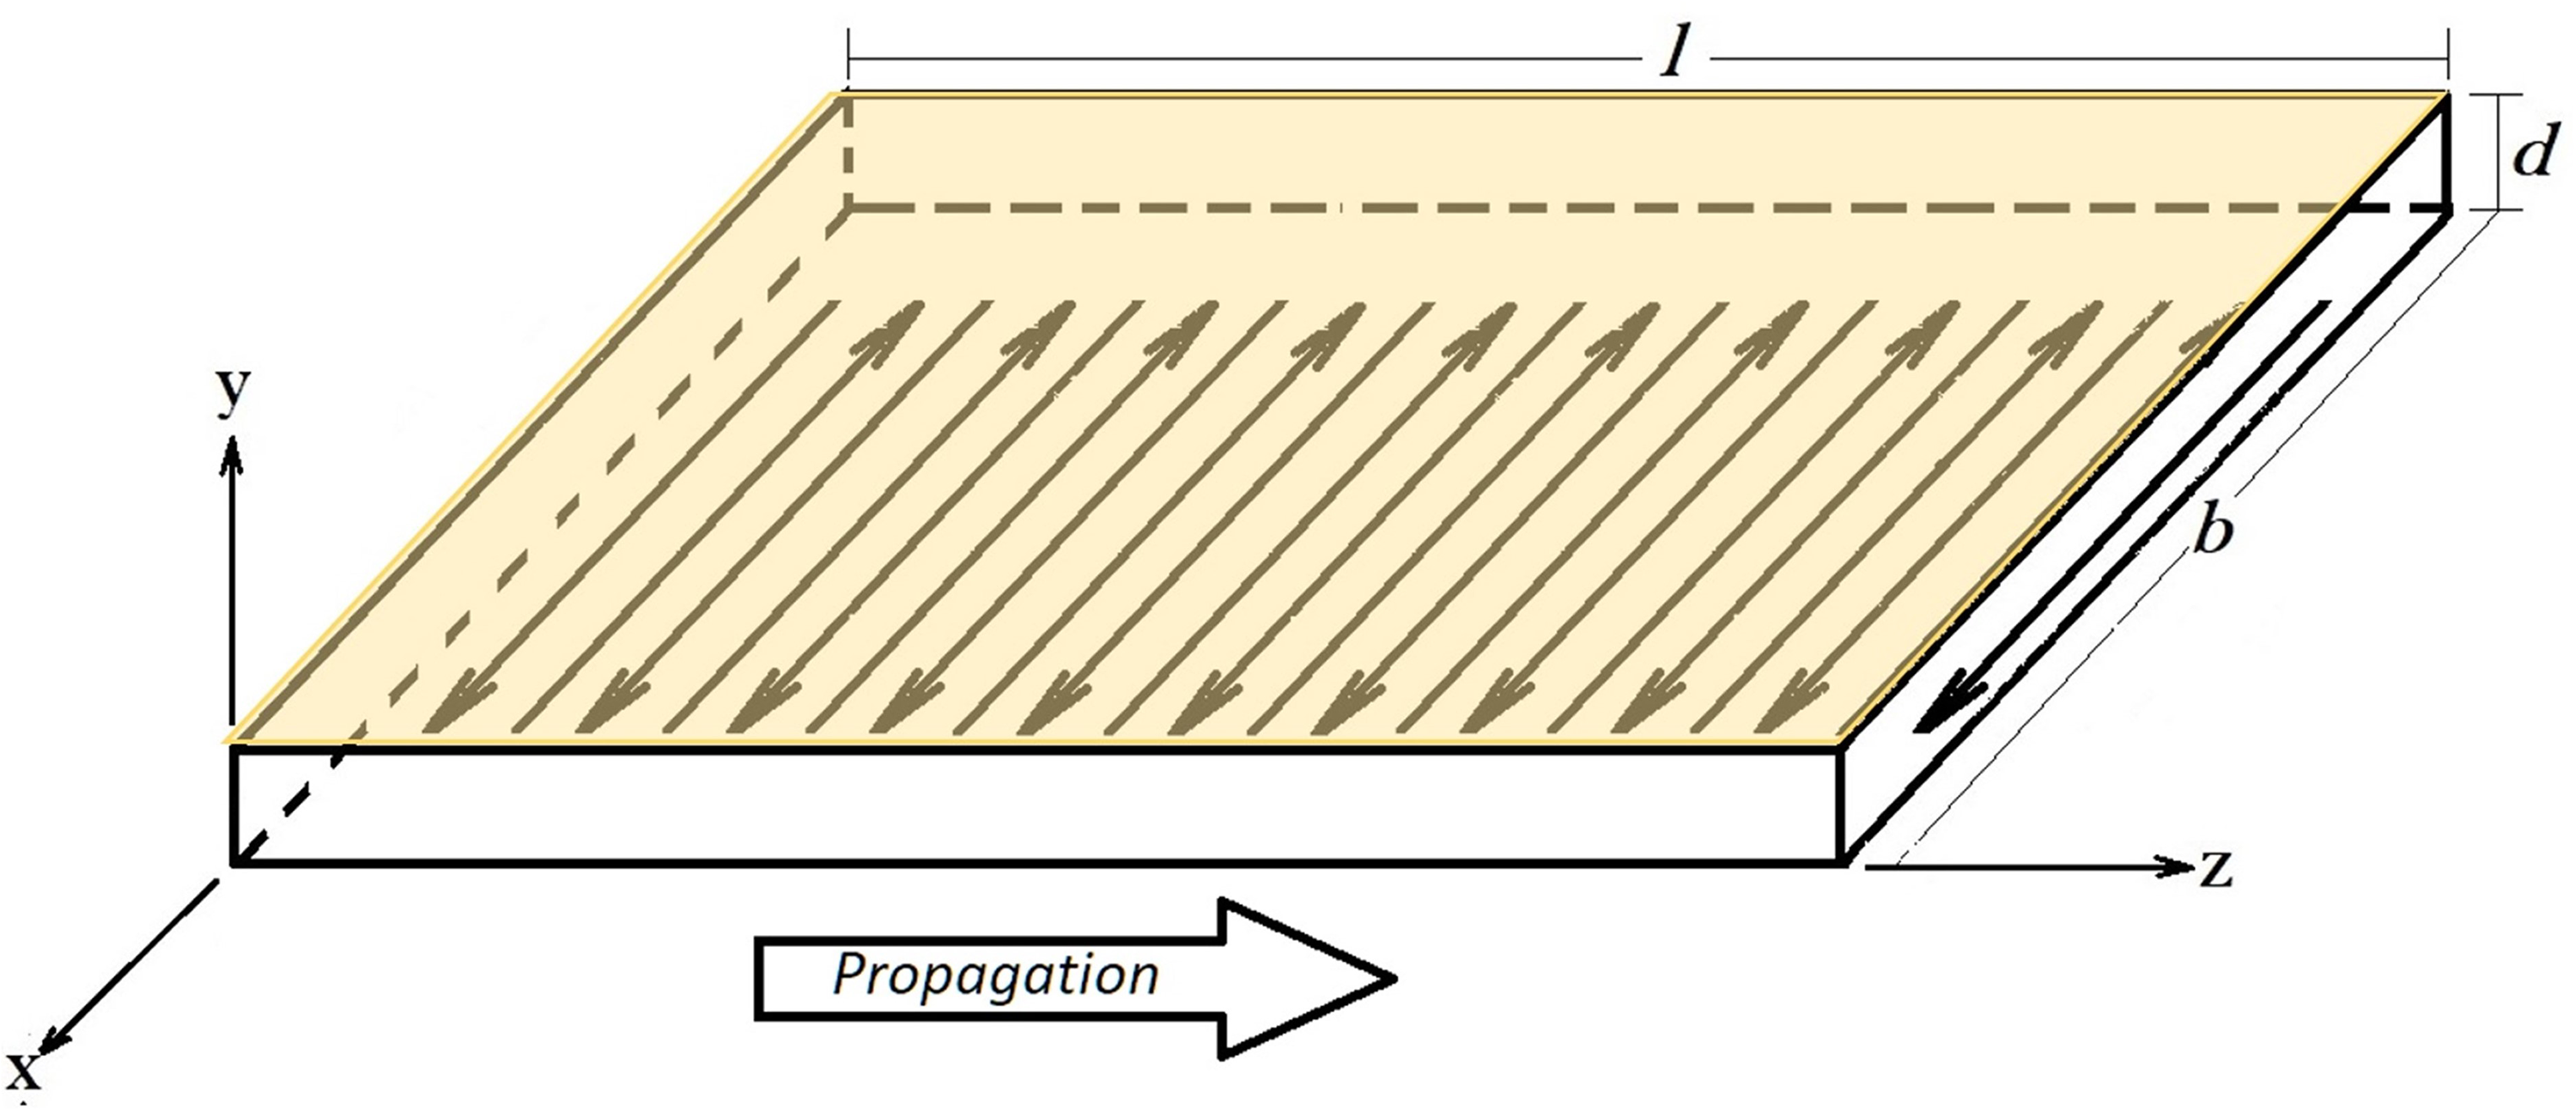
Illustration of the arrangement and the coordinates.
It is assumed that the liquid behaves as an incompressible, Newtonian liquid. The constitutive relationship between shear stresses and strains is given by:

When the particle velocity on the surface (xz-plane) is sufficient that a flow is generated in the liquid, the velocity field in the liquid can be described by
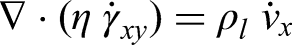
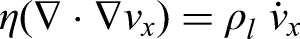
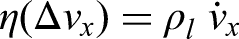
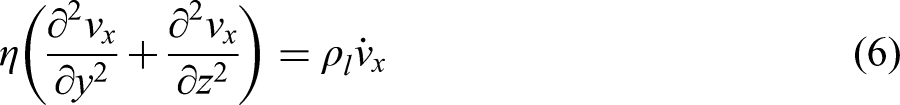

Substituting Equation (7) in (6), returns:
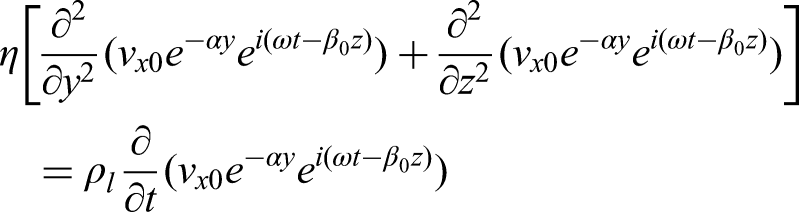


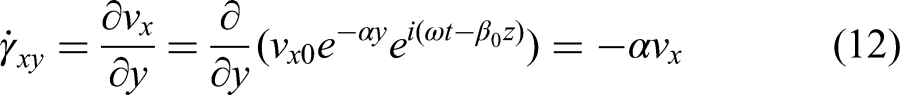
Noting that the shear strain can be expressed by the gradient of the liquid flow velocity, as:


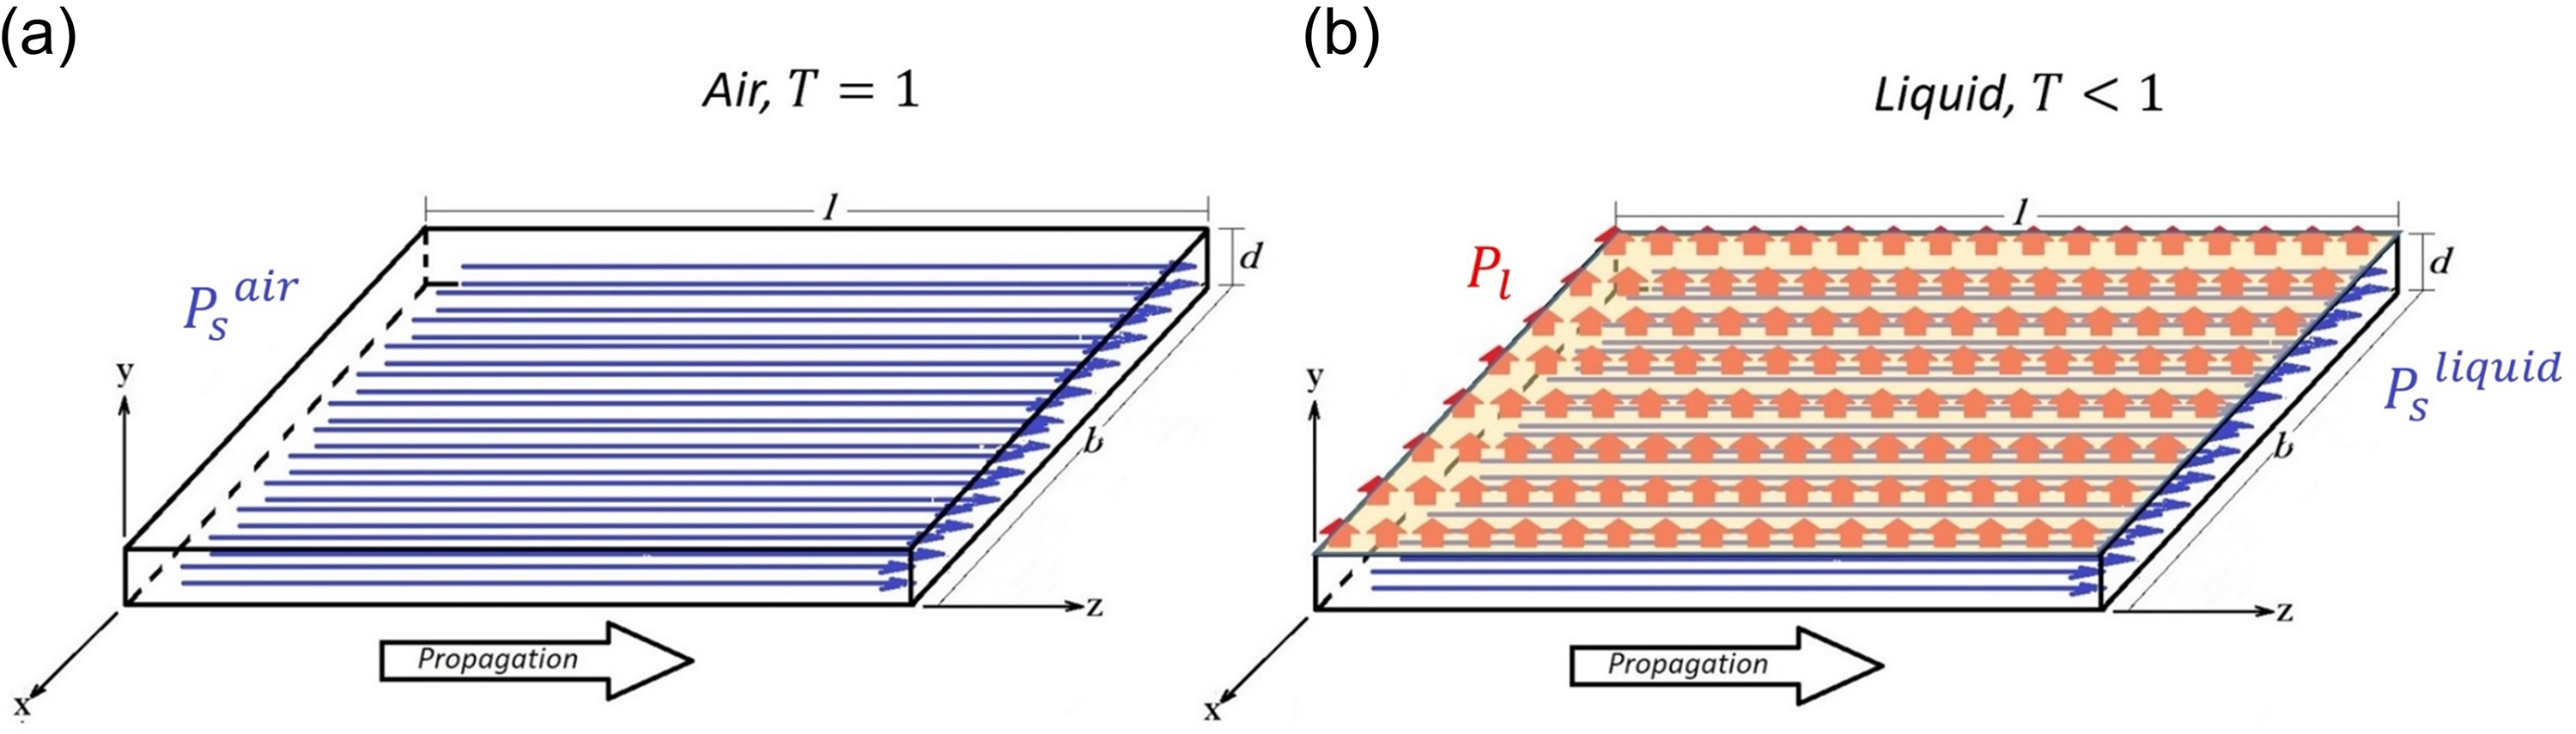
Power flow at (a) solid-air and (b) solid-liquid interfaces.
Substituting


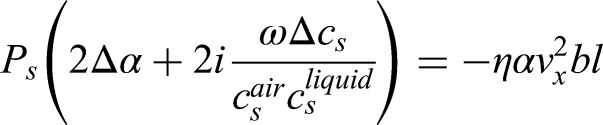
Conservation of energy requires the wave power lost in the liquid

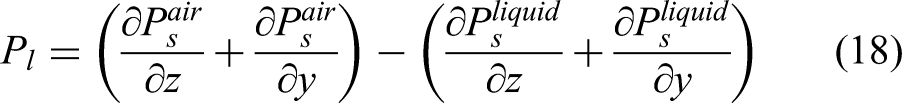
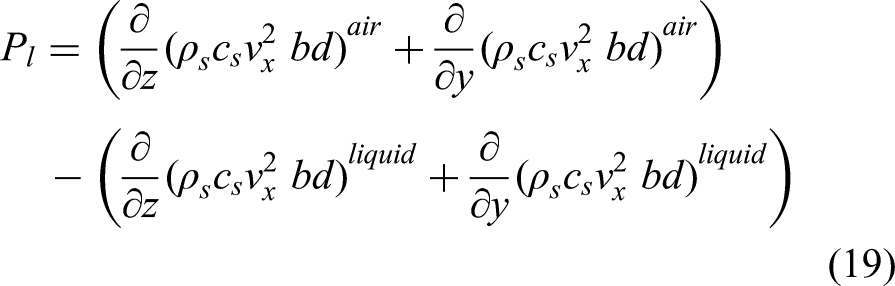
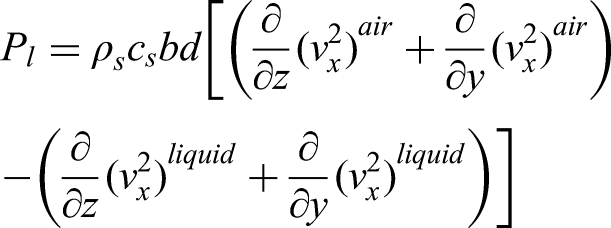

Substituting Equation (15) in (20), the expression for the wave power loss at the solid-liquid interface becomes:
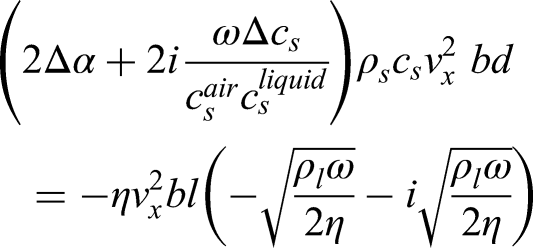
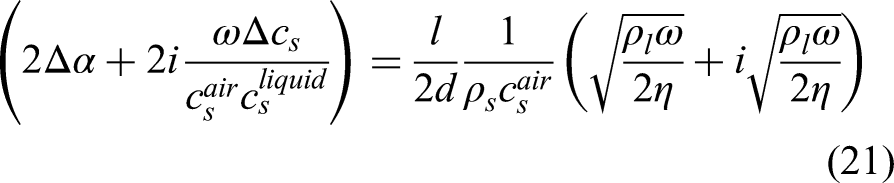
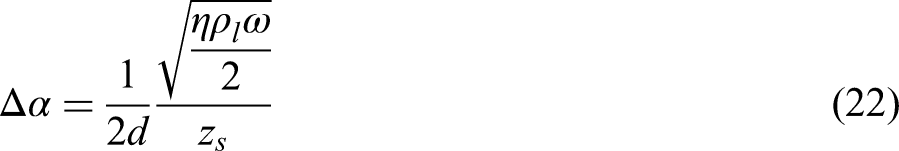
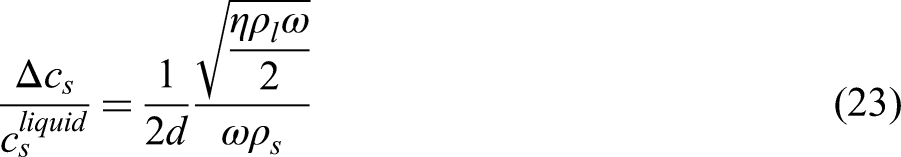
The attenuation of an SH-SAW travelling distance


Combining Equation (22) and (26), the attenuation of SH-SAWs over a distance l due to the viscous properties of a liquid, is given by:
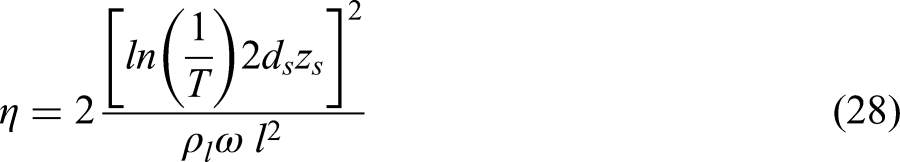
Relationship between SH-SAW transmission coefficient and viscosity for (a) 1 MHz propagating a 100 mm coupled with liquid on 2 mm thick media, (b) 0.5, 1.0 and 2.0 MHz propagating a 100 mm coupled with liquid on a 2 mm thick steel plate, (c) 2 MHz propagating a 100 mm coupled with liquid on 0.2, 2.0 and 20 mm thick steel plates, (d) 2 MHz propagating a 10, 100 and 1000 mm coupled with liquid on a 2 mm thick steel plate.
Graph Figure 4(a), shows that acoustically softer material (aluminium) presents better sensitivity to viscosity than hard materials (steel), as shown from the lower transmission coefficient values, when even small viscosity changes can be detected. Figure 4(b) shows that the sensitivity of any material can be improved by increasing the wave frequency, as shown in the case of steel. The sensitivity can be further increased by reducing the medium thickness and increasing the liquid path length, as shown in Figures 4(c) and Figure 4(d). In conclusion, maximum sensitivity is achieved for high frequency waves covering a long distance across thin, acoustically soft media, which is in agreement with the results reported in. 7
Experimental configuration
This section introduces the experimental arrangement for sending/receiving SH-SAWs and the signal processing techniques that were developed for measuring lubricant viscosity. A Brookfield rotational viscometer was used to validate the SH-SAW method for measuring oil viscosity on a flat steel plate. An ultrasonic shear viscometer as used in 5 was used to validate the SH-SAW method for measuring viscosity in-situ in an oil film.
Sensors and instrumentation
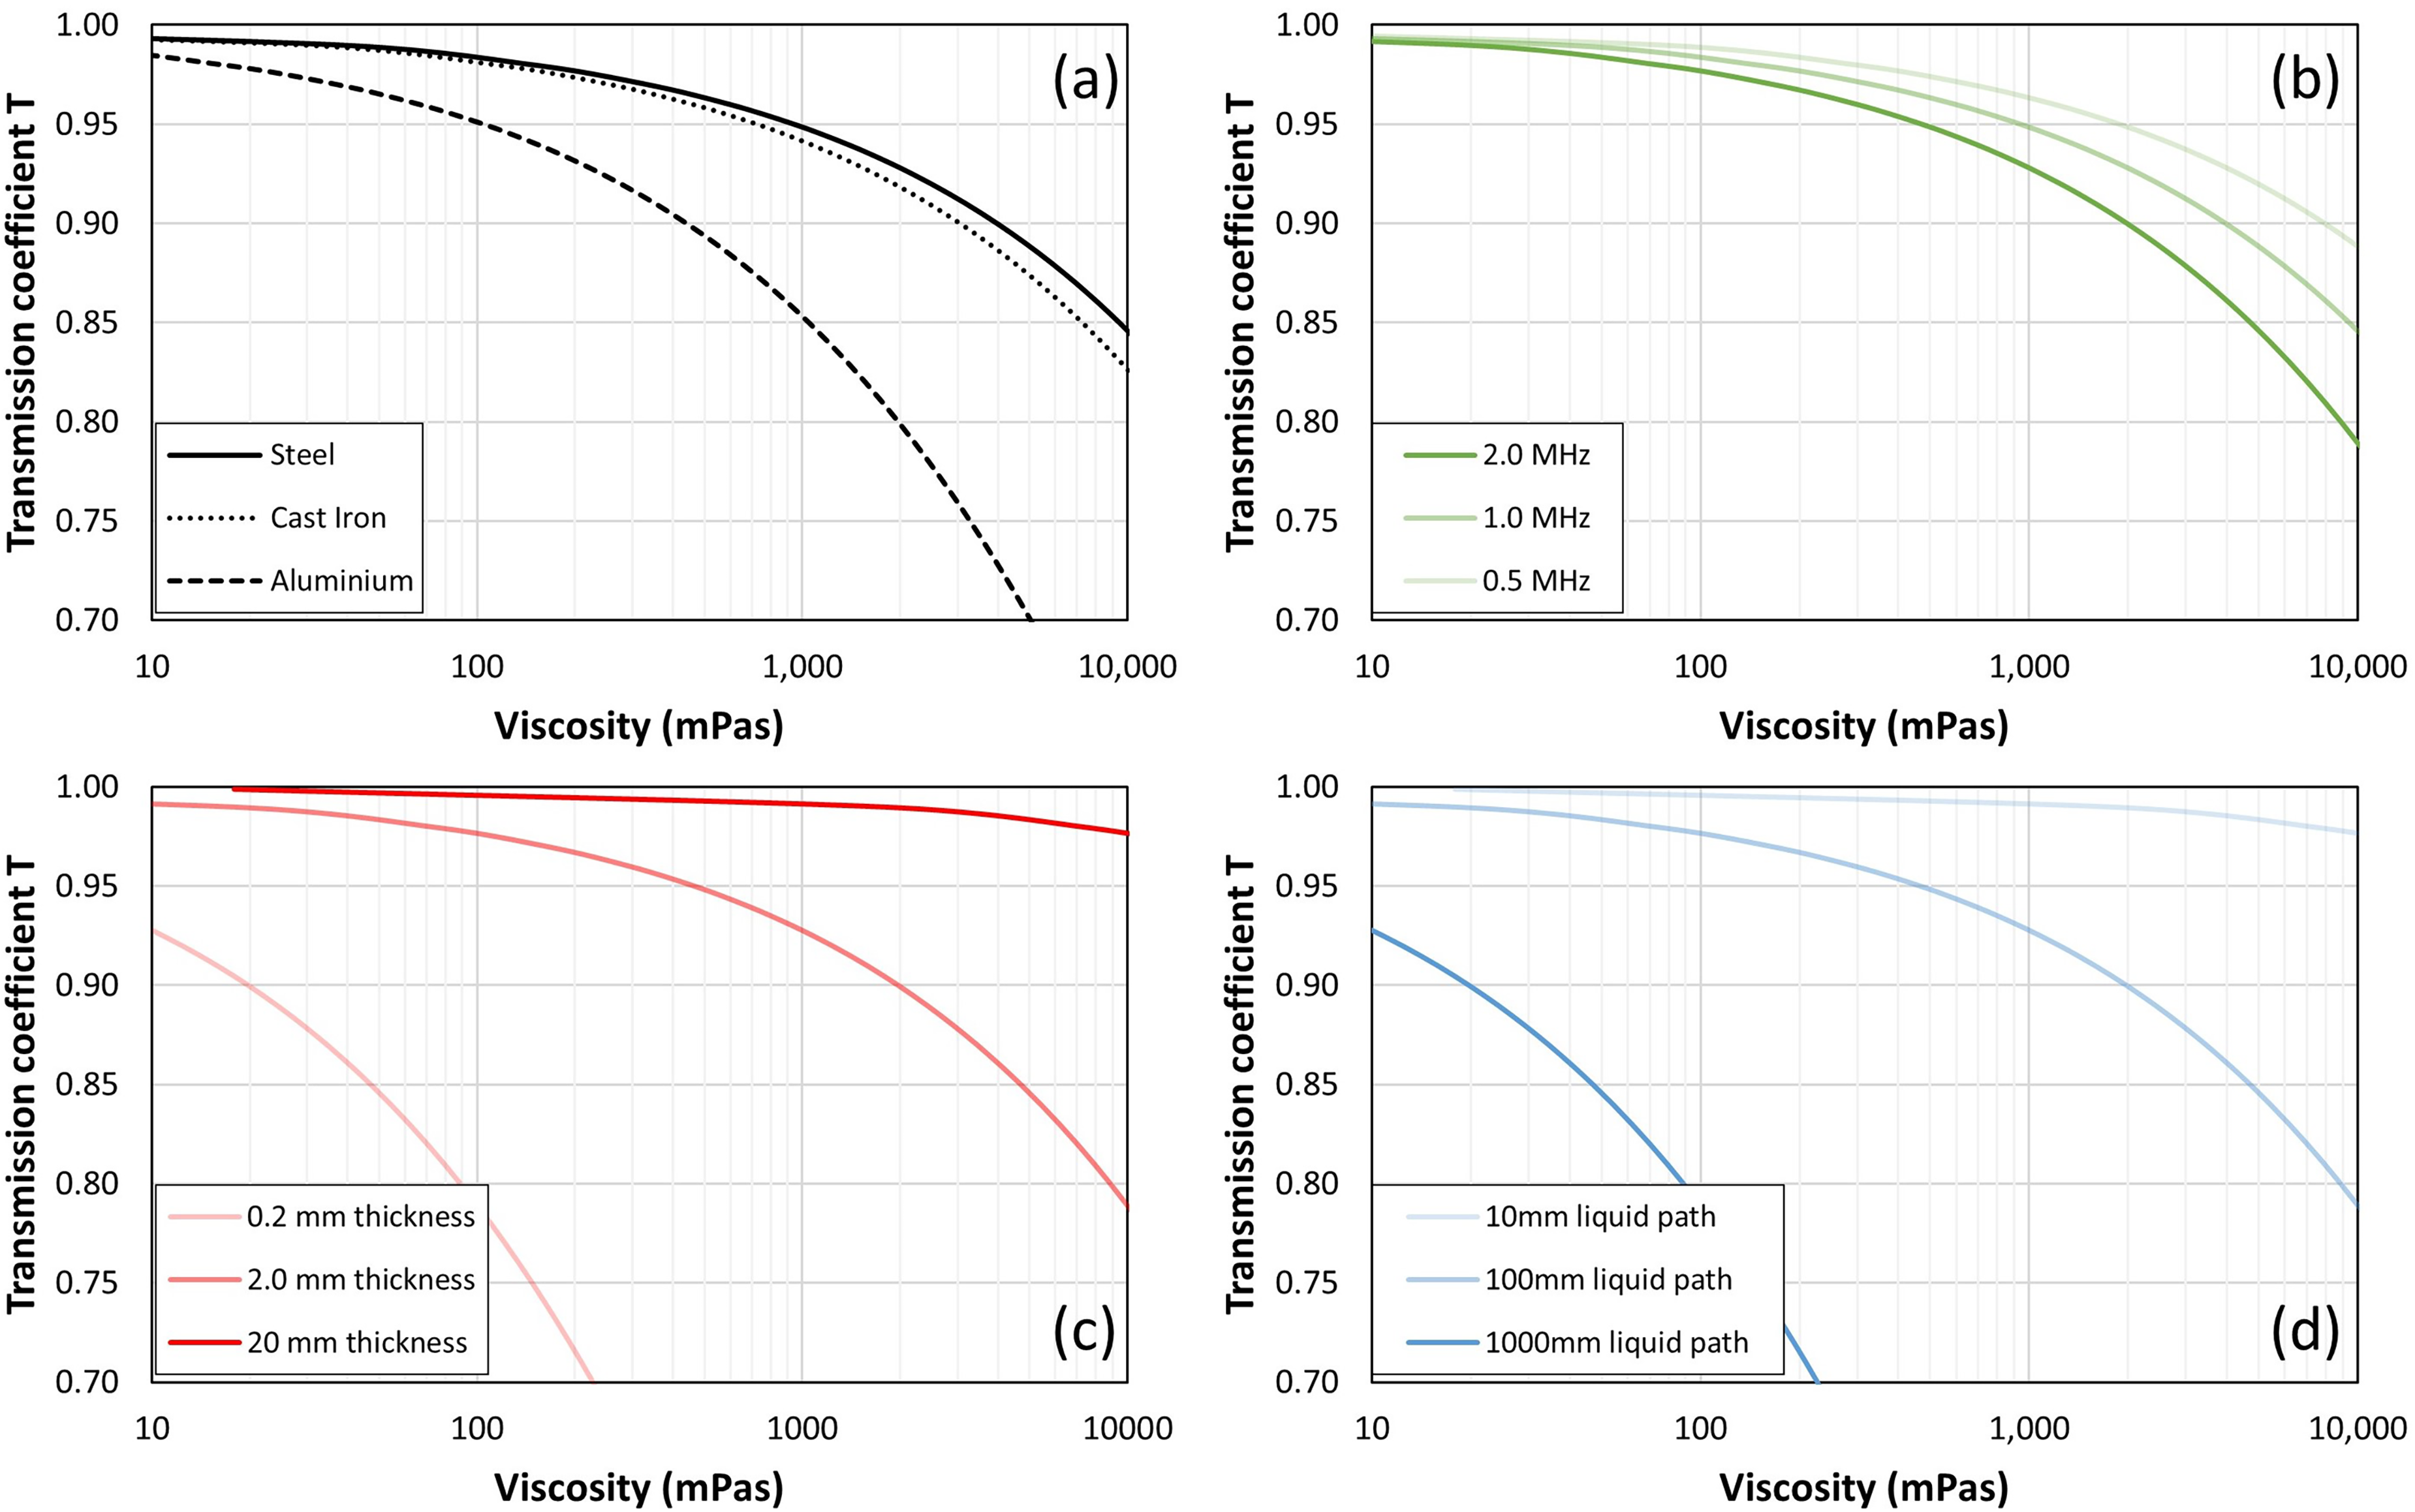
SH-SAWs were generated using wedge shaped delay lines. 18 The wedge angle is set to achieve a refracted wave that travels along the surface of the test medium (Figure 5(a)). Two pairs of polyacrylate angled transducers were built (Figure 5(b)) for bench-top testing, using 400 kHz and 2 MHz DL50 shear piezo-ceramics from Del Piezo, respectively. Snell's law dictated the angle of the polyacrylate wedge to be set to 24.55°, to allow generation of SH-SAWs on steel media. Another pair of aluminium angled transducers was built (Figure 5(c)) for journal-bearing testing, using 2 MHz shear piezo-ceramics, where the angle of the wedge was set to 64.6°.
(a) wave mode change due to refraction, (b) polyacrylate and (c) aluminium wedge shaped delay lines.
A shear BAW transducer was manufactured using an aluminium plug, instrumented with a 5 MHz shear piezo-ceramic, as shown in Figure 6, for journal-bearing testing. The matching layer was ground flush to the journal surface to ensure that it will not affect the fluid flow during testing, but the surface will be a little more compliant and potentially it could affect the film formation.
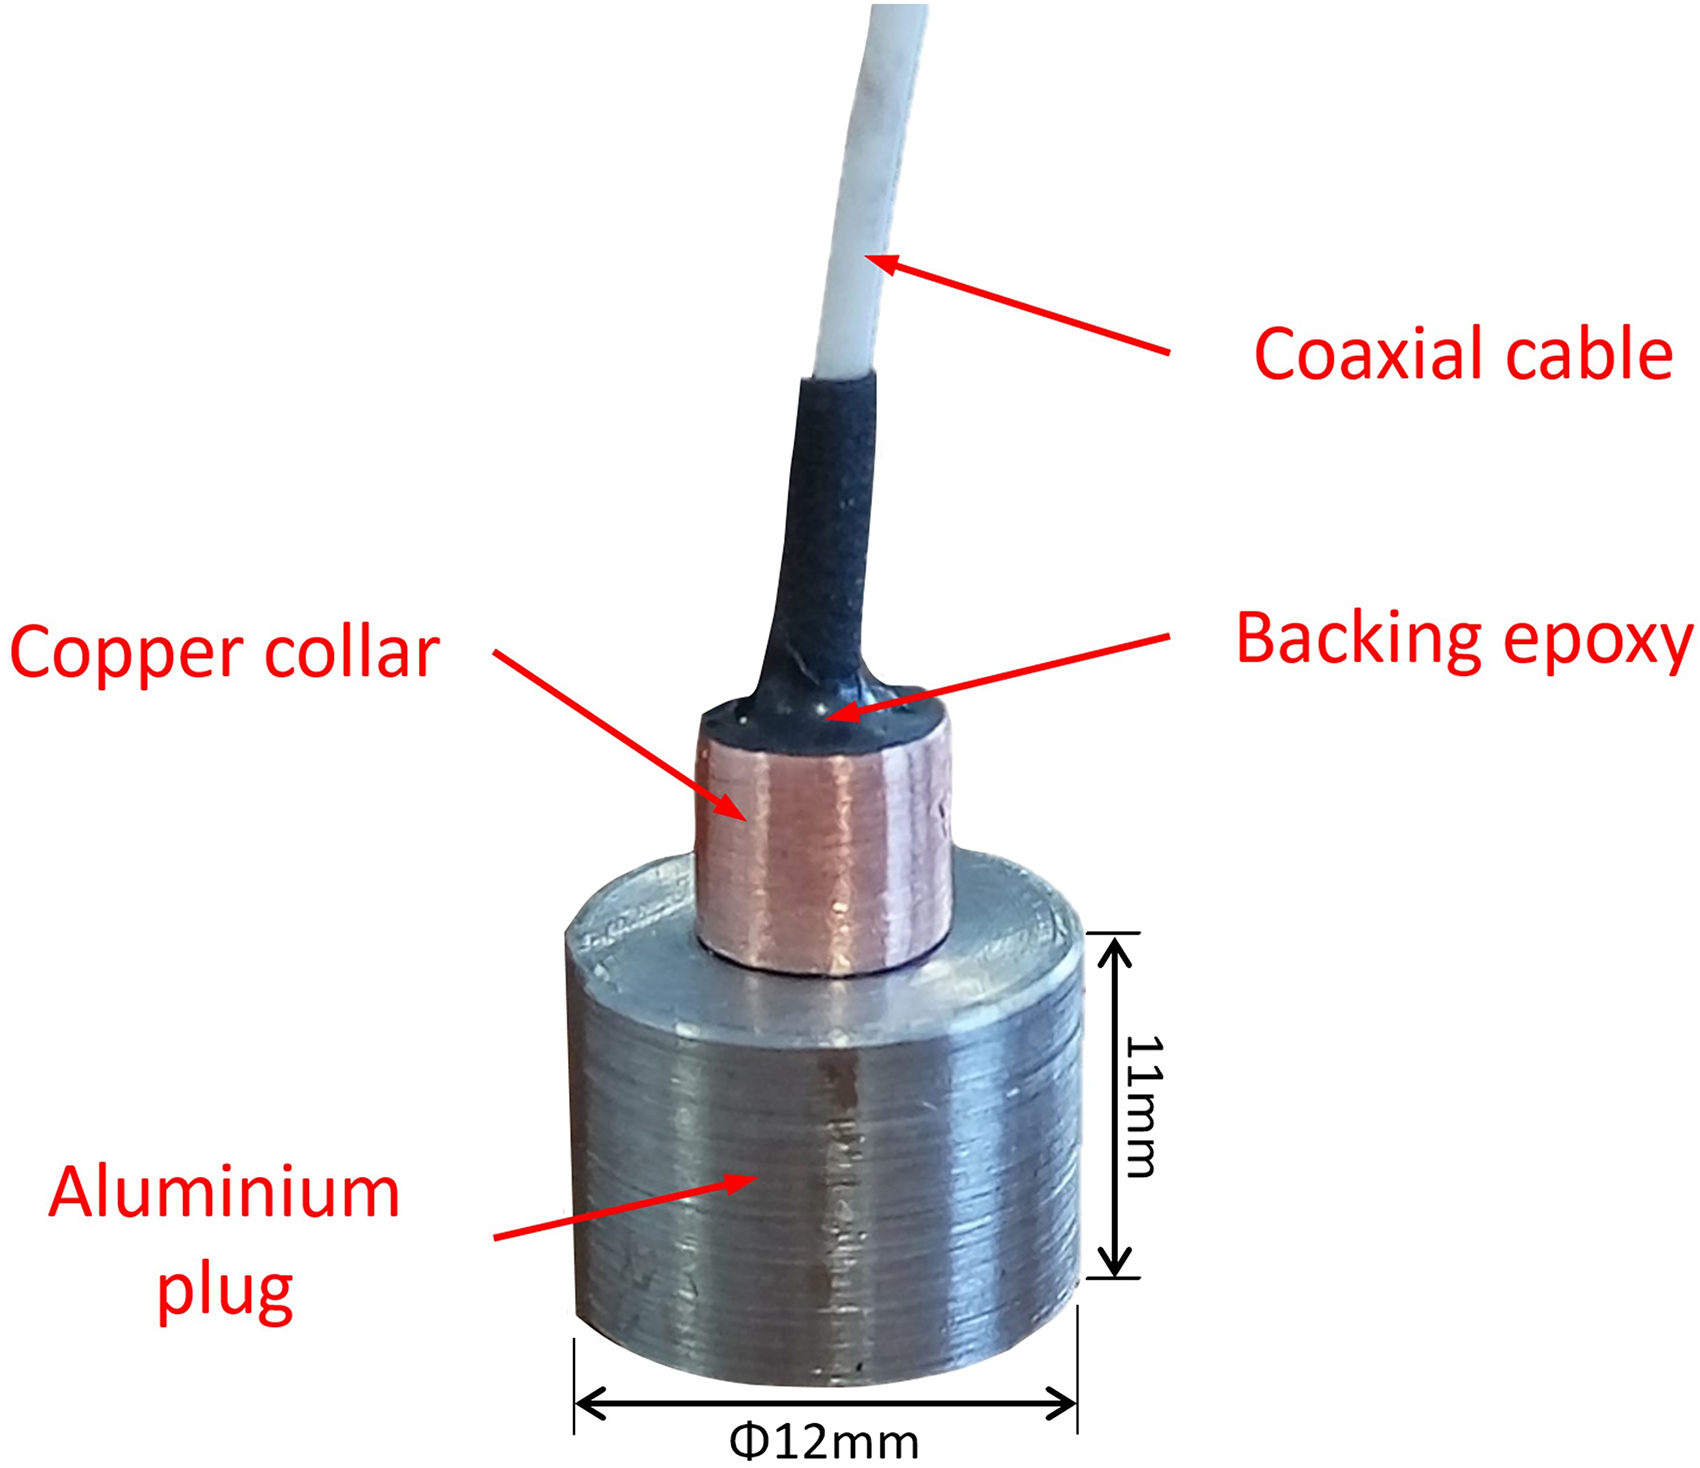
Ultrasonic shear transducer bonded to an aluminium plug.
The experimental ultrasonic apparatus for bench-top testing and journal-bearing testing, are shown schematically in Figure 7 and Figure 8, respectively. In both cases, angled transducers were bonded directly on the steel media, for generating SH-SAWs; one transducer was acting as the transmitter and the other as the receiver. The transmitters were driven by a function generator (TTI TG5011A), that was used to produce a burst sine pulse (sinusoidal pulse of finite duration), and the receivers were connected to a digitizer (Picoscope 5444D model) for data acquisition.
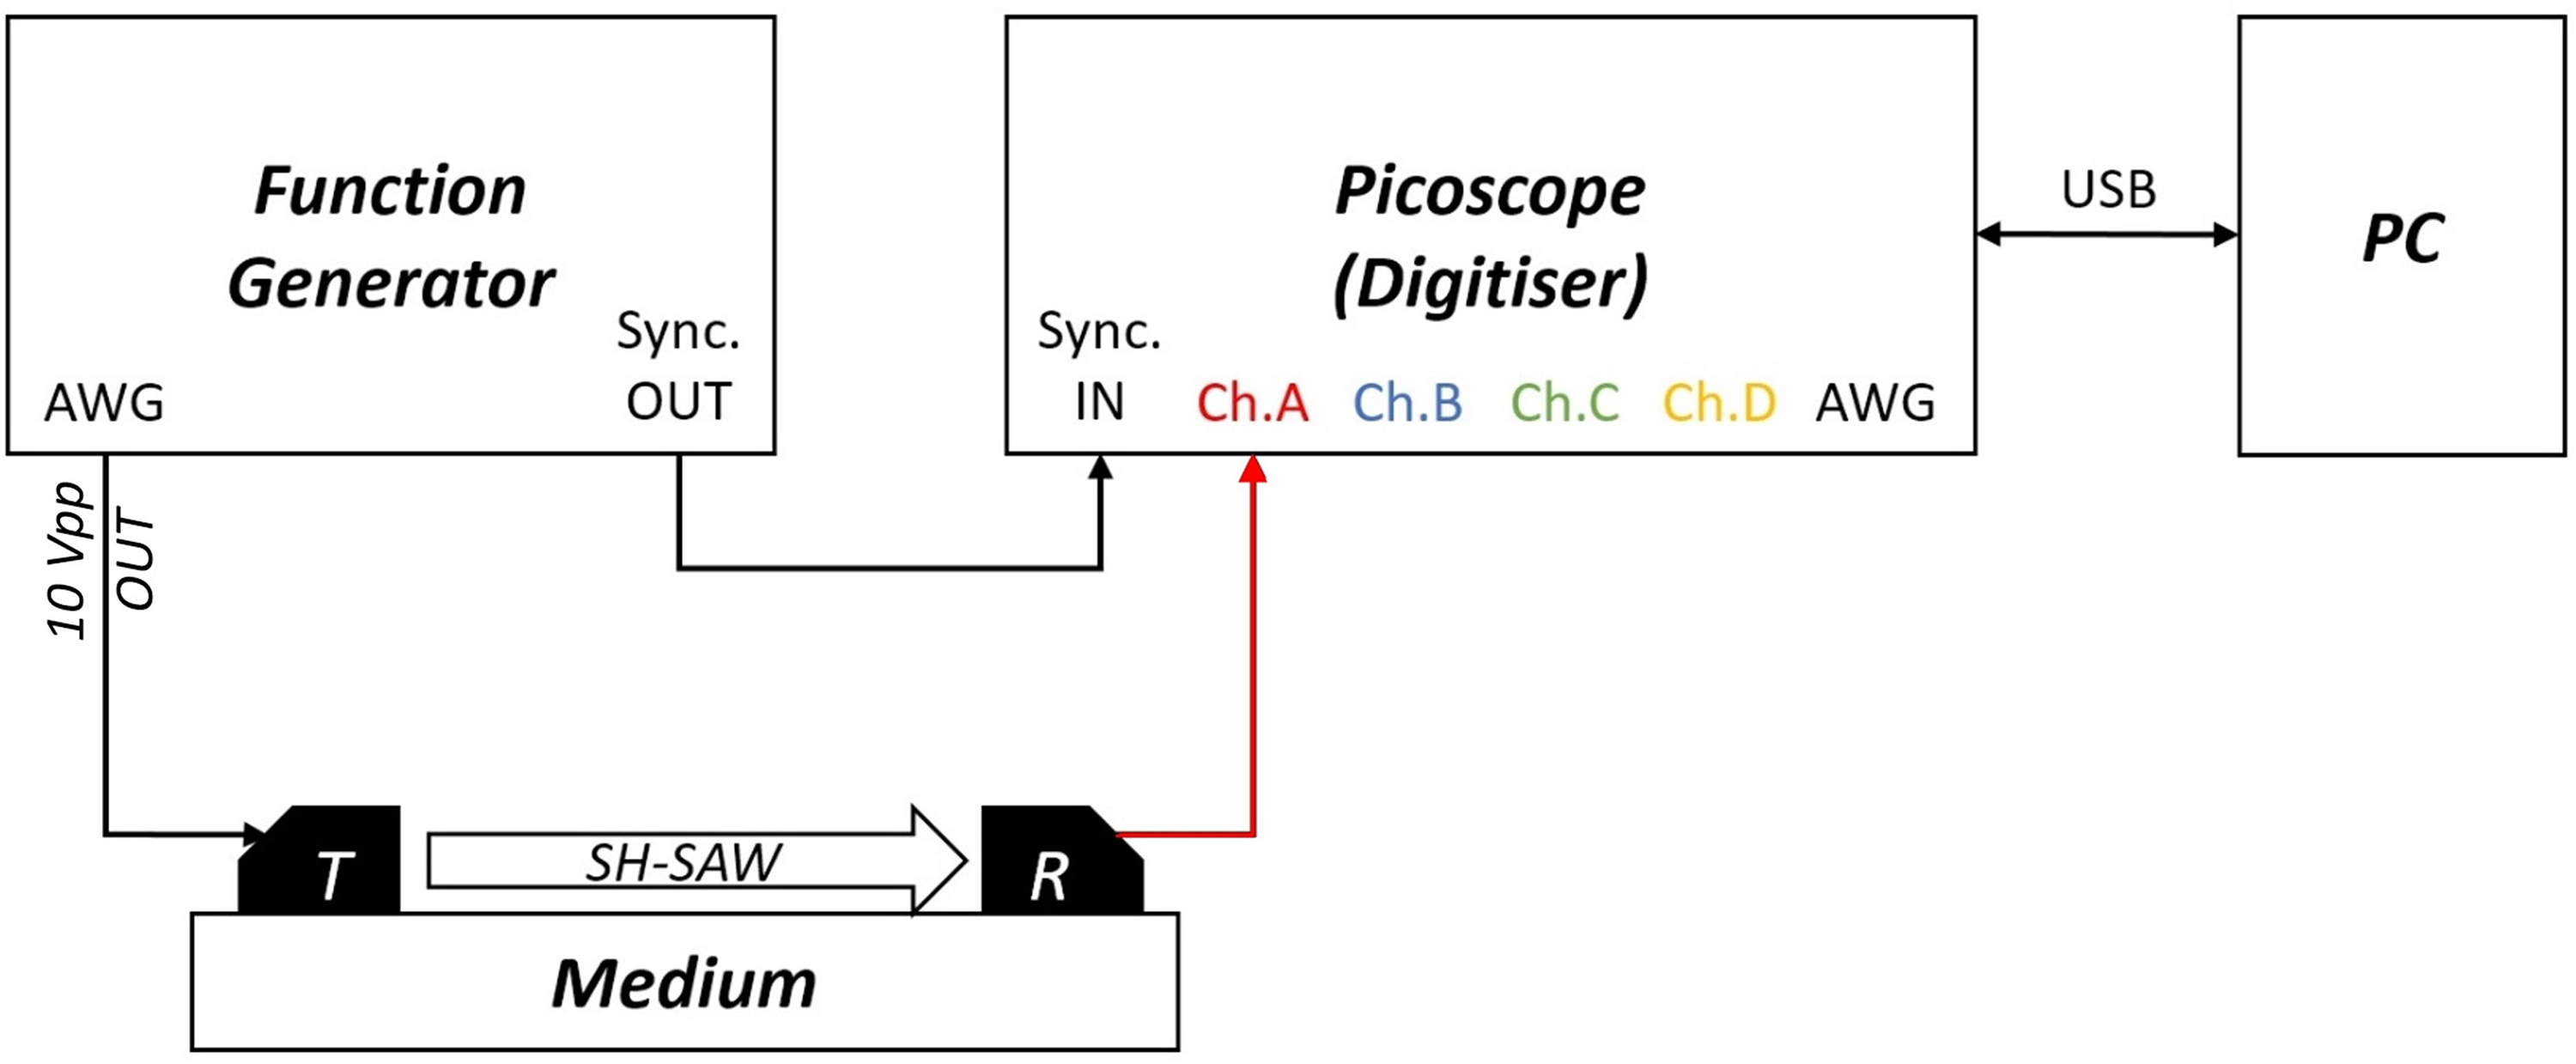
Experimental arrangement for measuring viscosity of oil coupled with a flat steel plate, using SH-SAWs.
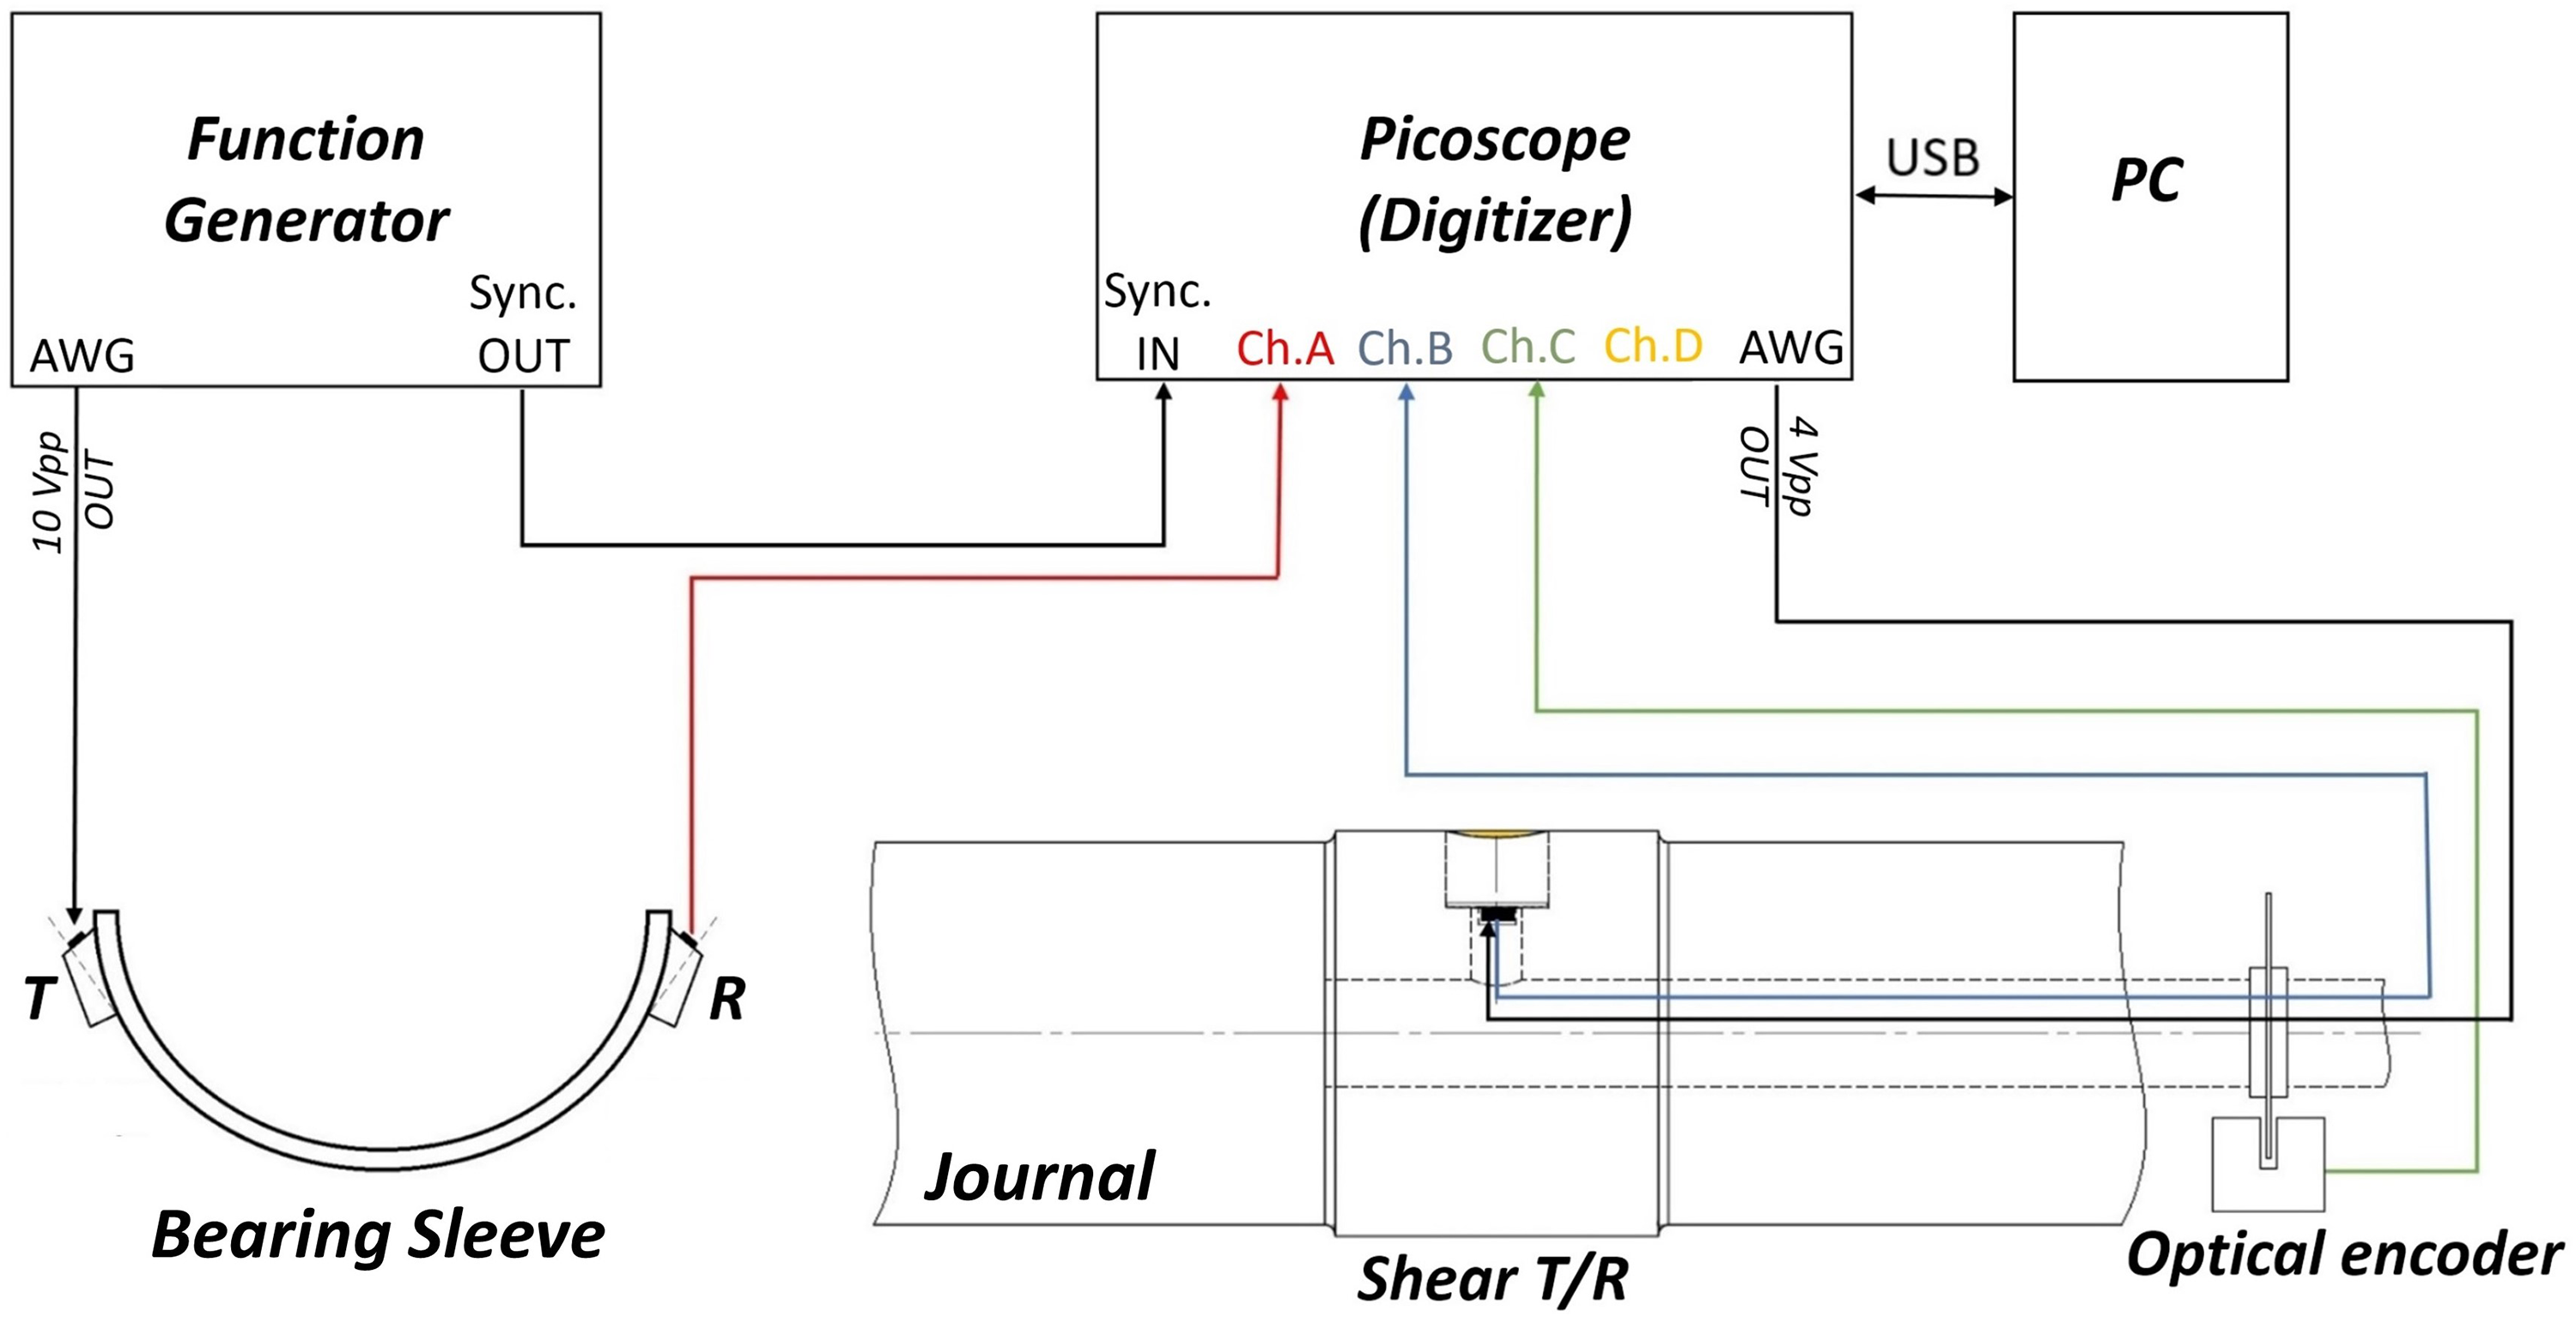
Experimental arrangement for measuring oil film viscosity in-situ in a journal-bearing, using SH-SAWs and shear BAWs.
In the bearing sleeve, the Picoscope arbitrary waveform generator was also used to excite the shear BAW transducer. Two waveforms generators were required to excite the SH-SAW and shear transducers individually, due to the different piezo-element frequencies and number of pulse cycles. Both the SH-SAW and shear BAW receivers were connected to the digitiser and the signals acquired simultaneously, along with the signal from an optical encoder, which was installed for locating the shear BAW transducer while the journal rotated.
Test samples
Solid media
Two solid media were used for testing; a flat steel plate and a steel bearing sleeve (dimensions given in Table 1). The steel plate was instrumented with the polyacrylate SH-SAW transducers for bench top testing of oil film viscosity (Figure 9).
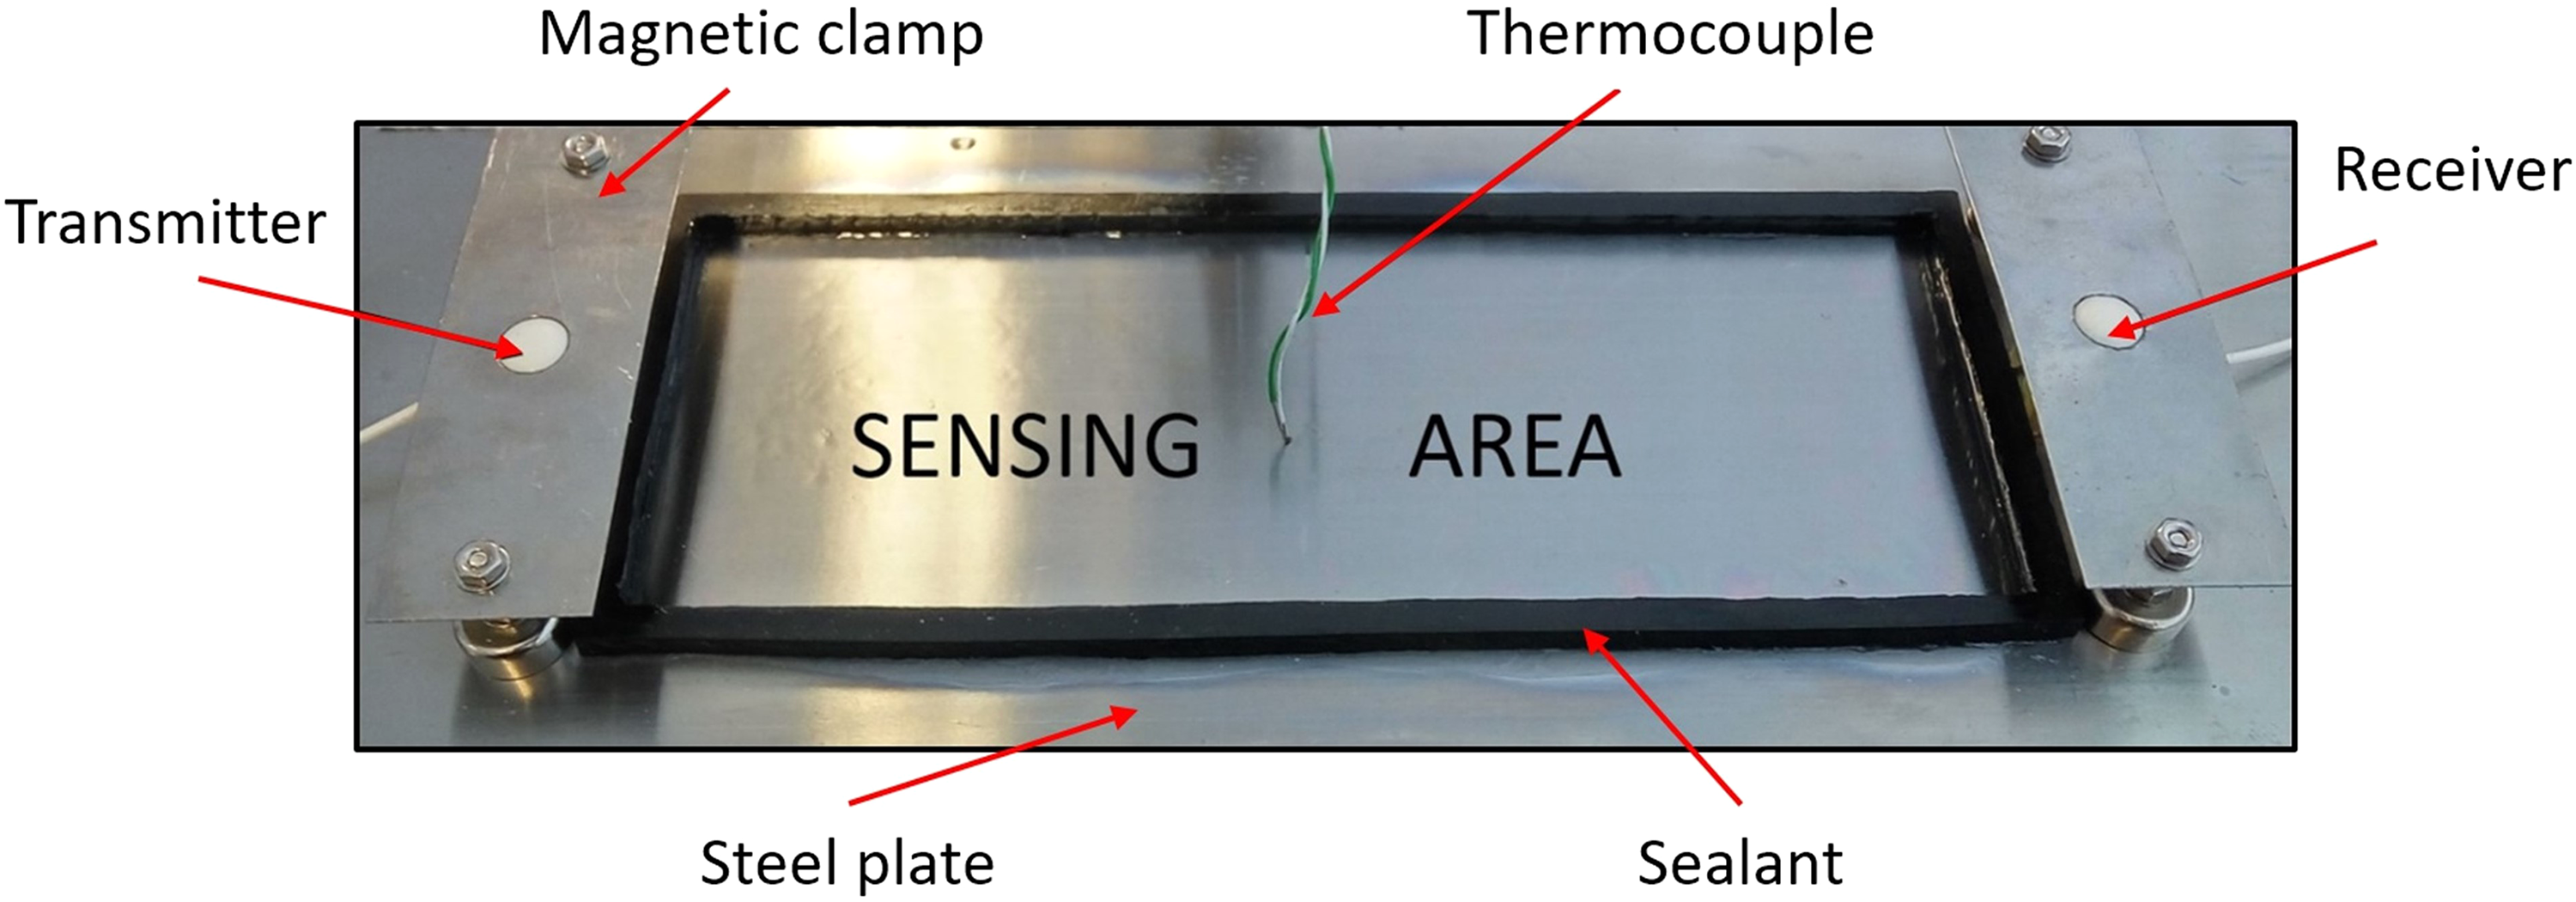
Steel plate instrumentation for bench top testing.
Solid media specifications.
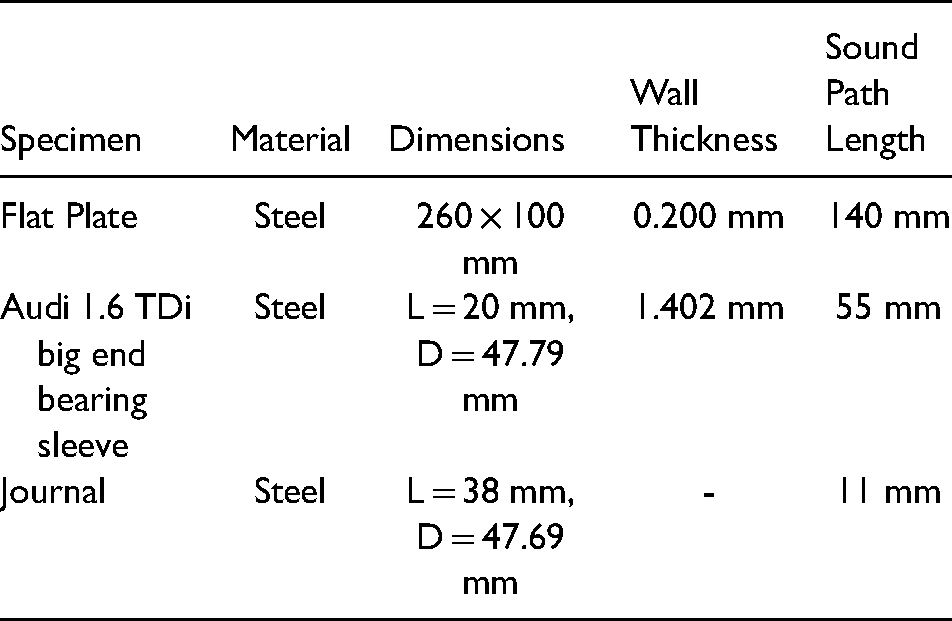
The bearing sleeve was instrumented with the aluminium SH-SAW transducers, for testing oil film viscosity in-situ in a rotating journal bearing (Figure 10(a)). The bearing shaft was also instrumented; a shear BAW transducer was mounted on a plug press fitted into the shaft and ground flush. After grinding, the transducer was further pushed inside the journal and a polyimide layer was bonded on it, as shown in Figure 10(b).
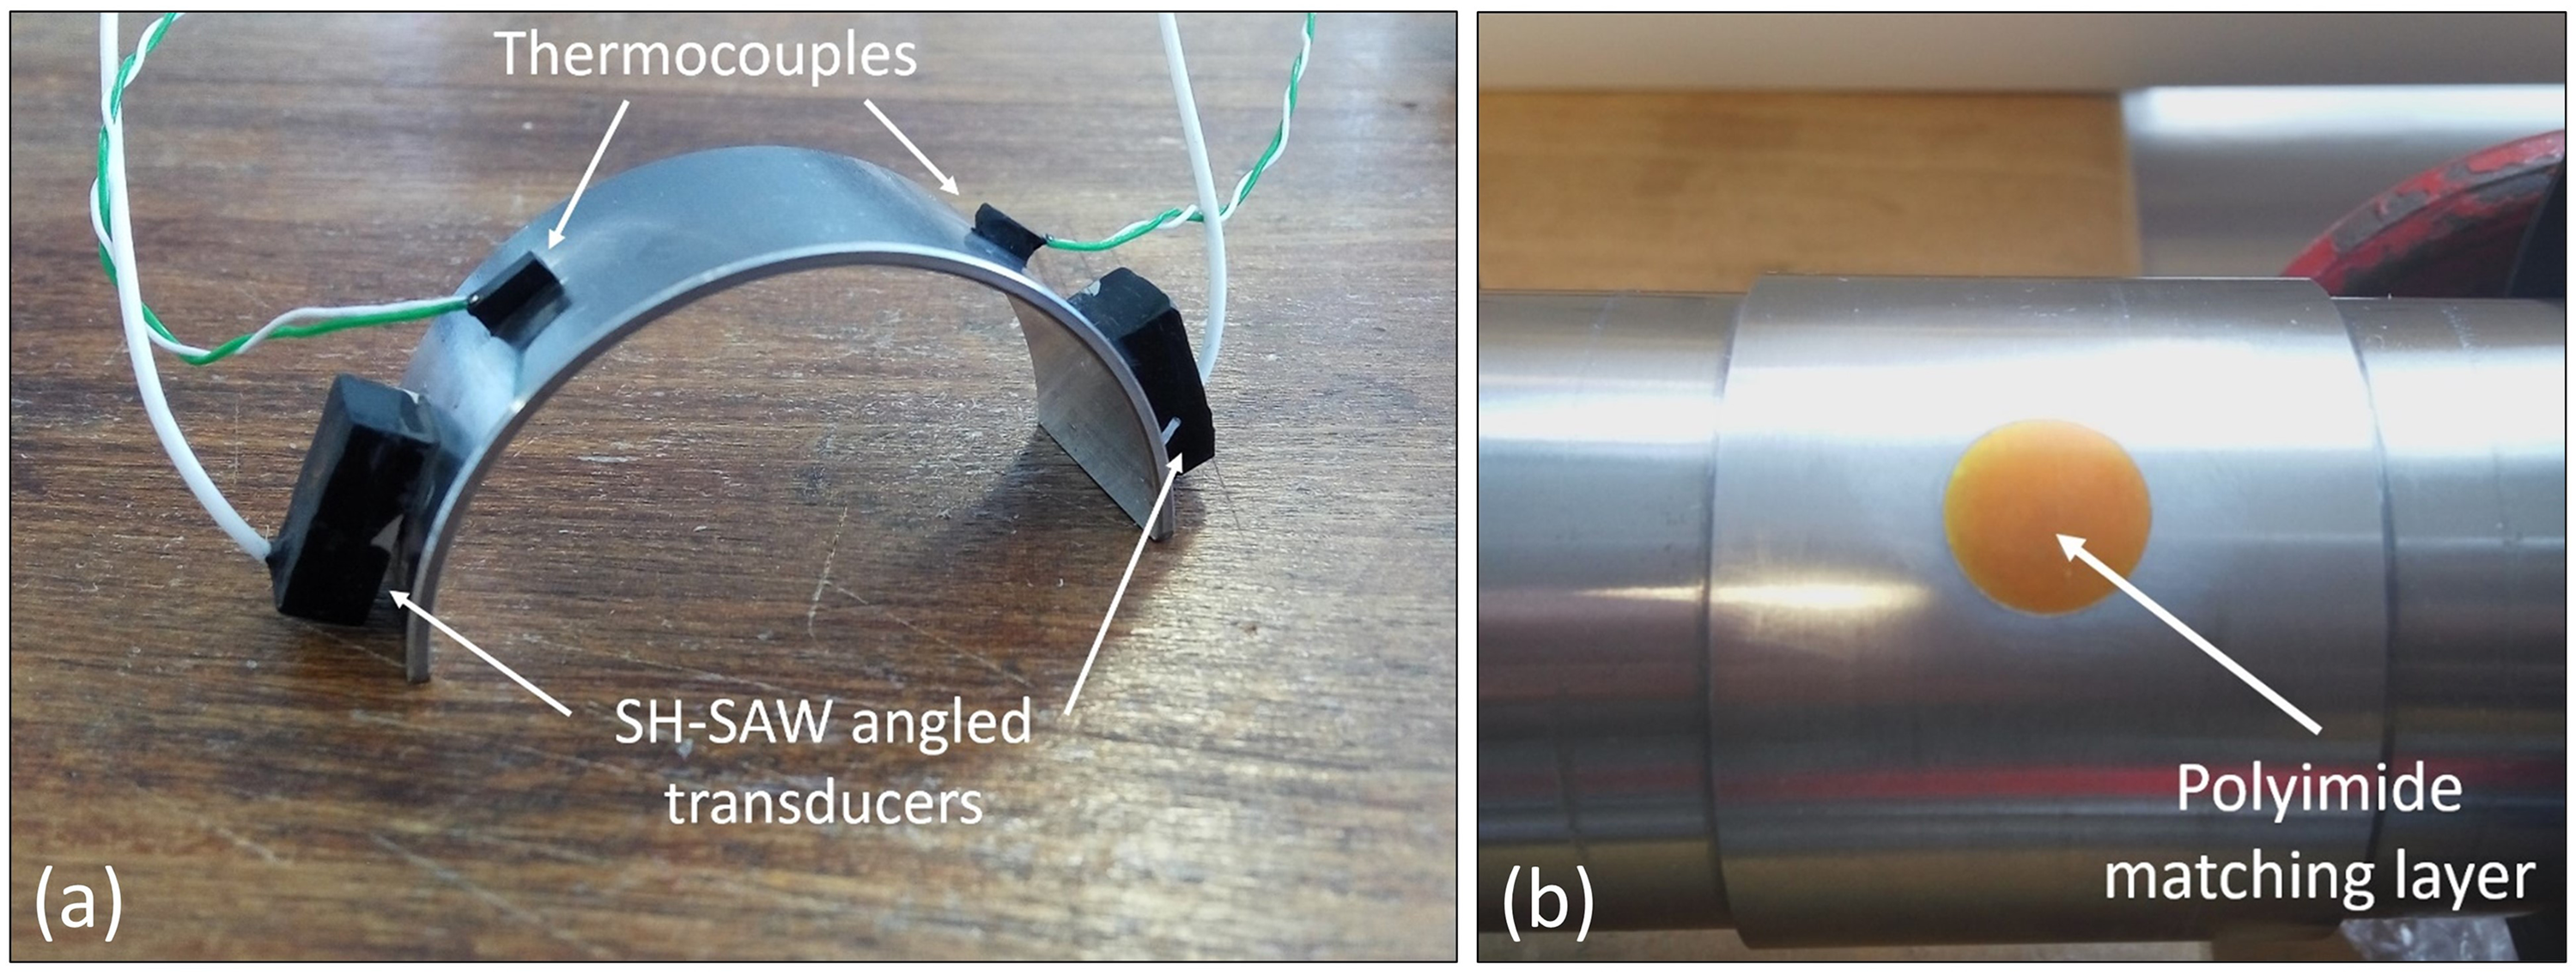
(a) bearing sleeve instrumentation with aluminium angled SH-SAW transducers, and (b) steel journal instrumentation with shear BAW transducer, for in-situ oil film testing.
Lubricating oils
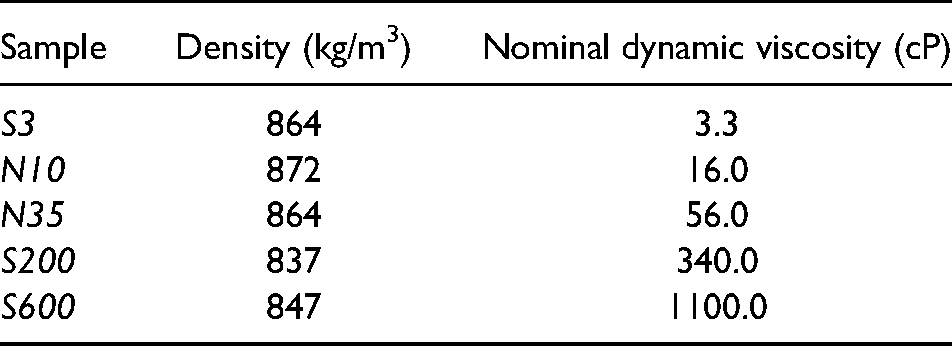
In order to validate the SH-SAW method for measuring lubricant viscosity, several calibration oils of different viscosities were tested on the flat steel plate. The Cannon viscosity standard lubricants S3, N10, N35, S200 and S600 samples, 19 the properties of which can be seen in Table 2, were tested at both 400 kHz and 2 MHz. As these lubricants are considered to be Newtonian under the conditions of the test, their viscosities should be independent of the shear rate and hence the wave frequency.
Cannon viscosity standard lubricants properties at 25°C. 19
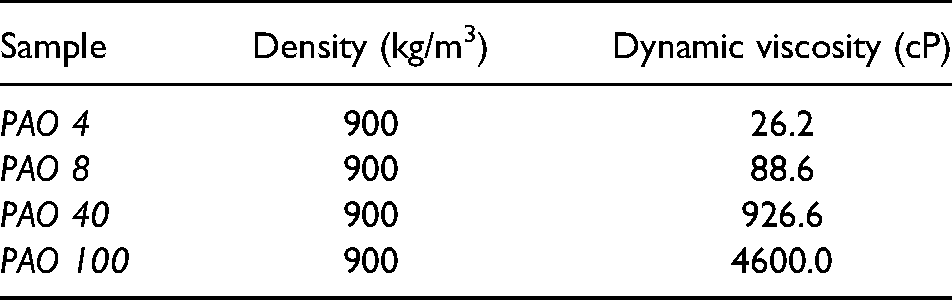
In reality, most lubricants are non-Newtonian liquids and the oil viscosity is a function of the shear rate. Four polyalphaolefins (PAOs) (provided by Lubrizol Ltd) of different viscosities were tested on the flat steel plate (Table 3). The PAO viscosity is determined by the number of dec-1-ene chains in the molecules; more dec-1-ene chains lead to higher viscosity, hence greater resistance against the applied shear stresses. PAO 4 and PAO 8 are considered to be Newtonian liquids due to the lower number of dec-1-ene chains in the molecules, whereas PAO 40 and PAO 100 exhibit a non-Newtonian behaviour. Similarly, the oil samples were tested at both 400 kHz and 2 MHz, to distinguish differences between Newtonian and non-Newtonian oils.
PAO lubricant viscosity at 25°C, as measured with a brookfield rotational viscometer.
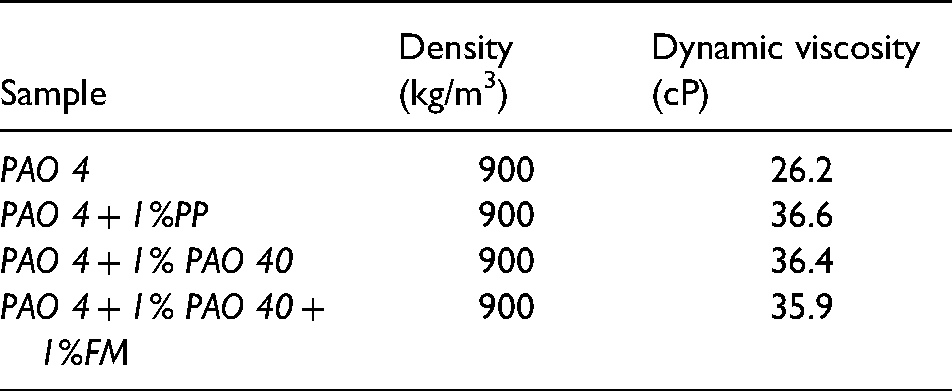
In most applications, lubricant oils are blended with additives to add new properties or enhance existing ones. Four PAO 4 blends (Table 4), provided by Lubrizol Ltd, were tested in the journal bearing to explore the capabilities of the SH-SAW method to distinguish the different composition of the oil samples. In Table 4, the PP and FM refer to Performance Polymers and Friction Modifiers respectively, both widely used in engine oils. In order to allow for comparison between PAO 4 blends, they were formulated to have similar viscosities. The addition of PPs though, has led to a viscous blend. In order to match the PAO 4 + 1% (w/w) PP's viscosity, 1% (w/w) PAO 40 was added to the PAO 4 + 1% (w/w) FM blend to act as a viscosity modifier. The concentration of the different additives in the PAO 4 was selected to be similar to that used in formulated engine oils, for more representative results.
PAO blends’ properties at 25°C, as measured with a brookfield rotational viscometer.
Signal processing
Here we demonstrate the signal processing required to extract viscosity from the surface wave and the bulk wave methods. Figure 11 shows two raw received signals (A-scans) from (a) the SH-SAW case on a flat plate, and (b) the BAW case from the journal bearing shaft. In both cases it is necessary to extract the part of the waveform of interest, as different wave modes will respond differently to the liquid viscosity. In the SH-SAW, that is the fundamental SH0 mode wave. In the BAW case it is the 1st shear reflection from the solid-oil interface.
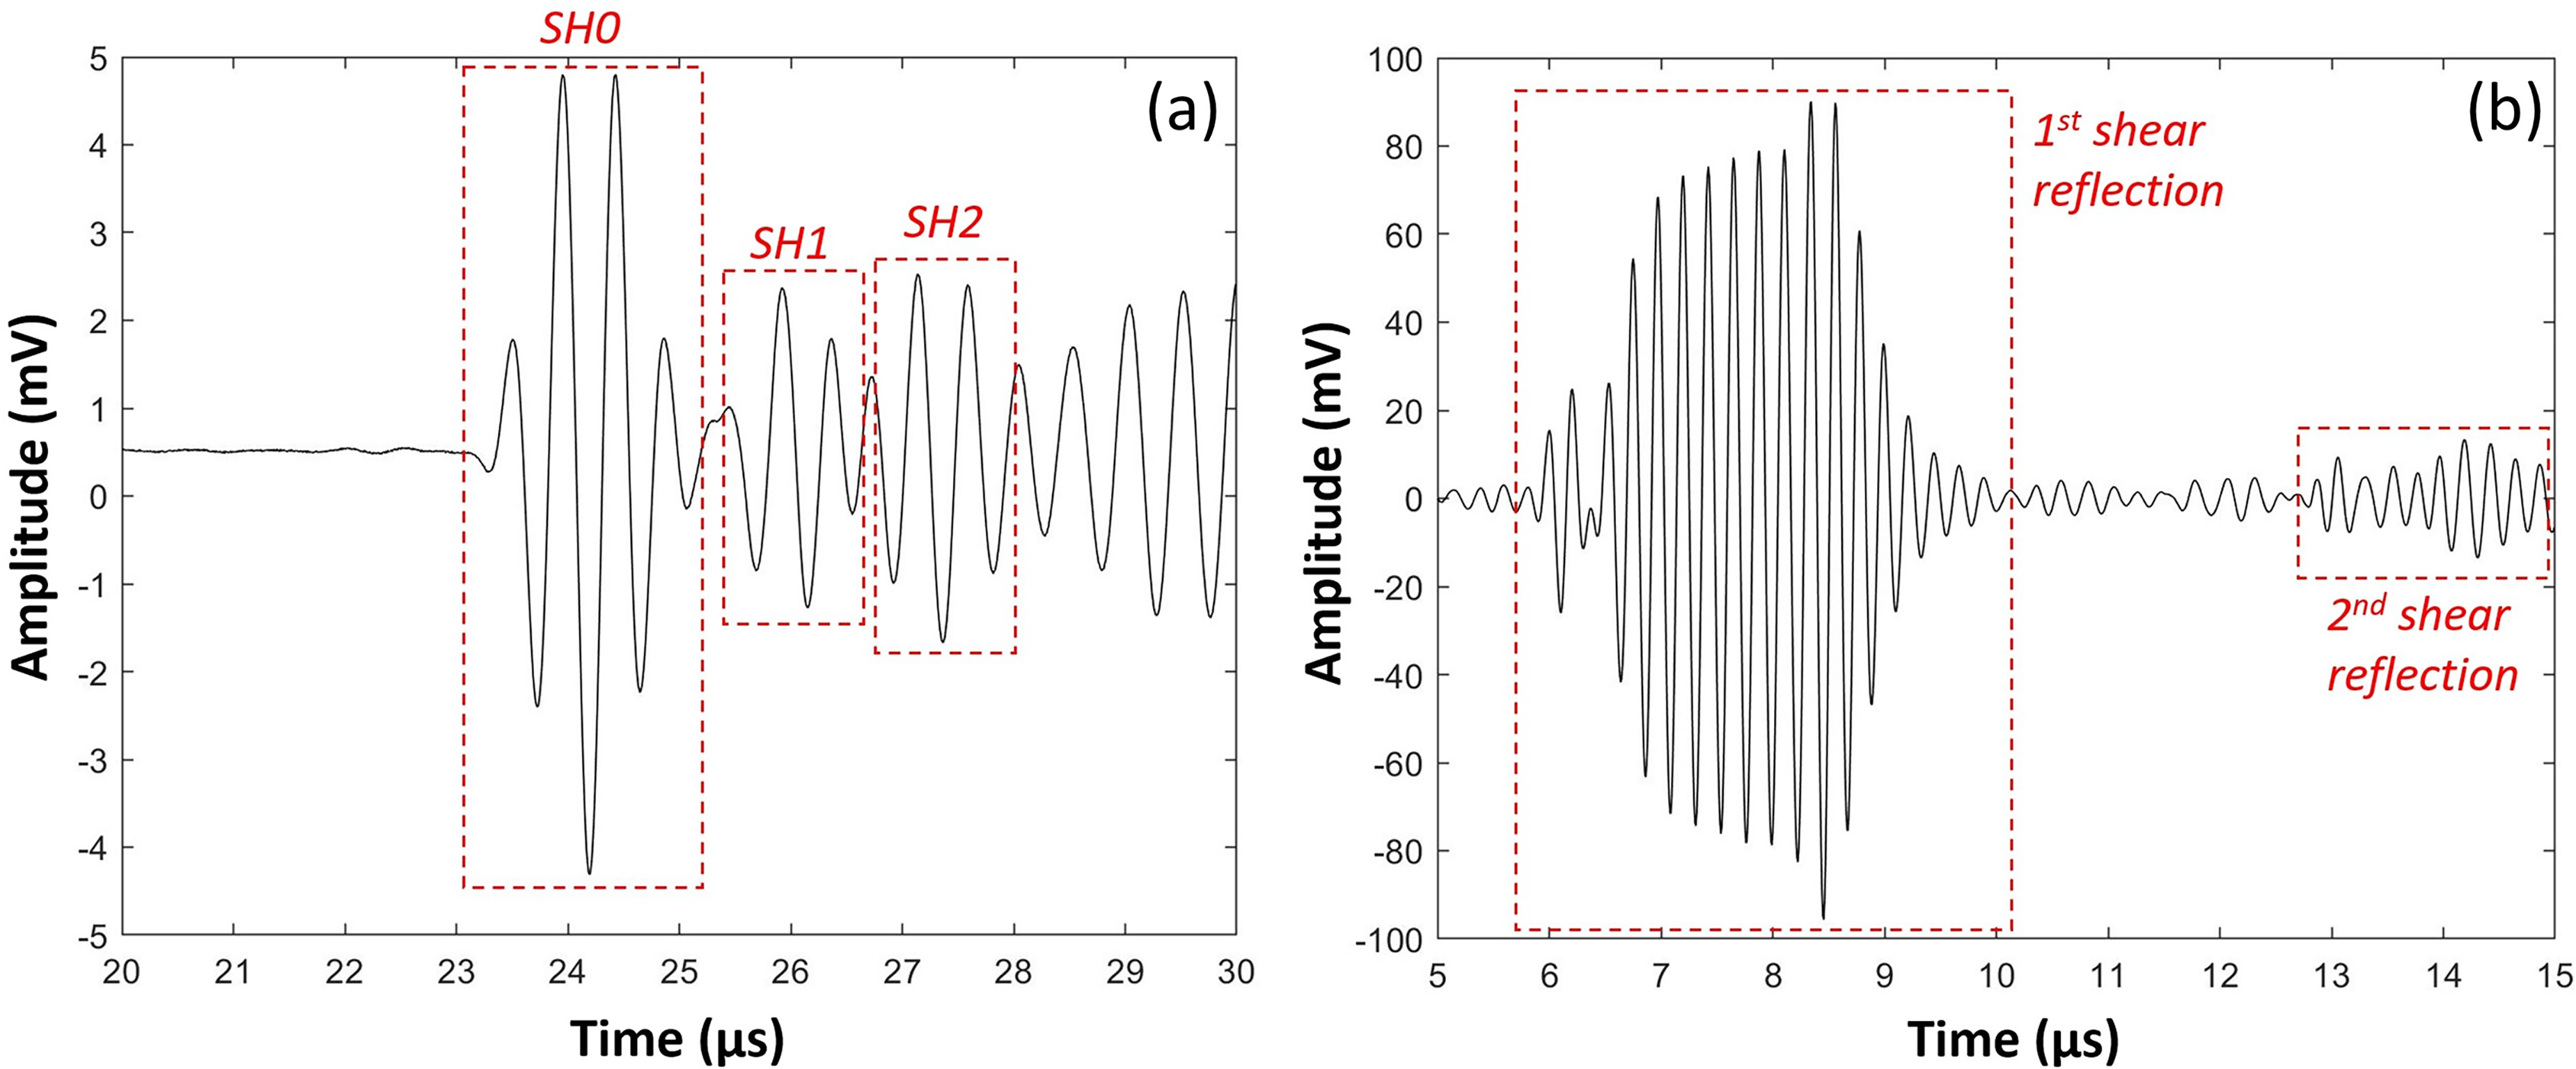
(a) acquired SH-SAW waveforms in the time domain, using 2 MHz angled transducers on a half-bearing shell, and (b) shear BAW waveforms.
Different SH-SAW modes can be distinguished, according to their time-of-flight determined from a SH-SAW dispersion curve as shown in Figure 12. 15 The different phase groups are shown in Figure 11(a). Figure 13 shows the SH0 group extracted; a fast Fourier transform (FFT) was applied, to obtain the signals in the frequency domain. In the plot two signals are shown; both with (red) and without (black) oil on the plate surface. The amplitude of the ‘with oil’ case is slightly lower as some of the wave energy has been dispersed into the oil.
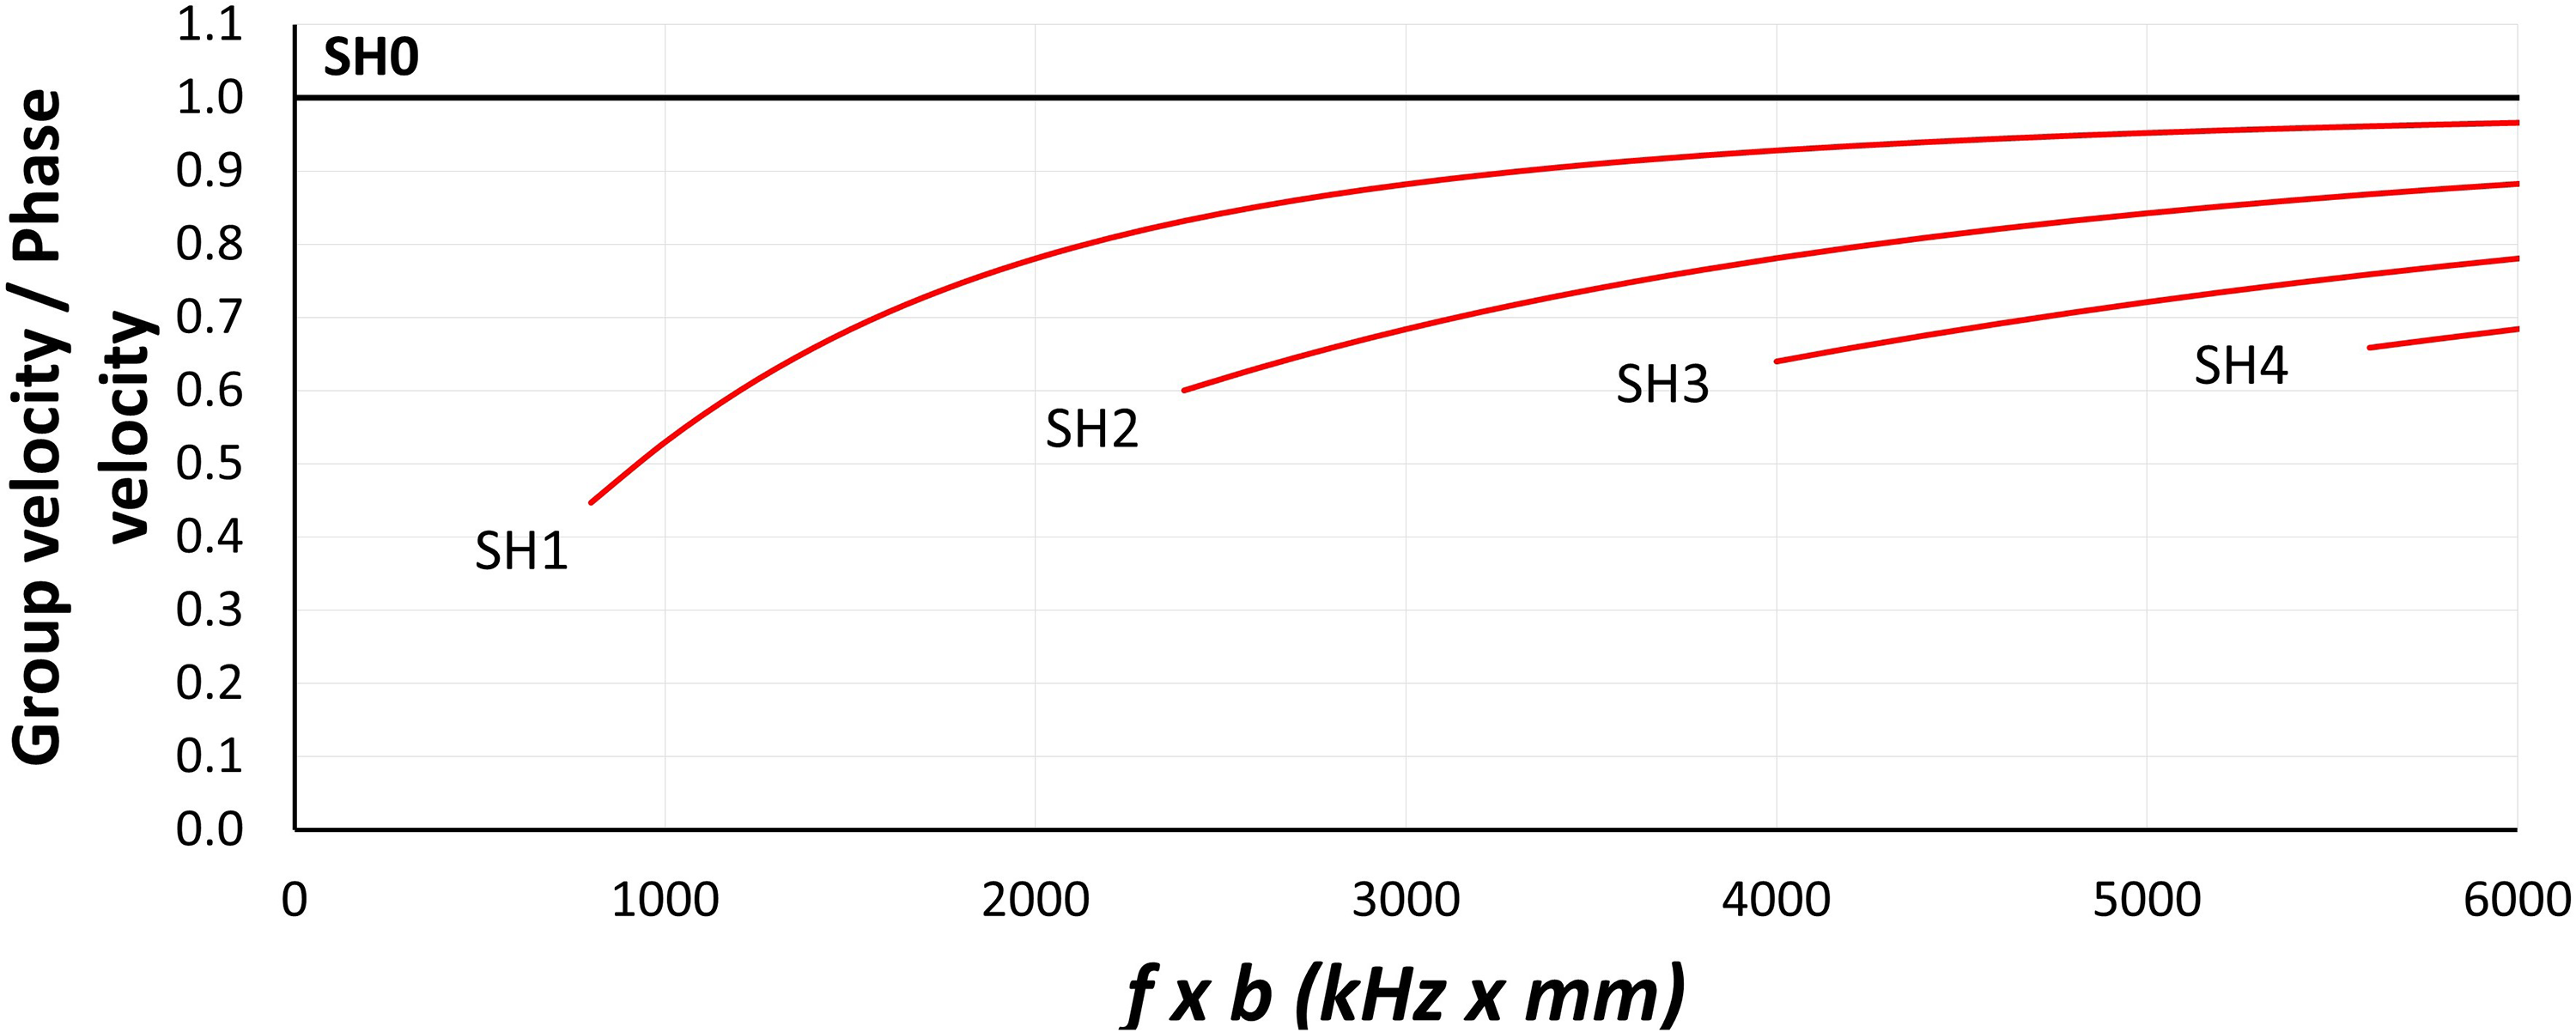
SH-SAW dispersion curves. 15
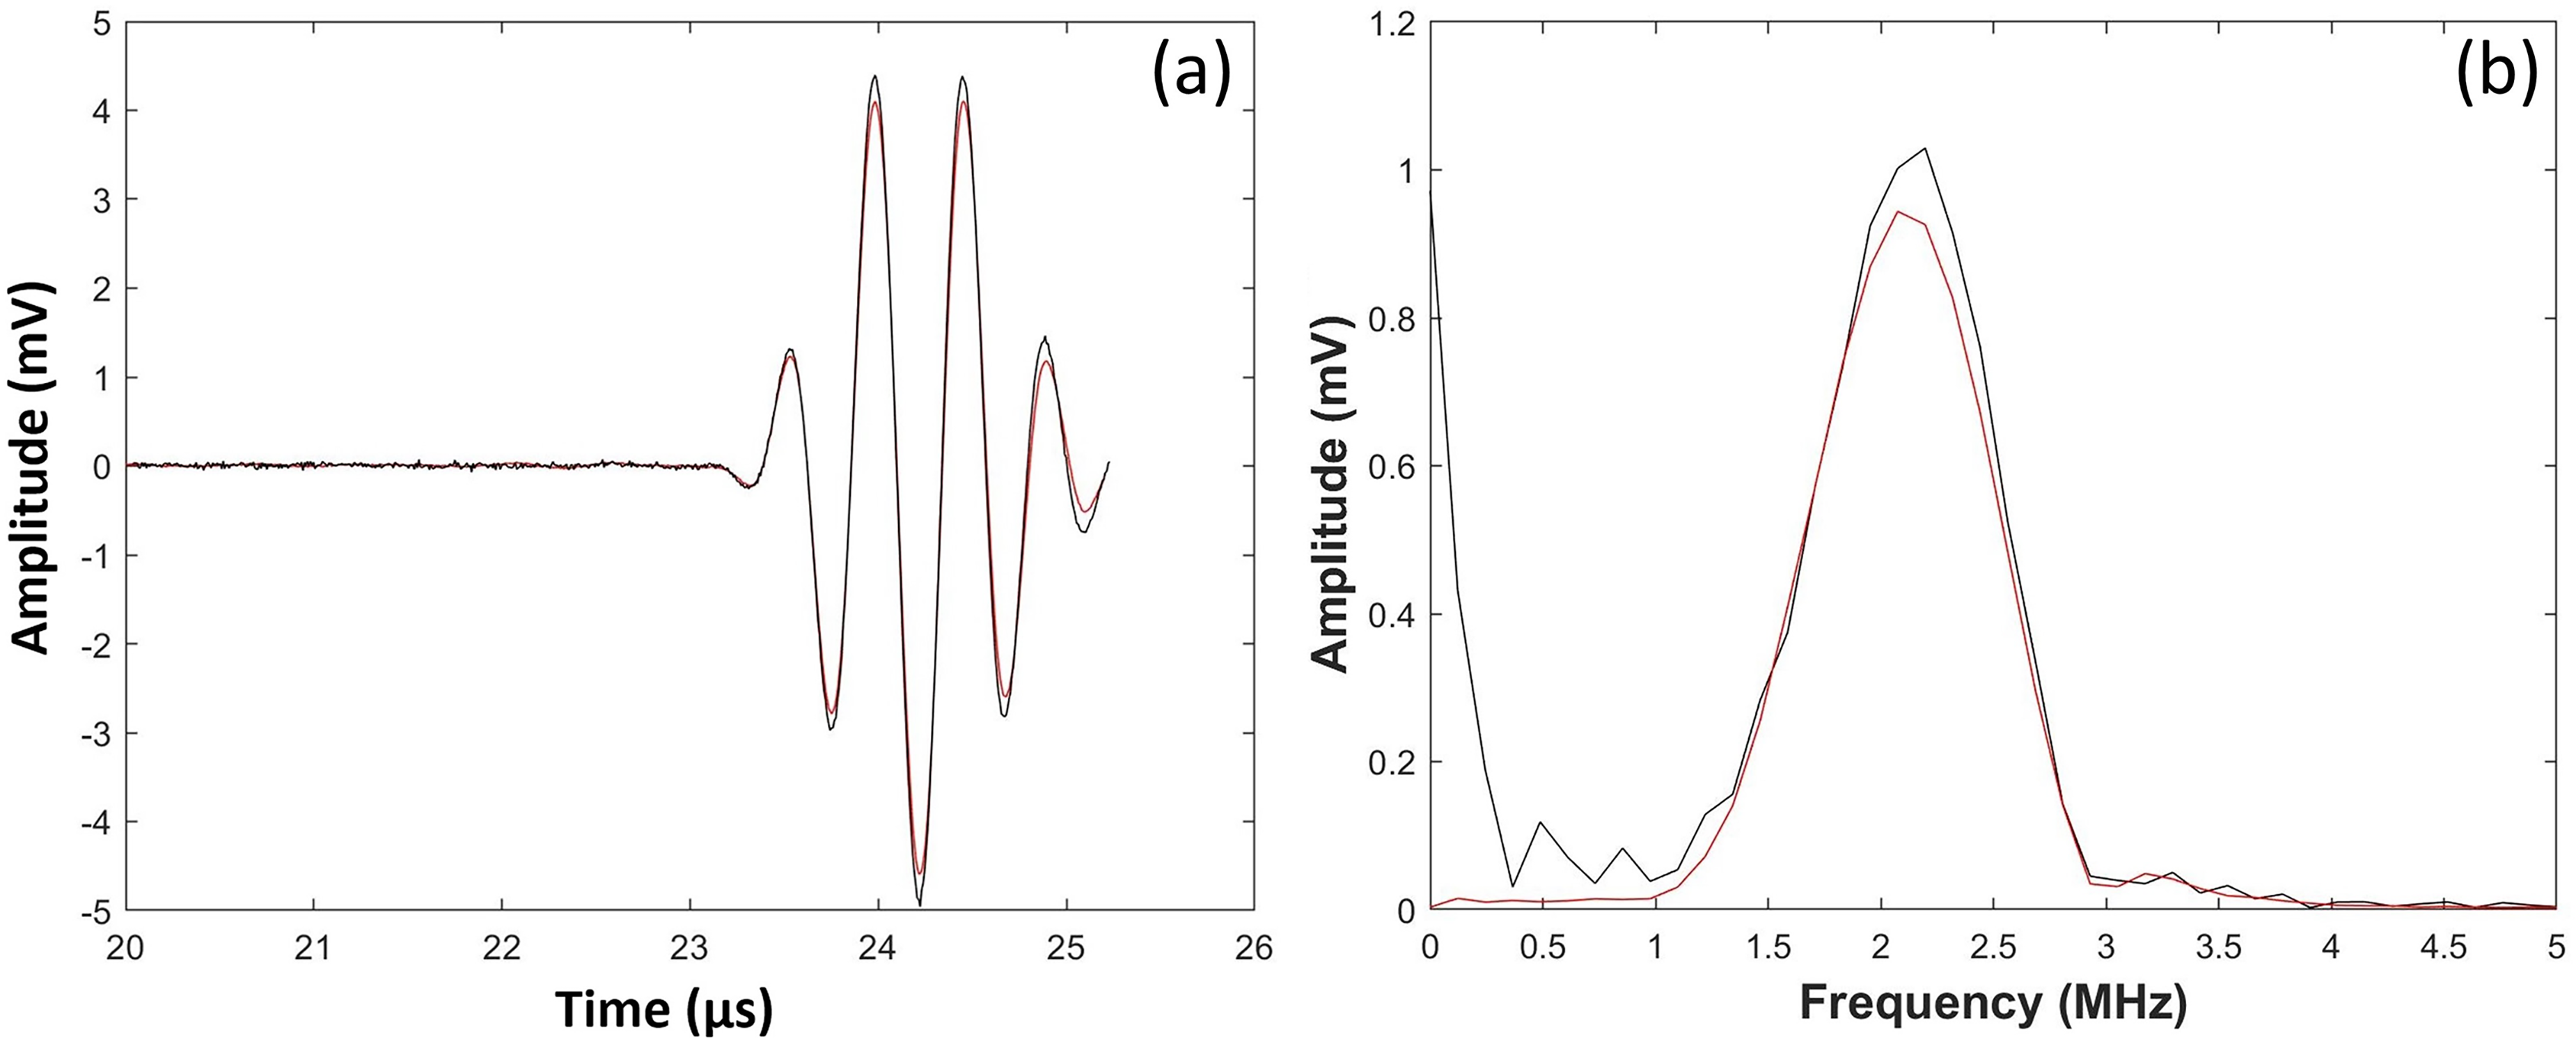
SH-SAW signal processing; (a) SH0 mode extraction and (b) FFT of the signal. The black lines represent the reference signal at the solid-air interface, while the red lines represent the test signal at the solid-oil interface.
For the BAW case the reflection of interest is the first signal reflected back from the solid-oil interface. In this case two reflections are recorded; one from a solid-air interface (the reference signal) and one from a solid-oil interface. Figure 14 shows these extracted signals and their respective Fourier transforms. Again, the amplitude of the solid-oil signal is lower as part of the wave energy has been transmitted into the oil.
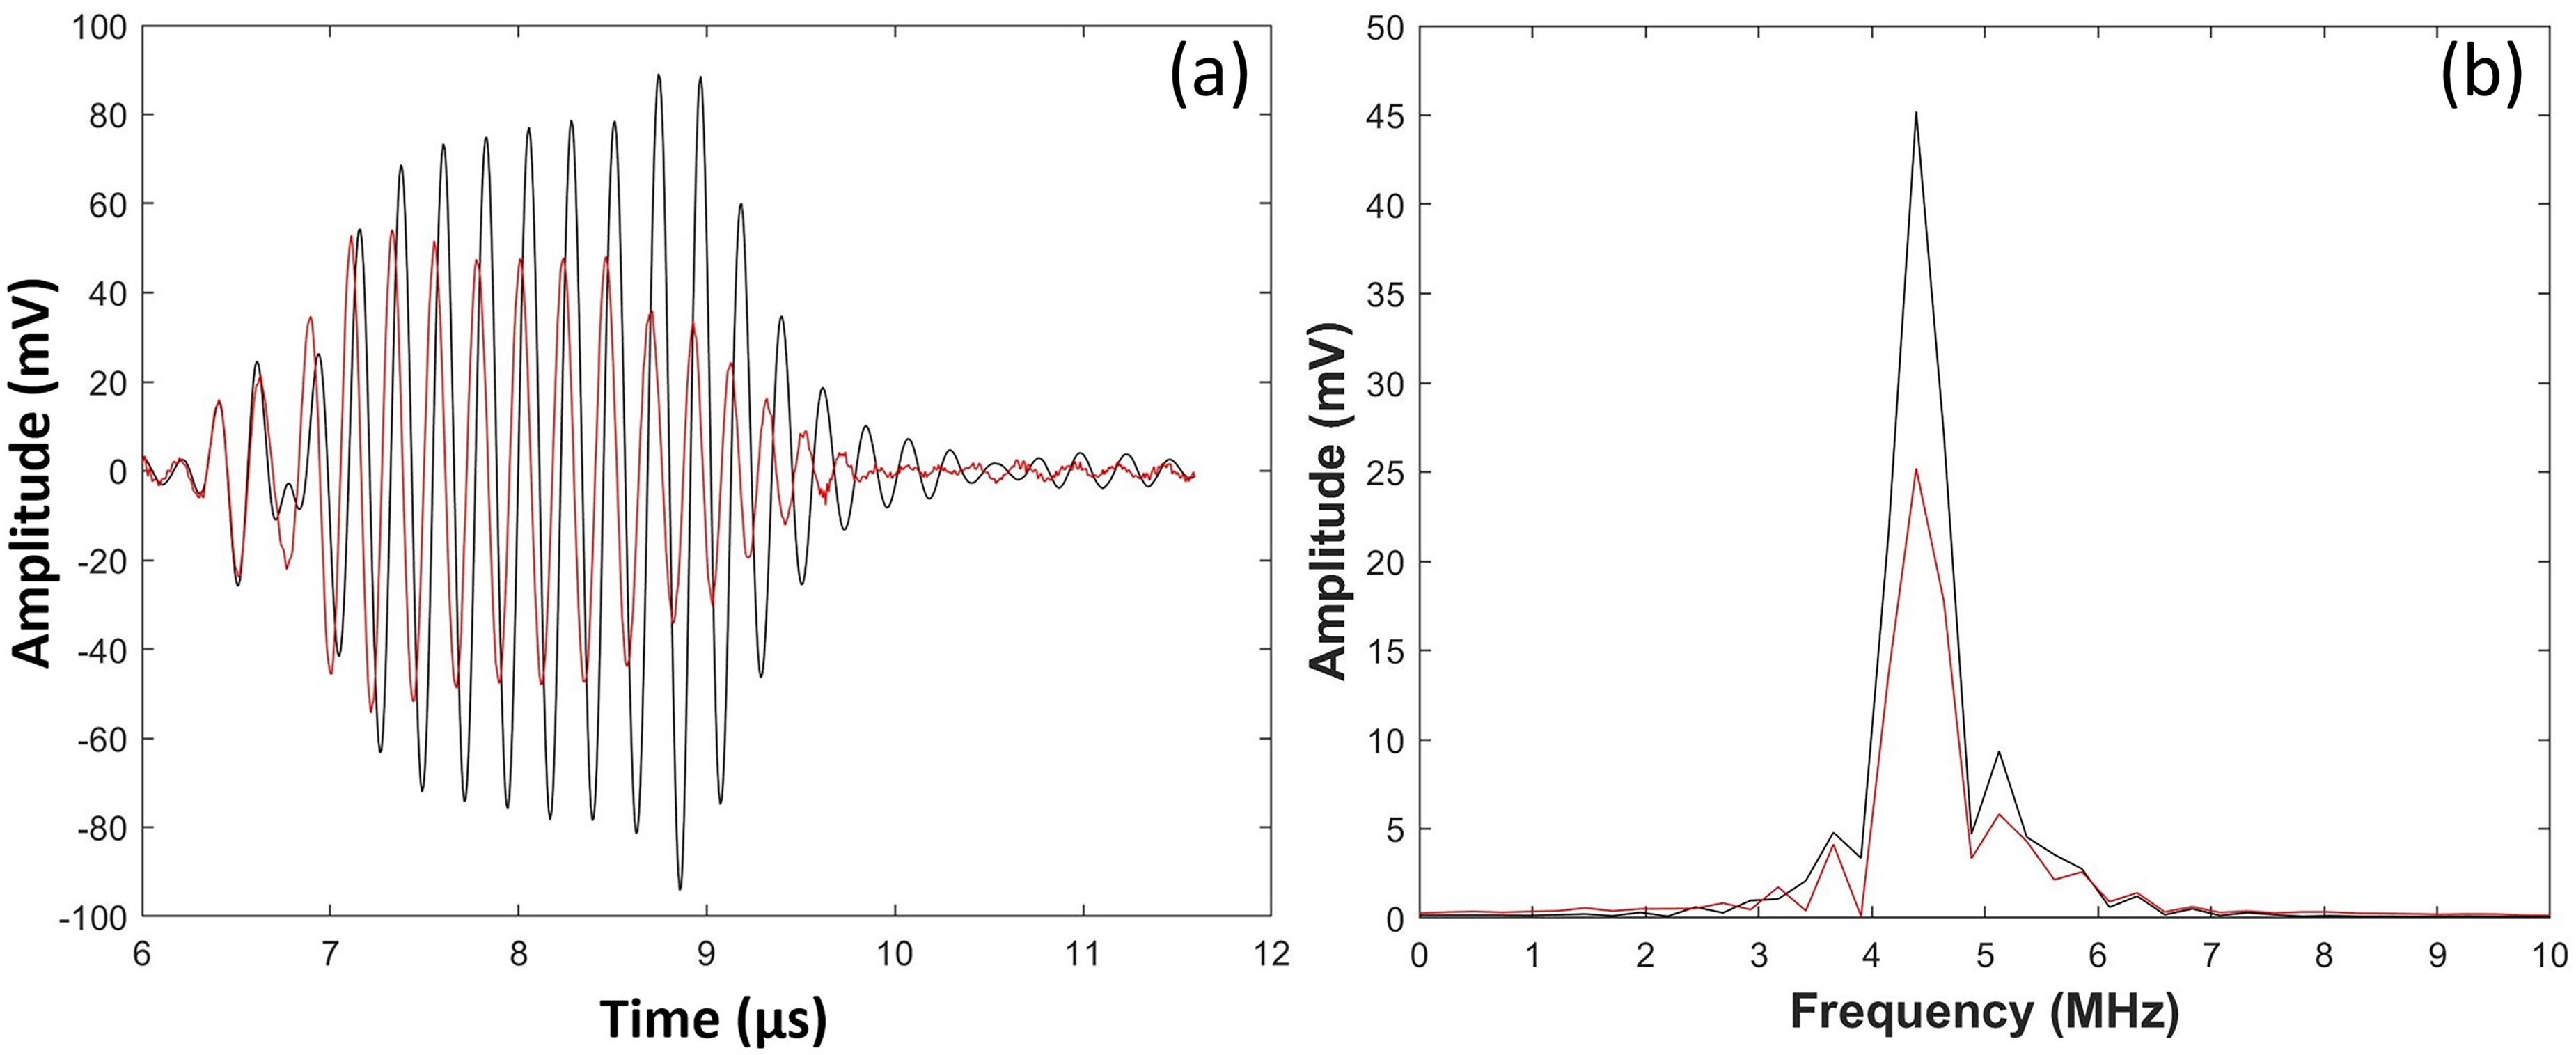
Shear signal processing; (a) shear mode extraction and (b) FFT of the signal. The black lines represent the reference signal at the solid-air interface, while the red lines represent the test signal at the solid-oil interface.
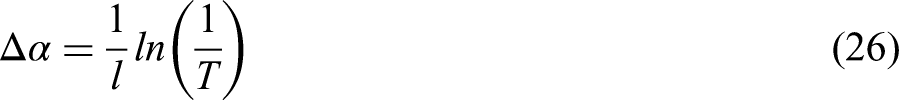
From the FFT of the signals, the maximum amplitudes at the solid-air (
Results
Oil film on flat plate
The Cannon standard lubricants (Table 2) and PAO lubricants (Table 3) were tested on the flat steel plate, using both the 400 kHz and 2 MHz angled transducer pair. Figure 15(a) shows the measured transmission coefficient for the different Cannon standard oils. The results are compared with the transmission-viscosity model (Equation (28)), and good agreement is observed for both measurement frequencies.
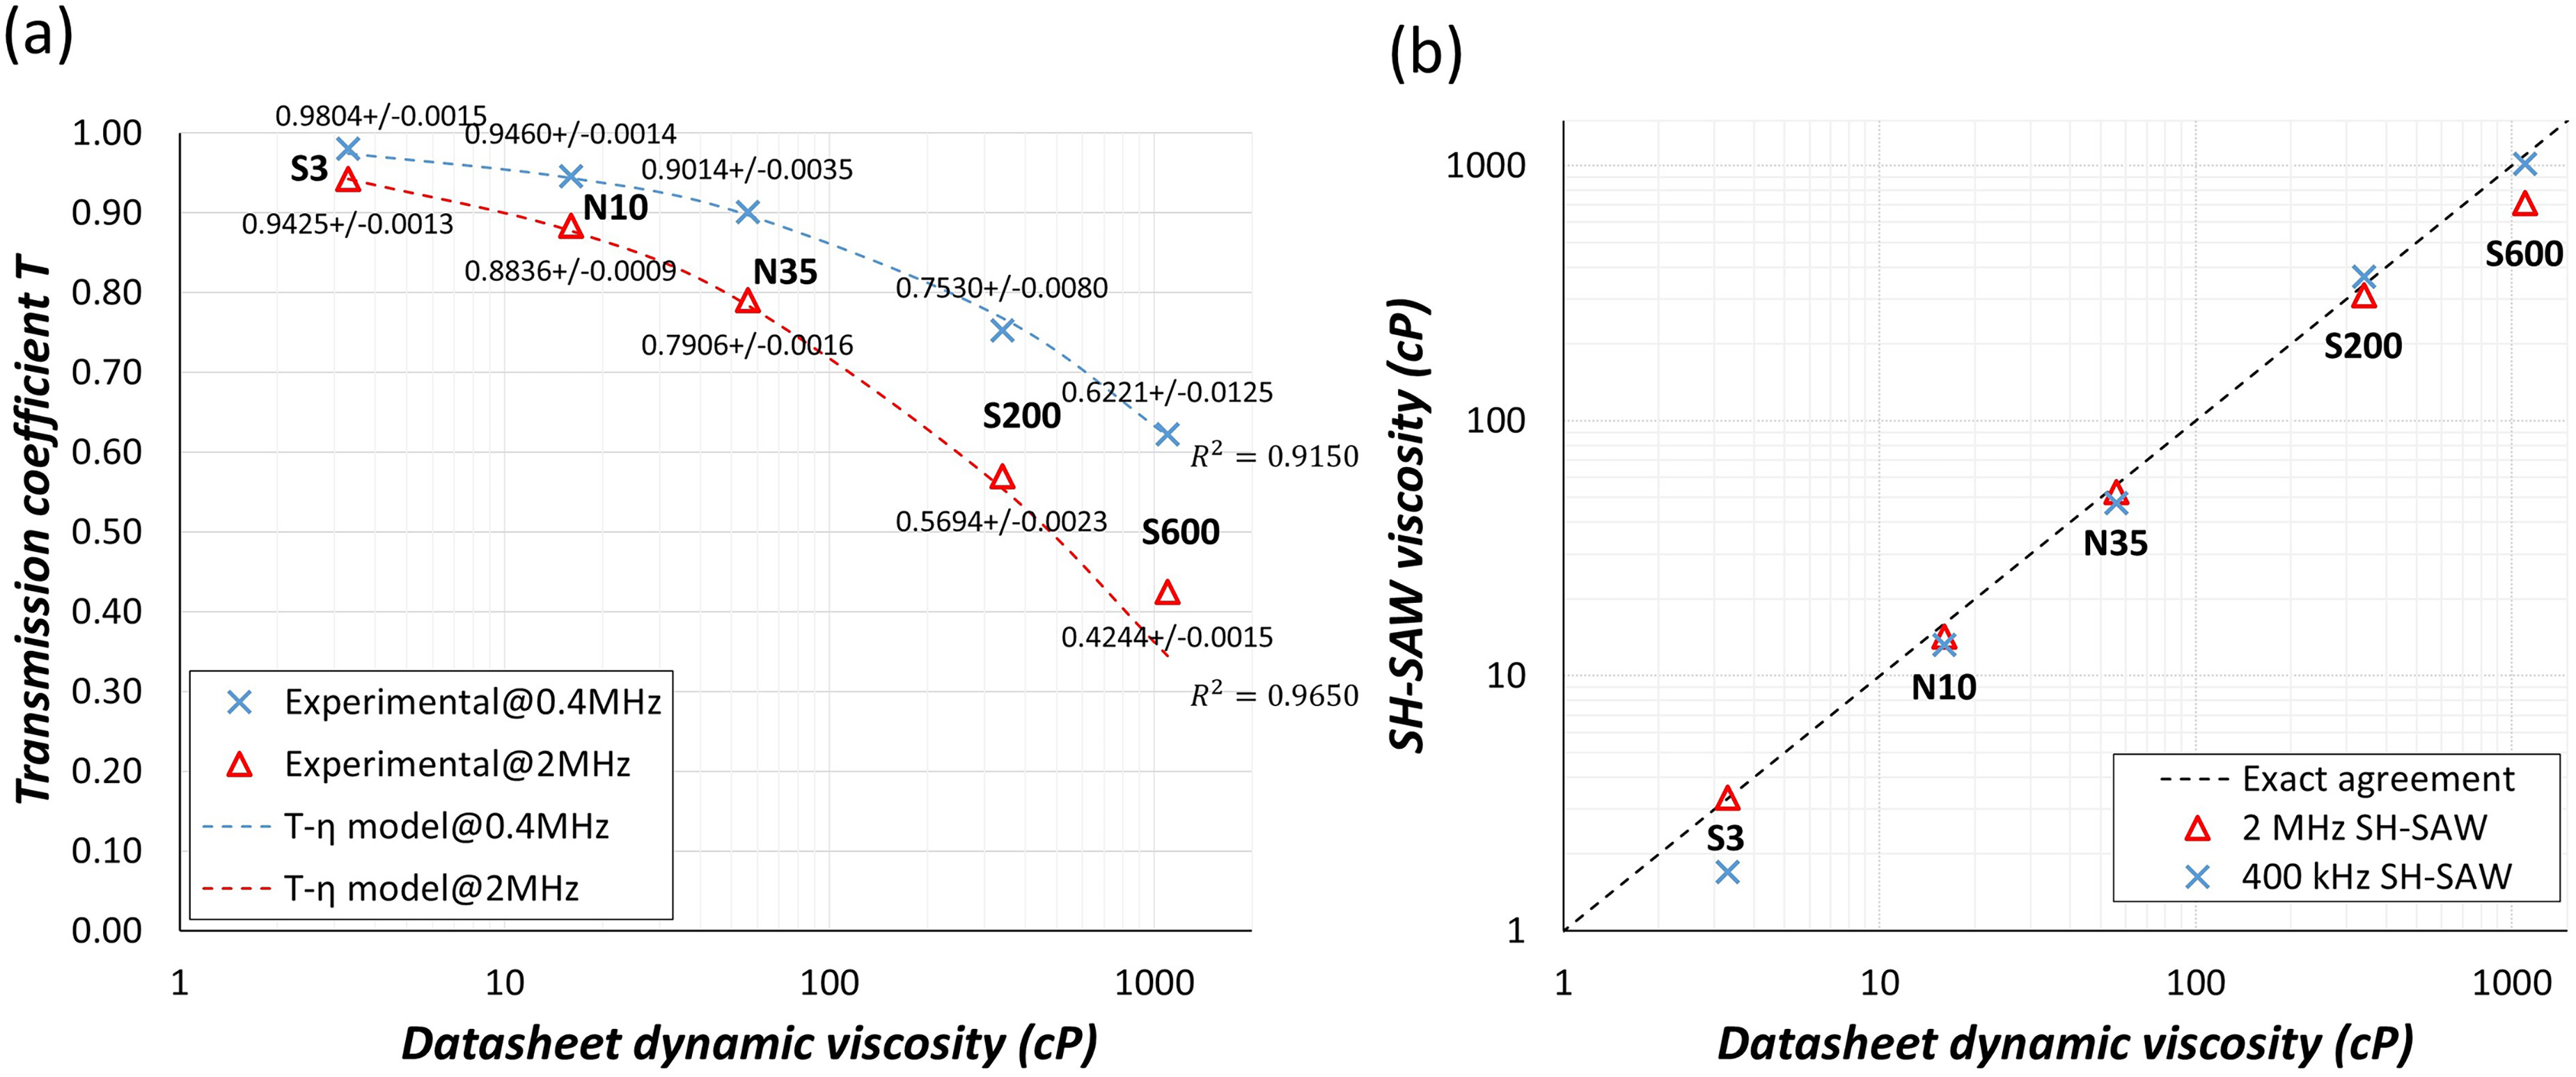
(a) transmission coefficient and (b) viscosity of cannon standard lubricants as measured with SH-SAWs.
Figure 15(b) shows the data of Figure 15(a) converted to viscosity (using Equation (28)) to compare against the datasheet value of viscosity for each oil. According to the graph, there is a good agreement between the measured and nominal viscosity values, regardless of the frequency and hence the shear rate, indicating Newtonian nature, as expected.
Figure 16(a) shows the measured transmission coefficient for the different PAO oils. Figure 16(b) shows the data converted to viscosities compared with that measured using a Brookfield rotational viscometer.
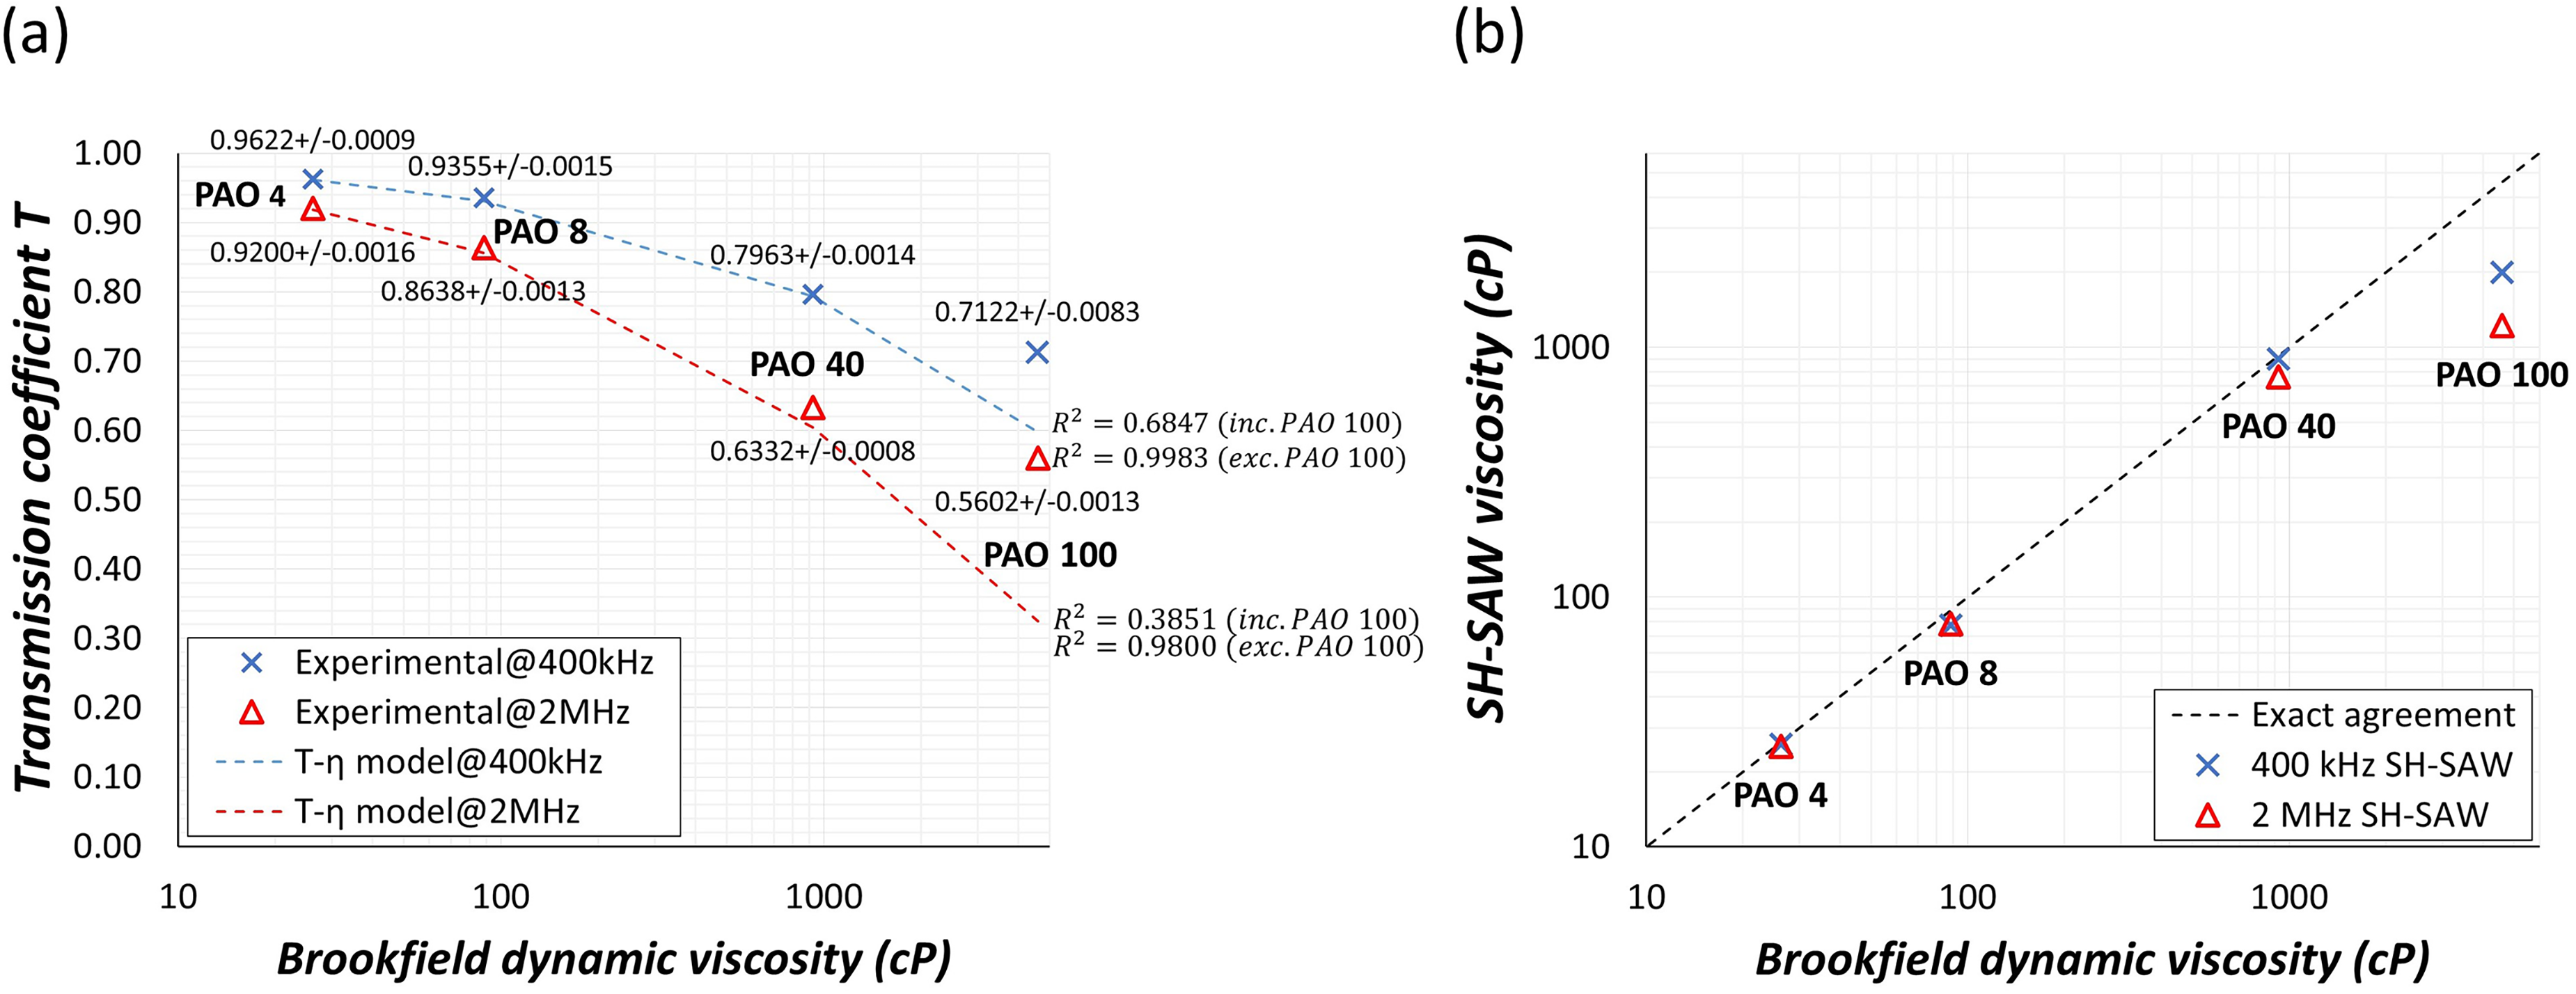
(a) transmission coefficient of PAO lubricants at 400 kHz & 2 MHz and (b) viscosity of PAO lubricants as measured with a brookfield viscometer and SH-SAWs.
Both Figure 16(a) and Figure 16(b) show the PAO 4 and 8 viscosities are in good agreement between the two methods, and appear to be independent of the SH-SAW frequency. PAO 40 appears to be harder to characterise. The viscosity as measured at 400 kHz matches the Brookfield viscosity, which indicates a Newtonian behaviour, but viscosity appears to be lower at 2 MHz, indicating non-Newtonian behaviour. Further testing is required, at higher frequencies (>2 MHz), to explore PAO 40's nature. The viscosity of PAO 100 appears to be decreasing as the frequency and hence the shear rate, increases. According to these results, PAO 100 exhibits shear-thinning behaviour. The frequency of excitation of the ultrasonic wave is very high (MHz) and so a very high shear rate is applied to the oils. The viscosity measured here more closely resembles the high shear viscosity. 20
Oil film in a journal bearing
This section presents the viscosity results of the four PAO 4 blends (Table 4), as they were measured with the SH-SAW angled transducers and the ultrasonic shear transducer, in a bespoke build machine for testing standard bearing sleeves (Figure 17(a)).
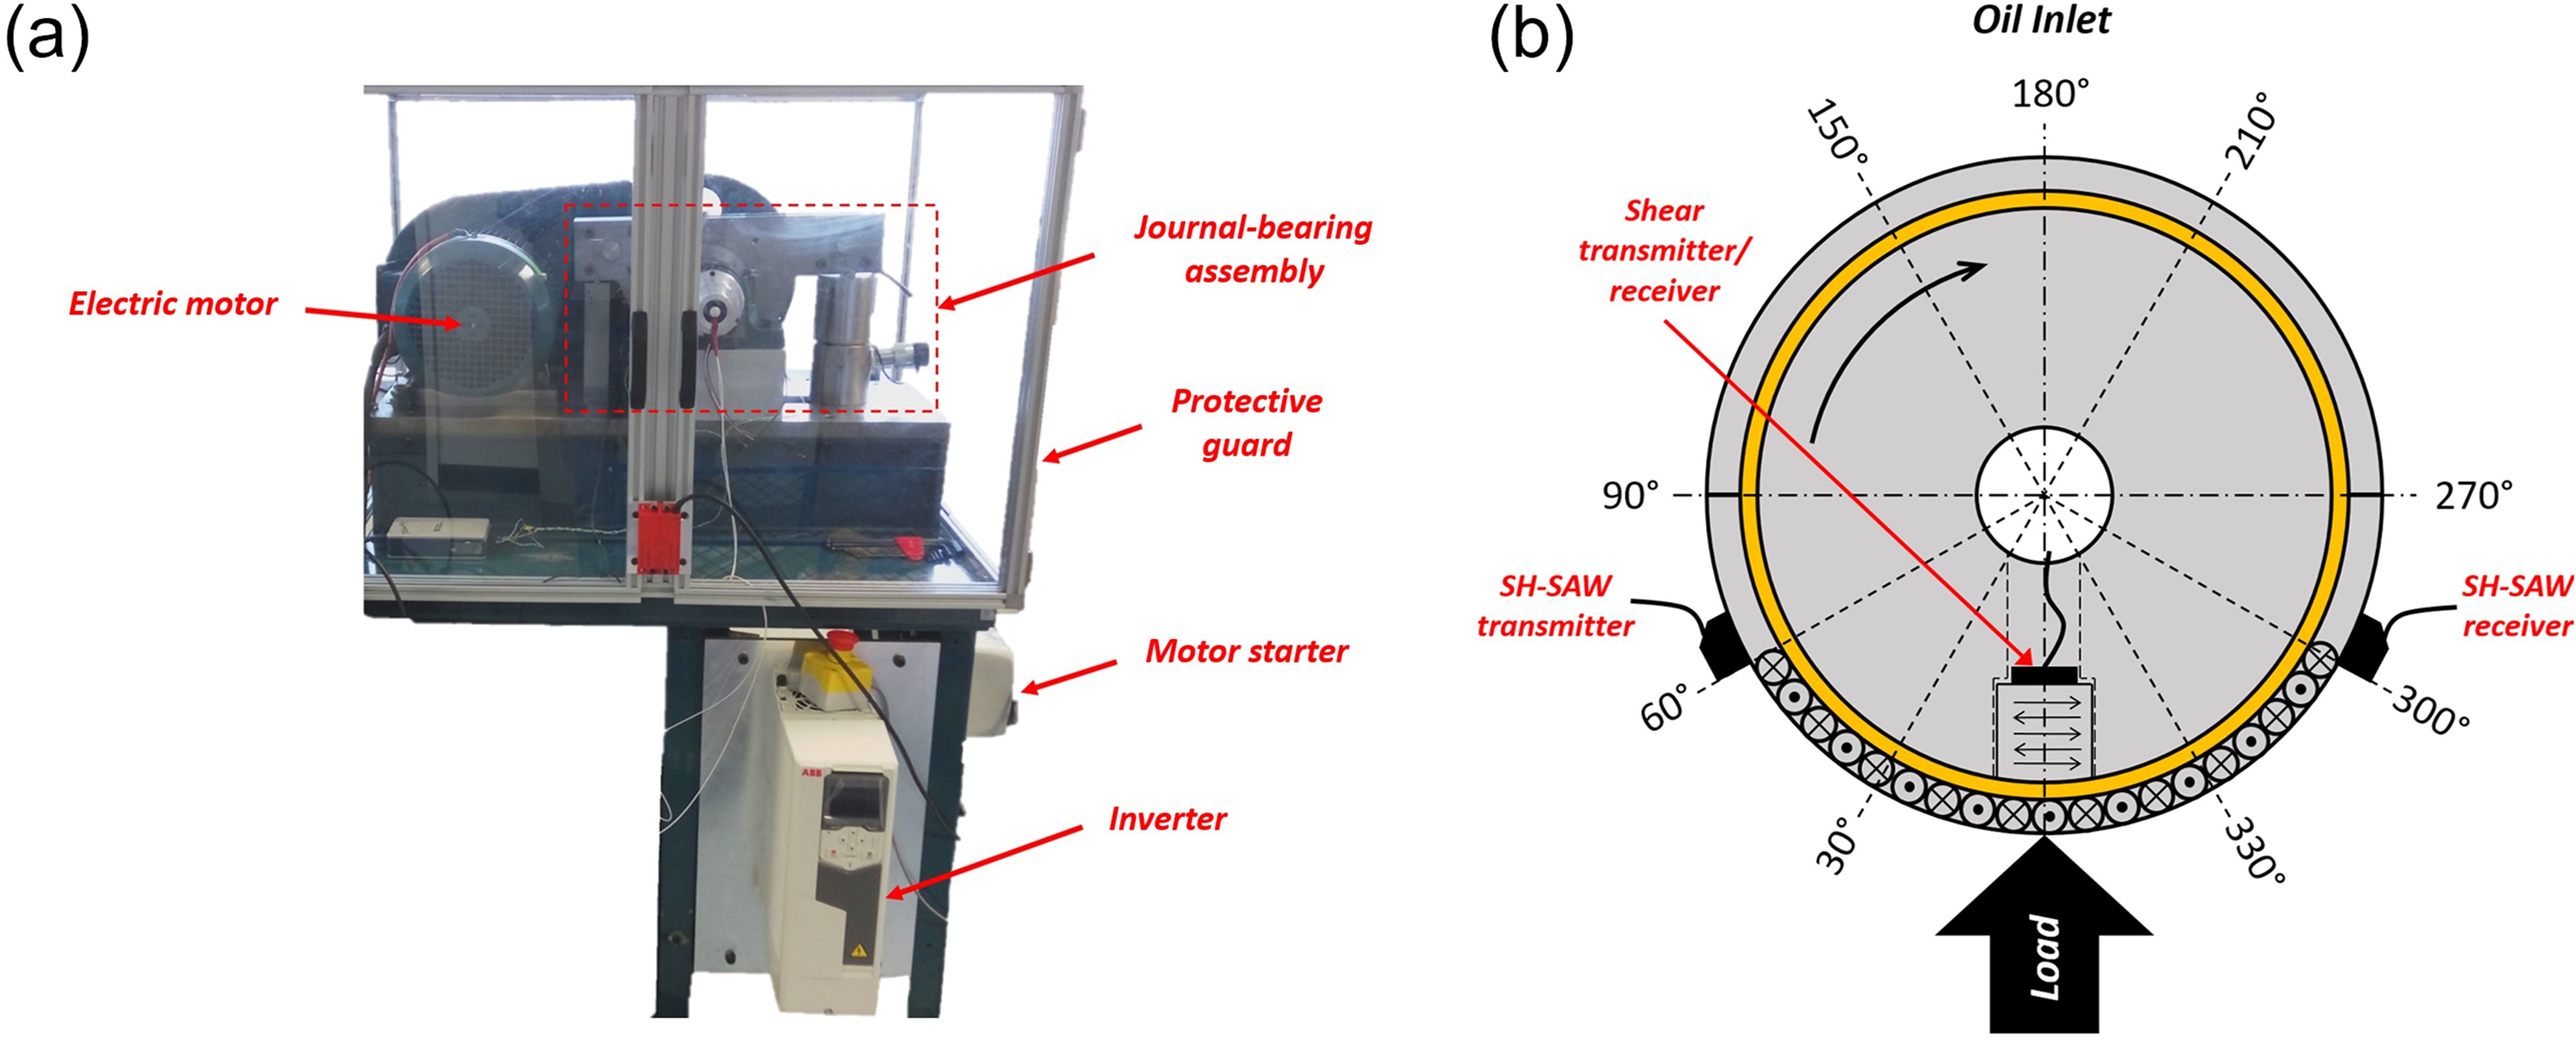
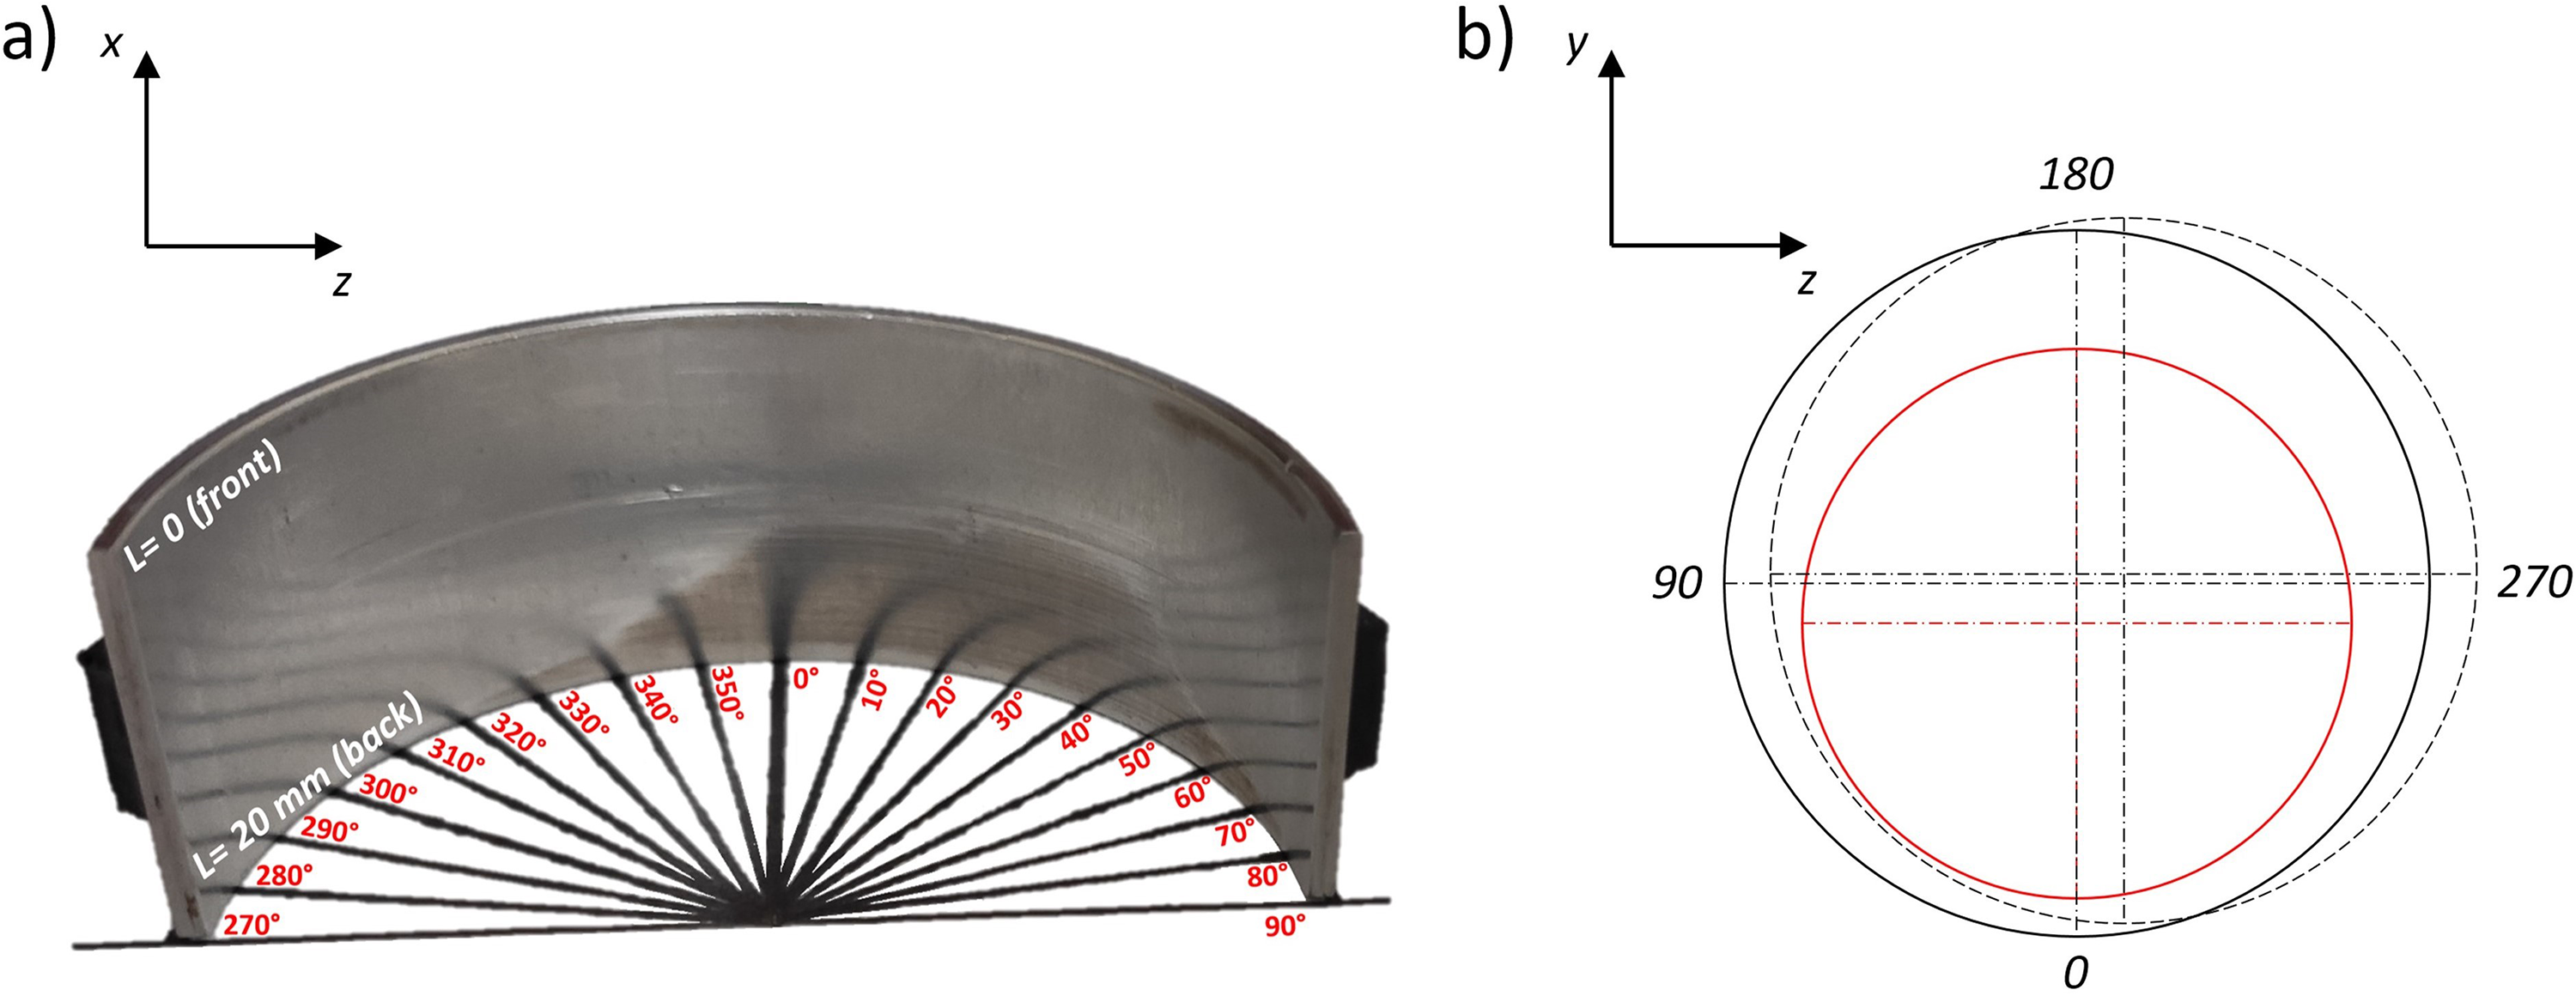
(a) journal bearing rig for measuring oil viscosity in a dynamic system, (b) journal & bearing instrumentation with ultrasonic transducers and thermocouples (30°, 150°, 210°, 330°).
An electric motor was used to drive the journal, a starter to initiate the motor and an inverter to control the motor speed and direction of rotation. An optical encoder was installed for measuring the journal location while rotating. Two self-aligning roller bearings were used for supporting the journal and two bearing sleeves were installed in a single 2-part housing to simulate engine components. An oil pump was used to supply oil to the system, and an oil container to collect and feed the oil, thus circulating it. A hydraulic jack was used to apply load on the journal which was measured with a load cell. Various thermocouples were installed for measuring the temperature at different locations during testing, along with the ultrasonic transducers for measuring the oil viscosity, as shown in Figure 17(b).
SH-SAW measurements of Oil film viscosity
In the case of the SH-SAWs, viscosity was measured for the loaded region between 300° to 60° (Figure 17(b)), where the two SH-SAW transducers were located and the results were compared with predicted viscosities for validation.
The Vogel equation (Equation (29)) was used to predict the viscosity of the test samples at the recorded temperatures (by the thermocouples).
21

Three known viscosity values at three temperatures (provided by Lubrizol Ltd), which were used to calculate the vogel constants, to predict the viscosities of the PAO 4 blends over temperature.
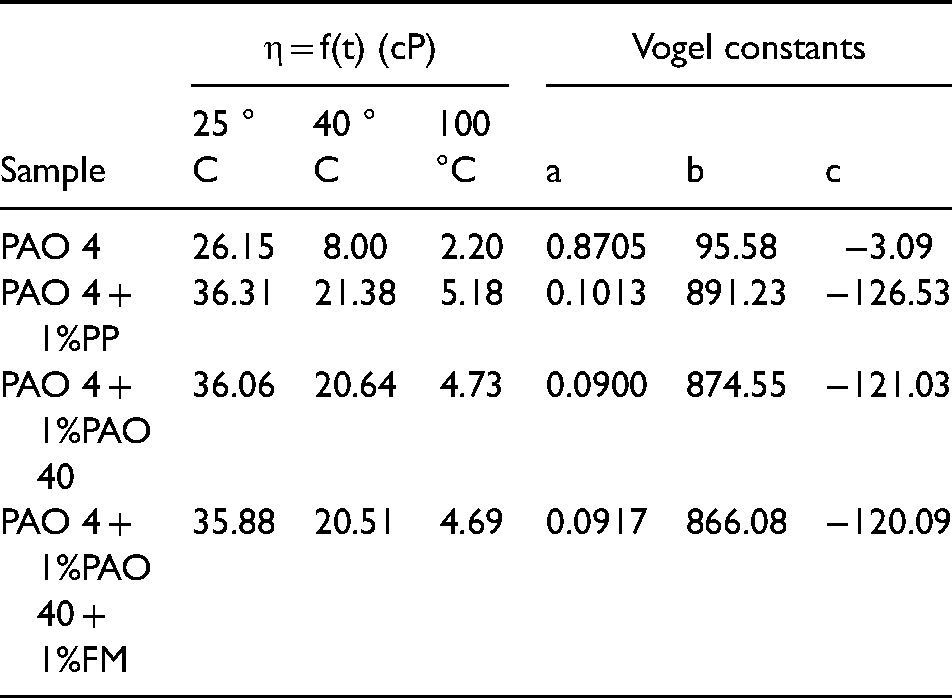
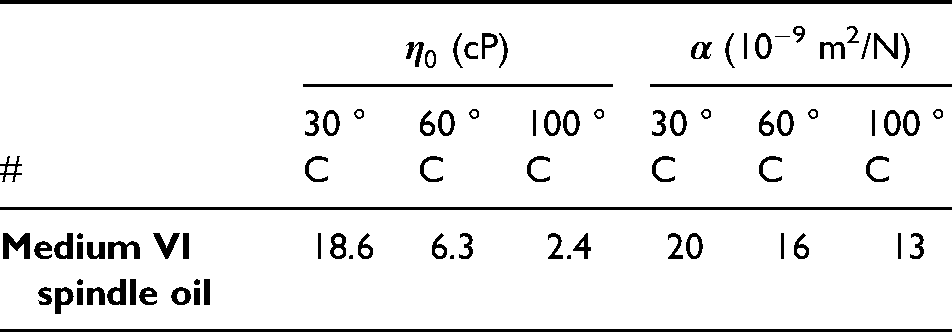
The predicted viscosity values from the Vogel equation were used in Barus equation (Equation (30)) to predict the viscosity over temperature and pressure, at the different loading conditions.
21


Viscosity-pressure coefficient
Oil film pressure due to load.
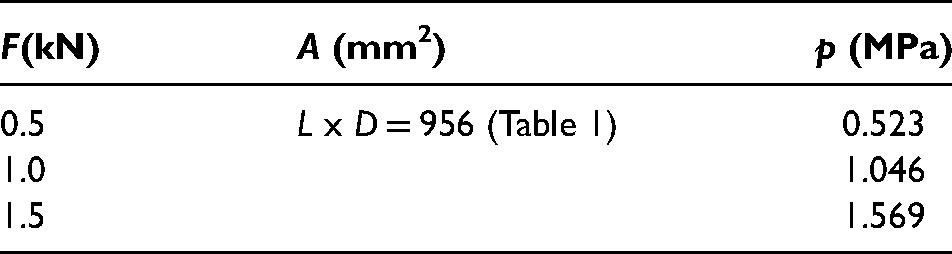
Figure 18 shows the results from the application of SH-SAWs to measure oil film viscosity in-situ for the four bearing loadings, in comparison to the predicted viscosity from the combination of the Vogel and Barus equations.
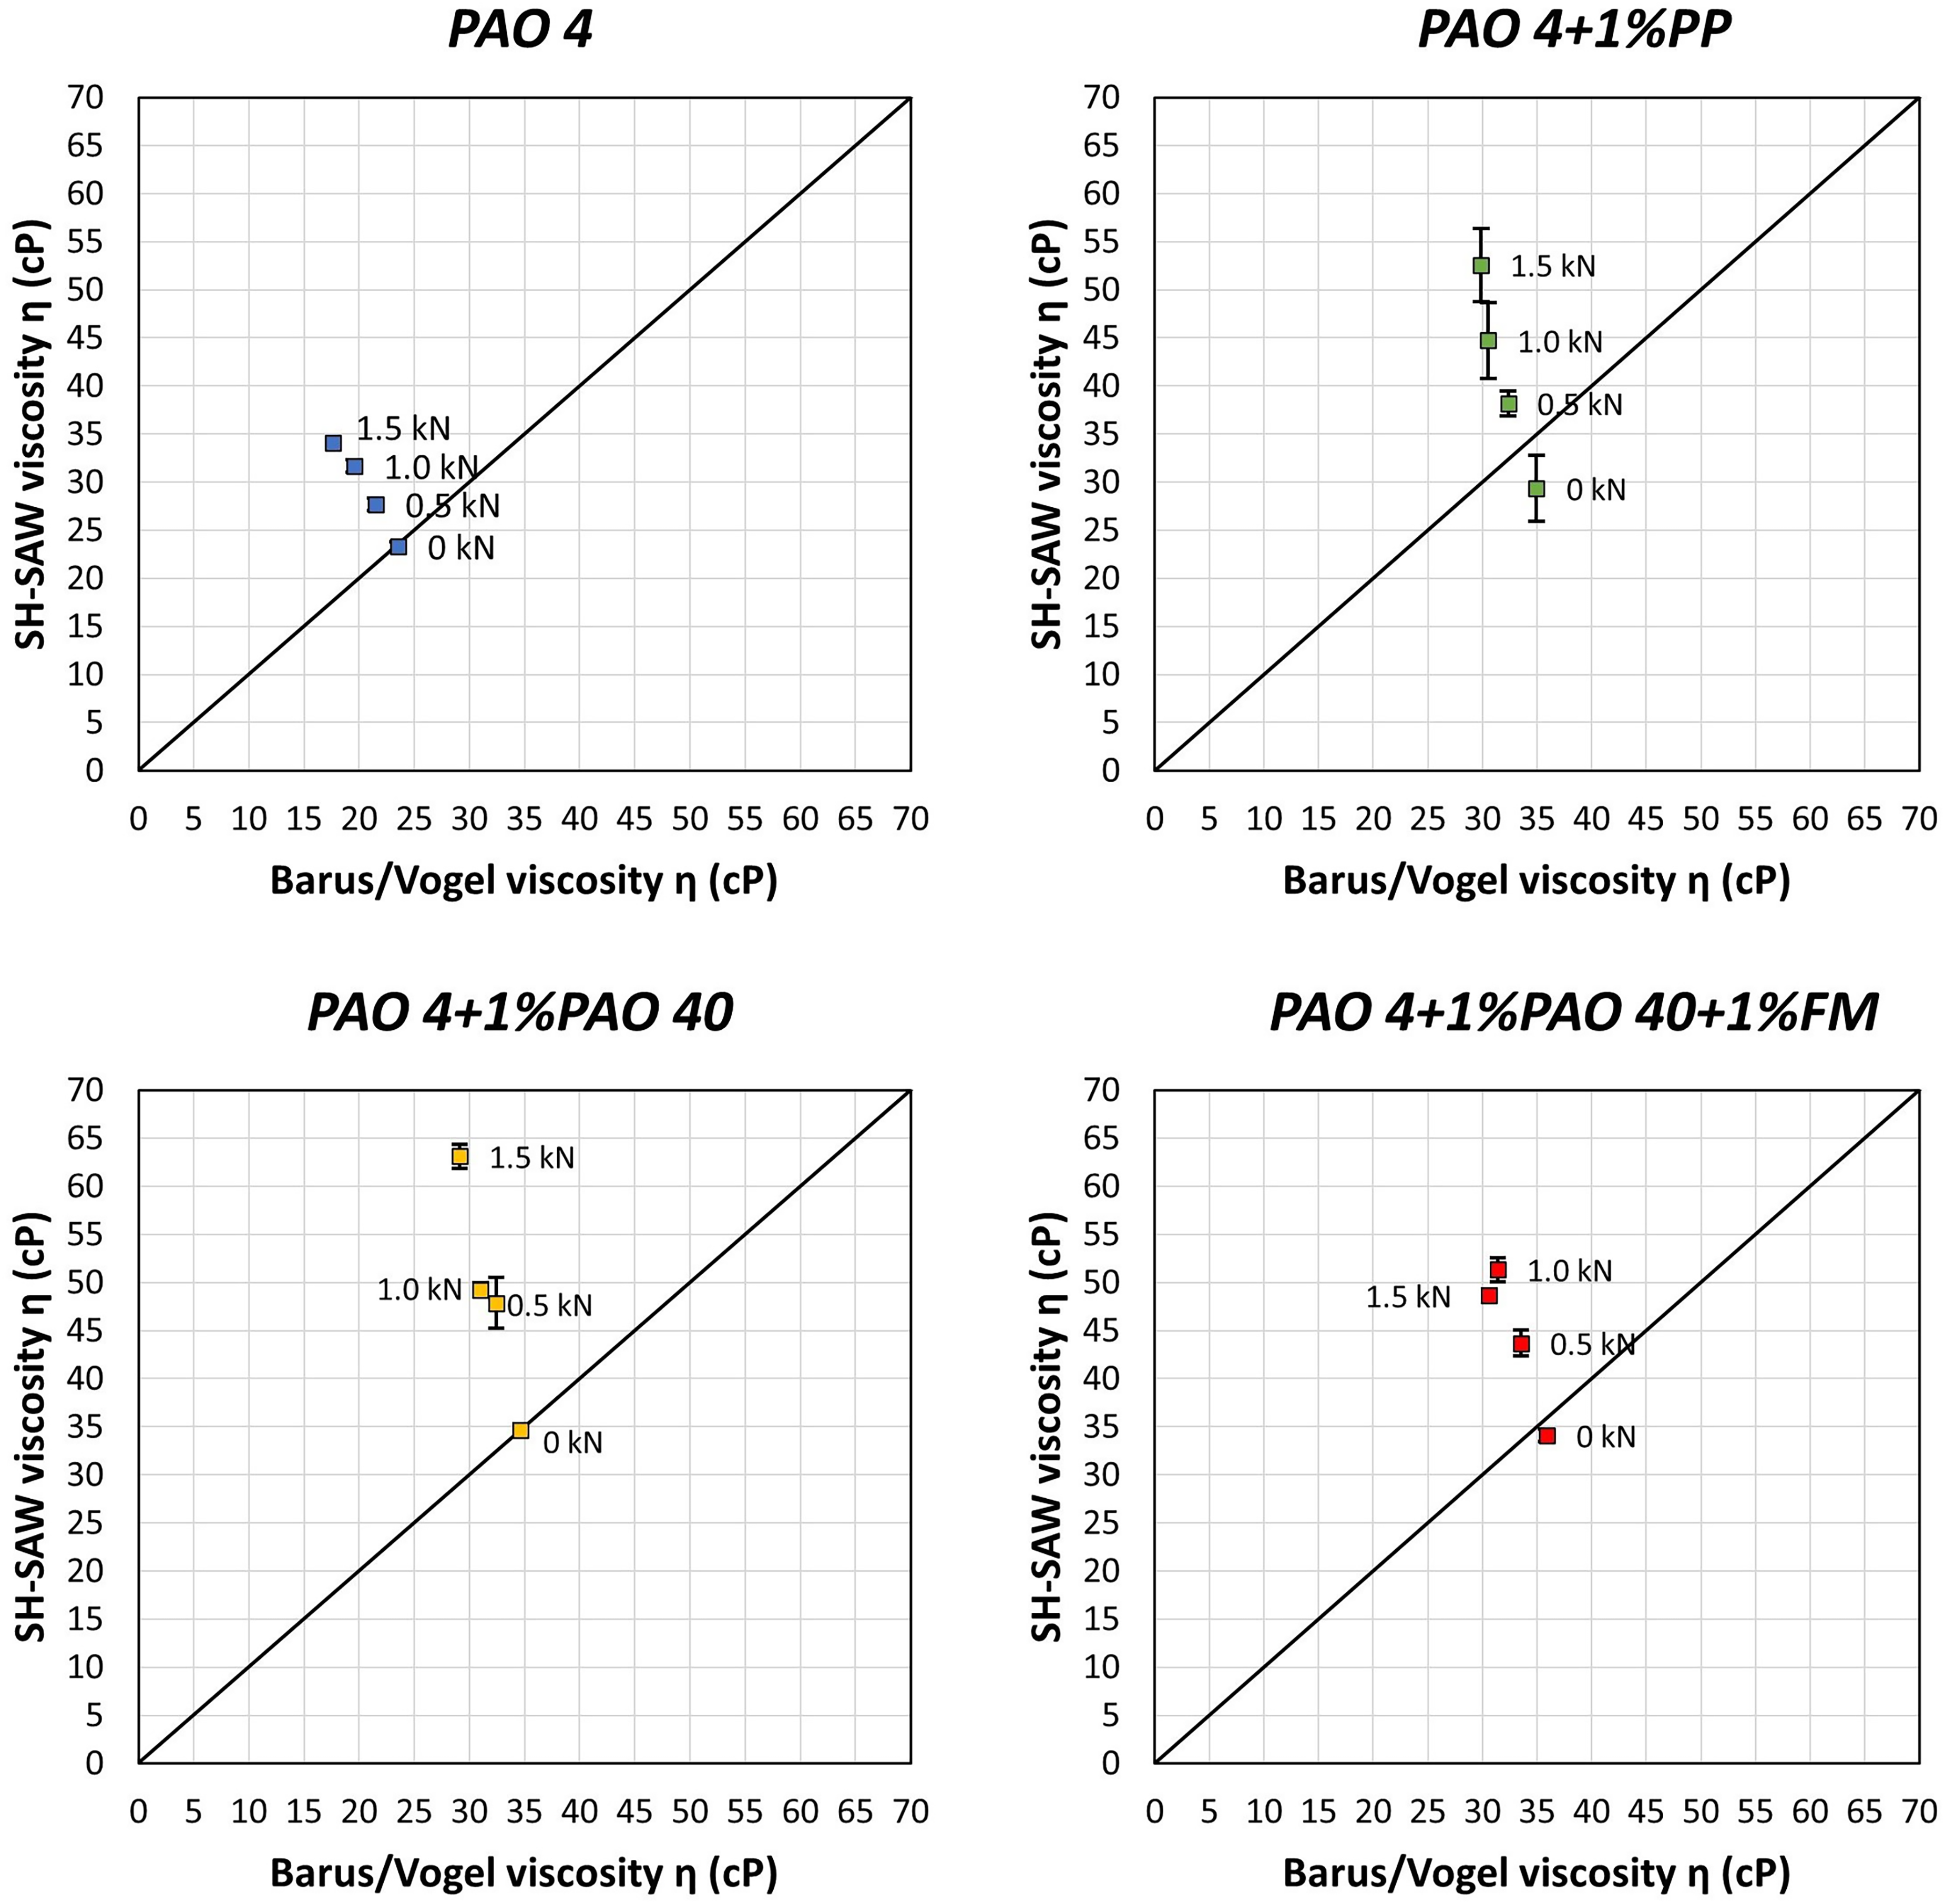
Viscosity of the PAO 4 blends, at 540 rpm and different loading conditions.
According to Figure 18, there is a good agreement between the methods for the low loaded cases and the results show that SH-SAWs can be used to measure the oil film viscosity in-situ in a journal bearing. When load was applied, viscosity increased more than expected as shown from the graphs in Figure 18. The measured viscosity corresponds to higher pressure than that expected to develop in the bearing.
Such high pressures at such low loads mean that either the loaded area must have been significantly smaller than the area calculated from the product of the bearing length and diameter, or that metal to metal contact may have occurred thus affecting the viscosity measurements. A misalignment between the bearing and journal centres would explain the formation of a thinner film and rise in pressure and hence the viscosity. After testing, the bearing sleeves were removed and examined for wear. Figure 19 shows surface damage on the lower bearing sleeve due to misalignment. The circumferential viscosity results from the shear BAW application, are expected to provide a better understanding for the unexpected increase in pressure and viscosity.
(a) Lower bearing sleeve surface damage, due to (b) misalignment between the journal-bearing centres.
Shear BAW measurements of Oil film viscosity
The circumferential viscosity distribution was measured with the rotating shaft-mounted shear BAW transducer, and was compared to the viscosity as it was predicted using the Reynolds equation solution for narrow hydrodynamic bearings
22
and the Barus equation. Equation (32) was used to determine the pressure distribution circumferentially, and the values were used in Equation (30) to calculate the viscosity profile. Although the narrow bearing solution best describes the pressure profile of bearings with 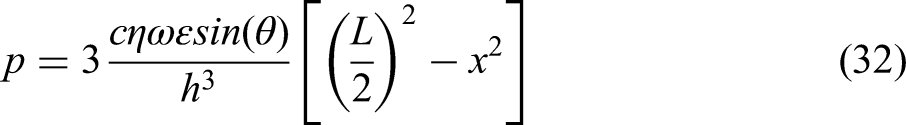
A 25 to 30 μm misalignment between the journal and bearing centres was considered, occurring at 80° to 90°, so the oil film thickness distribution can be calculated by:
Figure 20 shows the oil film profile and pressure distribution for the three loading cases, as they were calculated using Equations (34) and (32). The results were found to be very similar among the oil samples. Due to misalignment, the film thickness was not uniform along the bearing length. For load > 1.0 kN the misalignment led to a thin film which caused a significant increase in the pressure around 30°, most likely due to metal to metal contact, which was in good agreement with the surface damage on the lower bearing sleeve in Figure 19.
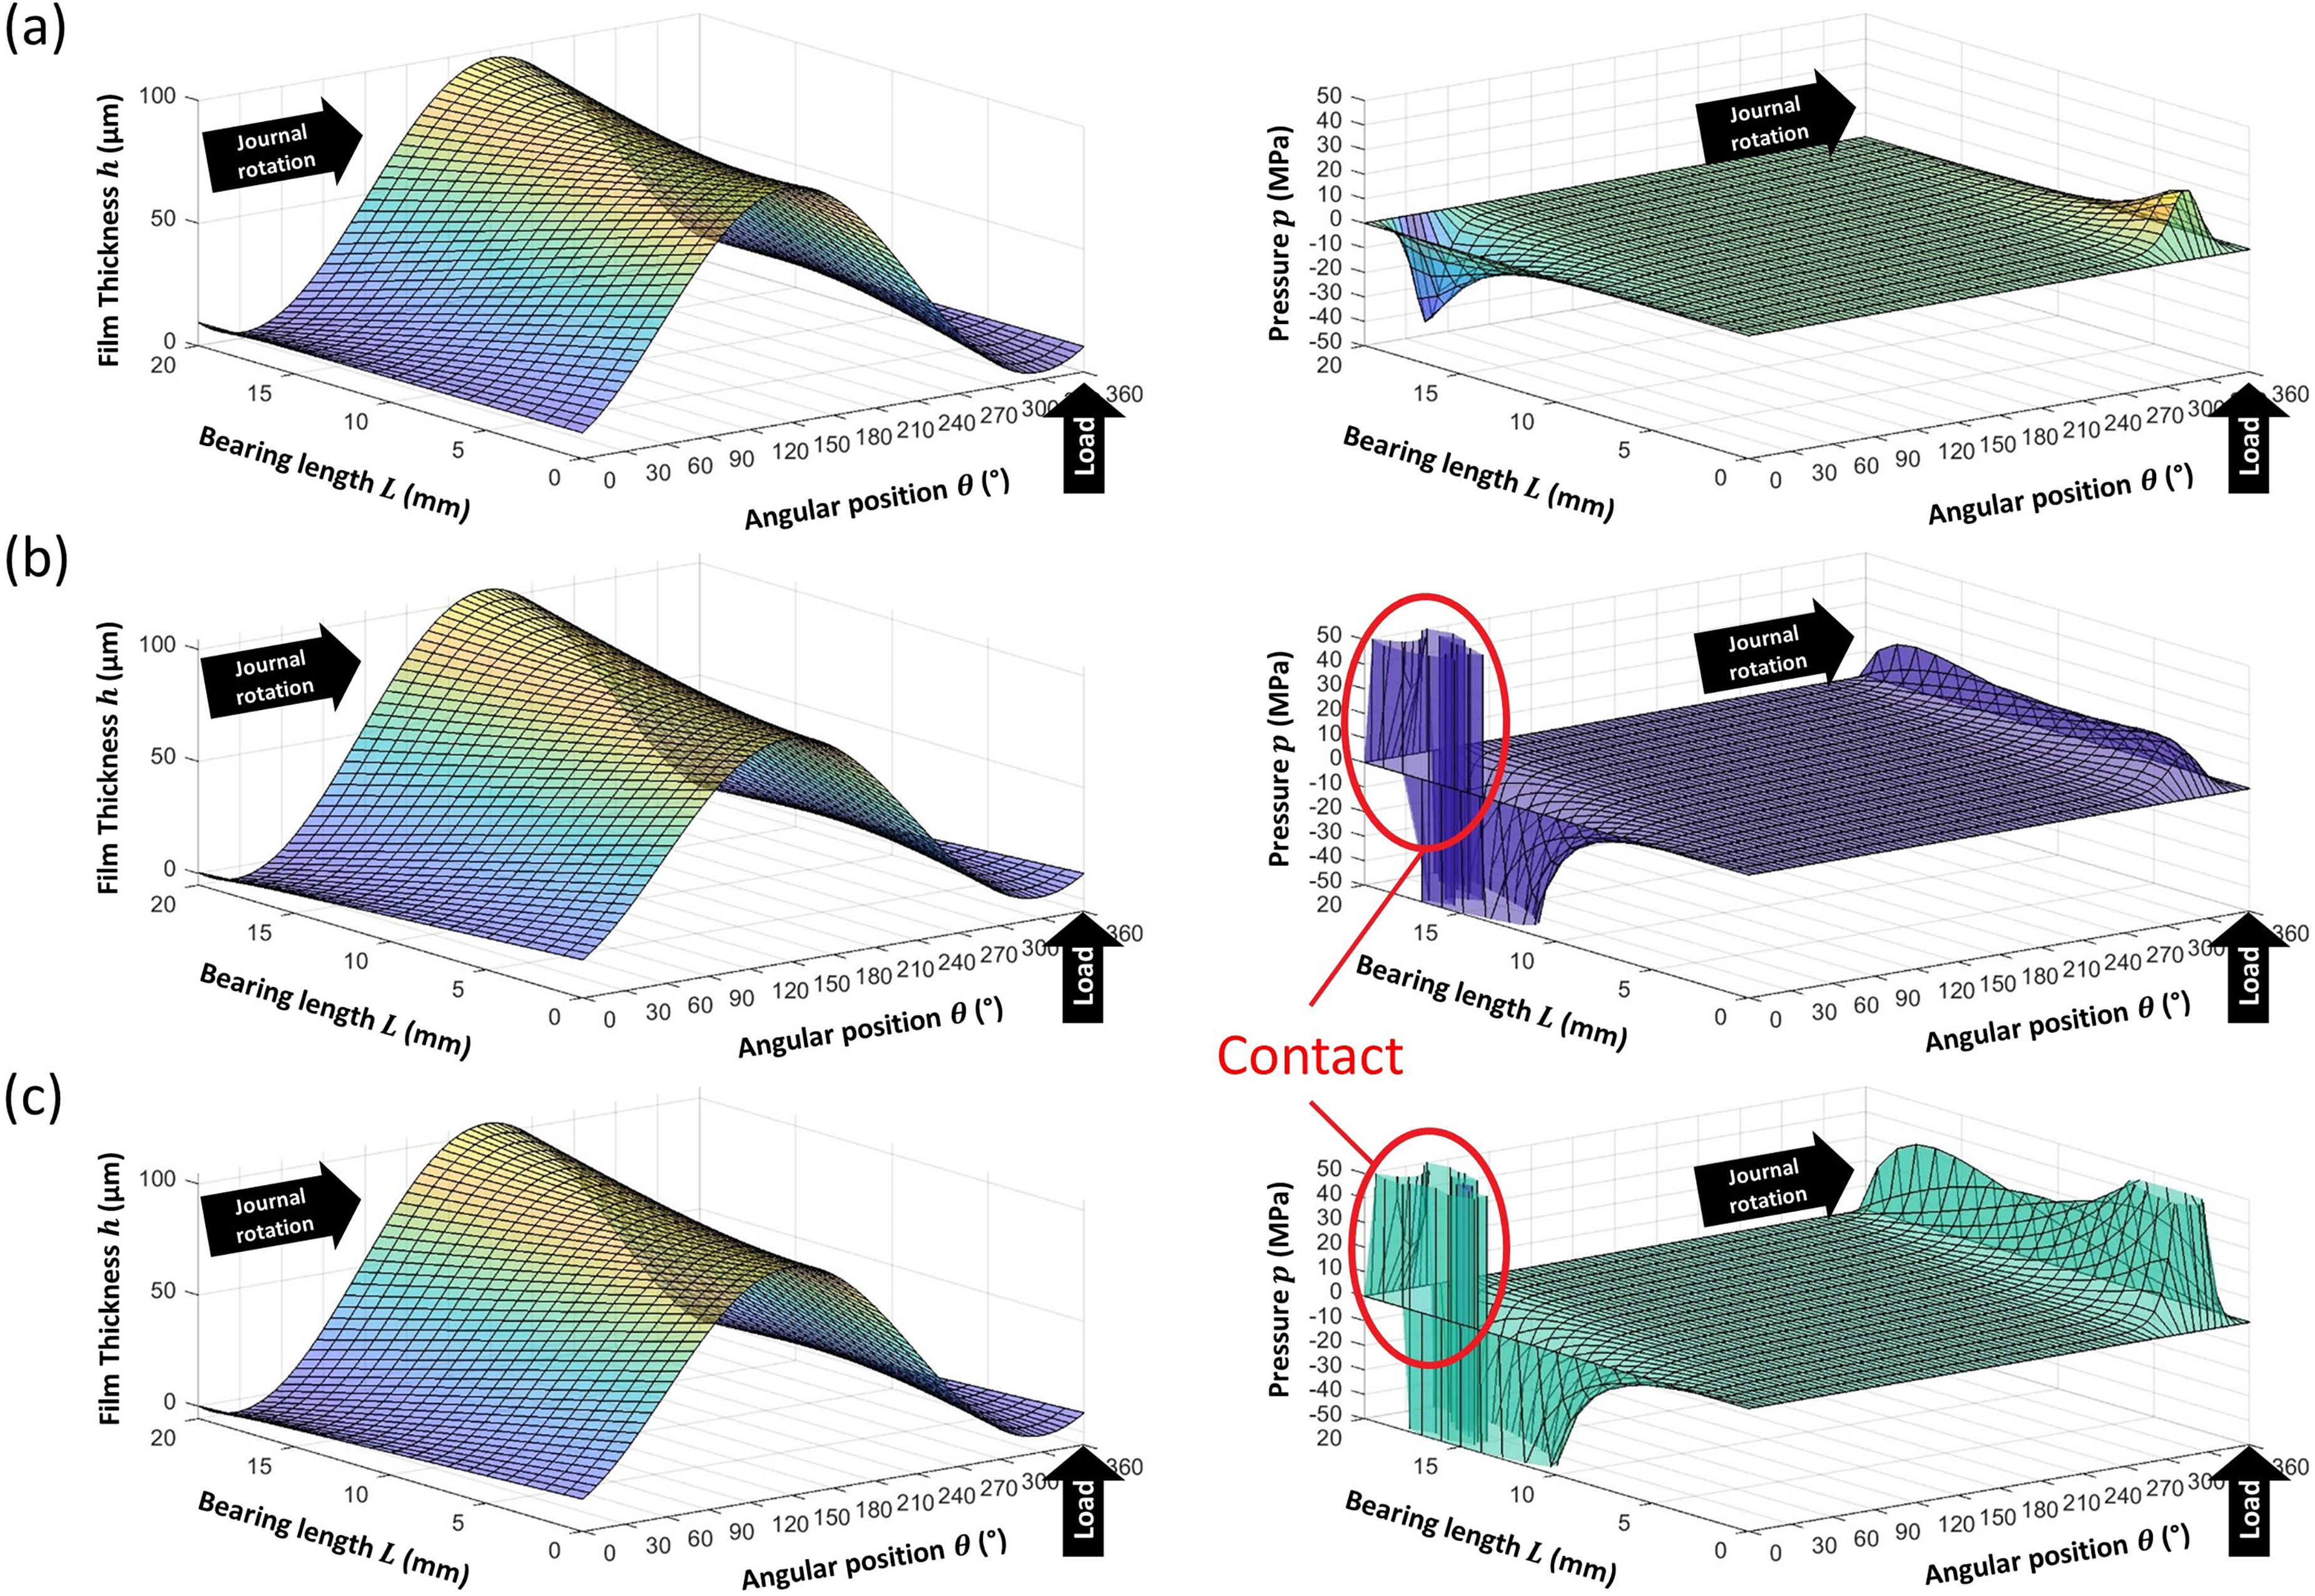
Circumferential oil film thickness and pressure distribution along the bearing length for (a) 0.5 kN, (b) 1.0 kN and (c) 1.5 kN load.
The pressure distribution along the bearing length was averaged for each loading case, from
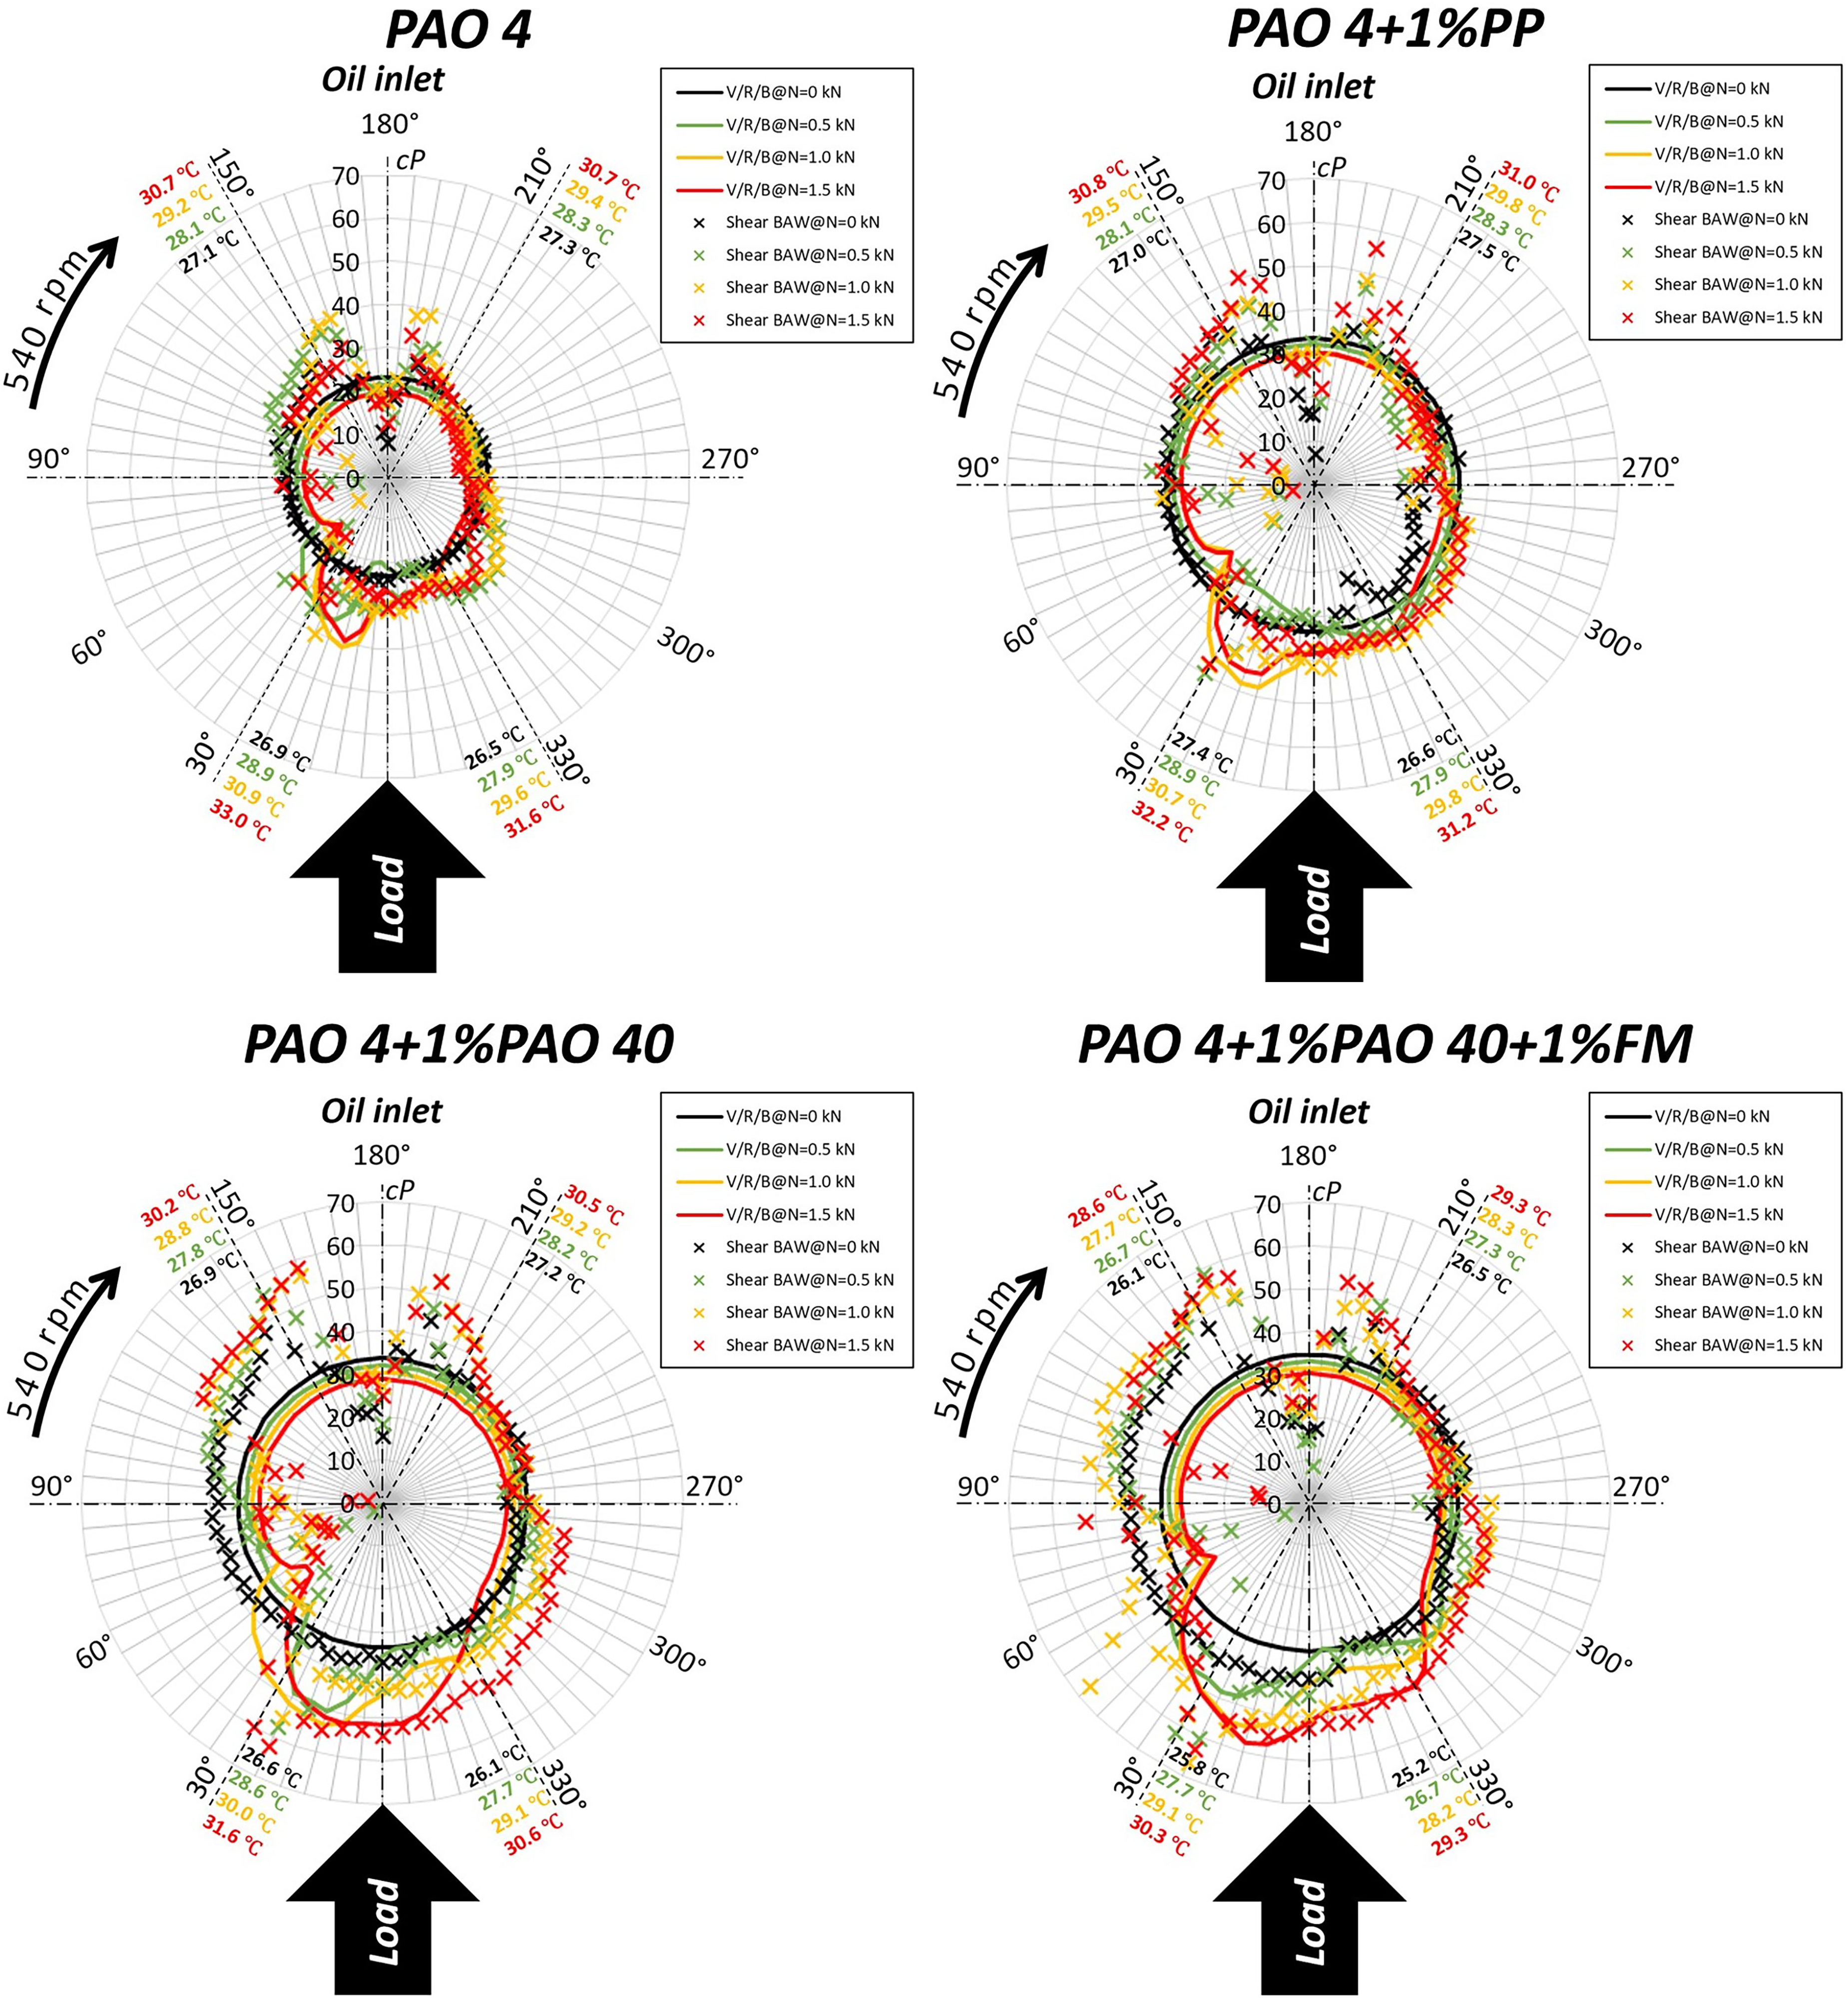
Circumferential viscosity profiles of the PAO 4 blends, at 540 r/min and different loading conditions.
According to the temperature readings, pressure and oil film viscosity, four regions can be distinguished in Figure 21 similar to,
5
shown schematically in Figure 22:
In Region 1, the oil entered the bearing through the supply hole and a massive apparent drop on the viscosity values was recorded, most likely due to the presence of air bubbles as a result to the oil supply hole design. Bubbles create air gaps, thus the wave is reflected from a solid-air interface, with reflection coefficient value ∼1, which leads to a prediction of almost zero viscosity. This is followed by an increase in measured viscosity. It is not clear why this occurs and further testing is required to identify the cause for this behaviour. In Region 2, the oil viscosity was mainly a function of temperature up to 270° angle. After that, viscosity started to increase as pressure developed in the bearing, as shown in Figure 20. The results suggest that the oil film must have been thinner around 345–360° shaft angle, which agrees with the rig configuration. Both predicted and experimental viscosity values are in good agreement in that region. Region 3 is characterised by increased temperature (thermocouple readings), high contact pressure (Figure 20(b),c) and high viscosity (Figure 21) around 30° angle, due to contact between the journal and lower bearing sleeve. In the case of metal-to-metal contact, the reflection and transmission coefficients are affected by both the oil viscosity and the solid contact, leading to misleading viscosity values. Equations (2) and (28) assume that the reflections and transmission coefficients, respectively, are only function of the liquid viscosity and neglect the effect of the solid contact. This could be potentially avoided by additional calibrations or by incorporating it in the models. After 30°, viscosity decreased to almost 0, most likely due to cavitation. In that case, ultrasound was reflected from a solid-air interface, leading to reflection coefficient values that approached 1 and to almost 0 viscosity.
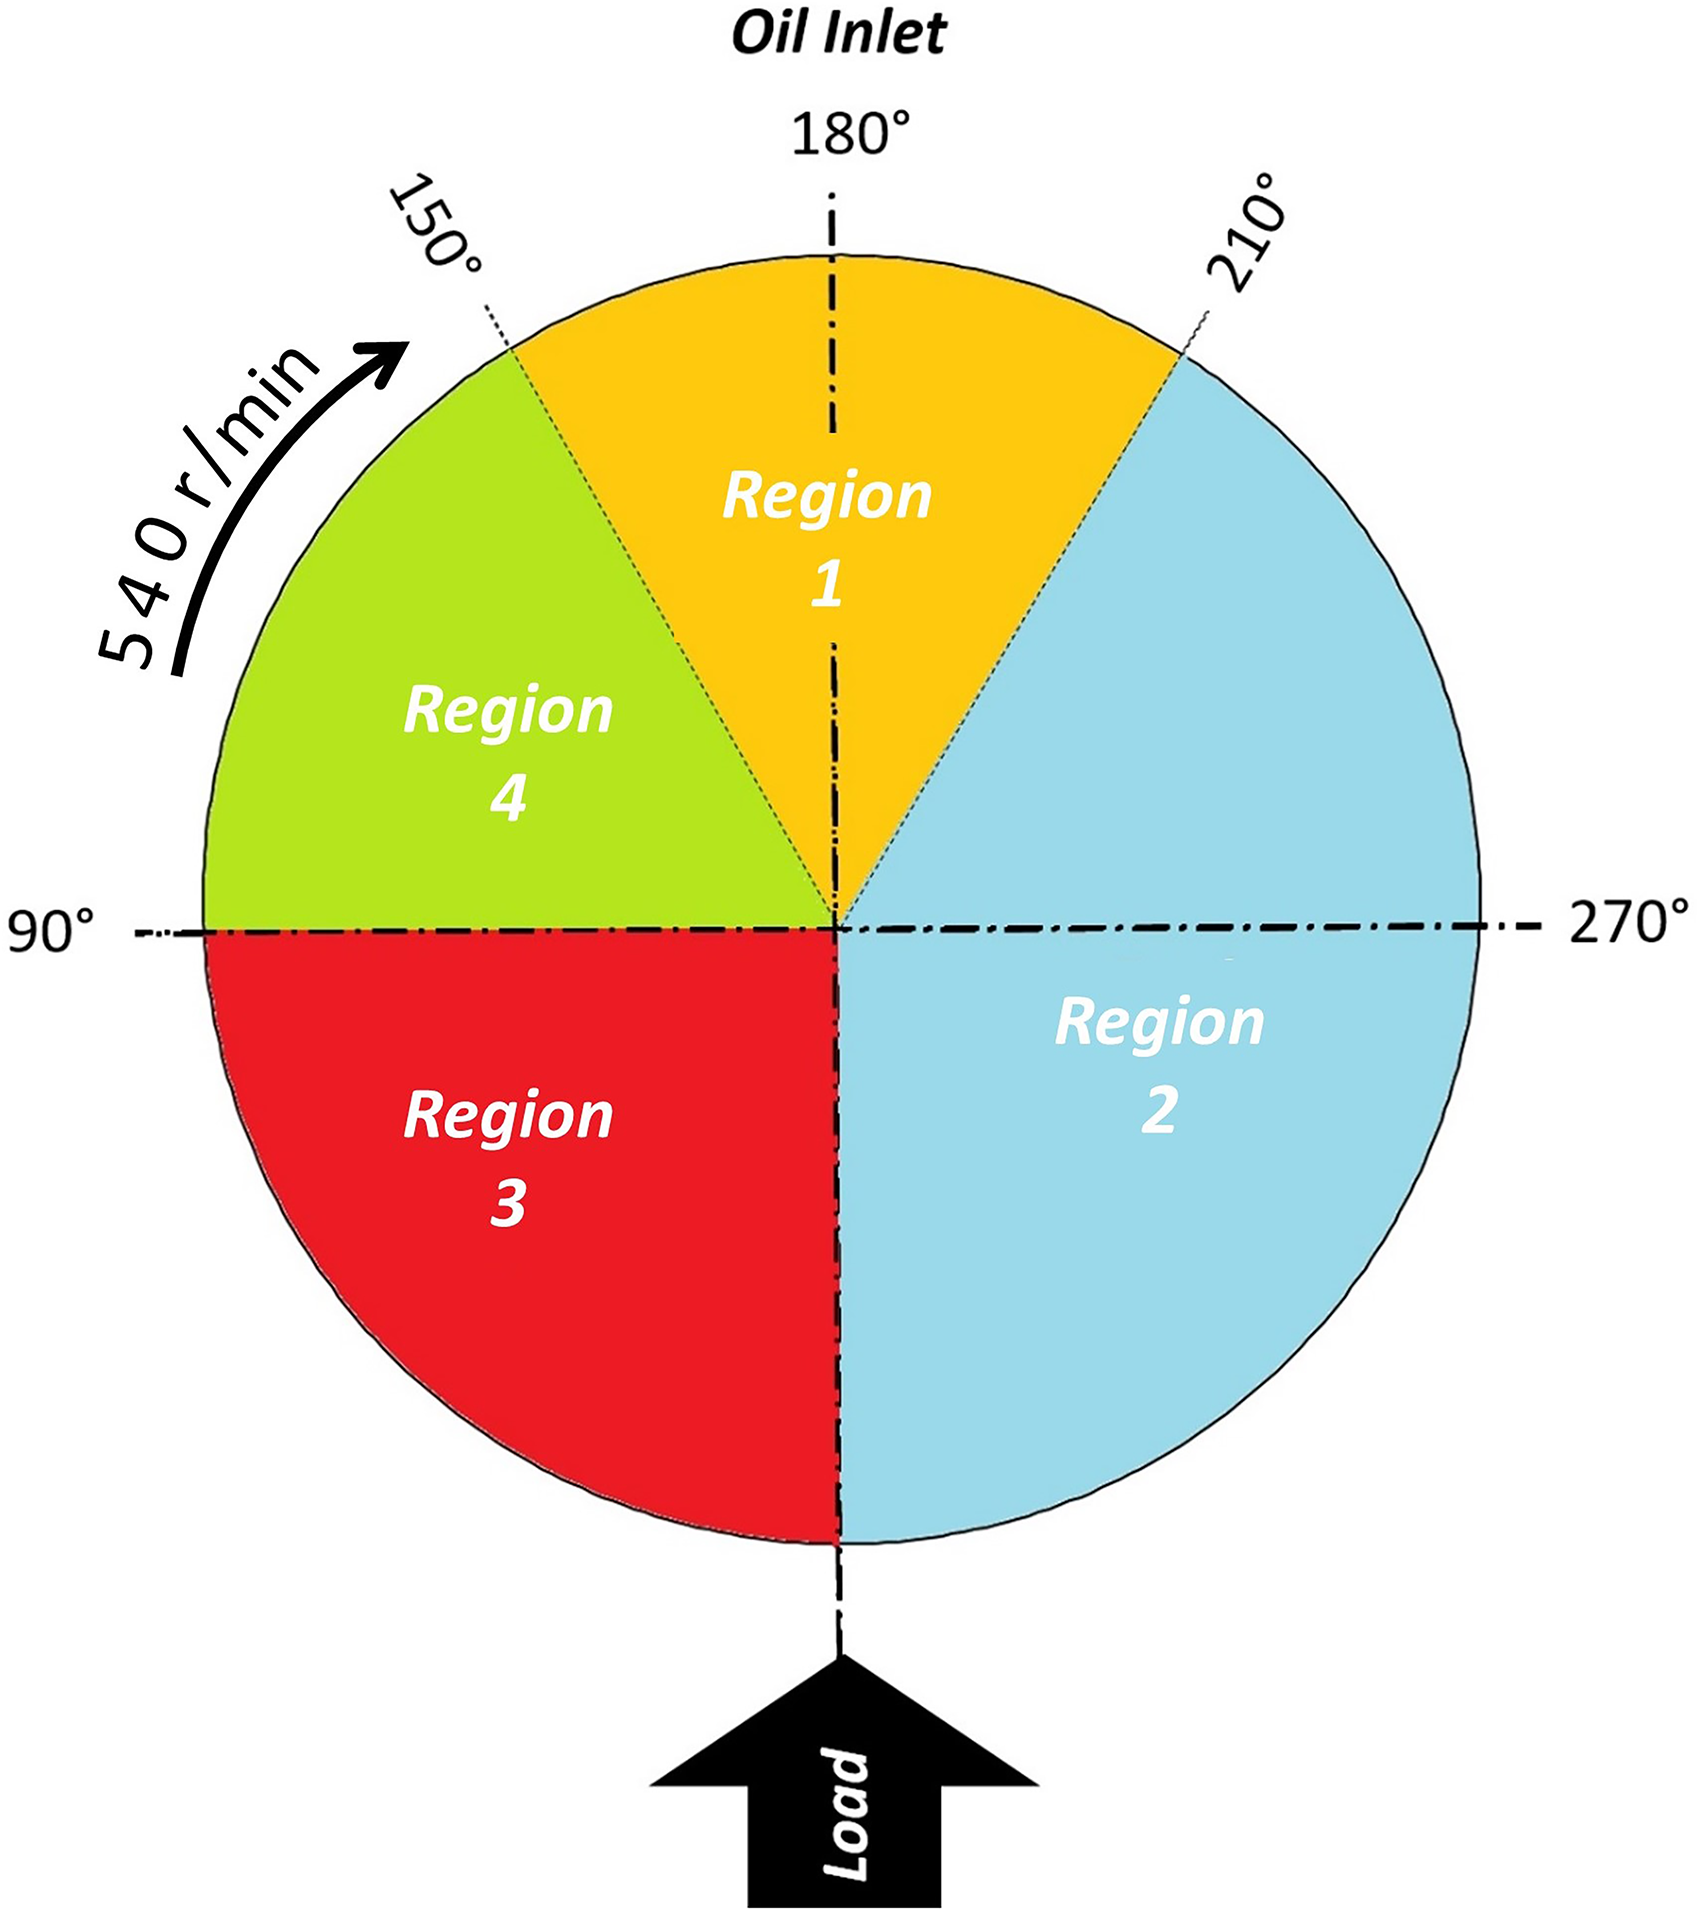
Oil film regions due to loading.
• The cavitation region was extended halfway to Region 4, as shown by the low viscosity values in Figure 21. This is followed by an increase in the viscosity, which was extended to Region 1. The increase in viscosity is most likely related to the oil supply hole design since viscosity appeared to be increasing around the hole boundaries.
Comparison of shear BAW and Sh-SAW methods
In order to compare these data with the SH-SAW method, the BAW viscosity values were averaged over the 300° to 60° region (i.e. the same as the SH-SAW travel path). The results from the comparison are shown in Figure 23.
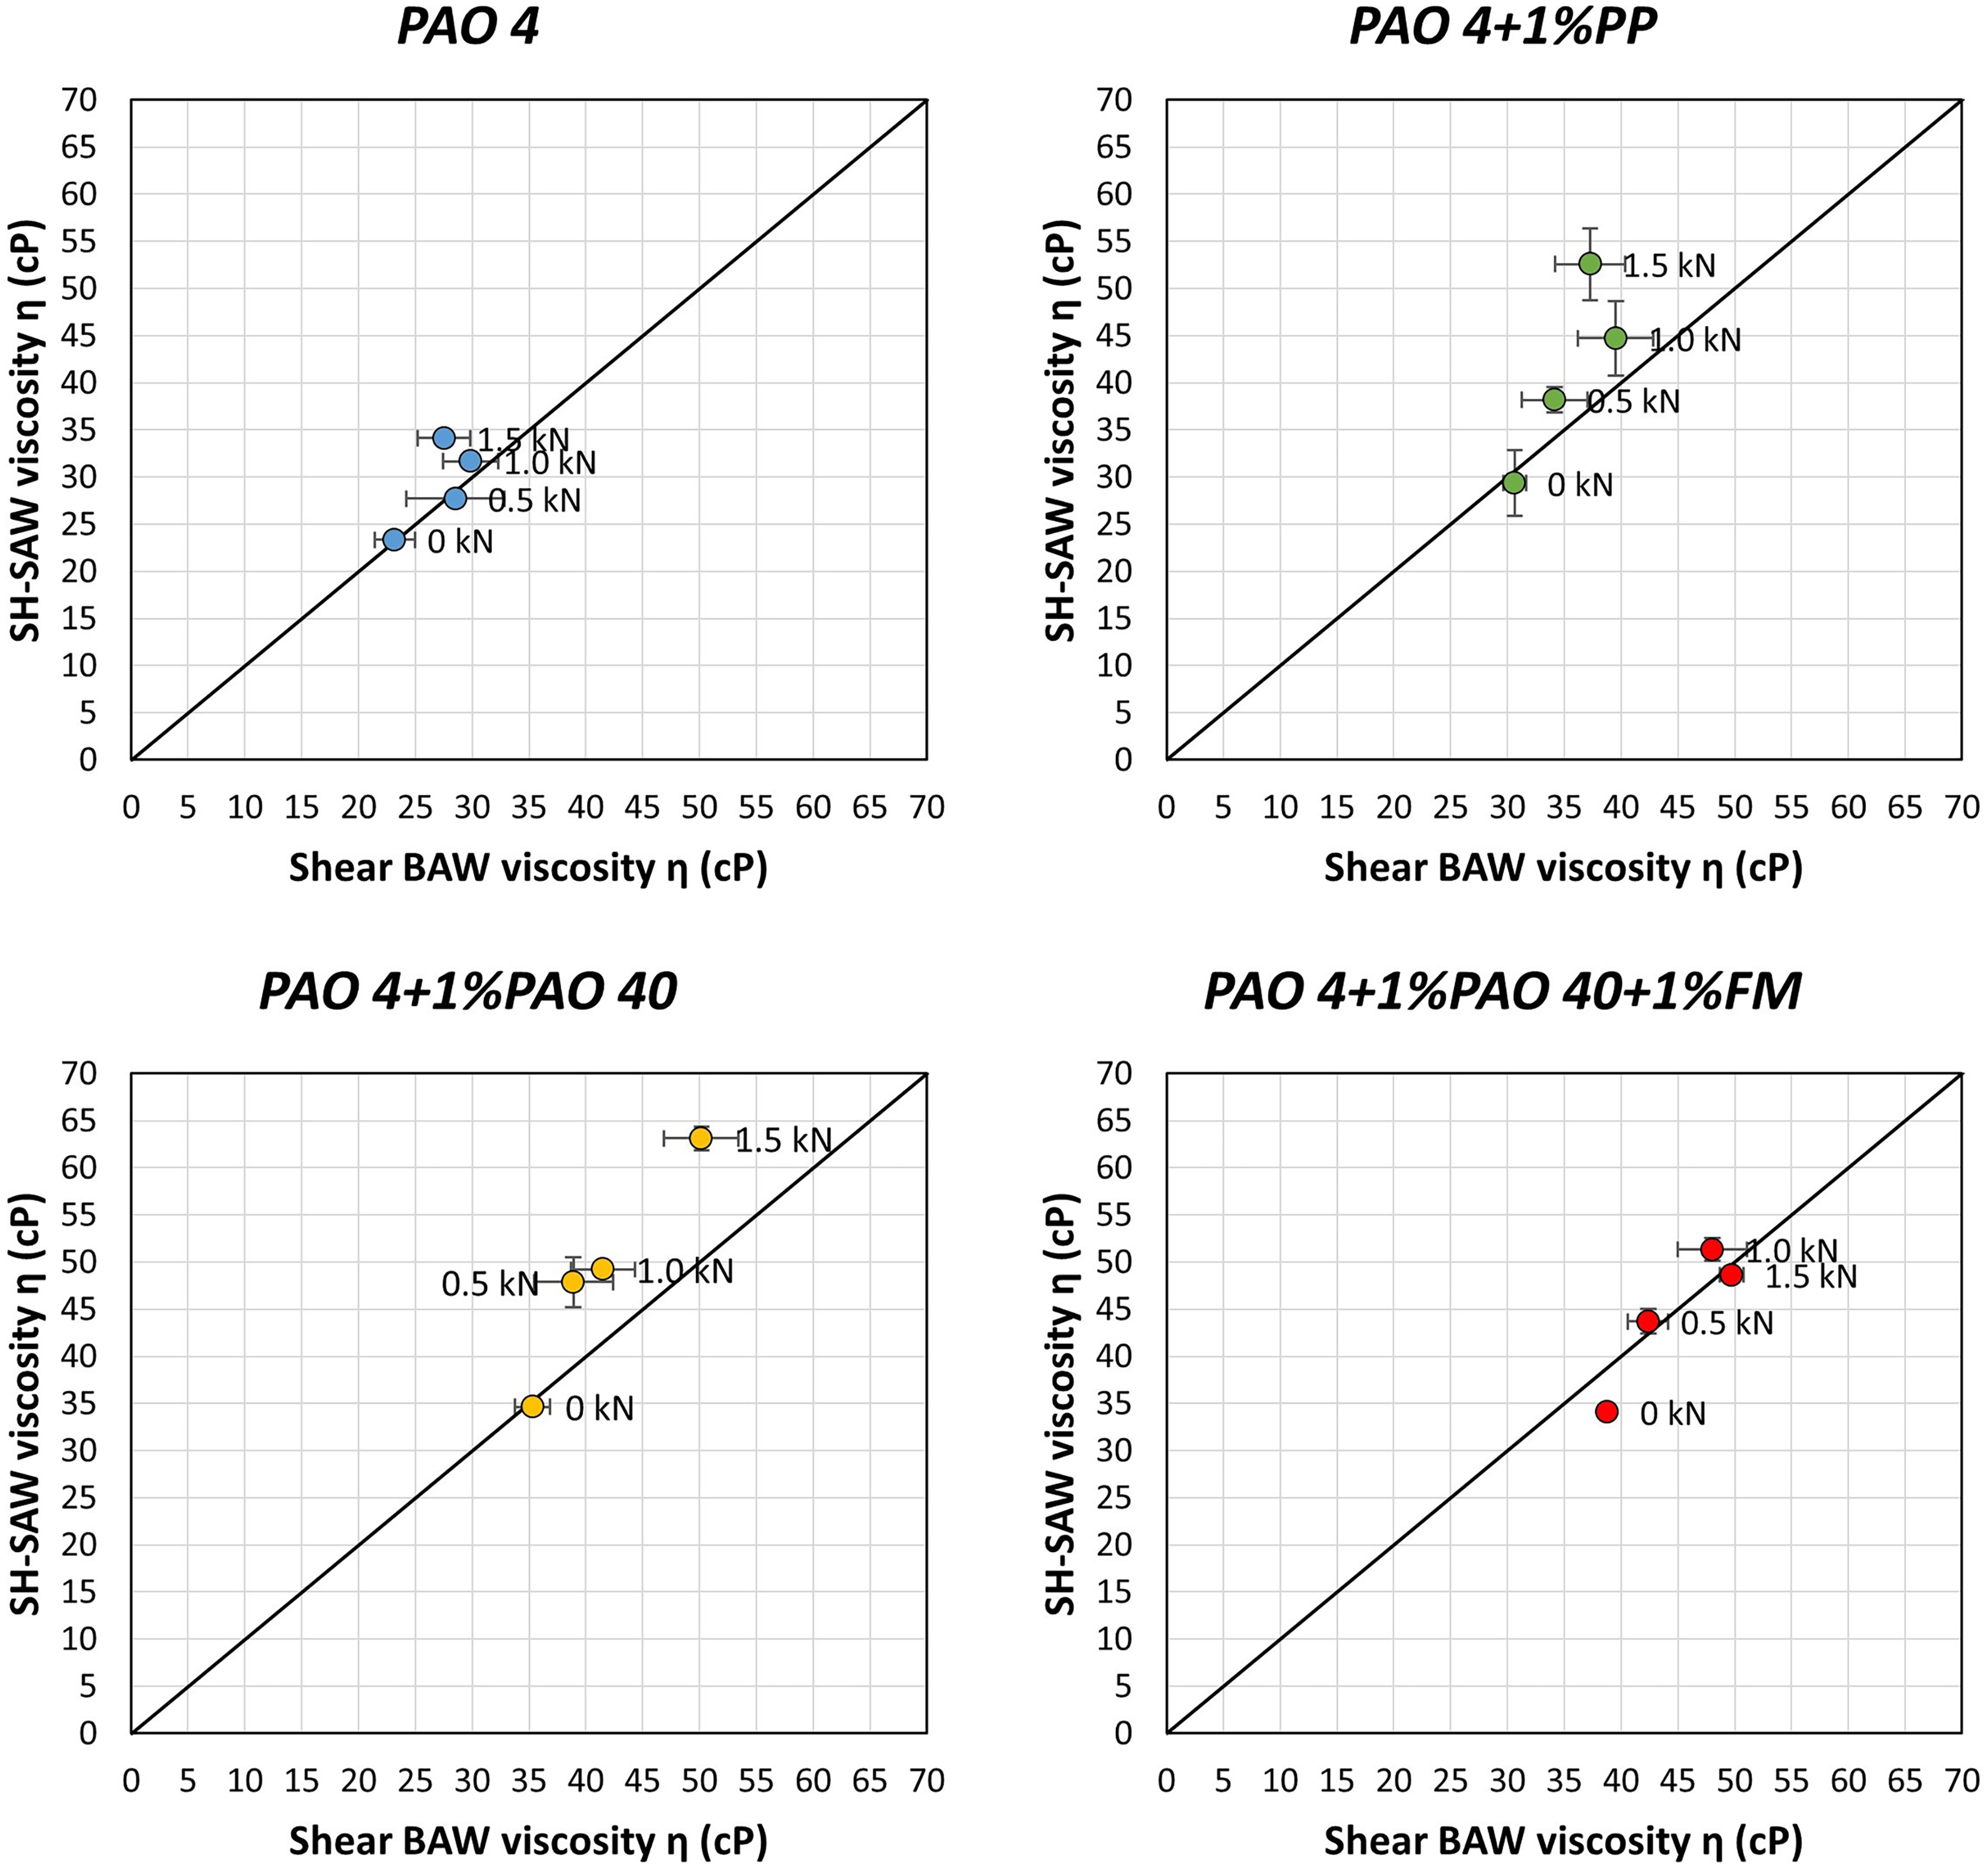
Comparison between shear BAW and SH-SAW methods for measuring oil film viscosity at the high pressure region (300° to 60°).
According to the graphs in Figure 23, the viscosities measured at the bearing-oil interface with the SH-SAW transducers, are in good agreement with those measured in the journal-oil boundary over the same region, using the BAW ultrasonic shear transducer. The results provide some level of validation for both methods; previously, experimental results using each method were compared to expected datasheet or bench-top measured viscosities.
Differences between the methods can be attributed to the different depths the SH-SAW
15
and shear BAW
23
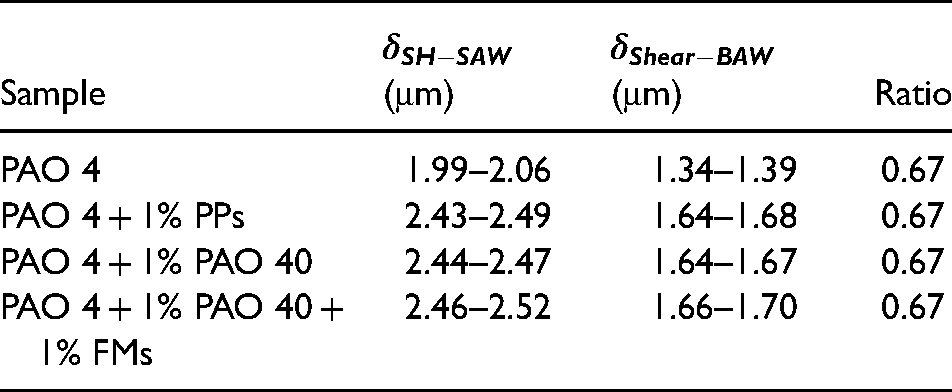
penetrate inside the oil sample. In both cases, the penetration depth 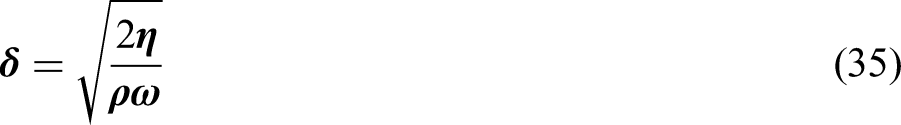
The range of the SH-SAW and shear-BAW penetration depths in the different oil samples, for the different loading conditions.
Conclusions
This work has presented the implementation of SH-SAWs for measuring viscosity of oil films, in-situ in a journal bearing application. A rotating journal and a bearing were set up in a rig, where different loading conditions were applied to create a separating oil film. The minimum film thickness due to loading and rig design, was expected to occur at the lower bearing sleeve, which was instrumented with two angled SH-SAW transducers to measure the changes in oil film viscosity with bearing load.
According to the results from four test samples, the viscosity values measured with the SH-SAW method, were compared to conventionally measured viscosity and found to be in good agreement for the unloaded cases. Viscosity increased significantly for the loaded cases and no longer followed the conventionally measured values, indicating a possible misalignment between the journal-bearing centres.
In addition to the SH-SAW method, an ultrasonic shear BAW was used to measure the oil film viscosity in-situ in the journal bearing set up, for comparison. The transducer was installed inside the rotating journal, which allowed measurements of the oil film viscosity circumferentially. In comparison, the Reynolds equation for journal bearings was used to predict the pressure profile, which was used in Barus equation to predict the viscosity circumferentially. Misalignment between the journal and bearing centres was taken into consideration in the calculations of the pressure and viscosity profiles, and both the experimental and numerical results exhibited similar behaviour. Surface damage on the lower half bearing sleeve after testing, supported the misalignment theory.
The viscosity measured with the angled SH-SAW transducers at the bearing-oil film interface, was found to be in good agreement with the viscosity measured with the ultrasonic shear BAW transducer at the journal-oil film boundary. Both methods successfully distinguished differences in the test samples, according to their viscosities.
The results of this study support the use of the SH-SAW method for measuring oil viscosity in-situ in the film. The SH-SAW method requires minimum preparation for installing the ultrasonic sensors and thermocouples on a bearing sleeve. A function generator, a digitiser and a temperature DAQ are the only hardware required for recording the ultrasonic and temperature data, while the low complexity involved with the data processing to determine viscosity make SH-SAWs a method to consider for real time viscosity measurements. Potentially, this approach could be used in engine main bearings to monitor oil film viscosity during engine operation.
Footnotes
Declaration of Conflicting Interests
The author(s) declared no potential conflicts of interest with respect to the research, authorship, and/or publication of this article.
Funding
The author(s) disclosed receipt of the following financial support for the research, authorship, and/or publication of this article: This work was supported by the Lubrizol, Engineering and Physical Sciences Research Council, (grant number EP/N016483/1).