
Abstract
To investigate the tribological interaction and wear mechanisms of polytetrafluoroethylene-lined radial lip oil seals in service, a sleeve, seal and lubricant sample taken off a rotating rig are studied. The test was terminated at 72 h, after severe leakage in the final 15 h of the test. All three components are studied using a coherence scanning interferometer and environmental scanning electron microscopy to investigate wear after testing. Results show a wear band on the aerospace grade case-hardened sleeve, appearing as a ‘polished in’ area by the seal. A study of the filler content of the polytetrafluoroethylene coating uncover glass fibres, calcium carbonate, carbon and graphite layers present, assumed responsible for the wear to the sleeve. The polytetrafluoroethylene coating is a 300 μm coating, distinct from the bulk elastomer. This finding is confirmed after observing this layer on both, the tested and new seal lip. Wear of the seal lip is measured and facilitated by comparison to the identical new seal. Lastly, debris from the seal and sleeve wear are found in the lubricant sample.
Keywords
Introduction
The primary purpose of an oil seal is to prevent loss of oil from any given system. Additionally, a seal prevents debris from entering into the system. Zero-leakage seal is an ideal situation, but all seals leak to some extent. In some cases, this leakage is referred to as ‘emission’ because it is almost negligible. 1 In the aerospace industry, oil seals are used in both aero-engines and helicopter gearboxes to prevent leakage of oil. The industry standard for an ‘acceptable’ leakage level for such applications is known to be 1–2 ml/h, and any excess is undesirable. 2 Leakage of oil from the bearing chamber can be detrimental to the overall safety of the aircraft, making it important to enhance seal performance and prolong the life expectancy of seals.3–5
To improve the performance of seals, it is important to learn more about the environmental conditions encountered in service. Based on data collected, the geometry, design and materials utilised for the seal design are optimised for performance. Therefore, it is essential to inspect seals post-service and collect data on their condition, wear and damage endured. This inspection data can be analysed to understand the design requirements of seals. 6
Shen et al. 7 described an investigation of a filled polytetrafluoroethylene (PTFE) seal and stainless steel shaft sliding against each other to study the friction and wear on the components for sealing applications. Due to its delicate nature, a filled PTFE matrix with microparticles and nanoparticles is used to prevent wear losses. However, sealing elements are often subject to abrasive wear due to these fillers or other factors such as particles suspended in the lubricant, dust, rough shaft surface or even wear debris. Shen et al. 7 found that the abrasive particle size had a significant effect on the wear mechanism, where moderately sized particles cause evident wear to the shaft. Additionally, if abrasive particles end up embedded in either the seal or shaft, it will result in constant two-body wear. They demonstrate that in the case of larger particles, it is difficult for the abrasives to insert themselves into the interface between the tribopair. They will, however, eventually embed into the PTFE and cause two-body wear. This is similar to the effect seen in moderately sized particles, although these particles will find it easier to enter the interface due to their size. Smaller particles (<10 µm) will enter the interface easily and they found that these particles embed themselves to the 316L steel shaft instead of the PTFE. They explain this by stating that the strength of the PTFE is much lower than that of 316L and the small particles cannot embed into the PTFE firmly.
Kanakasabai et al. 8 studied the surface of an elastomer seal lip before and after testing against stainless steel shafts and shafts with micro-asperities to investigate the sealing mechanism. While this work is on elastomeric seals, it does present how the surface characteristics of the shaft directly affects the amount of wear to the seal, and affects the reverse pumping effect too. This work also finds that with identical shaft surfaces, there can be large variability in seal performance due to the variability in the sealing zone characteristics that develop in each case due to wear of the surfaces overtime.
Further, previous research investigates the design of seals. Horve's 9 work investigated the surface roughness of a seal and shaft. His work provides a specification for the shaft roughness necessary for successful sealing. He also shows that for successful seal operation, the seal must have a rough wear track because a smooth wear track results in leakage. An unused seal will acquire a desirable surface roughness after a running-in period after the rubber skin wears off. DIN 3760/DIN 3761 provides a range of optimum shaft roughness Ra of 0.2–0.8 μm, whereas ISO 6194 provides a smaller range of Ra of 0.2–0.5 μm. A shaft surface ‘rougher’ than required can result in excessive and undesirable wear, thus decreasing seal life. Consequently, a shaft surface ‘too smooth’ can also be detrimental as the seal will not wear in as required, potentially resulting in high leakage levels. Horve 9 concluded that this phenomenon is a critical aspect necessary to achieve reliable seal performance. Laboratory tests specify an optimum Ra of 0.3 μm. 10
Wang et al. 11 showed how grooves and textures on the shaft surface can achieve an ultra-low stable coefficient of friction (COF) and therefore, wear between the seal and shaft. Paige and Stephens 12 revealed that the environmental conditions endured by the seal in service would largely effect the formation of the roughness geometry and micro-asperities. Further, their work shows that in addition to the rubber skin of the seal experiencing wear, the tip of the lip will flatten over time during operation. A review of radial lip oil seals 13 presented by Baart and co-authors summarise some of the critical aspects of sealing concerning the micro-asperities on the surface.
A recent study by Stead et al. 14 on the tribological mechanisms between a seal and liner using a polymer combination instead of a conventional steel and PTFE concluded that a higher surface roughness is correlated to a higher COF. They demonstrated that the specimens with a higher COF also experienced a higher degree of wear. The consistency of the surface roughness profile was also important, where a less consistent profile led to a higher COF.
Gül et al. 15 conducted an experiment to compare radial lip PTFE seals with commercial elastomer lip seals regarding their seal life. Sliding speeds of 1, 3 and 5 m/s are tested. They found that the wear of the PTFE seal increased with increasing sliding speeds. Weber and Haas 16 also confirmed that compared to elastomeric seals, PTFE seal failure is largely due to wear of the sealing lip and plays a critical role in determining the working life of that seal. Similar to this, the investigation also reveals excessive wear of the PTFE-lined lip of the seal and further investigation is required to understand how this has happened through a thorough characterisation of the sealing system.
A similar study to ours by Ran et al. 17 investigated the wear of PTFE seals for an automotive application. They completed analysis of the wear mechanisms of the seal using scanning electron microscopy (SEM) and found that the wear of the PTFE composites was due to abrasion. Over its service period, the wear developed thermal fatigue and abrasive wear which resulted in the deterioration of these seals.
Another surface analysis study by Gheisari and Polycarpou 18 investigated the effect of contaminated lubricant on a tribopair of graphite-filled PTFE against tool steel. Both, clean and contaminated lubricant are utilised in this test to study the wear and friction with these varying conditions. Results demonstrated higher friction and wear in the case of the contaminated lubricant. Energy dispersive spectroscopy (EDS) analysis showed that the particles embed into the polymer – this causes wear to the counter surface. SEM analysis revealed that mild abrasion was the dominant wear mechanism.
Ding et al. 19 reported on the formation of a transfer film with a filled PTFE material and counterpart tribopair in the case of dry sliding contact. Surface analysis methods similar to ones used in this manuscript reveal the presence of ultra-thin (nanometres) and thicker (micrometres) transfer films on the steel surface. Further, they found that surface texturing with small diameters may benefit the formation of a thicker transfer film whilst also avoiding abrasive wear.
While radial lip seals are generally elastomeric seals, they can present limited capabilities in high-speed applications. This is mainly due to the high temperatures, pressures and resistance to wear. When radial leap seals cannot make the cut, users resort to more expensive face seals in such instances. PTFE-lined radial lip seals provide an inexpensive solution to regular elastomeric radial seals by bonding in a PTFE coating to provide enhanced properties. The PTFE itself provides better tribological properties, reduces friction at the sealing interface, and subsequently, wear on the seal and shaft. The PTFE coating is not purely PTFE, but is a filled matrix to provide resistance to abrasion and better wear and mechanical properties. PTFE also provides enhanced fluid compatibility with a wider range of chemical acceptance. It is a tactic to extend the life of the seal without increasing costs heavily.20,21
The aim of this paper is to study the wear occurring in these specimens in a dynamic sealing environment in service. This work covers the inspection and analysis of a seal, sleeve and lubricant sample taken from a long-term endurance test lasting a total of 72 h at 5000 r/min. Termination of this test occurs at 72 h due to excessive leakage during the final 15 h. Through this wholesome analysis, a clearer understanding of seal conditions and their tribological behaviours in service is established. The purpose of analysing these three components individually is to improve understanding of wear mechanisms associated with this application of seals and find the points of failure within this entire sealing system. While other research has previously investigated shaft or seal wear, this paper includes analysis of all three of the components interacting in this tribology system to create a wholesome picture of conditions experienced in service for the seal, shaft and the lubricant together. Further, all data collected from this study have been made openly available with the manuscript. Characterisation of the specimens is completed to be able to conduct a thorough analysis of the wear mechanisms. Investigation of the filler content of the PTFE coating applied on the elastomer seal is an approach taken to understand shaft wear and failure of sealing systems in this case. The thickness and specifications of the PTFE-lined seal are unknown prior to the study, and are investigated using SEM. The surface topography of the sleeve is studied to quantify and understand the extent of sleeve wear. Wear of the seal lip is quantified in this study, which is seen as extensive wear. Lastly, to confirm the wear debris particles, the debris in the lubricant sample are also studied under environmental scanning electron microscopy (ESEM). The following sections describe the materials used and the thorough testing techniques adopted for this study.
Materials
Sleeve
A sleeve is used for testing as it is economically and logistically more feasible to surface treat small sleeves over long shafts. Further, if there is considerable and excessive wear, only the sleeve will need replacing. Table 1 summarises the requirements for the sleeve according to the various rotary shaft specification standards. Investigating shaft lead, surface roughness and hardness helps reveal if any of these factors are a reason for test failure. The hardness test results are above (Figure 1) while results for the lead and surface roughness reveal that they may be a reason for failure (discussed in ‘Results - Sleeve’ section in depth).
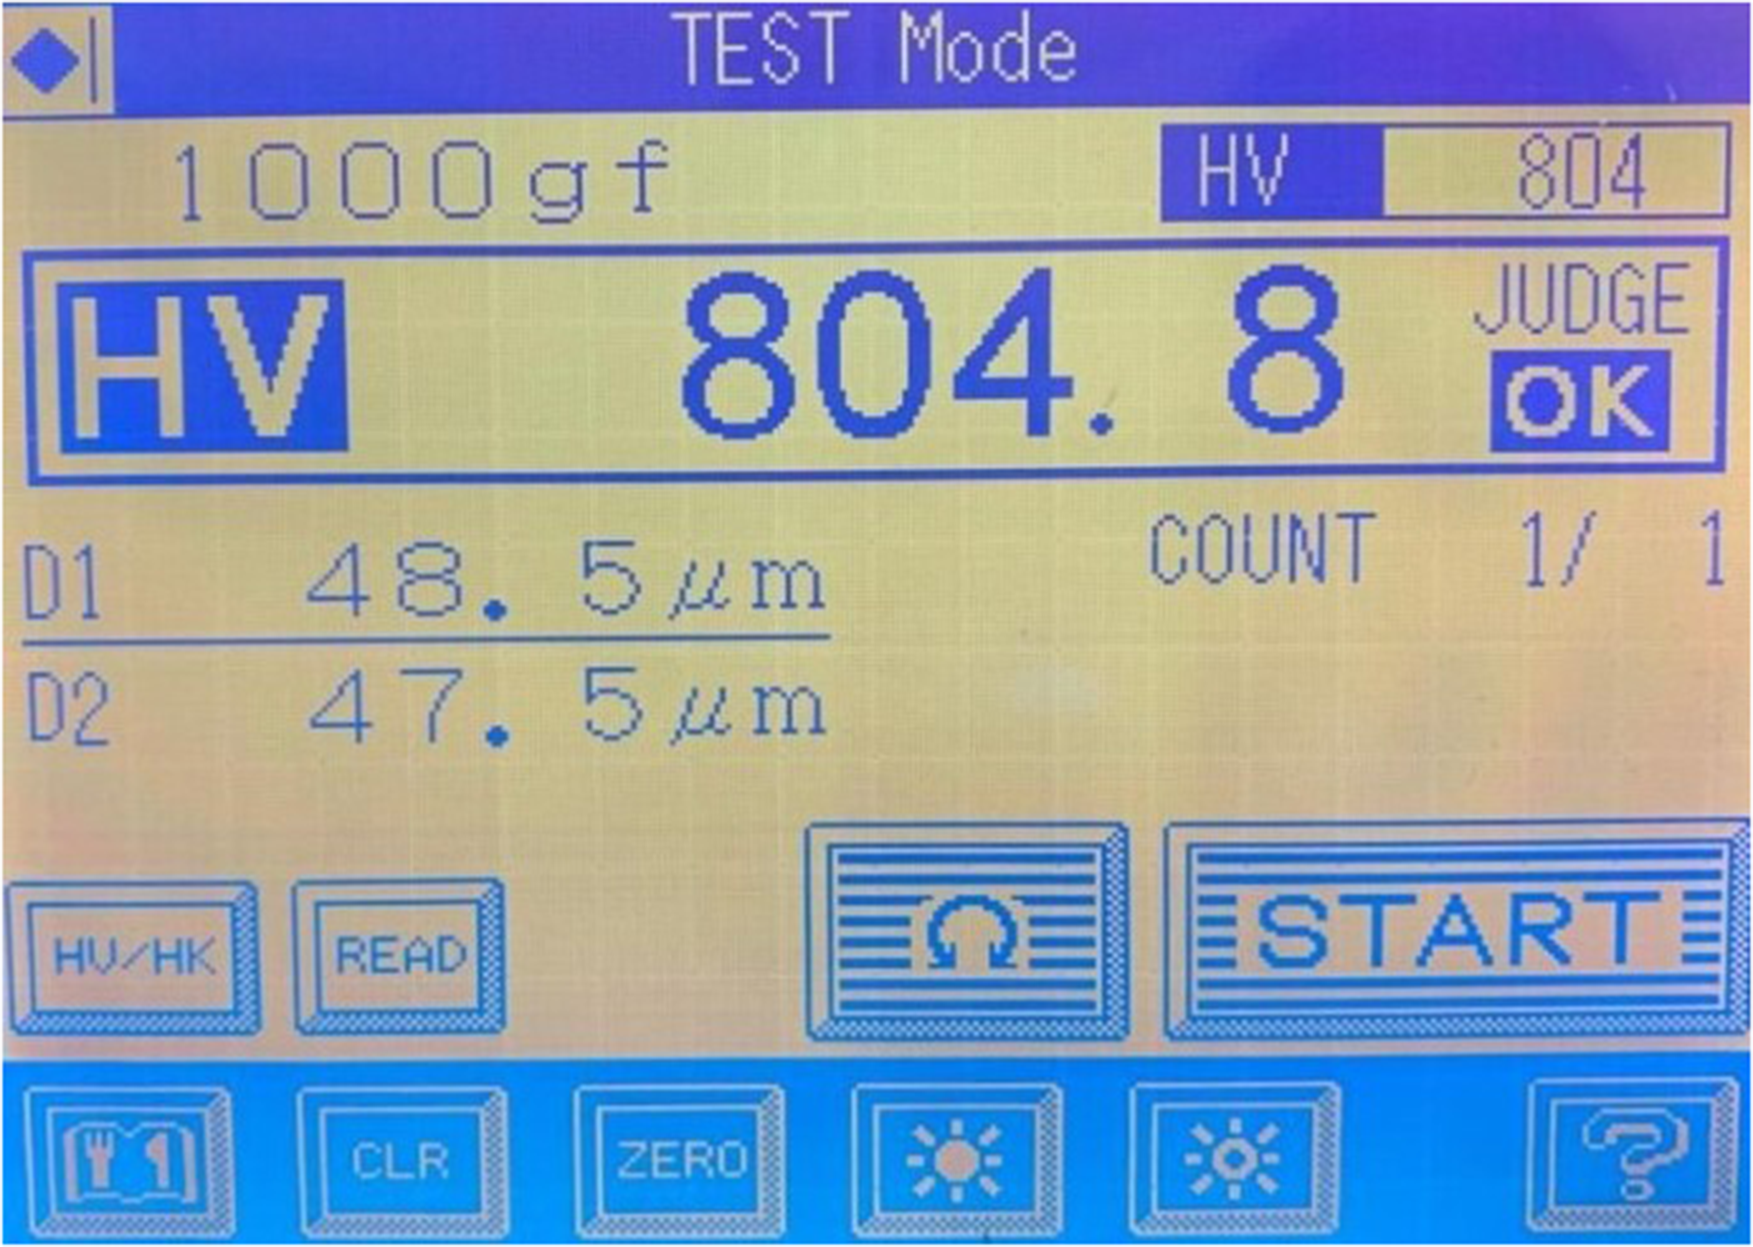
Micro-hardness test for sleeve indicating Vickers hardness of the specimen.
Specifications for radial lip seals mating surfaces (sleeve) according to ISO, DIN and RMA standards.
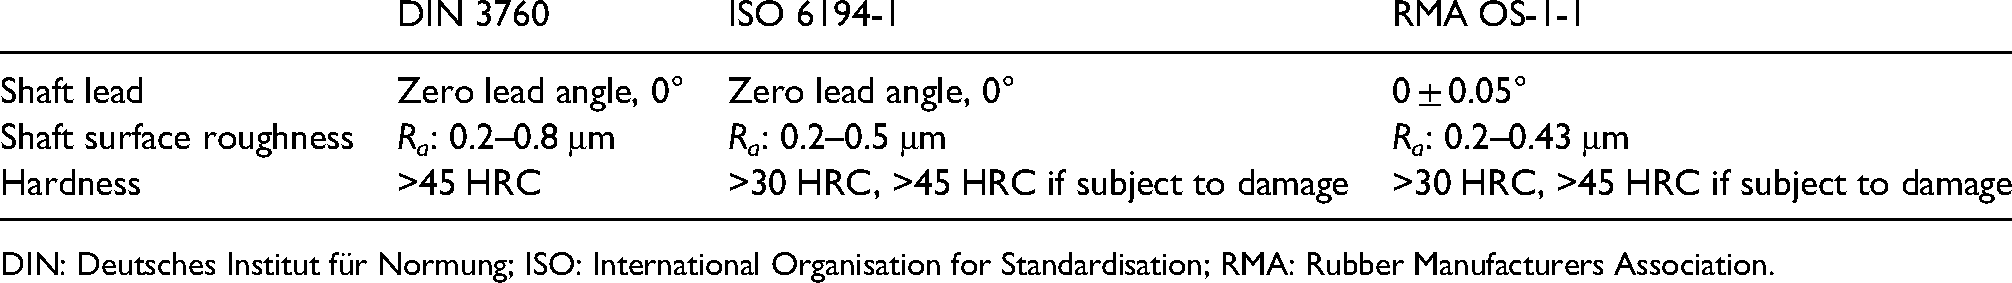
DIN: Deutsches Institut für Normung; ISO: International Organisation for Standardisation; RMA: Rubber Manufacturers Association.
The sleeve in this study (Figure 2) is a steel alloy with standard BS S156, Wr.N 1.6722/3 – British Standard Aerospace Series 4% Ni–Cr–Mo and the surface is plunge ground to the specifications shown in the engineering drawings in Figure 3 to achieve the final dimensions. The outer diameter is case hardened to give a case depth of 0.5 mm and hardness to be >55 HRC. According to DIN 3760/61, the sleeve must be hardened to at least 45 HRC, and as the running speeds increase, the HRC of the shaft must increase too. A micro-hardness test of this sleeve reveals that it has a hardness of 804.8 HV (Figure 1) which corresponds to 62 HRC. This is to cater to the high rotational speed of the test. It also specifies that the minimum depth of that hardness must be 0.3 mm. The sleeve has an inner diameter of 42 mm and an outer diameter of 52 mm. Figure 2(a) shows the top view of the sleeve and Figure 2(b) shows the surface of the seal with a wear track marked with an arrow, ∼1 mm wide.

Dimensions of sleeve is inner diameter = 42 mm, outer diameter = 52 mm: (a) case-hardened sleeve top view and (b) case-hardened sleeve with visible wear track (marked with a black arrow).
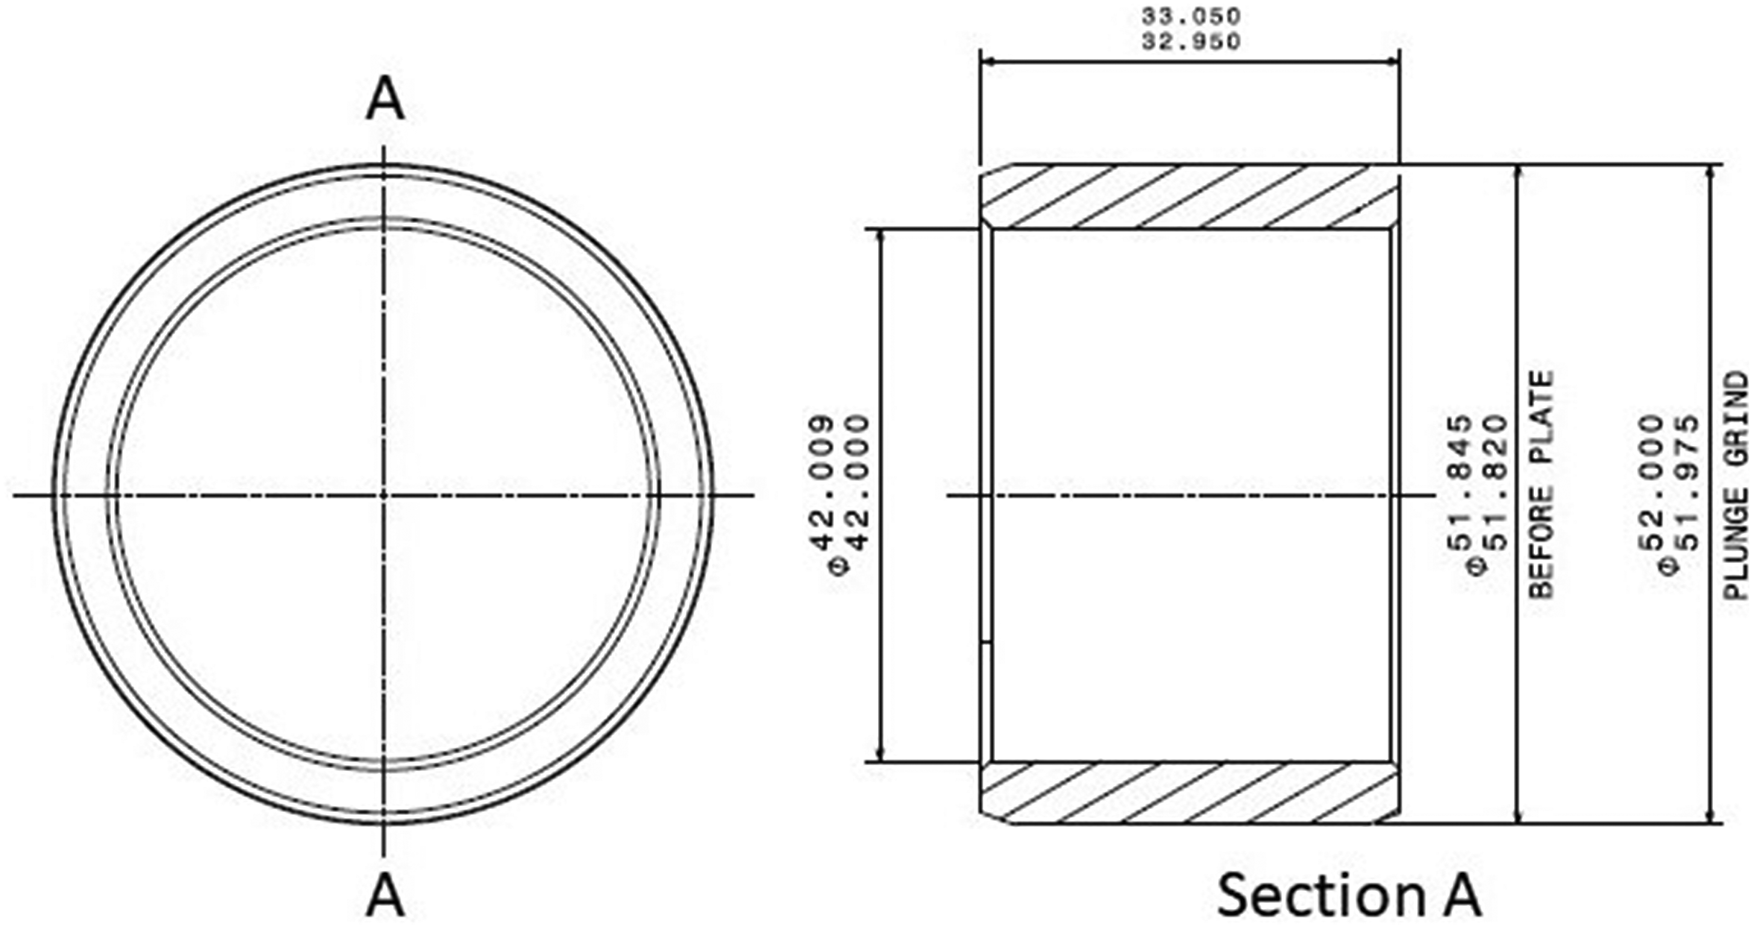
Engineering drawing of the sleeve showing surface plunge ground specifications.
Investigation of the sleeve shown in Figure 2 includes the following:
The surface topography. This requires taking repeated measurements from three randomly selected areas around the circumference of the sleeve to study the surface characteristics of the polished in wear track (the region where the seal was mounted). The lead of the sleeve. A string test and optical profiling determine the presence of a lead angle present on the sleeve surface. Material transfer on sleeve surface. ESEM and EDS techniques help assess whether there is any material transfer of the seal material onto the sleeve surface.
Seal
The seal shown in Figure 4 is a PTFE-lined radial lip seal. This means that this is essentially an elastomeric seal, with a PTFE coating on the lip to improve the tribological properties and lubrication at the sealing interface. The base of the elastomer is a low-temperature fluoroelastomer, commonly known as FKM. It demonstrates excellent heat resistance and seals effectively between −40 °C and 200 °C. The PTFE coating is filled and the sealing lip is pre-loaded with an extension garter spring, 3.34 N (12 ounce-force) pressing down on the lip to ensure seal–sleeve contact and aid in static and dynamic sealing.

Dimensions of seals is inner diameter = 50 mm, outer diameter = 72 mm: (a) polytetrafluoroethylene (PTFE) radial lip seal top view (1 = 15 mm, 2 = 25 mm) and (b) drawing schematic of radial lip seal with garter spring and dust lip.
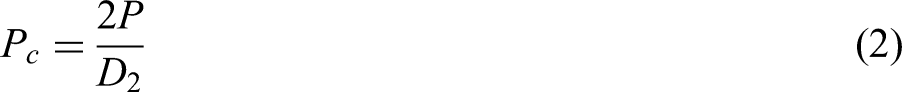
The seal is designed with a garter spring to provide the initial force and maintain that force on the lip as it presses down on the sleeve surface. Due to the environmental conditions the seal is exposed to, the elastomer will age overtime. However, the garter spring is heat treated at a temperature higher than the operating thermal level of the seal to ensure that it will remain stable and unchanged in service, even as the seal material wears. Tightly wound, the garter spring has an initial tension. Equation 1 demonstrates the total force exerted by the spring, a summation of the force needed to overcome the initial tension and the force due to the spring rate. As mentioned above, the design of these springs is such that they provide a stable and constant force as the seal wears and thus have as low a rate as possible. The load of the spring (P) is the initial tension (P1) plus the load due to spring rate (kf) (equation 1). The load of this 12 ounce-force seal is 3.34 N. Calculation of the radial load of the seal (Pr) includes using the circumferential load (Pc) (equation 2). D2 is the maximum extended inside diameter of the seal. The circumferential load, Pc, of this seal is 0.1336 N/mm. The final radial force of the seal is calculated using equation 3, and is 20.9 N.

A durometer test measures the shore A of the seal elastomer using the handheld device presented in Figure 5. This test reveals that the base elastomer of the seal has a shore A of 70, which is a standard seal elastomer hardness. The seal manufacturer confirms the hardness of the base rubber of the seal as shore A 70 as well. To draw a comparison between the shore A of PTFE to this elastomer, the shore A of PTFE lies between shore A 90 and 100 (shore D, 50 and 60), but this seal is merely PTFE lined and is a very thin layer bonded onto an elastomer. Thus, the hardness of this seal is that of a standard elastomer rubber used in elastomeric seals. It is clear that the PTFE coating on lip does not provide the stiffness of a fully PTFE seal, or increase the stiffness at all. Shore A 70 provides the stiffness of a regular elastomeric seal. Therefore, we must conclude that the purpose of the coating may be to improve the tribological properties of lubrication and wear at the sealing interface. We will investigate the PTFE coating in later sections of this paper by studying the filler content of the polymer matrix.
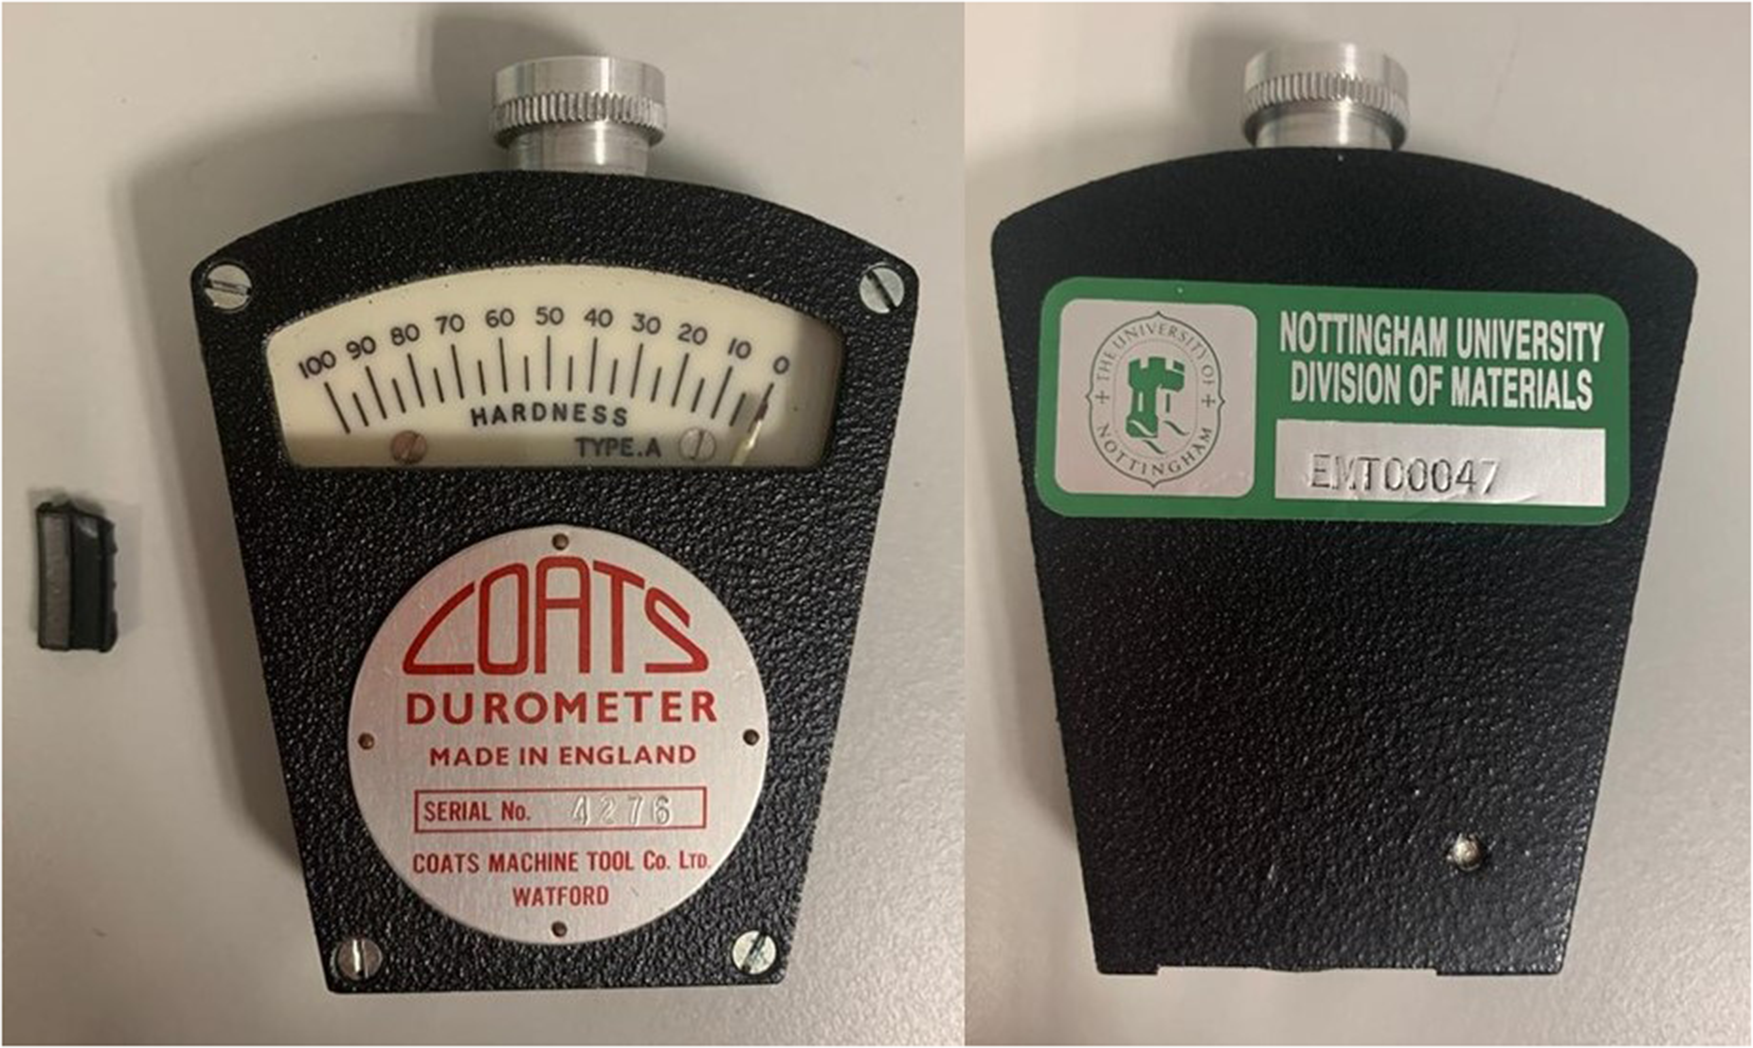
Durometer shore A hardness for evaluating the hardness of the seal.
The inner diameter of the seal is 50 mm and the outer diameter is 72 mm. In Figure 4, two sections of the seal labelled 1 and 2 have been cut out for investigation. Section 1 is 15 mm in length and section 2 is 25 mm in length. Figure 4(b) is a schematic drawing of the radial lip seal. In total, three sections are analysed.
Investigation of the seal shown in Figure 4(a) includes the following:
The grade and composition of the PTFE coating. Liquid nitrogen is used to fracture the cut out sections of the PTFE lip shown in Figure 4. Gaining the composition of the filled PTFE coating requires using ESEM and EDS to investigate the fracture surfaces of the specimen. The advantage of studying a fracture surface is that it may expose some of the filler bits according to how the fracture occurs as opposed to cutting a section with a knife, which will create a neatly sectioned cut to any fillers that we would like to observe. The wear of the lip. Using ESEM to study the wear of the lip through magnification images facilitates measuring/measurements of the width of the contact band and the percentage of material worn away. The surface topography of the seal lip. This requires taking measurements of the new and used seal lip to study the surface characteristics for comparison purposes.
Lubricant
In the case of these dynamic seals, a very thin micron film of fluid separates the seal from the sleeve surface. Leakage will depend on the application, and extent of technical tightness desired for that case (DIN 3761). In some cases, leakage has to be accepted to ensure that the seal does not run dry.
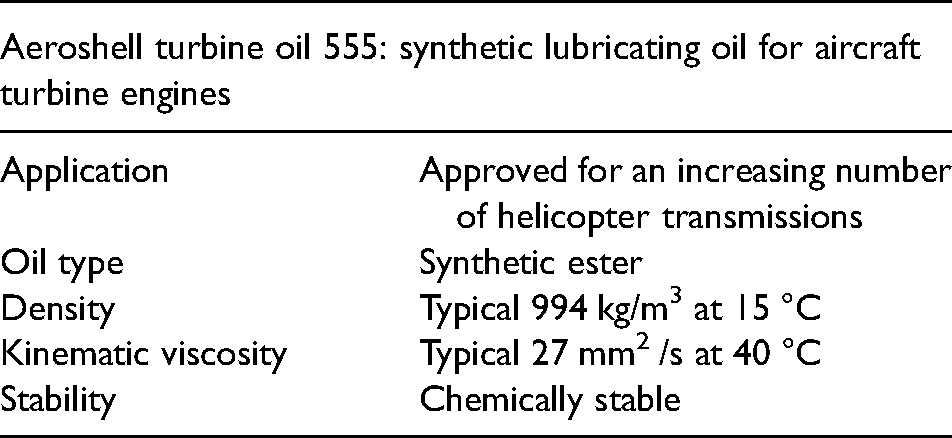
The lubricant used in this work is a conventional turbine engine oil used in helicopter gearboxes, Aeroshell 555. 22 It is a synthetic ester oil and is generally compatible with elastomeric seals. This particular seal is compatible with DOD-PRF-85734 (a US military specification, which covers helicopter transmission oil) according to the seals data sheet and Aeroshell 555 specifications state that it is approved for this standard specified above. Developed with high-temperature and load-carrying performance in mind, their viscosity at 100 °C classifies synthetic gas turbine oils like Aeroshell 555. The grades are 3cs, 4cs, 5cs and 7.5cs. This oil is a 5cs oil, which is the most commonly used in engines for commercial aviation. 5cs oils are limited by a specification to a maximum of 130,000cs at −40 °C and are called ‘type 2’ oils. This is a reference to their viscosity grade.
Figure 6 shows a sample of the lubricant taken from the test rig's chamber. Once the test is complete, the chamber is drained and a sample of this is stored for testing purposes. This is done immediately after the test is complete. It is visually apparent in Figure 6(a) that the lubricant is visually dark and murky due to a powder form of debris suspended throughout the sample. Overtime, much of these debris settle to the bottom of the jar. In Figure 6(b), the debris settled at the bottom of the jar has been marked with an arrow. A brand new sample of lubricant does not have this powdered debris in it. It is important to note that there is a bearing present with the seal in the chamber. The debris sample extracted from the test, once it is completed, may have some wear particles from the bearing as well and this will be accounted for in the conclusions.

(a) Lubricant sample extracted from test and (b) debris present in lubricant sample settled at the bottom marked with black arrows.
Table 2 contains specifications of the lubricant, Aeroshell 555.
Aeroshell 555 specifications (Material Safety Data Sheet #857475E).
Investigation of the lubricant sample taken from the test as shown in Figure 6 includes the following:
Deposits in the lubricant sample. The filtered oil sample is studied through ESEM. The elements present in its debris are studied through EDS.
Methods
The aim of this work is to reproduce the conditions for a seal placed in the gearbox of a helicopter. In such instances, oil seals in the input and output shaft locations of a gearbox prevent loss of oil from the system as shown in Figure 7(a). Figure 7(b) shows the placement of such seals in a gearbox of this kind. These gearboxes employ a splash-lubrication technique and the lubricant is picked up from the base of the gearbox with the gear teeth and is thrown around as they rotate, thus lubricating the internal components. The sliding speeds of the seals vary from 5 to 25 m/s based on their placement within the gearbox.

(a) Schematic representation of intermediate gearbox (IGB) showing input and output housing and (b) schematic representation of IGB showing placement of seals in the input and output housing.
Test methods
A seal test bench, containing a chamber full of lubricant, reproduces similar conditions to the operating conditions of components in service. Fixing a sleeve onto the shaft with a hydraulic coupling causes it to rotate along with the shaft when the motor operates. The seal connects to a stationary housing and mounts on the sleeve surface with an interference fit. The stationary seal slides on the sleeve surface as the shaft rotates. The lubricant is Aeroshell 555, and its specifications are given in ‘Lubricant’ section.
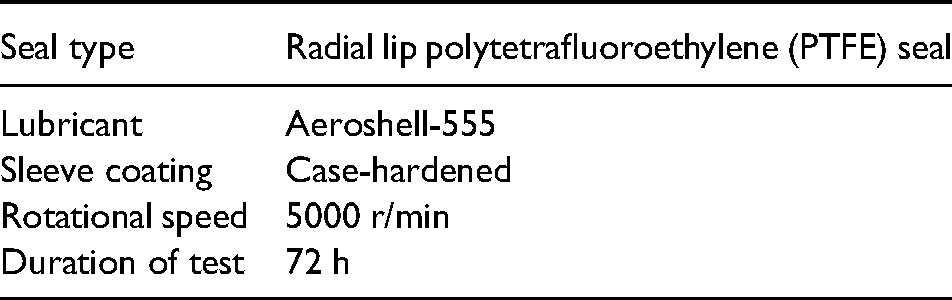
Table 3 outlines the test parameters chosen to reproduce the operating conditions of the seals in service. DIN 3760 outlines the permissible speeds in a pressure-free state, taken into account for this test.
Test parameters.
The test was conducted with an ambient temperature of around 17–18 °C, but external heating was provided to replicate environmental conditions. A thermocouple embedded within the casing of the gearbox is linked to a chart recorder to monitor the temperature of the oil as it churns. The oil temperature is 80–85 °C on average while the test is running.
Figure 8 is a schematic representation of the seal test rig. Figure 8(a) is a sectioned view of the test rig, displaying ‘G’ clearly as the seal installation detail. Figure 8(b) is a magnified schematic representation of this detail ‘G,’ displaying the seal mounted on the sleeve surface.

Schematic representation of seal test rig: (a) sectioned view of test rig with G highlighted as the seal installation part and (b) magnified schematic of detail G marked in (a) with the seal mounted on the sleeve surface.
Measurement methods
Surface topography measurements
A Zygo NexView™ NX2 coherence scanning interferometer (CSI) is used to perform the surface measurements. This technique uses a broadband and spatially extended light source with an interferometric objective to generate low-coherence interference fringes as the instrument scans along the optical axis of the system. The surface topography of a sample is then derived from these interference fringes.23–25 The instrument is located in a metrology laboratory with a controlled temperature of (20 ± 1) °C.
Measurement of the sleeve surface involves using a Michelson interferometric objective (5.5× magnification, numerical aperture: 0.15). The field of view is 1.56 mm × 1.56 mm, the lateral sampling rate is 1.56 µm/pixel and the lateral optical resolution is ∼1.9 µm. A sequence of measurements can be stitched together to cover a large surface area. An area of 1.56 mm × 11 mm on the sleeve is measured using the stitching function. A Mirau interferometric objective (20× magnification, numerical aperture: 0.40) is used to measure the PTFE seal. The measurement area is 0.43 mm × 0.43 mm, the lateral sampling rate is 0.43 µm/pixel and the lateral optical resolution is ∼0.7 µm.
ESEM and EDS measurements
A Quanta650 ESEM is used to perform the SEM measurements of material composition and material transfer. The ESEM has the capability to analyse samples that are non-conductive or outgassing without the need to apply a conductive coating.
Images are acquired in low vacuum operating mode using a combination of backscattered electrons and large-field detector detectors at a gas pressure of 60–70 Pa. We are able to achieve high magnification imaging of conducting samples (sleeve) and non-conducting samples (seal and lubricant). EDS is used to conduct element analysis on all specimens using Aztec software.
Results
Sleeve
Surface topography of sleeve
In Figure 2(b), the wear band of the sleeve is clearly visible, indicating that this was where the seal was mounted. The measured surface topography covers an area of 1.56 mm × 11 mm across the sleeve surface (Figure 9(a)). Figure 9(b) shows the surface topography after removing the best-fit cylindrical form from the original surface topography. An S-filter with a nesting index of 2.5 μm and an L-filter with a nesting index of 800 μm are applied 26 before calculating the surface texture parameters.

(a) Measured surface topography 1.56 mm × 11 mm, (b) filtered surface topography (S-filter with a nesting index of 2.5 μm and an L-filter with a nesting index of 800 μm). The locations of the extracted surface profile and areas are highlighted, (c) optical microscope image in greyscale corresponding to light intensity and (d) extracted surface profile from the line marked in Figure 7(b) and (c).
The corresponding optical microscopic image shown in Figure 9(c) is where the greyscale corresponds to light intensity. A shiny area is visible and it is the wear band that is ‘polished in’ by the seal mounted in place at that exact spot as the shaft rotates. The width of this shiny band is around 1 mm along the axial direction, marked with an arrow in Figure 9(c).
A surface profile is extracted from the filtered areal topographic map. Qualitatively, it can be seen that the region marked with an arrow in Figure 9(b) to (d) from 1.5 to 2.5 mm is less rough than the rest of the sleeve. The asperities of the surface texture have worn away, resulting in a polished and ‘smoother’ surface.
Three randomly selected areas around the circumference of the sleeve are measured. Each of these measured areas are split into five equidistant sections. The mean and standard deviation of the areal surface parameters for these five sections across all three measurement positions are calculated and given in Table 4. Area 1 refers to the wear band (marked with a black arrow in Figure 9(b) to (d)), while areas 2–5 are the regular sleeve surface. The final column shows the mean and standard deviation values for all surface parameters of areas 2–5 to compare it to that of area 1 and note how the parameters vary on the polished surface in wear band.
ISO 25,178 height parameters sleeve (unit: μm).
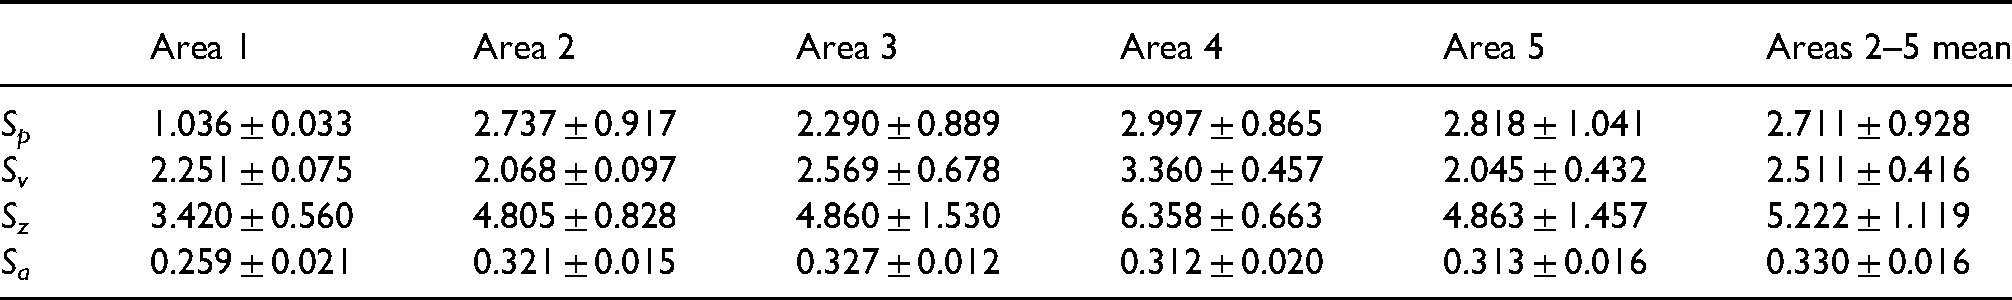
Each of the five regions has an area of 1.56 mm × 0.8 mm and are extracted from positions marked and numbered in Figure 9(b) based on the guidelines from EN ISO 4288. It is quantitatively evident from the mean values that area 1 has lower Sp, Sv, Sz and Sa values than areas 2–5. The Sp value (referring to the largest peak height value within a definition area) of area 1 is ∼40% of the values corresponding to the other areas. This indicates that the texture peaks have been worn away in area 1. Further, the Sa (referring to the mean of the absolute value of the surface texture) and Sz values (referring to the maximum peak to valley height within a definition area) indicate that area 1 is smoother as a result of contact with the seal. The Sv value (referring to the maximum valley height within a definition area) of area 1 is slightly smaller than the mean Sv value of areas 2–5. This indicates that a small amount of material transfer from the seal may result in filling of the valleys of the wear band. Due to a reduction of the asperities in area 1, it is also possible that the ‘zero level’ of this surface area will have decreased, resulting in a lower Sv value.
While sleeve wear is common, any polish on the sleeve surface is not desirable as it changes the desired roughness values. Further, the sleeve is aerospace standard case hardened while the seal is merely elastomeric with a PTFE coating, even if it is a filled polymer matrix. The results indicate that the seal has caused wear to the surface of the sleeve and resulted in a smoother area on the sleeve. This is a ‘polished in’ area on the sleeve surface, a direct result of the seal sliding against the sleeve surface. Investigation of the composition of the filled PTFE material in further sections reveals how it has worn the case hardened sleeve in this manner.
Lead of the sleeve surface
The lead of the sleeve refers to its surface texture on a macroscopic and microscopic level. Also referred to as ‘twist,’ it implies the presence of ‘spiral type’ feed lines on the sleeve surface present due to the angle of the machining marks. As explained previously, the surface of the shaft must not be too rough, nor can it be too smooth. To achieve these desired roughness values, a surface finish process is necessary. The individual manufacturing techniques used to complete this process results in the formation of lead. Lead can be macroscopic and microscopic in nature and can be detrimental to a sealing system. Ideally, lead on the sleeve surface must be zero. 27
Sleeve lead can have a right-hand or left-hand orientation. The specific orientation of the lead, along with the direction of shaft rotation will result in pumping fluid towards the airside, and therefore cause leakage of oil. The opposite cases will result in a reverse pumping effect and if this effect is aggressive in nature, it may starve the sealing interface of lubrication. The seal will run dry and could be subject to premature wear. Neither of these cases are desirable and ISO 6194-1 and DIN 3760 specify zero shaft lead for optimal sealing performance. RMA OS-1-1-rev 4 specifies a tolerance of ± 0.05° (Table 1). It also provides the methodology for the string method and the profiling method to evaluate the shaft lead. The string method is useful for determining the qualitative presence of lead while the profiling-based metrology method helps quantify the lead. Macro-lead on the sleeve surface can result in instant leakage during operation, whereas micro-lead can result in a slow leak over a longer duration. The overall functionality of the sleeve warrants evaluation of both the micro- and macro-lead. In this test case, the string method will qualitatively confirm the presence or absence of lead. The quantification of macro- and micro-lead is determined using the profiling method.
The string method helps identify the presence of any lead. While mounted on the test rig, a string (100% cotton quilting thread) with a weight of ∼30 g attached at the bottom is placed on the sleeve surface, creating a string to shaft arc of 220–240°. At a rotational speed of 60 r/min in the clockwise direction, axial movement of the thread towards the free end (airside) will indicate the presence of right-hand lead. Repeating the test with shaft rotation in the anti-clockwise direction is essential as well, where axial movement towards the fixed end (oil side) will indicate the presence of right-hand lead. This will confirm that axial movement is not due to any other factors such as a slight incline.
This experiment reveals axial movement of the string towards the free end for clockwise shaft direction and axial movement towards the fixed end for anti-clockwise shaft rotation. Thus, this concludes the presence of right-hand lead on the sleeve surface. In this long-term endurance experiment, shaft rotation was in the clockwise direction. This will result in transportation of oil towards the airside, and eventually result in leakage. The profiling method helps quantify and measure the lead angle on the sleeve surface.
In ‘Surface topography of sleeve,’ section three randomly selected points around the circumference of the sleeve are analysed for surface topography information. These data are further analysed for the texture directions present on the surface. The angular power spectral density of the angle of the machining marks on the sleeve surface will reveal the predominant texture directions with isotropy percentages. A low isotropy indicates that there is a predominant texture direction while a higher isotropy indicates that machining marks are in all directions. A CCD camera ensures elimination of any off-axis variations associated with mounting the sleeve. The results display the dominant surface directions on a polar spot. Investigation reveals that the surface has a relatively low isotropy (0.829%), with a predominant texture direction of 93.3° displayed in Figure 10. There is right-hand lead present on this sleeve of 3.3°, which is possibly contributing towards leakage in this test case.
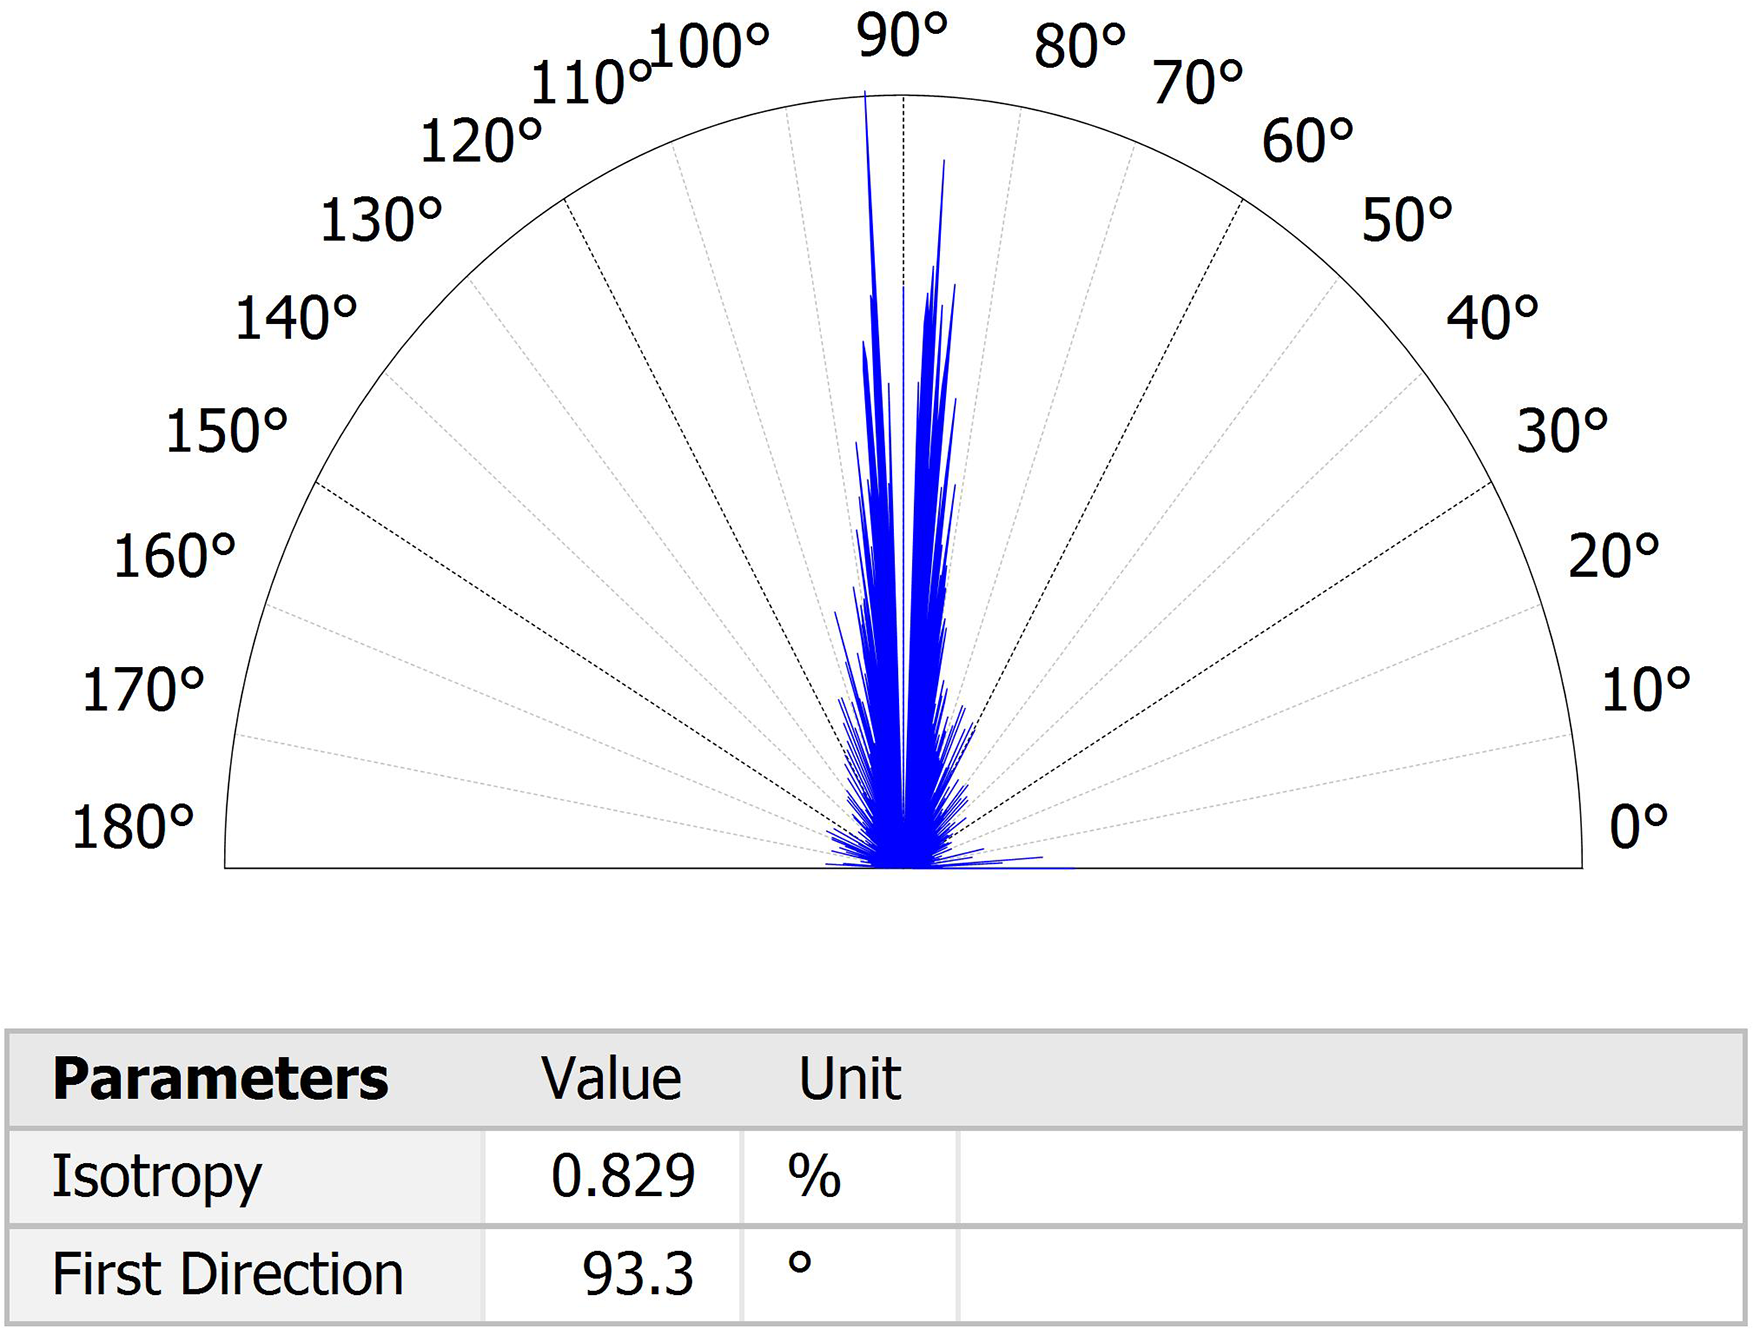
Sleeve texture direction for lead angle.
Hence, the reverse pumping effect, if present at all, might be too little to counterbalance the leakage of oil occurring in this system. Instead, we find right-hand lead present on the sleeve surface. This lead, along with clockwise shaft rotation will result in leakage of the lubricant from the oil side to the airside. It is detrimental to the sealing system and explains the leakage observed in this case over the duration of the test.
Material transfer on sleeve surface
Figure 11 shows the wear track on the sleeve, ∼1 mm across, marked with a red arrow. At this point, it is important to note that the seal lip is 123.3 µm in width at first, but as it wears during the test, the lip width extends to 918.5 µm (for detailed analysis, refer to ‘Wear of the PTFE-lined lip’ section). The worn seal lip of ∼1 mm explains the reason for the wear band on the sleeve being 1 mm in width as well.
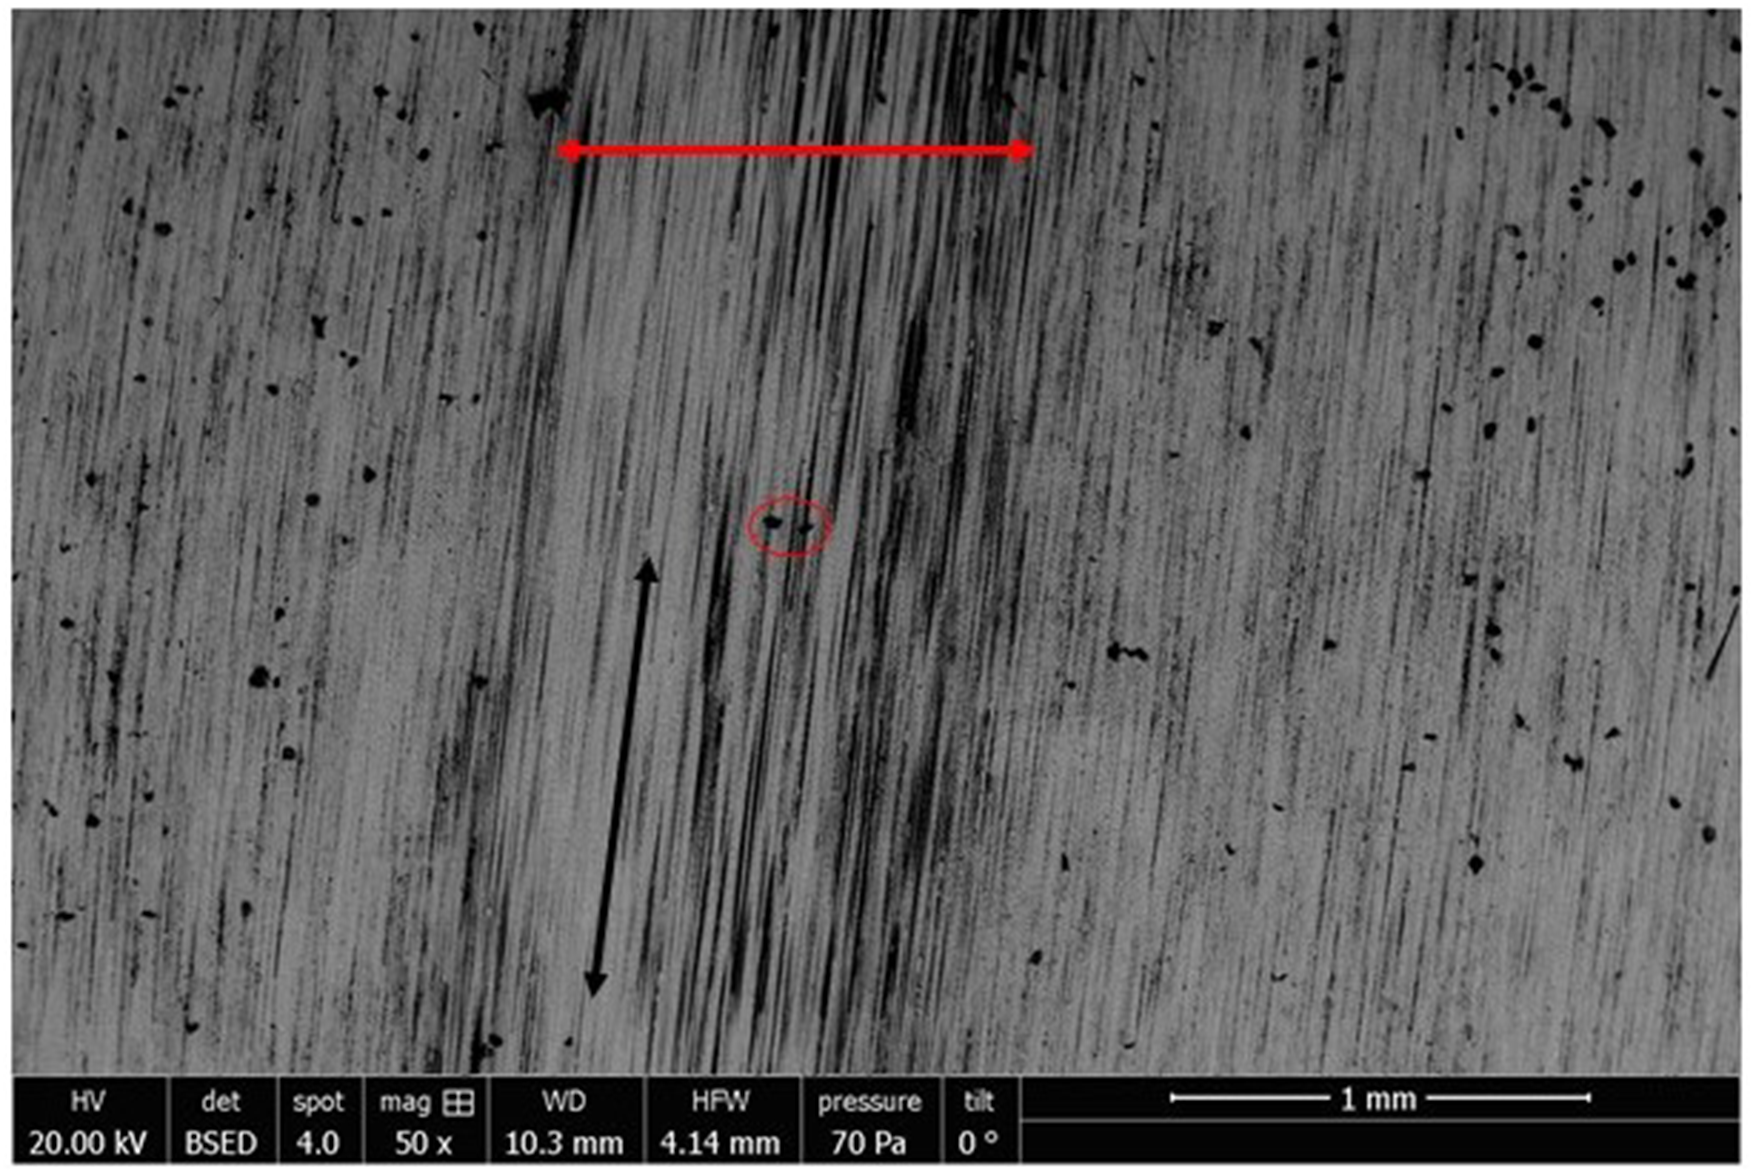
Environmental scanning electron microscopy (ESEM) image of wear track marked with a red arrow horizontally, sliding direction shown with a black arrow and magnification area of Figure 9 marked with a red circle.
Additionally, there are many visible black spots outside the wear band, along with very few remaining within the wear band (e.g. circled in red in Figure 11). However, the image reveals that these spots are located all over the sleeve surface and are primarily missing from the area marked as the wear band. Evidenced by this, the seal sliding on the sleeve at that spot has resulted in their removal. This further enforces the conclusion that the sleeve has experienced polish and wear by the seal lip. EDS analysis facilitates a comparison study of the spots outside the wear band and inside the wear band to confirm that they are the same and that they have been removed from the wear band due to sleeve polish.
Qualitatively, darker lines are also visible on the sleeve surface, within the wear band. These dark lines are directional with the rotation of the shaft and are only visible where the seal is mounted. Investigation of these dark lines will confirm whether they are material transfer of the seal material onto the sleeve surface.
Figure 12(a). shows the magnified appearance of deposits present outside the wear track on the lighter grey substrate and Figure 12(b) shows the magnified appearance of a few of the deposits present within the wear band (this is marked with a red circle in Figure 11). Quantitatively, Figure 12(b) shows the measurement of two such deposits ranging from 40.64 to 40.11 μm across to present an idea of the size of these deposits.

(a) Several deposits on the sleeve surface and (b) measurement of two deposits observed on the sleeve surface.
Figure 13(b) shows the EDS analysis for the deposits selected in Figure 13(a). The deposits show a high count of carbon. Figure 13(c) shows the deposits from Figure 12(b) with four spectra selected for EDS analysis. Figure 13(d) is a comparison plot of spectra 1 and 2 to compare the light grey bulk substrate and the small darker deposits. Spectrum 1 shows a higher count for iron, indicating that it is the bulk sleeve material. Spectrum 2 shows a higher carbon count, indicating areas of deposits. A comparison between Figure 13(b) and (d) of spectra 2 and 7 shows that the deposits are identical in composition, confirming that they are the same deposits that have been removed on the wear band due to the seal sliding in place and polishing in the sleeve.

(a) Spectrum 7 selected for energy dispersive spectroscopy (EDS) analysis on sleeve surface deposits outside wear band, (b) plot of EDS analysis showing spectrum 7 with a higher carbon count, similar to deposits in spectrum 2, (c) spectra 1, 2, 3 and 4 identified for EDS analysis of visible black spots on sleeve surface within wear band and (d) comparison plot of EDS analysis showing spectrum 1 (light grey substrate) with higher iron count as the sleeve surface and spectrum 2 (darker deposits) with a higher carbon count.
EDS analysis is carried out on several areas of the deposited material to investigate whether there is any material transfer of the PTFE coating onto the sleeve surface by the identification of fluorine. Qualitatively, there appear to be dark black lines directional with the rotation of the shaft, marked by a black arrow in Figure 11, which may be PTFE deposits. However, this proved to be difficult due to the very strong peak overlaps of fluorine with the iron line, and the fact that the deposits are much thinner compared to the bulk material.
However, as PTFE is primarily a carbon–fluorine bond, there is a possibility that these darker lined deposits are PTFE, as they differ in composition from the circular shaped deposits from Figure 13. Figure 14 displays the composition of spectrum 4, marked in Figure 13(c) as the darker lines. The composition of spectrum 4 differs from the composition of spectra 1, 2 and 7. They are higher in carbon content than spectrum 1, indicating that they are not the same material as the light grey substrate in spectrum 1. They are lower in carbon content than spectra 2 and 7, indicating that they are not the same as the dark circular deposits. Therefore, while it is possible that these darker lines are material transfer from the seal onto the sleeve surface, it can also be anything else. This is one possibility.
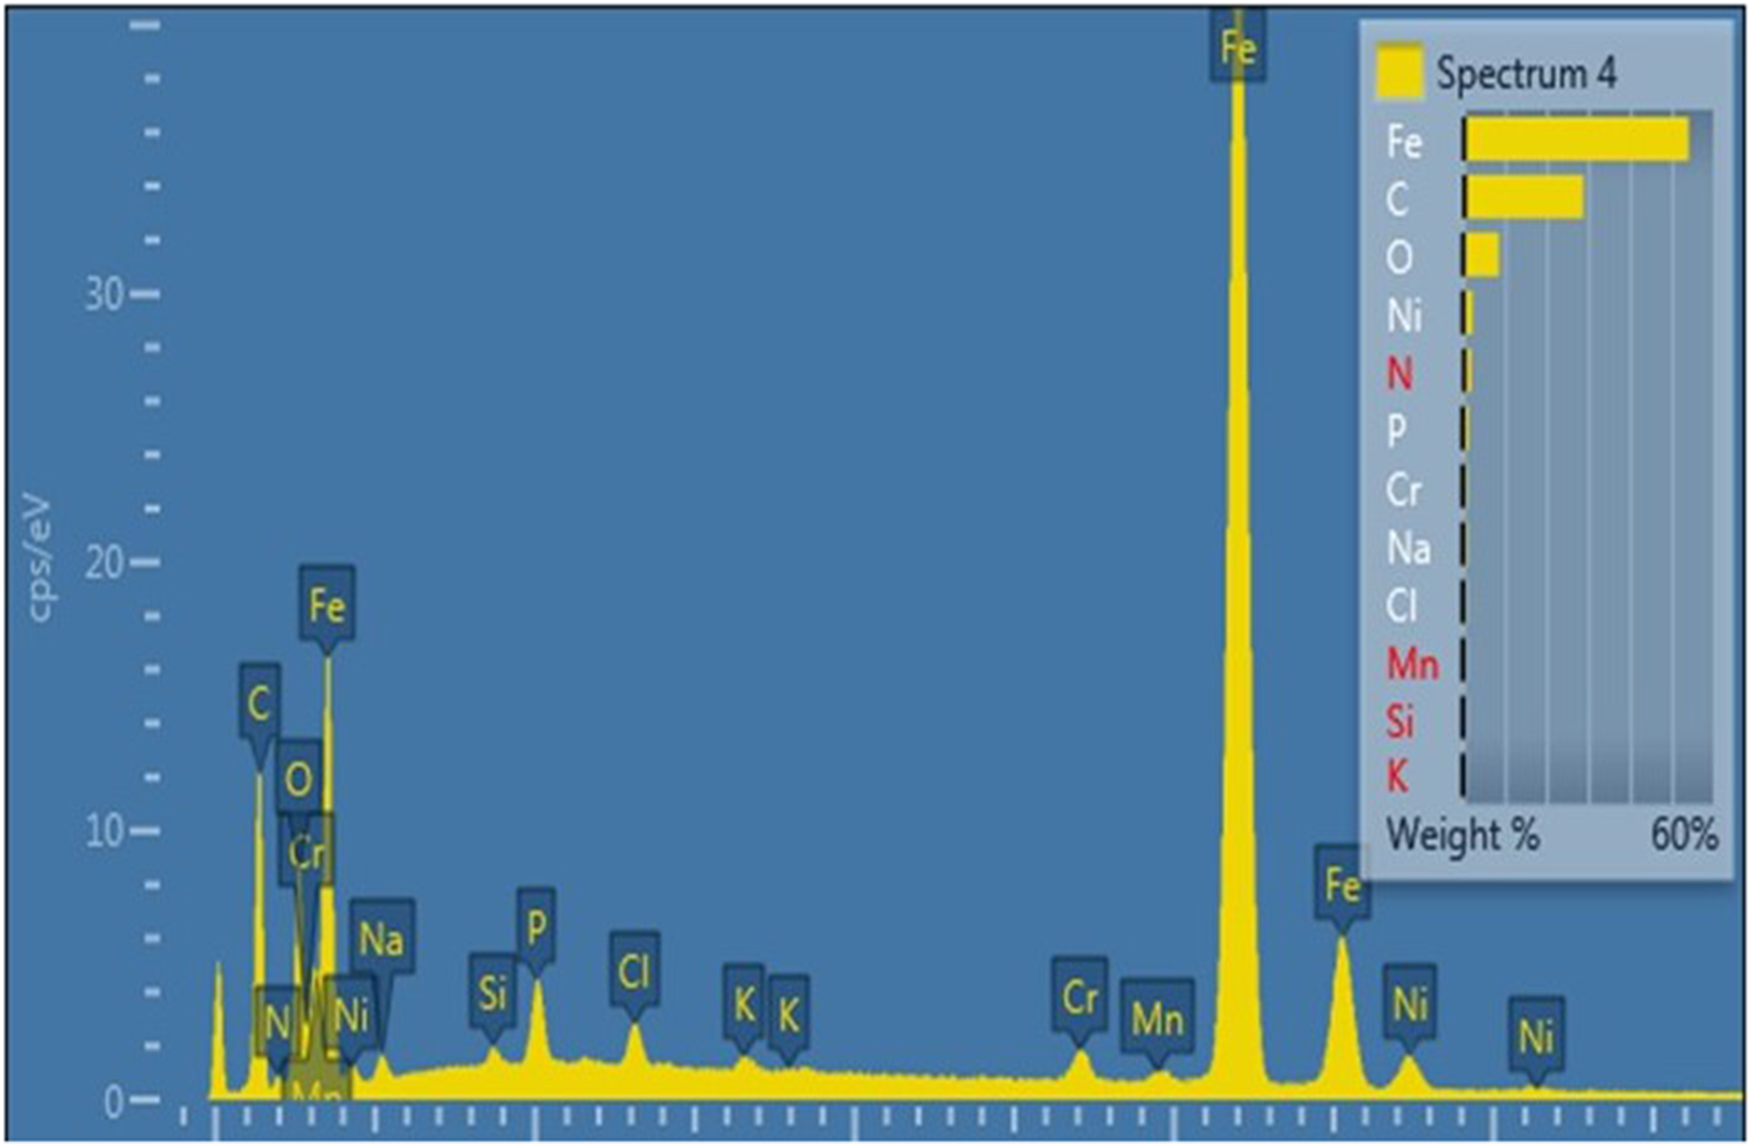
Energy dispersive spectroscopy (EDS) analysis for spectrum 4 displaying one of the darker lines on the wear band, with a composition different from spectrum 1, which is the bulk iron substrate. It is also different from spectra 2 and 7, which are the circular deposits seen across the sleeve sample, apart from where they have been removed on the wear band.
In ‘Wear of the PTFE-lined lip’ section, the wear of the seal lip indicates that it has flattened out after sliding on the sleeve and resulted in a lip contact width of 918.5 from 123.3 µm. As the seal lip wears and widens, it is possible that the flattened sides make contact with the sleeve as the lip wears over time, resulting in some material transfer to the sleeve surface. As noted in the beginning of this section, the wear band is ∼1 mm, similar in width to the worn seal lip. A careful look at Figure 11 reveals that the most ‘polished’ region is seen in a small width of the wear band as a lighter grey substrate where almost no deposits are seen, and the dark directional lines are seen to the right and left of that region, still within the remaining 1 mm wear band. The garter spring continues to press down on the original lip area, even as the lip contact region widens with wear. This could result in the remaining worn lip area sliding on the sleeve, but with a lower radial force than the original lip and thus, result in the dark directional lines (possibly thin deposits of the worn lip material) on either side of the most ‘polished’ region. There is no concrete data to confirm this finding, but it would explain the visual observations made in Figure 11 and fit with the evidence revealed by analysis of spectrum 4, indicating a clear disparity in composition with spectra 1, 2 and 7. Spectra 1 and 4 both have a high iron count, but in contrast to spectrum 1, carbon peaks show up in spectrum 4 too. On the other hand, while carbon peaks are present in spectrum 2, carbon is the main element detected and the iron peaks are weaker. This is the exact opposite to spectrum 4, where iron is the main element detected, with lower carbon peaks also present. Spectra 2 and 7 are identical in composition (explained above to demonstrate the black spots being homogenous across the sleeve surface). Thus, it is concluded that spectrum 4 is qualitatively dissimilar in composition to spectra 1, 2 and 7.
Seal
Composition of filler content in PTFE coating
This analysis reveals two prominent findings, described below.
The first finding is regarding EDS analysis carried out on several areas of the seal specimen to confirm the fillers present in the PTFE coating polymer matrix. The presence of carbon and graphite fillers, glass fibres and calcium carbonate fillers in the matrix is confirmed. It is rare to find pure PTFE used in such applications for several reasons. Not only does PTFE have poor mechanical properties such as wear and creep, but also it is too costly. Fillers lower the cost while improving mechanical and tribological properties. 28
Figure 15(b) shows high carbon content present in the darker areas in the ESEM image of the seal specimen (spectrum 21).

Seal top surface: (a) energy dispersive spectroscopy (EDS) image identifying spectra 21 (dark substrate), 22 (brighter particles) and 23 (bright particles) and (b) comparison plot between spectra 21 and 22 showing calcium present in spectrum 22.
Carbon is a common PTFE filler, usually added in a percentage of anything between 10% and 35% with respect to weight. 29 A small percentage of graphite is usually also included with the use of carbon fillers. Carbon has the advantage of improving the wear properties and deformation strength, without altering the chemical properties of the specimen. Further, adding carbon fillers lowers the tool wear during machining and manufacturing, allowing for closer tolerances necessary for seals. 30 Graphite has a ‘flaky structure’ with layers that slide over each other, proving to be beneficial for lubrication and decreased wear. 31
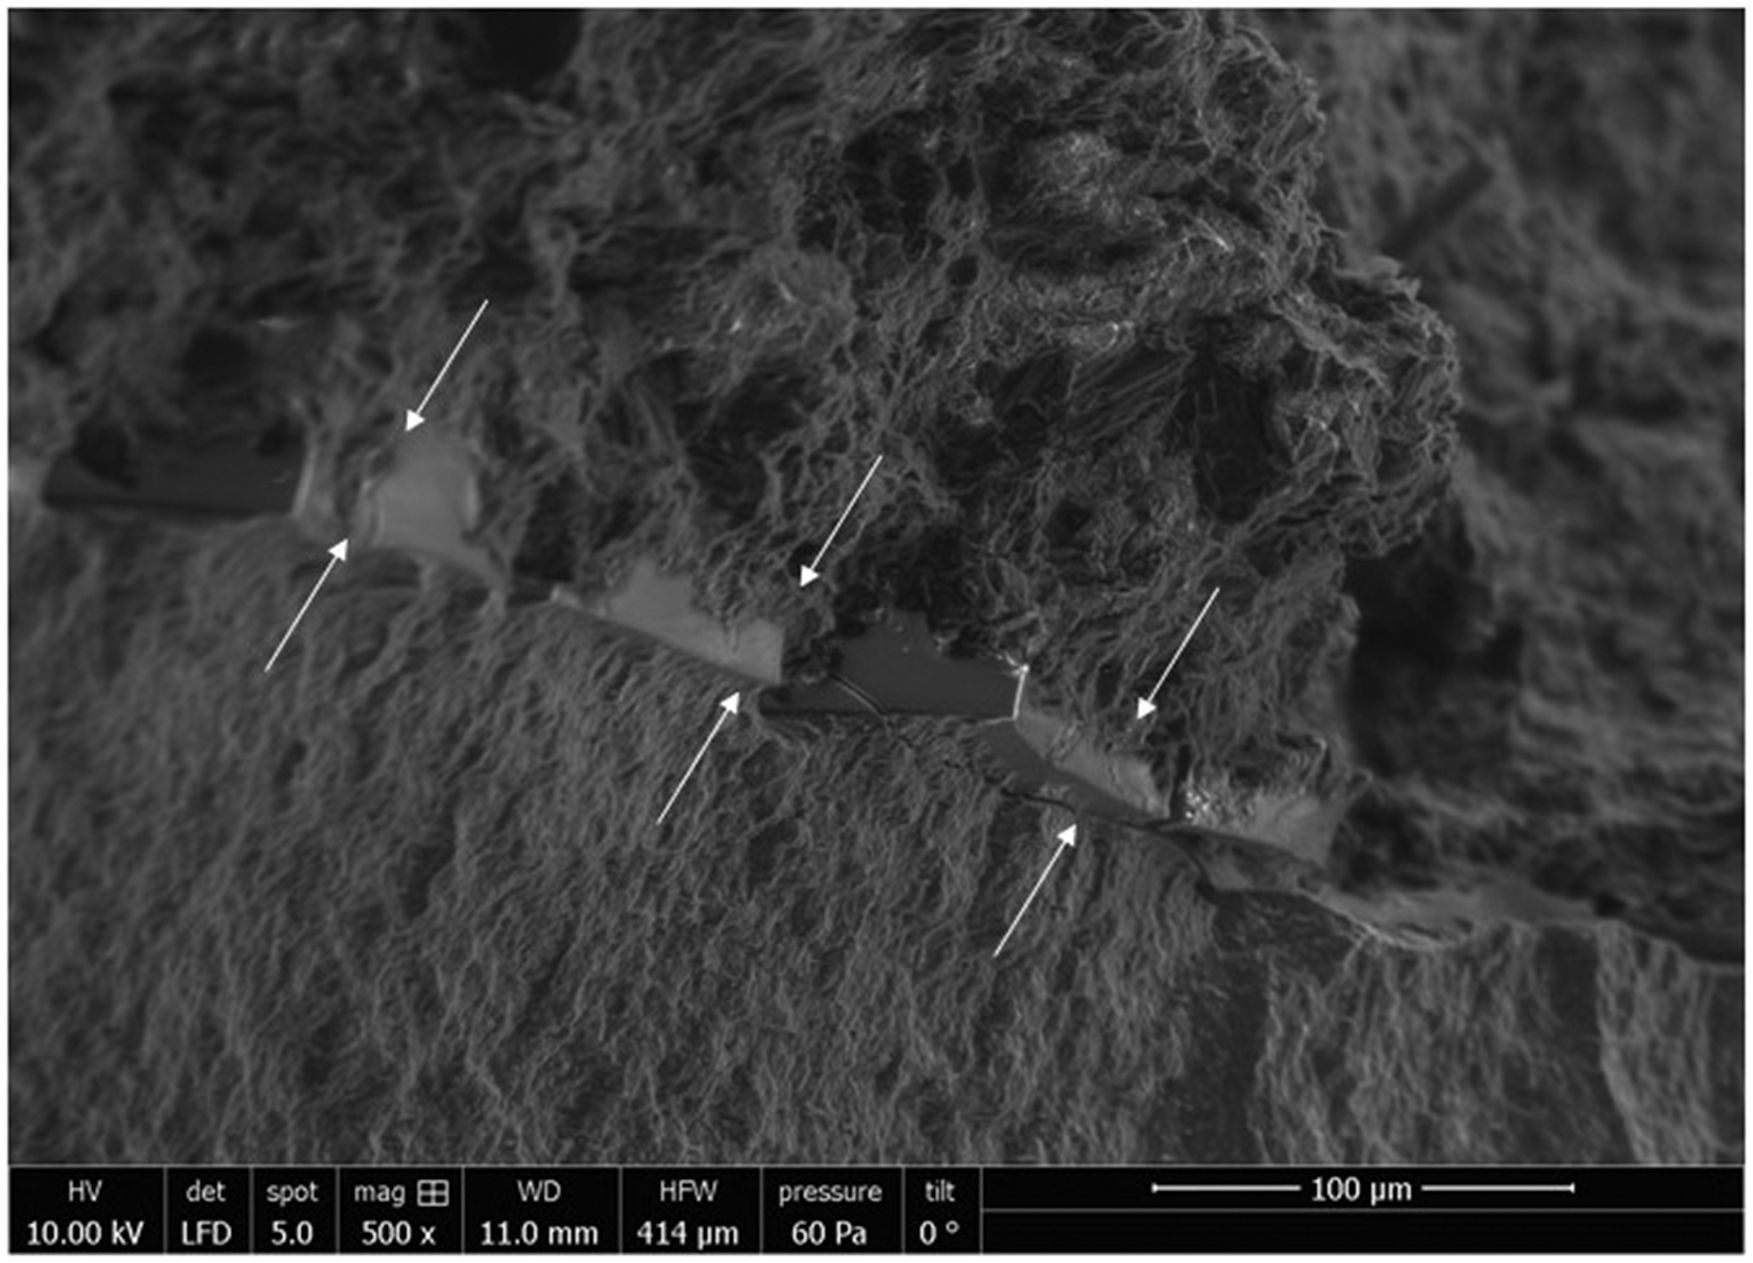
Figure 16(a) displays an image of the particles believed to be the glass fibre fillers identified in the polymer matrix. They are similar in appearance to glass fibres identified in other recent research. 32 Quantitatively, Figure 16(b) displays a glass fibre particle, 132 µm in length. Figure 16(b) shows spectra 14, 15 and 16 selected for EDS analysis and the comparison plots in Figure 16(c) show that spectrum 14 has a higher fluorine count while spectrum 16 has a higher silica and oxygen count. Traces of aluminium and magnesium are also found here, and according to Chawla 33 in encyclopaedia of materials, the most common chemical composition of glass fibres are SiO2, Al2O3, CaO and MgO. Therefore, we can assume with some certainty that these particles are some form of glass fibre fillers in the polymer. If they are not glass fibres, they are still some filler content with these chemical compounds.

Seal top surface: (a) ESEM image of glass fibres in filled PTFE, (b) spectrum 14 (light grey bulk substrate), 15 (darker carbon patch) and 16 (glass fibre) selected for analysis and (c) comparison plot of spectra 14 and 16 showing Silica in spectrum 16 and higher Fluorine and Oxygen count in spectrum 14.
Further, while calcium is found in other fillers (Figure 15, spectrum 22), it is important to note that there is a distinct visual disparity between the particles identified in Figure 16(a) and (b) as glass fibres and the particles appearing as lighter grey patches in Figure 15(a) which will be later identified as calcium carbonate fillers. Although they both have the presence of calcium, they are found to be a different filler with differing chemical compositions as seen by comparing Figures 15(c) and 16(b) (spectra 16 and 22).
PTFE is commonly reinforced with glass fibres, SiO2, in a percentage by weight ranging from 5% to 40%.29,31 They improve wear properties by enhancing thermal stability and mechanical properties. While they have excellent performance and high tensile strength, they increase the COF and hence, graphite along with it is required to compensate this effect. 29 Further, they exhibit low surface adhesion and distribution within the polymer matrix, which can cause problems in seals. They are commonly known to cause wear to mating surfaces, especially in rotary applications. 31
Figure 15(a) shows the presence of particles that are believed to be calcium carbonate fillers in the polymer matrix. Figure 15(b) is a comparison plot between spectrum 21 (darker bulk material) and spectrum 22 (small brighter particles). Spectrum 21 shows a higher carbon content, whereas spectrum 22 shows calcium present. These ESEM images are similar to calcium carbonate fillers seen in other research 32 and they differ in appearance to the previous particles we assume are glass fibres. Visually, these appear as lighter patches in the darker bulk material. The disparity from the previously identified fibres along with the chemical composition indicates that these particles are likely to be calcium carbonate fillers, spread out in the polymer matrix. A principle filler in polymer matrix is calcium carbonate, CaCO3. 32 They are low cost, non-toxic, stable fillers. They improve thermal stability and control viscosity but are primarily to lower the cost due to their non-toxic and neutral nature. However, a major issue with such fillers is due to the difference in surface energy and polarity between them and PTFE, there is low adhesion between the two. This will eventually cause the overall mechanical properties of the composite to deteriorate.
The second finding is the presence of a distinct 300 µm coating and 10 µm adhesive layer present on the lip surface and the remaining filled PTFE of another homogenous material composition. Results are consistent in both, a new and tested seal sample.
Figure 17 shows the tested seal lip, qualitatively displaying a clear line between the two textures. Figure 18 illustrates the same disparity in the new lip seal. There are two distinct layers of material present, separating the lip region from the rest of the seal. The layer on the lip is 300 µm in thickness (Figures 17(b) and 18(b)). Since the layers on the new and tested seal are identical in thickness and material, it is evident that the layer is a pre-existing surface coating of PTFE.

Tested seal fracture surface: (a) ESEM image of fracture surface of the seal cross-section showing a distinct PTFE layer on the seal lip and (b) close up of the same distinct layer measuring 300 µm thickness.

New seal fracture surface: (a) environmental scanning electron microscopy (ESEM) image of fracture surface of the seal cross-section showing a distinct layer of material coating on the seal lip and (b) magnified image of the same distinct layer measuring ∼300 µm.
Further, there is a thin layer of material observed in between these two material compositions (Figure 19). Quantitatively, this layer is 10 µm thick.
New seal fracture surface with thin layer separating lip coating from remaining seal material.
A dot map analysis presented in Figure 20 reveals that the elements identified are carbon (Figure 20(a)), oxygen (Figure 20(b)), fluorine (Figure 20(c)) and silica (Figure 20(d)).

New seal fracture surface energy dispersive spectroscopy (EDS) dot map analysis: (a) carbon, (b) oxygen, (c) fluorine and (d) silica.
Qualitatively, it is evident that the oxygen-rich region in Figure 20(b) corresponds to the fluorine poor region in Figure 20(c), indicating that this layer is not PTFE. This particular region does not correspond to any prominent silica-rich region, ruling out glass fibres too. This concludes that it is likely an adhesive layer applied to bind the 300 µm PTFE surface coating to the elastomer.
Further, it is visible from Figure 20(a) that the top part representing the 300 µm later has a large carbon content as well. However, it is in concentrated patches. This corresponds to the darker patches evident from Figure 19 as well. This indicates that this area is rich with graphite layers rather than carbon fillers and may contribute to the wear on the sleeve surface.
Wear of the PTFE-lined lip
The tested seal is compared to a new seal below, with measurements taken to evaluate the wear that the seal lip has endured during the test.
Figure 21 shows the cross-section of the new and used seal lip. While comparing the new seal (Figure 21(a)) to the used seal (Figure 21(b)), it is quantitatively evident that the used seal has experienced a considerable amount of wear, as the width of the lip has reduced from 377.8 to 178.1 µm by a factor of 2. Approximately 50% of the PTFE lip material at the tip has worn away. Qualitatively, this wear is also clear from a comparison between lower magnitude images of the new seal (Figure 21(c)) and the used seal (Figure 21(d)).

Cross-section of new and used seal surface with varying magnifications: (a) new seal lip mag. 200×. Measurements from left to right (µm): 379.1, 376.6 and 377.8, (b) used seal lip mag. 200×. Measurements from left to right (µm): 390.0, 330.5, 253.6 and 178.1, (c) new seal lip mag. 50×. Lip contact band 123.3 µm and (d) used seal lip mag. 50×. Lip contact band 918.5 µm.
Additionally, the contact band has increased from 123.3 (Figure 21(c)) to 918.5 µm (Figure 21(d)) due to wear of the lip.
Since material transfer present on the sleeve surface is little, wear from the seal is hypothesised to be present in the lubricant, which is studied next.
Surface topography of the seal lip
The lip region of the tested seal and a new seal is studied using the CSI. Figure 22 shows the surface topography of the used seal, measured by stitching multiple measurements across the lip area. Figure 22(a) displays a three-dimensional view of the seal lip, marked with a line to indicate the extraction of the surface profile shown in Figure 22(b). Qualitatively, Figure 22(b) reveals that the lip region has been flattened out after running on the sleeve from approximately x = 0.4 mm to x = 0.85 mm.

Lip region: (a) a real view and (b) surface profile.
A study of the lip region reveals the surface topography of the seal lip after sliding on the sleeve. Measurements of three randomly selected areas around the circumference of the seal facilitate calculating the mean and standard deviation values of the surface parameters. An identical analysis of a new seal helps draw a comparison between the surface topography parameters of a new and used seal.
For the peak lip region in the used seal (area marked in Figure 22(b)), an area of 433 μm × 433 μm is extracted from the surface topography for measurements. For the new seal, an area of 120 μm × 433 μm is extracted. As seen in Figure 21(c), the lip of a new seal is 123 μm, explaining the reason for a reduced area taken for measurements compared to the used seal. An S-filter with a nesting index of 2.5 μm and an L-filter with a nesting index of 250 μm are applied. 34 Figure 23 displays a comparison of the new and used seal lip and Table 5 presents the calculated surface parameters.

Surface topography of the lip region of the new and used seal. They are levelled and have an S-filter with a nesting index of 2.5 μm and an L-filter with a nesting index of 250 μm: (a) new seal lip and (b) used seal lip extracted from the position marked in Figure 22b.
ISO 25,178 height parameters seal (unit: μm).
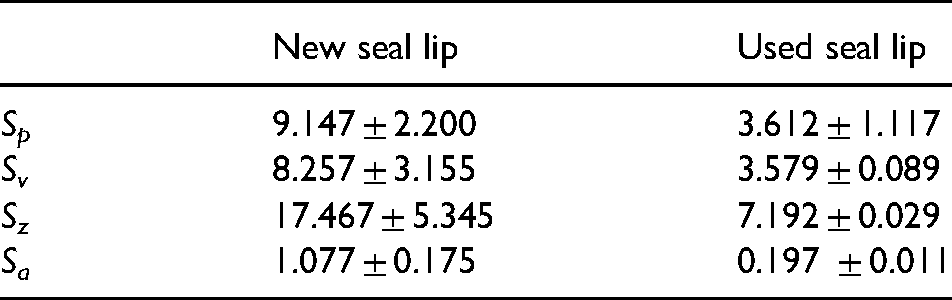
As apparent from Table 5, the Sa values for the used seal lip are lower than the new seal lip. The peaks have also reduced in the used seal, noted from the Sp values. The seal is ‘smoother’ and less rough after sliding on the sleeve surface than a brand new seal. It is quantitatively evident that the seal lip has acquired similar Sa values as the wear band on the sleeve surface, where it was sliding. A comparison of the Sa values of the wear band in Table 2 to the used seal lip in Table 5 reveals this.
According to literature, surface texture on the sleeve surface is desirable and necessary for the seal to operate successfully.35,36 This is so that it can wear in the seal by rubbing on the lip during operation. Known as preferential wear, this phenomenon is required for the seal to perform effectively. 37 However, we see here that the seal lip acquires a ‘smoother’ surface roughness, similar to that of the polished sleeve surface due to sliding on it. The seal experiences a ‘bedding in’ process before which a little leakage is common. After this process, the seal will ideally not leak anymore. In this test case, the seal may not have bedded in properly because the PTFE coating seems to be unable to form the microstructures the same way an elastomeric lip would. Bonding the PTFE liner to the lip may help with better lubrication at the interface, but a disadvantage of this coating is that bedding in of the seal lip has not occurred appropriately due to the material formulation. Additionally, we find that the PTFE liner has demonstrated poor bonding and has worn away during the duration of the test. Microstructures usually form on the seal lip overtime. However, if the PTFE liner starts to wear away easily, it will be unable to form these desired microstructures.
Lubricant
Filter paper separates majority of the oil from its debris, leaving a powdered debris on the filter paper. Investigating a sample of the filter paper for control measures reveals that it has a high carbon and oxygen count, shown in Figure 24.

Filter paper analysis: (a) ESEM image and (b) EDS analysis showing elements carbon and oxygen present.
Deposits in lubricant sample
Figure 25 is an image of the filter paper with the lubricant sample. Qualitatively, the deposits are visible on Figure 25(a) when compared to Figure 24(a), which is the plain filter paper. Figure 25(b) shows that there are traces of iron present in the spectra selected for analysis compared to Figure 24(b), where only carbon and oxygen are present.

Filter paper with lubricant analysis: (a) ESEM image and (b) EDS analysis showing iron present in addition to carbon and oxygen present.
Figure 26(a) is an ESEM image of the debris analysed. Figure 26(b) is a spectral analysis data map of the image, identifying regions that are rich in a certain element. Qualitatively, the bright deposit is rich in iron, indicating that it is wear debris from the sleeve. Several images across the debris specimen are taken and results are consistent as a number of bright deposits similar to Figure 26 seen are iron heavy.

(a) ESEM image of iron deposits in the lubricant sample. (b) EDS dot map analysis of image.
Figure 27 shows another type of debris particle identified in the lubricant sample. Spectral analysis in Figure 27(b) shows that it is rich in silica and oxygen. This is in line with elements identified as glass fibres in the PTFE coating's EDS analysis in ‘Composition of filler content in PTFE coating’ section and hence, these particles are also identified as traces of glass fibres.

(a) ESEM image of glass fibres in the lubricant sample and (b) EDS analysis of spectrum 73 showing deposit to be silica rich.
Many of these deposits are present in the lubricant sample, indicating that several glass fibre particles have separated from the PTFE coating into the lubricant in the bearing chamber. Previous research shows that a disadvantage of adding glass fibres as fillers in PTFE is that it demonstrates low surface adhesion with the polymer matrix (refer to ‘Composition of filler content in PTFE coating’ section). This is clear from the findings of this work as well.
Conclusion
This paper investigates the tribological behaviour of a sleeve, seal and lubricant sample from a high-speed rotating test rig. It analyses the wear mechanisms, components undergoing wear and the composition of the filled PTFE coating and draws various measurements of the specimens to inform its analyses and conclusions.
The sleeve has a ‘polished in’ smoother region where the seal was mounted. This region is less rough than the rest of the sleeve, due its smoother surface texture and reduced peaks. This indicates that the case hardened sleeve surface experiences some amount of polish from its interaction with the seal. This is additionally confirmed by SEM analysis of the sleeve surface, demonstrating that the black deposits seen across the sleeve surface have been removed from the 1 mm wear band from the seal sliding on the surface in that region. This finding prompts a further investigation of the filled PTFE coating (seal). The seal contains the following fillers: carbon and graphite fillers, likely glass fibres and calcium carbonate fillers. These fillers are unknown prior to the study.
Investigating the lead of the sleeve reveals that there is right-hand lead on the sleeve surface. The requirement for rotary shaft lip seals is zero lead angle (ISO 6194-1 and DIN 3760), but we find a lead angle of 3.3° present on the sleeve surface. This right-hand lead, coupled with a clockwise direction of shaft rotation will result in leakage of oil towards the airside. This is a significant reason of excess leakage for this test case and explains a large reason for failure of this sealing system. Any reverse pumping effect, if present at all, is too little to counterbalance the effect of leakage out of the system and the sealing interface is not starved of lubrication. Instead, lubricant is being pumped outwards, an undesirable characteristic for an effective sealing system.
A PTFE-lined radial lip seal is used in this analysis, but the thickness, fillers and specifications of the seal are unknown prior to the study. The fracture surface of the tested seal shows a 300 µm thick coating layer on the seal lip, evidently distinct from the bulk elastomer material. Further, a very thin 10 µm layer of material separates the PTFE coating from the bulk elastomer. This strip of material is oxygen rich and fluorine poor, ruling out PTFE present in it at all. It is not particularly rich in silica or carbon either, and is concluded to be an adhesive layer applied to bond the elastomer material to the 300 µm filled PTFE coating.
Studying the new seal for comparison purposes prompts the observation of an identical layer on its fracture surface. This confirms that this is the PTFE coating on the seal lip. While the entire seal has high level of carbon, the darker patches specifically present in this layer on the seal lip represent higher carbon content, indicating that they can be graphite layers. These graphite layers can be abrasive and, along with the glass fibres, are responsible for the polishing in effect. Additionally, these fillers are likely to be the reason for the significant wear of the seal lip, explained below.
Apparent from the comparative analyses of the new and used lip seals, the lip seal also experiences a high degree of wear. The contact band of the lip, after sliding on the sleeve surface has increased from 123.3 to 918.5 µm, and 50% of the material has worn away. This wear is undesirable and contributes to the excessive leakage noted in this test. The reason for this damage cannot be attributed to the seal running dry, as there is excessive leakage in the test. It is possible that some of the abrasive filler material of the PTFE coating has come loose in the polymer matrix and results in three-body wear to the seal at the interface. We find some of the fillers present in the lubricant sample and so, it is a safe to assume that these fillers could have contributed to wear the interface before entering the lubricant sample.
The surface topography analysis of the used seal reveals that the seal surface is smoother than a new seal, and has not acquired the desired surface roughness from the shaft. The bedding in process for the seal–shaft combination to work is critical, and a likely reason further contributing to leakage is that two relatively ‘smoother’ and ‘polished in’ surfaces interacting will result in leakage. It seems that for this seal, the bedding in of the seal has not occurred appropriately. This is likely because the PTFE liner is unable to acquire the microstructures overtime the same way a regular elastomer would. Sealing data sheets 10 specify an optimum Ra of 0.3 µm from laboratory tests, even though there is a range provided by all standards. The results from the seal and sleeve analysis suggest that some amount of wear debris will be present in the lubricant present in the gearbox. A sample of the lubricant is collected from the gearbox to inspect.
Debris analysis from the lubricant sample supports the conclusion that certain wear particles from the seal lip and the sleeve surface are dispersed in the gearbox with the lubricant. Traces of glass fibres (or fillers with the exact same chemical composition as those found in seal) in the oil confirm the presence of the PTFE coating from the seal material and traces of iron confirm the presence of the sleeve wear debris in the sample. Any wear from the bearing will also be present in the lubricant deposits as it is also inside the chamber; however, it is difficult to separate the two. It is evident from surface topography analysis of the sleeve that it has experienced a degree of polish and some of those particles must be in the lubricant sample. However, not all the iron debris in the lubricant are from the sleeve alone and is concluded to include some wear from the bearing too. It is clear though, that a considerable amount of wear debris from both the seal and the sleeve is present in the lubricant in the bearing chamber.
We can also confirm compatibility of the lubricant with the seal material and rule out any possibility of the lubricant being detrimental for the sealing system. As mentioned previously, the lubricant is approved to DOD PRF-85734 and the seal data sheet specifies lubricant compatibility to that standard.
From this analysis, we learn some of the tribological interactions that occur between this particular type of seal and sleeve in service and explain the reason behind the excessive leakage that resulted during the final 15 h of the test. The lead present on the sleeve surface is a significant factor for leakage and failure in this particular test case. Regular polishing in of the sleeve surface because of the seal sliding on its surface is normal, resulting in a reduction of the roughness peaks. The resulting smoother, ‘polished in’ surface of the sleeve is not ideal. While it may not be very detrimental at this stage as polishing in is expected and normal, it may eventually result in wear as the test goes on. Additionally and more importantly, the wear of the seal lip is quite significant. The excessive wear of the lip is apparent from the SEM analysis and points towards a critical reason for leakage. This seal lip wear, coupled with the right-hand lead present on the sleeve surface combined result in the leakage observed in this test case. The findings cannot confirm why the seal lip experienced this degree of wear, but it can have something to do with the filler content in the lip coming loose due to poor binding with the PTFE coating. Therefore, on the alternative side, experiments can include the use of a different filled polymer matrix coating for the seal that would exhibit better sealing performance and not result in extreme wear of the lip.
Note that large amounts of debris rotating with the lubricant in the chamber can also further reduce the life of components and is undesirable. The material and coating selection for both of these components play a critical role in enhanced and prolonged seal performance. Other possibilities of failure include shaft misalignment and possible system vibration. While these factors were not included within the scope of this particular analysis, they warrant future investigation in studies of this nature. This is a single case study of a seal, shaft and lubricant sample, making it low powered due to the small number of samples. This manuscript includes analysis of one set of seal, sleeve and lubricant due to the detailed nature of the investigation but future work would benefit from testing of additional specimens to increase the statistical power of the study.
Footnotes
Acknowledgements
The authors thank Leonardo MW Ltd for supporting this work through a joint collaboration with the University of Nottingham.
Declaration of Conflicting Interests
The authors declared no potential conflicts of interest with respect to the research, authorship and/or publication of this article.
Funding
The authors disclosed receipt of the following financial support for the research, authorship and/or publication of this article: This work was supported by the Engineering and Physical Sciences Research Council (EPSRC) (grant numbers: EP/L022494/1 and EP/M008983/1); the INNOVATIVE doctoral programme (project number: 665468). The INNOVATIVE programme is partially funded by the Marie Curie Initial Training Networks (ITN) action and partially by the Institute for Aerospace Technology (IAT) at the University of Nottingham.