
Abstract
The interfacial contact conditions between a railway vehicle wheel and the rail are paramount to the lifespan, safety and smooth operation of any rail network. The wheel–rail interface contact pressure and area conditions have been estimated, calculated and simulated by industry and academia for many years, but a method of accurately measuring dynamic contact conditions has yet to be realised. Methods using pressure-sensitive films and controlled air flow have been employed, but both are limited. Ultrasonic reflectometry is the term given to active ultrasonics in which an ultrasonic transducer is mounted on the outer surface of a component and a sound wave is generated. This ultrasonic wave packet propagates through the host medium and reflects off the contacting interface of interest. The reflected waveform is then detected and contact area and interfacial stiffness information can be extracted from the signal using the quasi-static spring model. Stiffness can be related to contact pressure by performing a simple calibration procedure. Previous contact pressure measurement work has relied on using a focusing transducer and a two-dimensional scanning arrangement which results in a high-resolution image of the wheel–rail contact, but is limited to static loading of a specimen cut from a wheel and rail. The work described in this paper has assessed the feasibility of measuring a dynamic wheel–rail contact patch using an array of 64 ultrasonic elements mounted in the rail. Each element is individually pulsed in sequence to build up a linear cross-sectional pressure profile measurement of the interface. These cross-sectional, line measurements are then processed and collated resulting in a two-dimensional contact pressure profile. Measurements have been taken at different speeds and loads.
Introduction
The wheel–rail contact
The rail vehicle wheel and rail contact interface is a critical component of any rail based system that must be carefully controlled in order to provide safe and efficient operations for passenger and freight services alike. There is a wide range of influential factors that affect wheel–rail contact conditions including vertical and lateral forces, distribution of mass, attack angle of wheel-set, speed, friction, debris on the track and curve radius. 1 These factors all affect wear of both the wheel and the rail, which can lead to failure and possible derailment.
The contact pressure distribution and interfacial friction define the stress state in the rail. The location and shape of the contact are vital to life prediction, daily maintenance, profile design and safety of rail tracks. Research and investigations have been undertaken for years to study the wheel–rail contact. Due to the complexity and inaccessibility of the dynamic wheel–rail interface, no practical methods exist to perform non-invasive measurements of the interfacial contact conditions suitable for applications in the field.
Contact modelling
The majority of the current designs and maintenance cycle predictions rely on analytical and numerical techniques to model the contact conditions and wear at the wheel–rail interface. 2 A common approach to model the contact pressure under normal loading conditions is to calculate the area of interpenetration of measured profiles. By fitting an ellipse to this, the Hertzian model can be applied to calculate the contact pressure. 3 There are a wide variety of complex numerical solvers such as FASTSIM, CONTACT or STRIPES that use the real profiles to create accurate dynamic contact area and pressure predictions considering the tangential load. 4
Measurement of contact pressure and area
Few experimental methods exist to reliably measure contact conditions at an interface and even fewer manage to achieve this non-invasively. Sawyer and Wahl reviewed the current state-of-the-art in in situ tribology in 2008.5,6 Pressure-sensitive films have been used but these introduce a thickness that will inherently change the contact conditions. Engineers blue is another example of an invasive technique that can yield useful information, especially under static conditions. The dynamic nature of the wheel–rail interaction limits the application though. 7 Some information can be extracted by measuring the electrical resistance across an interface as this is proportional to the contact conditions.8–10 However, the requirement for electrical isolation means that this method is usually confined to the laboratory. Optical methods have been successfully applied to the measurement of contacting interfaces by using a transparent component allowing vision systems to access the contact.11,12 Although a very powerful lab tool, optical based measurements are not feasible to be applied to the wheel–rail application due to the mechanical limits of transparent materials.
Dynamic measurements have been obtained using a modified rail section with a grid of small holes passing low-pressure air through the surface of the railhead. As the wheel moves over the rail, some of the holes will stop the flow of air. This results in low-resolution contact evolution data. 13
Kendal and Tabor 14 first used ultrasound to investigate dry contacts. They determined that the transmission of ultrasound was a function of the interfacial stiffness. Additional work was carried out by Dwyer-Joyce to further understand the relationship between surface roughness and stiffness.15,16 This work has been continued and numerous static ultrasonic contact measurements have been carried out using a scanning system to investigate machine element interfaces, such as Marshall et al.17,18 investigating the contact between bolted plates, interference fits 19 and the static contact pressure and area between a sectioned railroad vehicle wheel and rail. 20 The technique involves pulsing an ultrasonic pressure wave towards the contact interface and deriving information from reflected signals. In these investigations, an ultrasonic probe is immersed in water and mounted on an x–y scanning system resulting in a measurement of contact pressure distribution in a two-dimensional (2D) intensity plot. This method is only applicable to static contacts and the geometry of the specimens has to be carefully controlled to ensure the ultrasonic beam is reflected off the interface and back to the probe. These studies proved successful in the analysis of static contacts, but in order to apply these methods to industrial use, dynamic contact measurements must be achieved. By using an array of ultrasonic elements mounted directly to the component, dynamic contact pressure measurements can be achieved. Simple ball-on-flat dynamic contacts have been analysed in this way in a tribometer 21 and the contact pressure distribution of a metal-to-metal seal was characterised during an oil and gas end fitting assembly process. 22 In this investigation, a 64 element linear array was mounted in the rail resulting in a 1D line measurement. As the wheel rolls over the rail, the contact pressure distribution can be measured in real time. A simple quasi-static measurement has previously been carried out by moving an array across a static wheel flange–gauge corner contact. 23 The aim of this work was to build on this initial study to carry out a quasi-static wheel tread–rail head measurement using wheel and rail sections loaded in a standard hydraulic loading frame followed by a dynamic measurement of the same contact on a full-scale test rig.
Ultrasonic measurements
Background
Ultrasound is the name given to sound waves of a frequency higher than those audible by the human ear starting from approximately 20 kHz. 24 Sound waves in this range occur naturally in mechanical equipment, but the ultrasonic method used here is when an ultrasonic wave is purposefully introduced into the component and the behaviour of this wave carefully monitored. This is commonly referred to as ultrasonic reflectometry and has a wide range of applications, most notably in the fields of medical diagnostics and non-destructive testing. More recently this technology is being utilised in industry for the non-invasive measurement and monitoring of tribological contacts through the advent of permanently mounted transducers. The measurement is achieved by mounting a transducer, usually piezoelectric, on an external surface that faces the interface of interest. The transducer is excited and a pressure wave is generated that travels through the host medium. As the wave reaches a feature of different material properties, such as a crack or interface, the wave is partially reflected. The reflected wave is detected by the same transducer and the signal is amplified and digitised. By monitoring the phase and amplitude of the reflected wave, it is possible to understand a great deal about the host material and the interface. This technique has been successfully employed to measure contact pressure,3,16–23 but also lubricant film thickness, 25 viscosity 26 and wear. 27
Reflection of ultrasonic waves at an interface
For a perfectly bonded contact pair, the proportion of the incident signal reflected from the interface, known as reflection coefficient R, is dependent on the acoustic impedance z, of the materials and is determined by following relationship

Engineering surfaces have an inherent surface roughness irrespective of how smooth they may appear. As two solid surfaces are pressed together, the asperity peaks come into contact with one another and many microscopic air gaps are formed. The actual area of contact is small relative to the apparent area. Assuming the asperities undergo elastic deformation, the interface can be analogised as a series of springs with stiffness, K per unit area, where an increase in nominal contact pressure, p, results in a unit increase in approach, u, of the two materials, described by equation (2)

Figure 1(a) shows a real engineering surface interface and Figure 1(b) is the system represented as a series of springs. The surface topography of the left image is that of ground EN24 steel Ra of 0.47.
(a) A diagram showing to scale the surface asperities coming into contact and (b) how the interface behaves as a series of springs of stiffness K.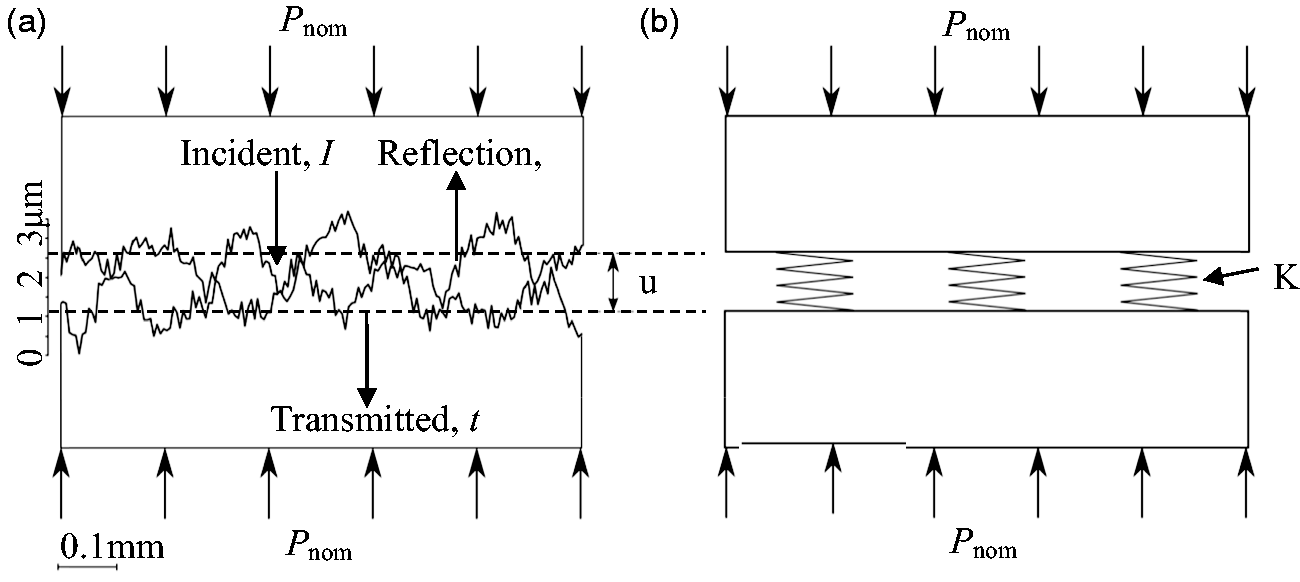
Figure 1(a) shows two real engineering surfaces lightly loaded together. As the nominal load Pnom is applied, the asperities deform and the interfacial stiffness increases. For an ultrasonic wave packet reflecting off an interface, Kendall and Tabor
14
observed that if the length of the ultrasonic wave is long in comparison with the air gaps, the whole interface behaves as a single reflector and therefore the ultrasonic reflection is dependent upon the spring behaviour of the interface. Thus an increase in interfacial stiffness results in an increase in ultrasonic transmission to the contacting material and a reduction in the magnitude of the measured reflected wave. By monitoring the change in amplitude of the reflected wave, or the reflection coefficient R, the interfacial stiffness K (GPa μ/m) can be calculated from the relationship equation (3)


In practice, R is obtained from ultrasonic measurements by dividing the measured reflected wave by a reference reflection. The reference reflection is a measurement of (assumed) 100% reflection, which is achieved when the ultrasonic wave reflects off a solid–air interface when there is no contact in occurrence. When contact occurs, some of the wave is transmitted and the magnitude of the reflected wave decreases. A division of the measured reflected wave by the reference reflection results in a value of R. This division can take place in the time or frequency domain and can be achieved in real time.
Relationship between interfacial stiffness and contact pressure
The interfacial stiffness K is non-linear and varies from zero where the surfaces are just touching, to infinity when they are in complete contact. In practice in most engineering interfaces the real area of contact is very small compared to the apparent area of contact, asperity contacts are dependent on the surface topography and the relationship between stiffness and contact pressure is close to linear.
Dwyer-Joyce et al.
15
experimentally investigated the relationship between stiffness and pressure for various surfaces and compared them to models of rough surface contact. They showed that for low contact pressure (MPa) a linear relationship is adequate. By performing a calibration procedure with like for like materials and surface topographies, it is possible to directly obtain contact pressure from measurements of R. To perform this calibration, a known load is applied to a known contact area and from this, a relationship can be determined between the interfacial stiffness and the contact pressure that holds true for that particular contact pair. For the worn wheel tread case (worn here means the wheel is run in and therefore smoother than the ‘recently turned’ case) that applies here, the relationship between contact pressure p is
20
(please note that the same calibration was used for static and dynamic tests)

Ultrasonic instrumentation for rail contact measurements
The previous methods trialled,3,20,23 with ultrasound are highly destructive as the wheel and rail specimens had to be sectioned and measurements taken in an ultrasonic scanning tank. This approach was able to achieve high resolution measurements but is confined static measurements in a laboratory. In order to achieve dynamic measurements, a different approach was required. By mounting a linear array of ultrasonic elements in the rail-head, it is possible to achieve dynamic measurements of a full-scale wheel and rail contact.
An ultrasonic array transducer is a device with a number of separate active elements mounted together in a single housing. They typically have between 16 and 256 individual piezoelectric elements in a line, although they can be built to any specification and are sometimes mounted in an annulus or grid. In this work, a 64-element linear array transducer (10 MHz) was mounted in a hole cut in the rail as shown in Figure 2. A spring load was used to press the transducer against the underside of the rail and a solid rubber couplant was used to facilitate the acoustic transmission. The elemental spacing was 0.7 mm resulting in a measurement window length of 44.8 mm. The transducer was driven by a bespoke PC-based ultrasonic pulser–receiver–digitiser system. The system only had eight ultrasonic channels so a multiplexer was used to reach the required channel count of 64.
The ultrasonic array mounted in a rail section.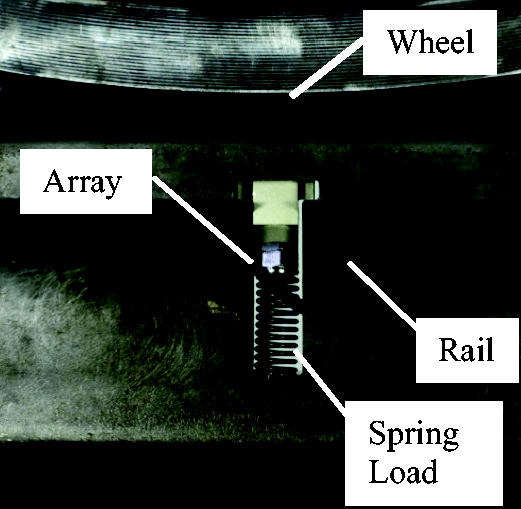
The elements in the array are electrically excited individually in turn. As each element is excited, a pressure wave is generated that propagates through the rail material and reflects at the rail head interface. The reflected wave is then received by the same element before the multiplexor switches and the neighbouring element is pulsed as the cycle continues. The reflected signals are amplified and digitised and are then saved and/or processed in real time. A schematic diagram of the setup can be seen in Figure 3.
A schematic diagram of the test arrangement.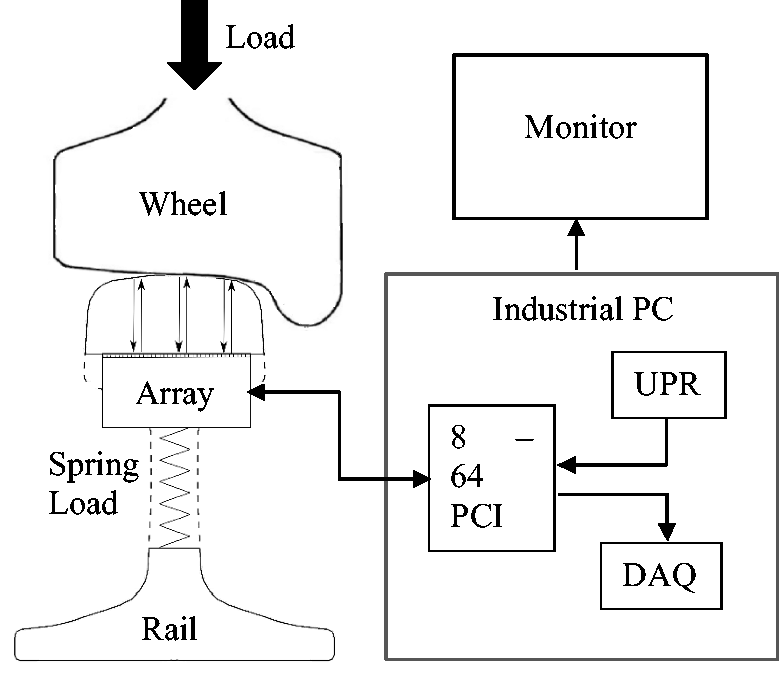
Quasi-static wheel–rail contact pressure measurement
The first stage was to carry out an initial quasi-static experiment to de-risk this process and to prove that the technique was viable. A compression loading rig was employed for this initial proof of concept.
Experimental set-up and methodology
A 100 kN electric Mayes compression rig was used to simulate the vertical force in this static loading scenario. The wheel section was mounted in the upper loading frame and the rail was clamped to the lower test bed during loading. The wheel and rail were positioned in such a way that the contact patch occurred directly above the transducer. An initial reference ultrasonic measurement was taken before contact occurred. A reference measurement is the peak-to-peak value of the reflected A-Scans when (assumed) 100% of the wave is reflected. A load cycle was applied from 0 to 60 kN in steps of 10 kN and the reflected signals captured and processed in real time.
Quasi-static contact results
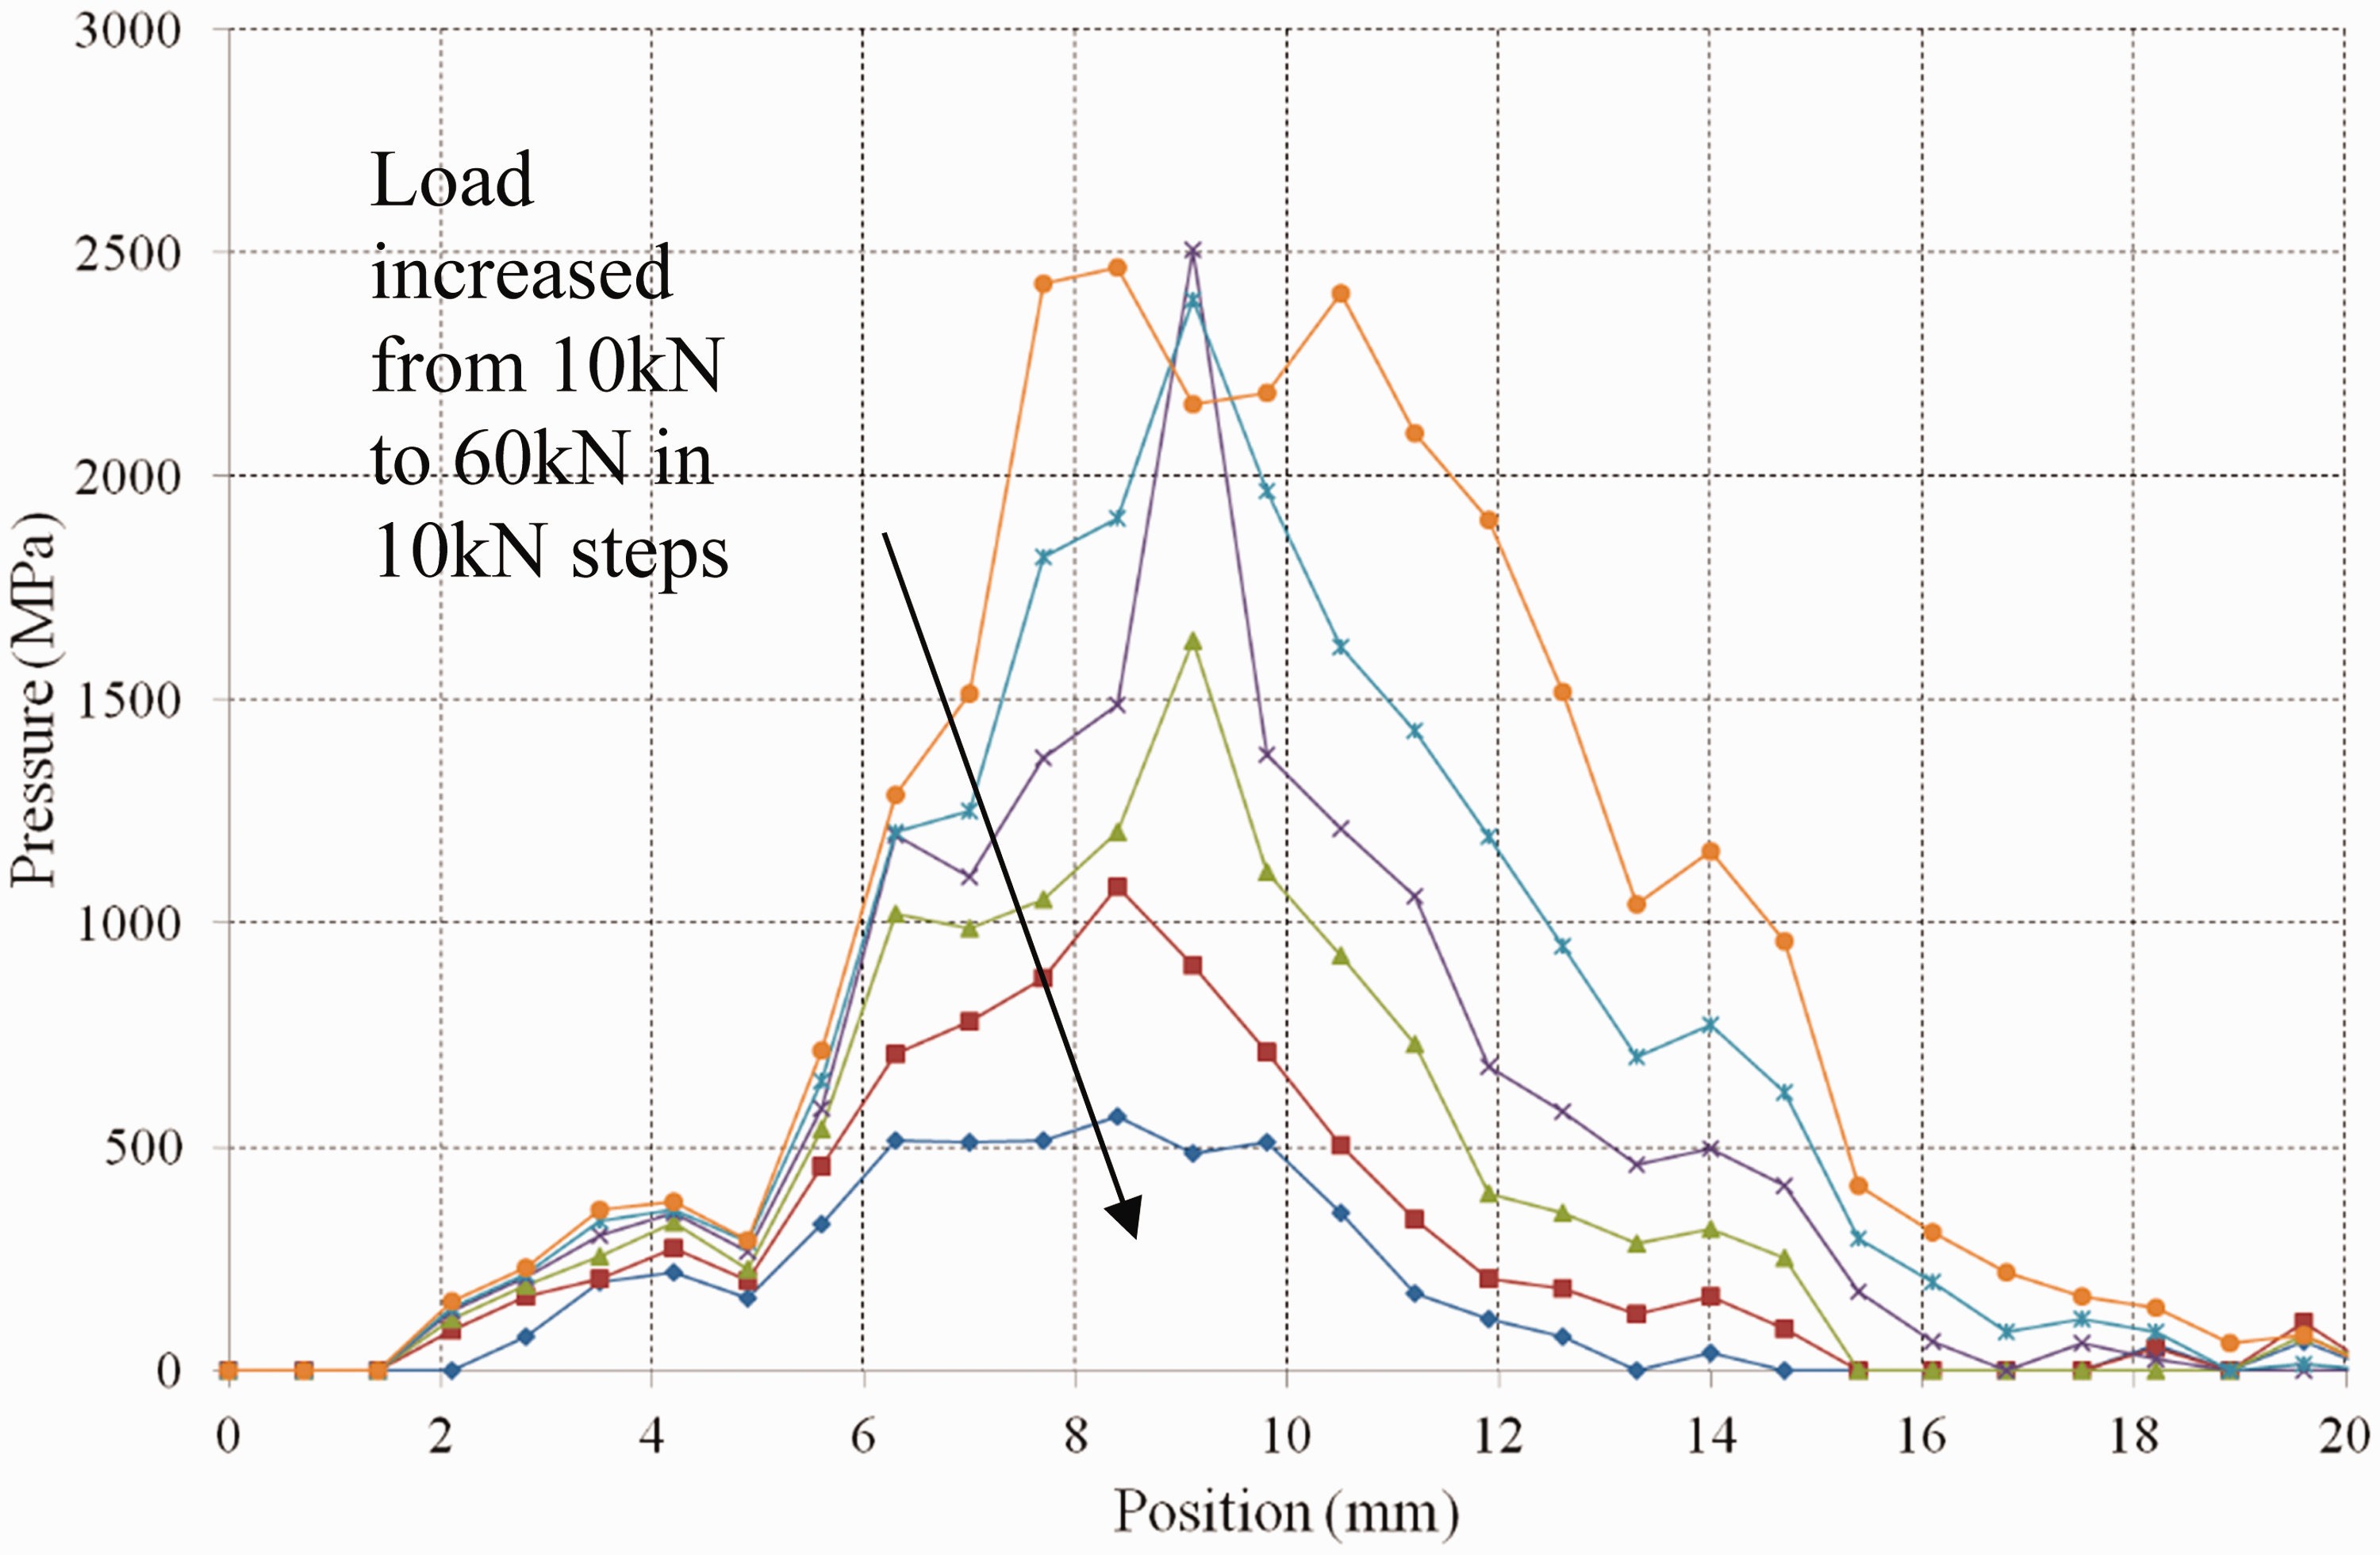
The resultant cross-sectional reflection coefficients were obtained using the method previously described, see Figure 4. These values were used to calculate interfacial stiffness’ using equation (4). Using the relationship between interfacial stiffness and contact pressure discussed in the earlier section, a cross-sectional pressure profile for the wheel–rail contact can be obtained, as shown in Figure 5.
The reflection coefficient over the length of the wheel–rail interface. Contact pressure profile of the wheel–rail interface for various loads.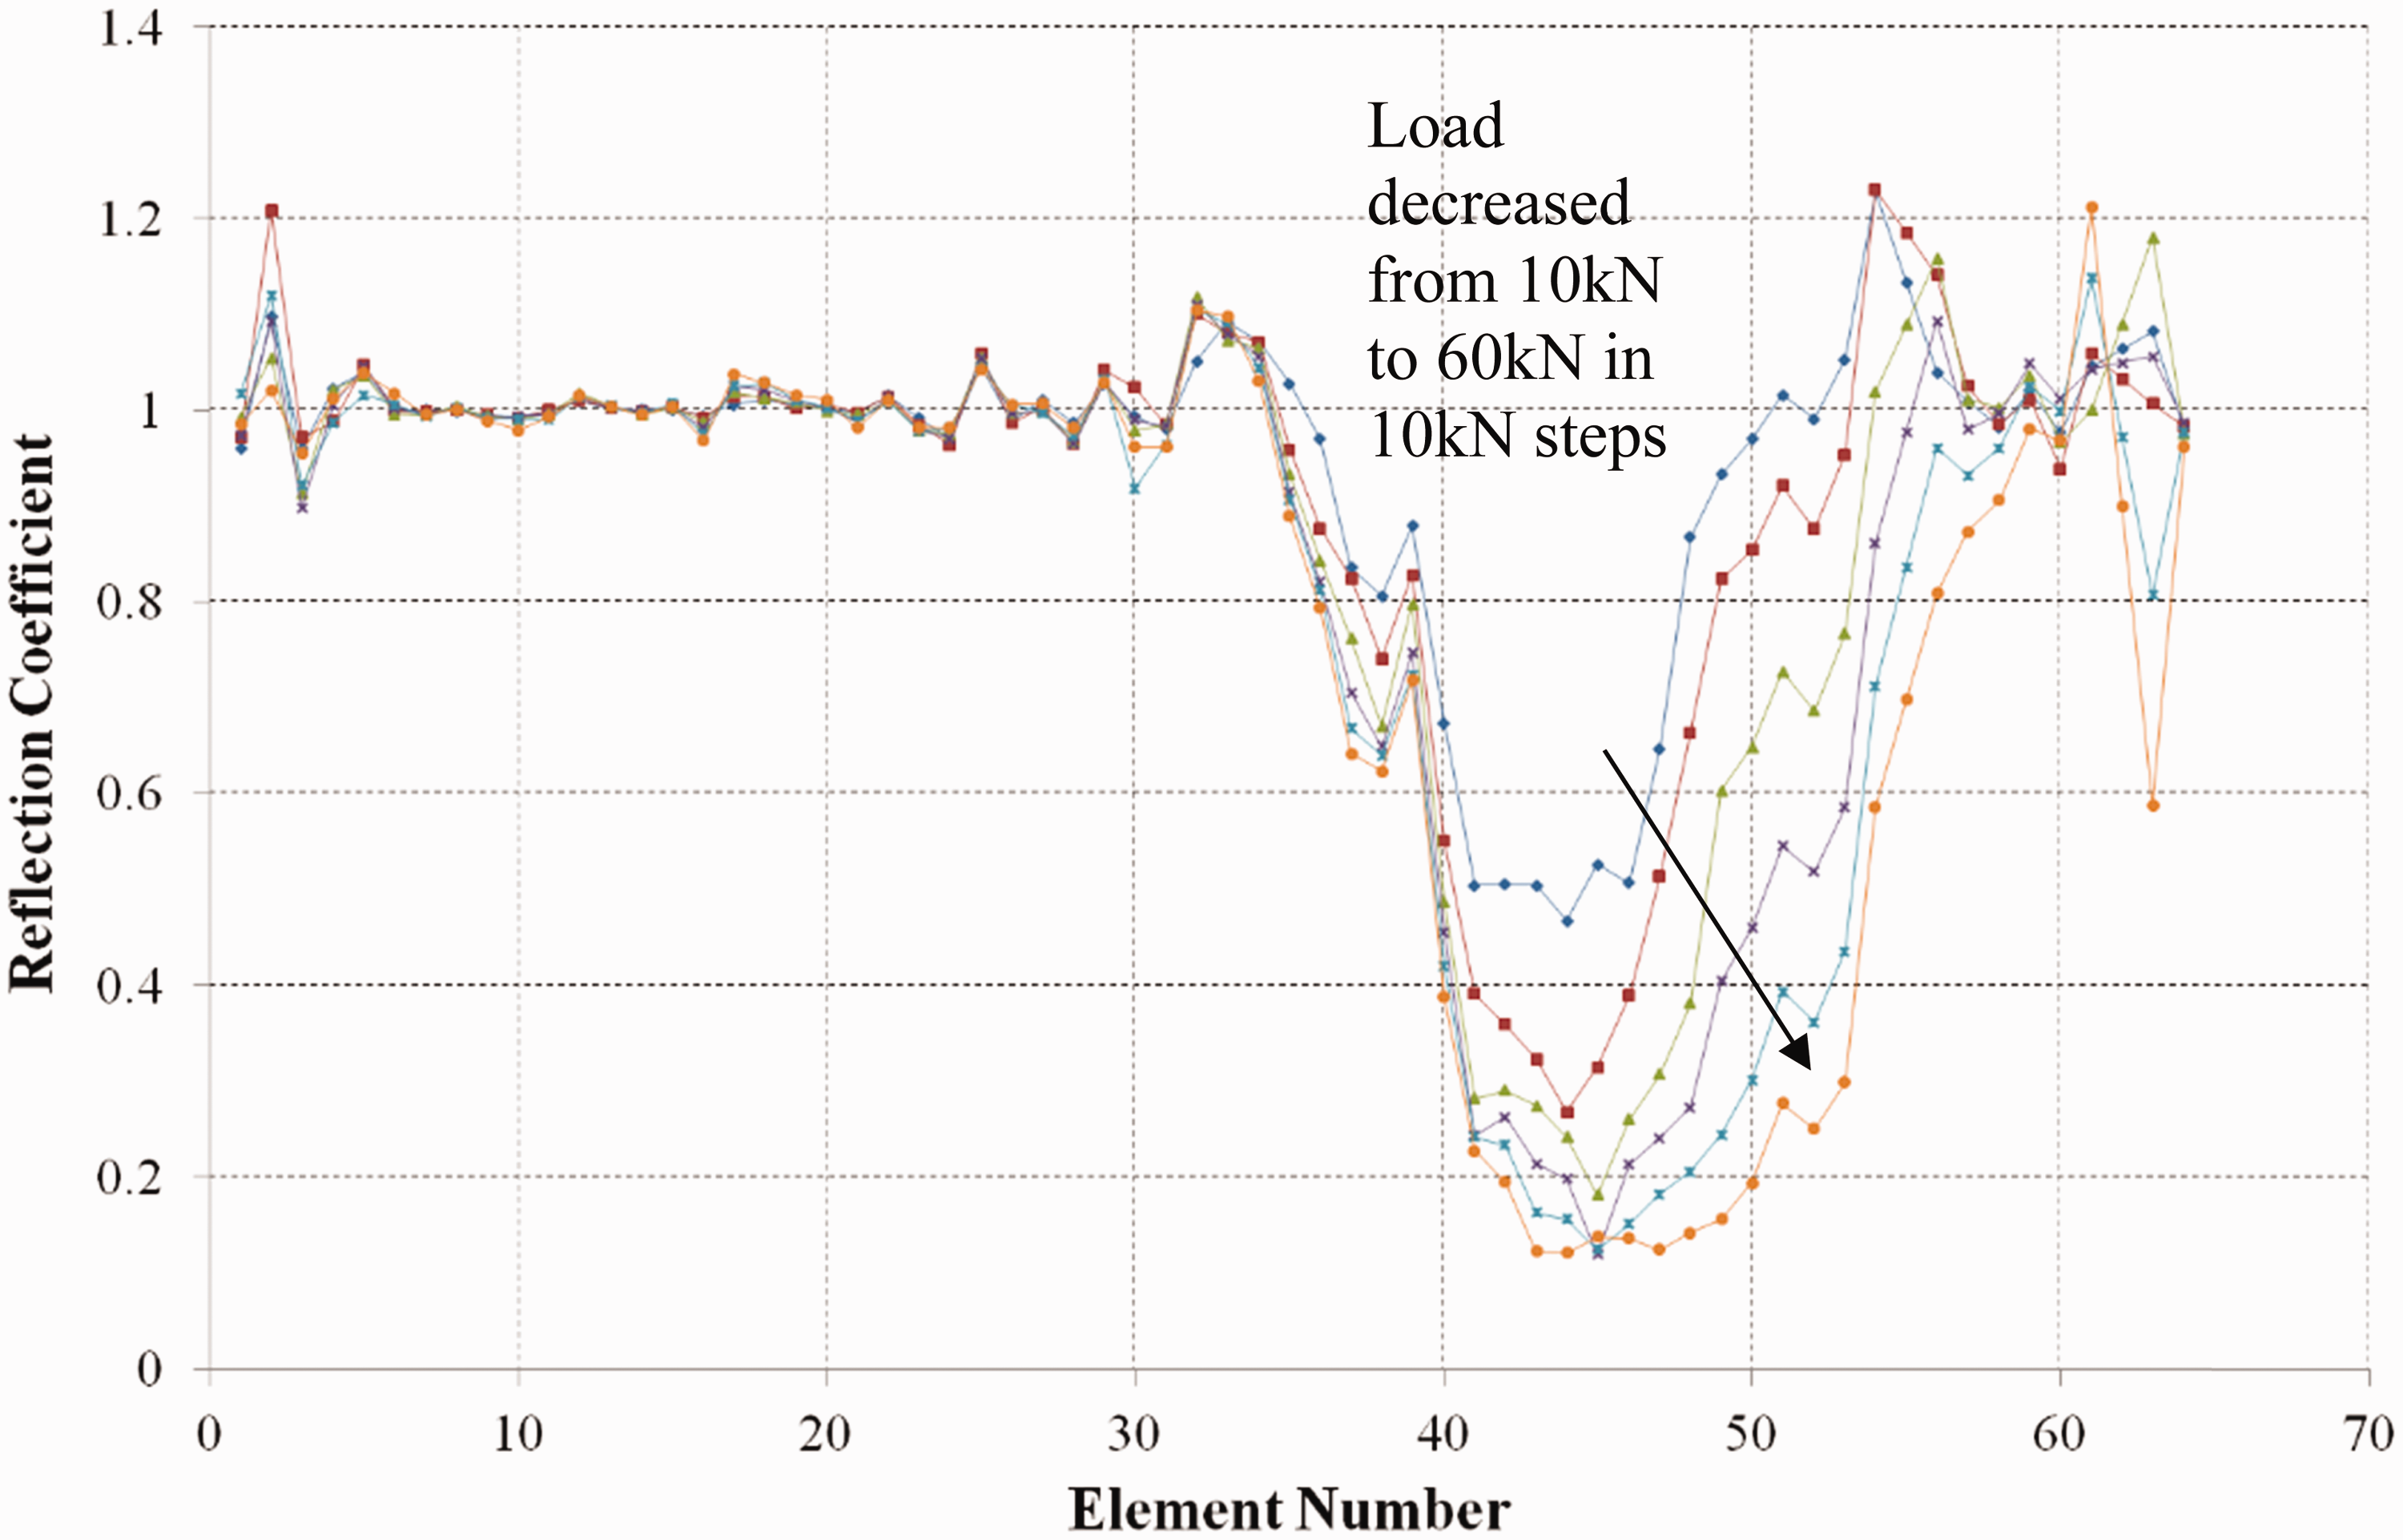
In order to create a 2D surface plot, the rail was manually traversed under the fixed wheel at 1 mm steps and re-loaded at each step.
Figure 6 shows the 2D maps of reflection coefficient at loads of 40 kN in (a) and 80 kN in (b).
Two-dimensional reflection coefficient surface plots of the wheel–rail interface at: (a) 40 kN and (b) 80 kN.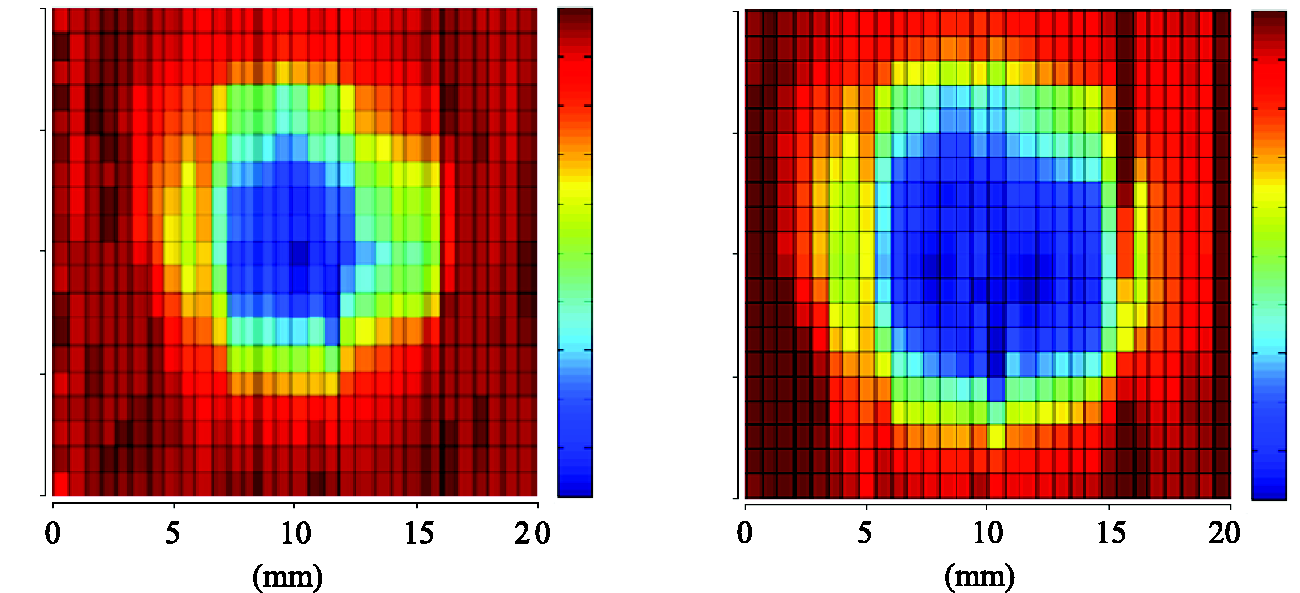
Pressure-sensitive film (Fujifilm prescale super high pressure 130–300 MPa) was placed between the contact and the load applied. The results can be seen in Figure 7.
The measured contact patch from the pressure-sensitive film for an applied load of: (a) 40 kN and (b) 80 kN.
Dynamic measurement of wheel–rail contact
The aim of this section was to obtain dynamic ultrasonic contact patch measurements of a real wheel rolling over a rail with a rail mounted ultrasonic array system.
Dynamic wheel–rail experimental set-up
A full-scale dynamic wheel on rail test rig was used for testing; photographs of the test rig can be seen in Figure 8. A wheel (5) with a worn P8 profile at a diameter of 920 mm is suspended on an axle mounted in hinged sub-frame (2). Above the wheel sits a vertically mounted actuator used to simulate axle loads of up to 200 kN. A 1200 mm long UIC60A rail section (6) is mounted on a sliding bed. The rail is driven by horizontally mounted hydraulic actuators (3) and can be pulled and pushed longitudinally. In this set of tests, the wheel rotates due to friction as the rail moves, although the equipment has the ability to move the wheel independently, more information on the rig can be found in literature.30,31
Full-scale wheel–rail test-rig (1: vertical actuator; 2: loading frame; 3: longitudinal drive system; 4: lateral Ram; 5: wheel; 6: rail).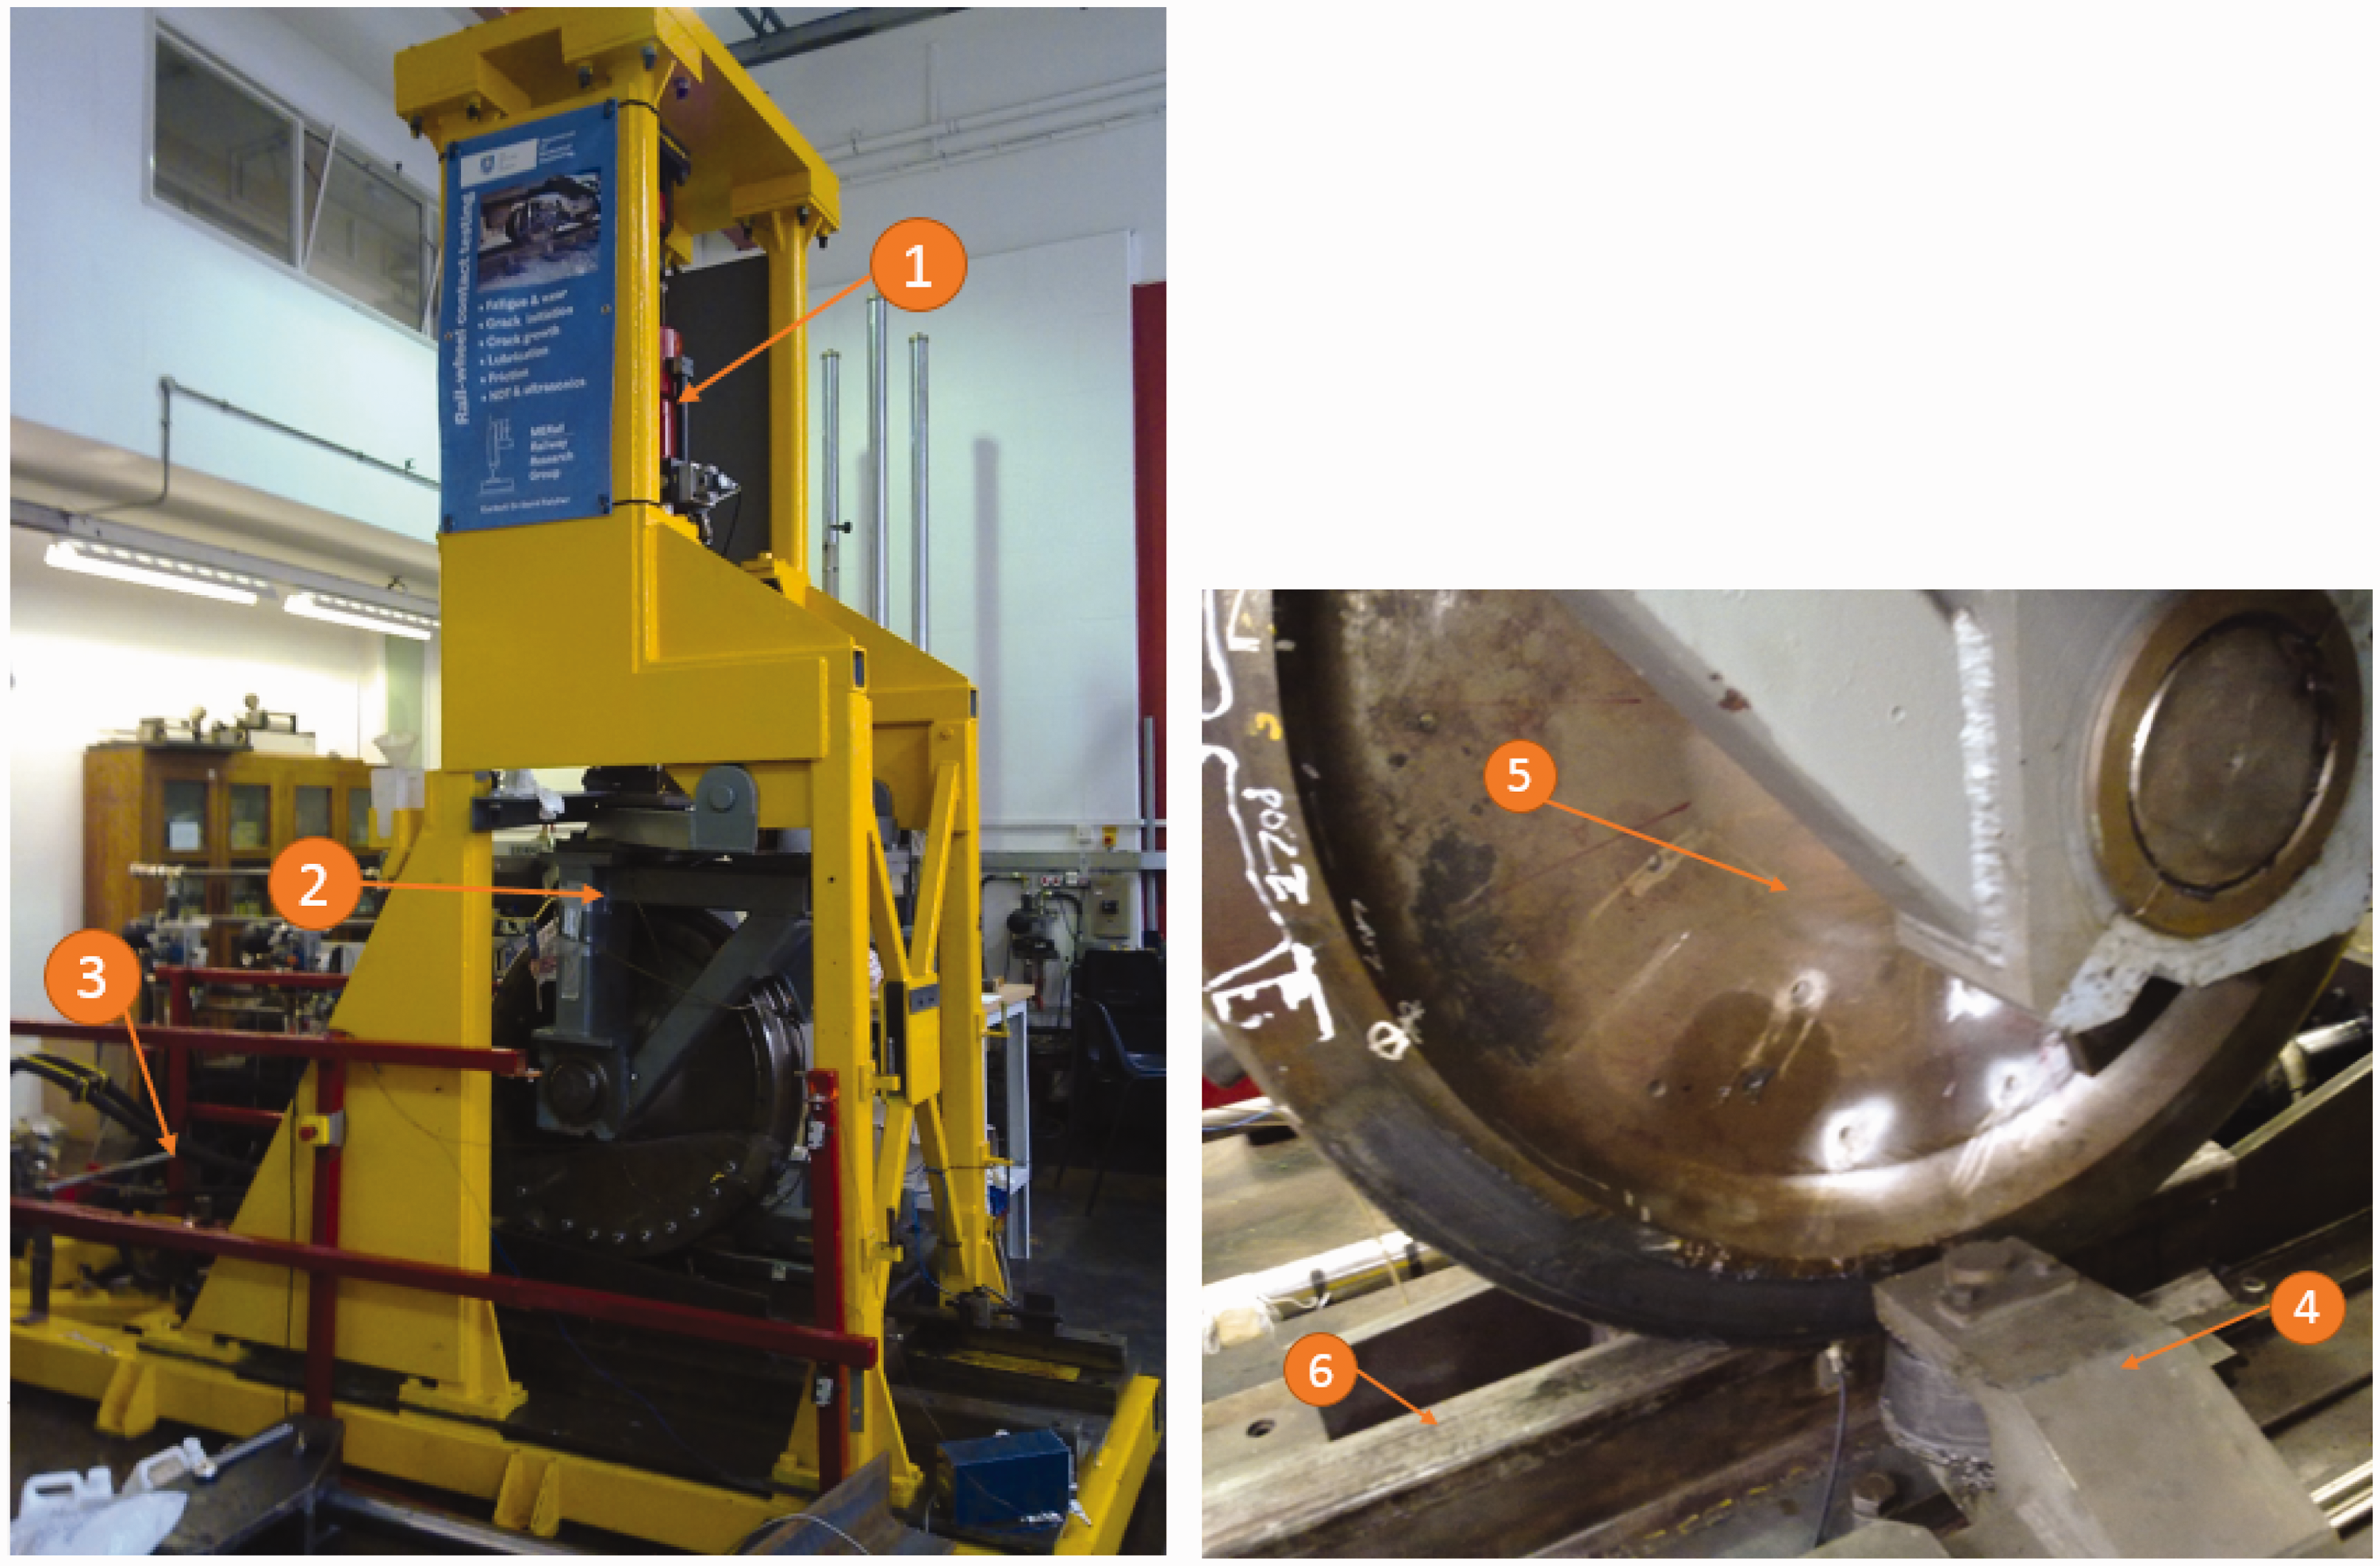
The rail has a maximum displacement of 200 mm resulting in a wheel rotation of approximately 1/3 of a full revolution. After each pass, the rail is pushed backwards and the wheel is reset to its original position. It is also possible to apply a lateral load to the wheel using a lateral ram (4), although no lateral load was applied during this investigation.
The ultrasonic array transducer was mounted in the rail in the same configuration as in the earlier section. The software was designed so that the reflection coefficient and contact pressure profile was calculated in real time and the contact pressure surface plots were displayed live on-screen. This allowed simple repositioning of the array transducer during testing to ensure the entire contact patch was captured in the centre of the measurement window. The resolution of the x-axis across the rail head is limited to the physical arrangement of the elements and so in this case was fixed at 0.7 mm × 64 mm. The resolution of the y-axis rolling direction is determined by the ultrasonic pulse repetition frequency (PRF) and the wheel rolling velocity. The rolling speeds for these tests were 10 mm/s and a constant load was applied throughout the full stroke. As the rolling velocity of the wheel–rail rig was low, a PRF of 14 Hz was used to yield a rolling direction resolution of approximately 0.7 mm.
Full-scale dynamic test results
Reflection coefficient intensity plots of the wheel rail contact for three loading cases can be seen in Figure 9.
Reflection coefficient intensity plots for normal loads of: (a) 40 kN; (b) 80 kN; (c) 120 kN.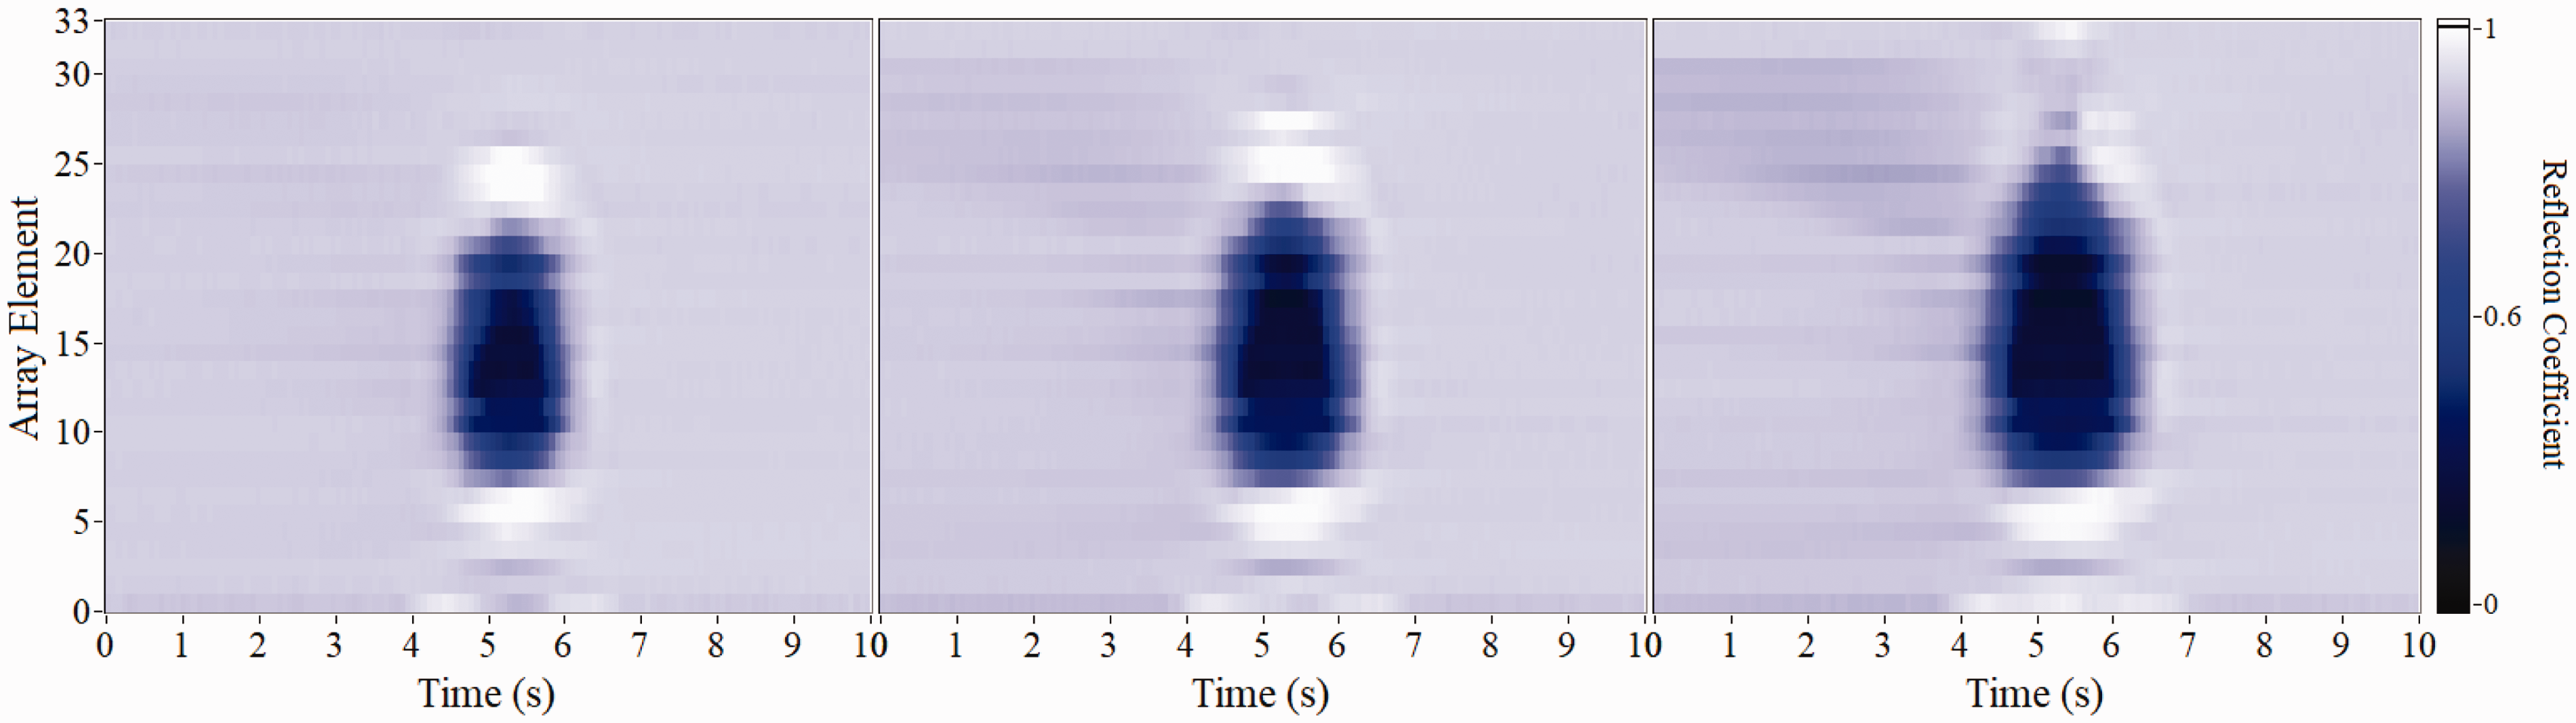
This figure clearly shows the contact patch, which increases in size with increasing normal load. Using the transducer size, ultrasonic PRF and rolling speed the axis of the above figure can be converted to distance. Surface plots showing the reflection coefficient are given in Figure 10.
Reflection coefficient intensity plots with axis converted to length for normal loads of: (a) 40 kN; (b) 80 kN; (c) 120 kN. The Y-axis denotes the rolling direction.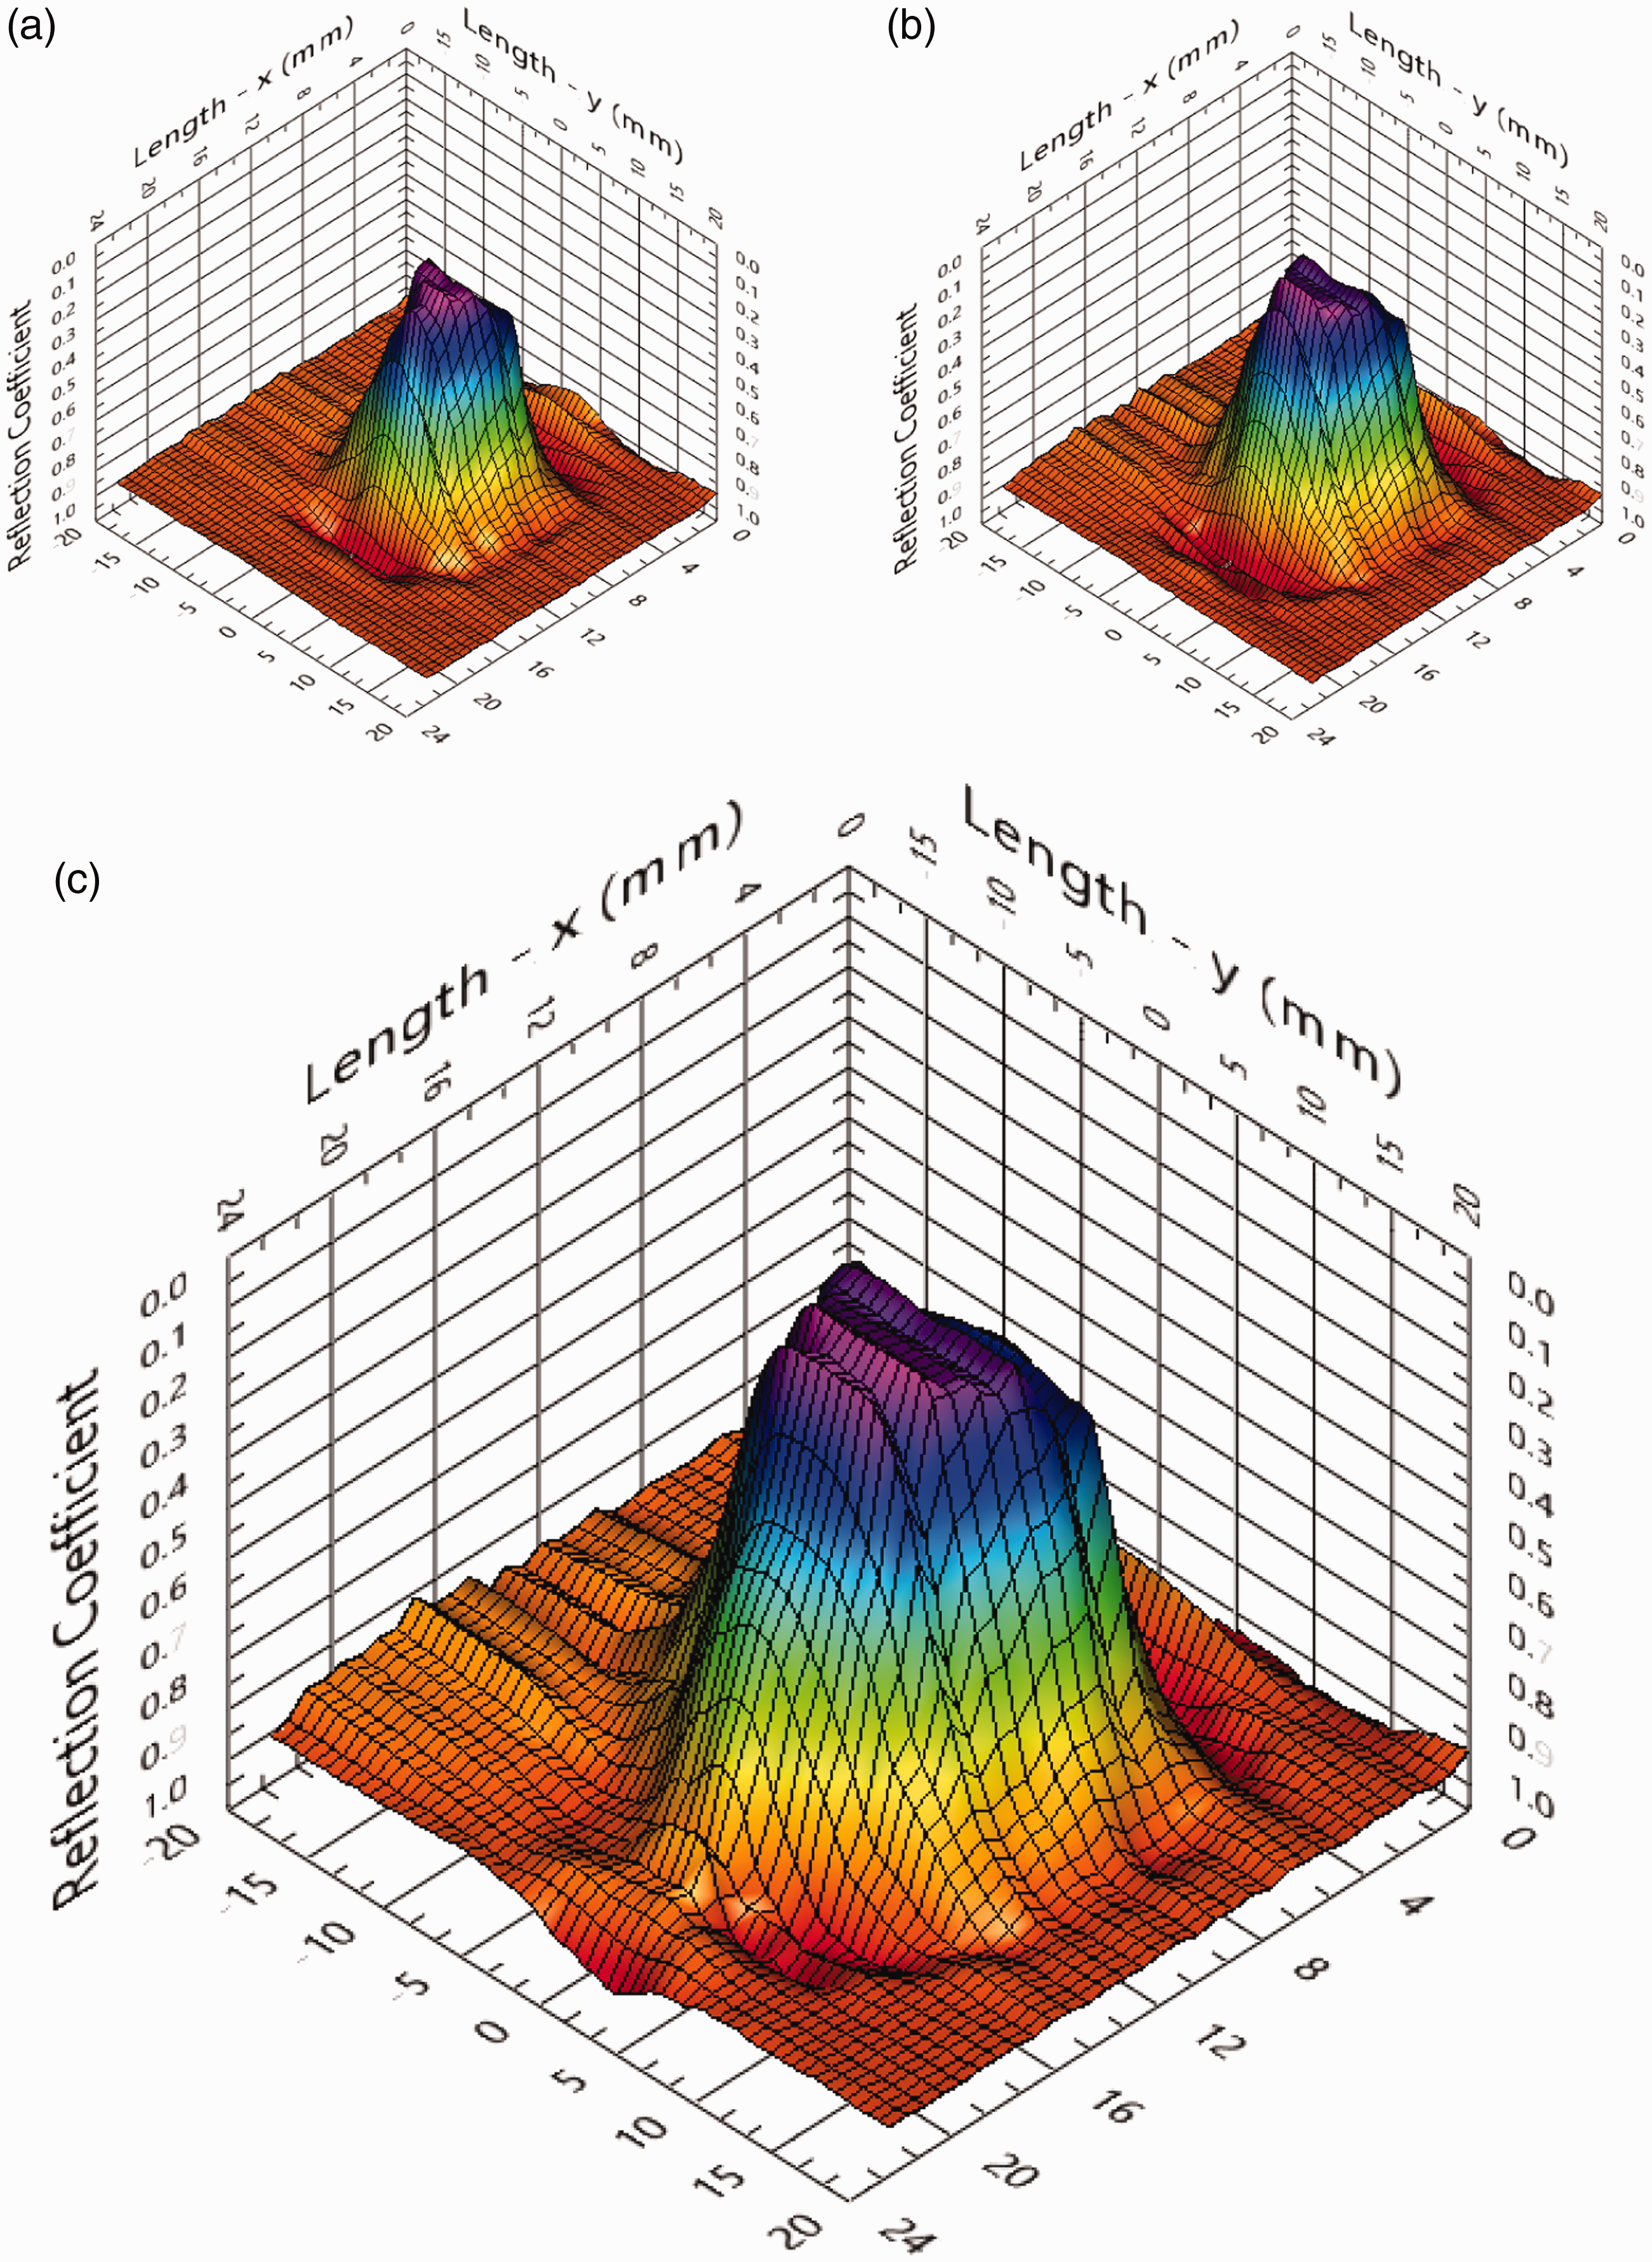
Equation (4) was then used along with the acoustic impedance of steel (46 MRayls) and the array frequency (5 MHz) to calculate interfacial stiffness from the reflection coefficient, as presented in Figure 11.
Contact stiffness for normal loads of: (a) 40 kN; (b) 80 kN; (c) 120 kN.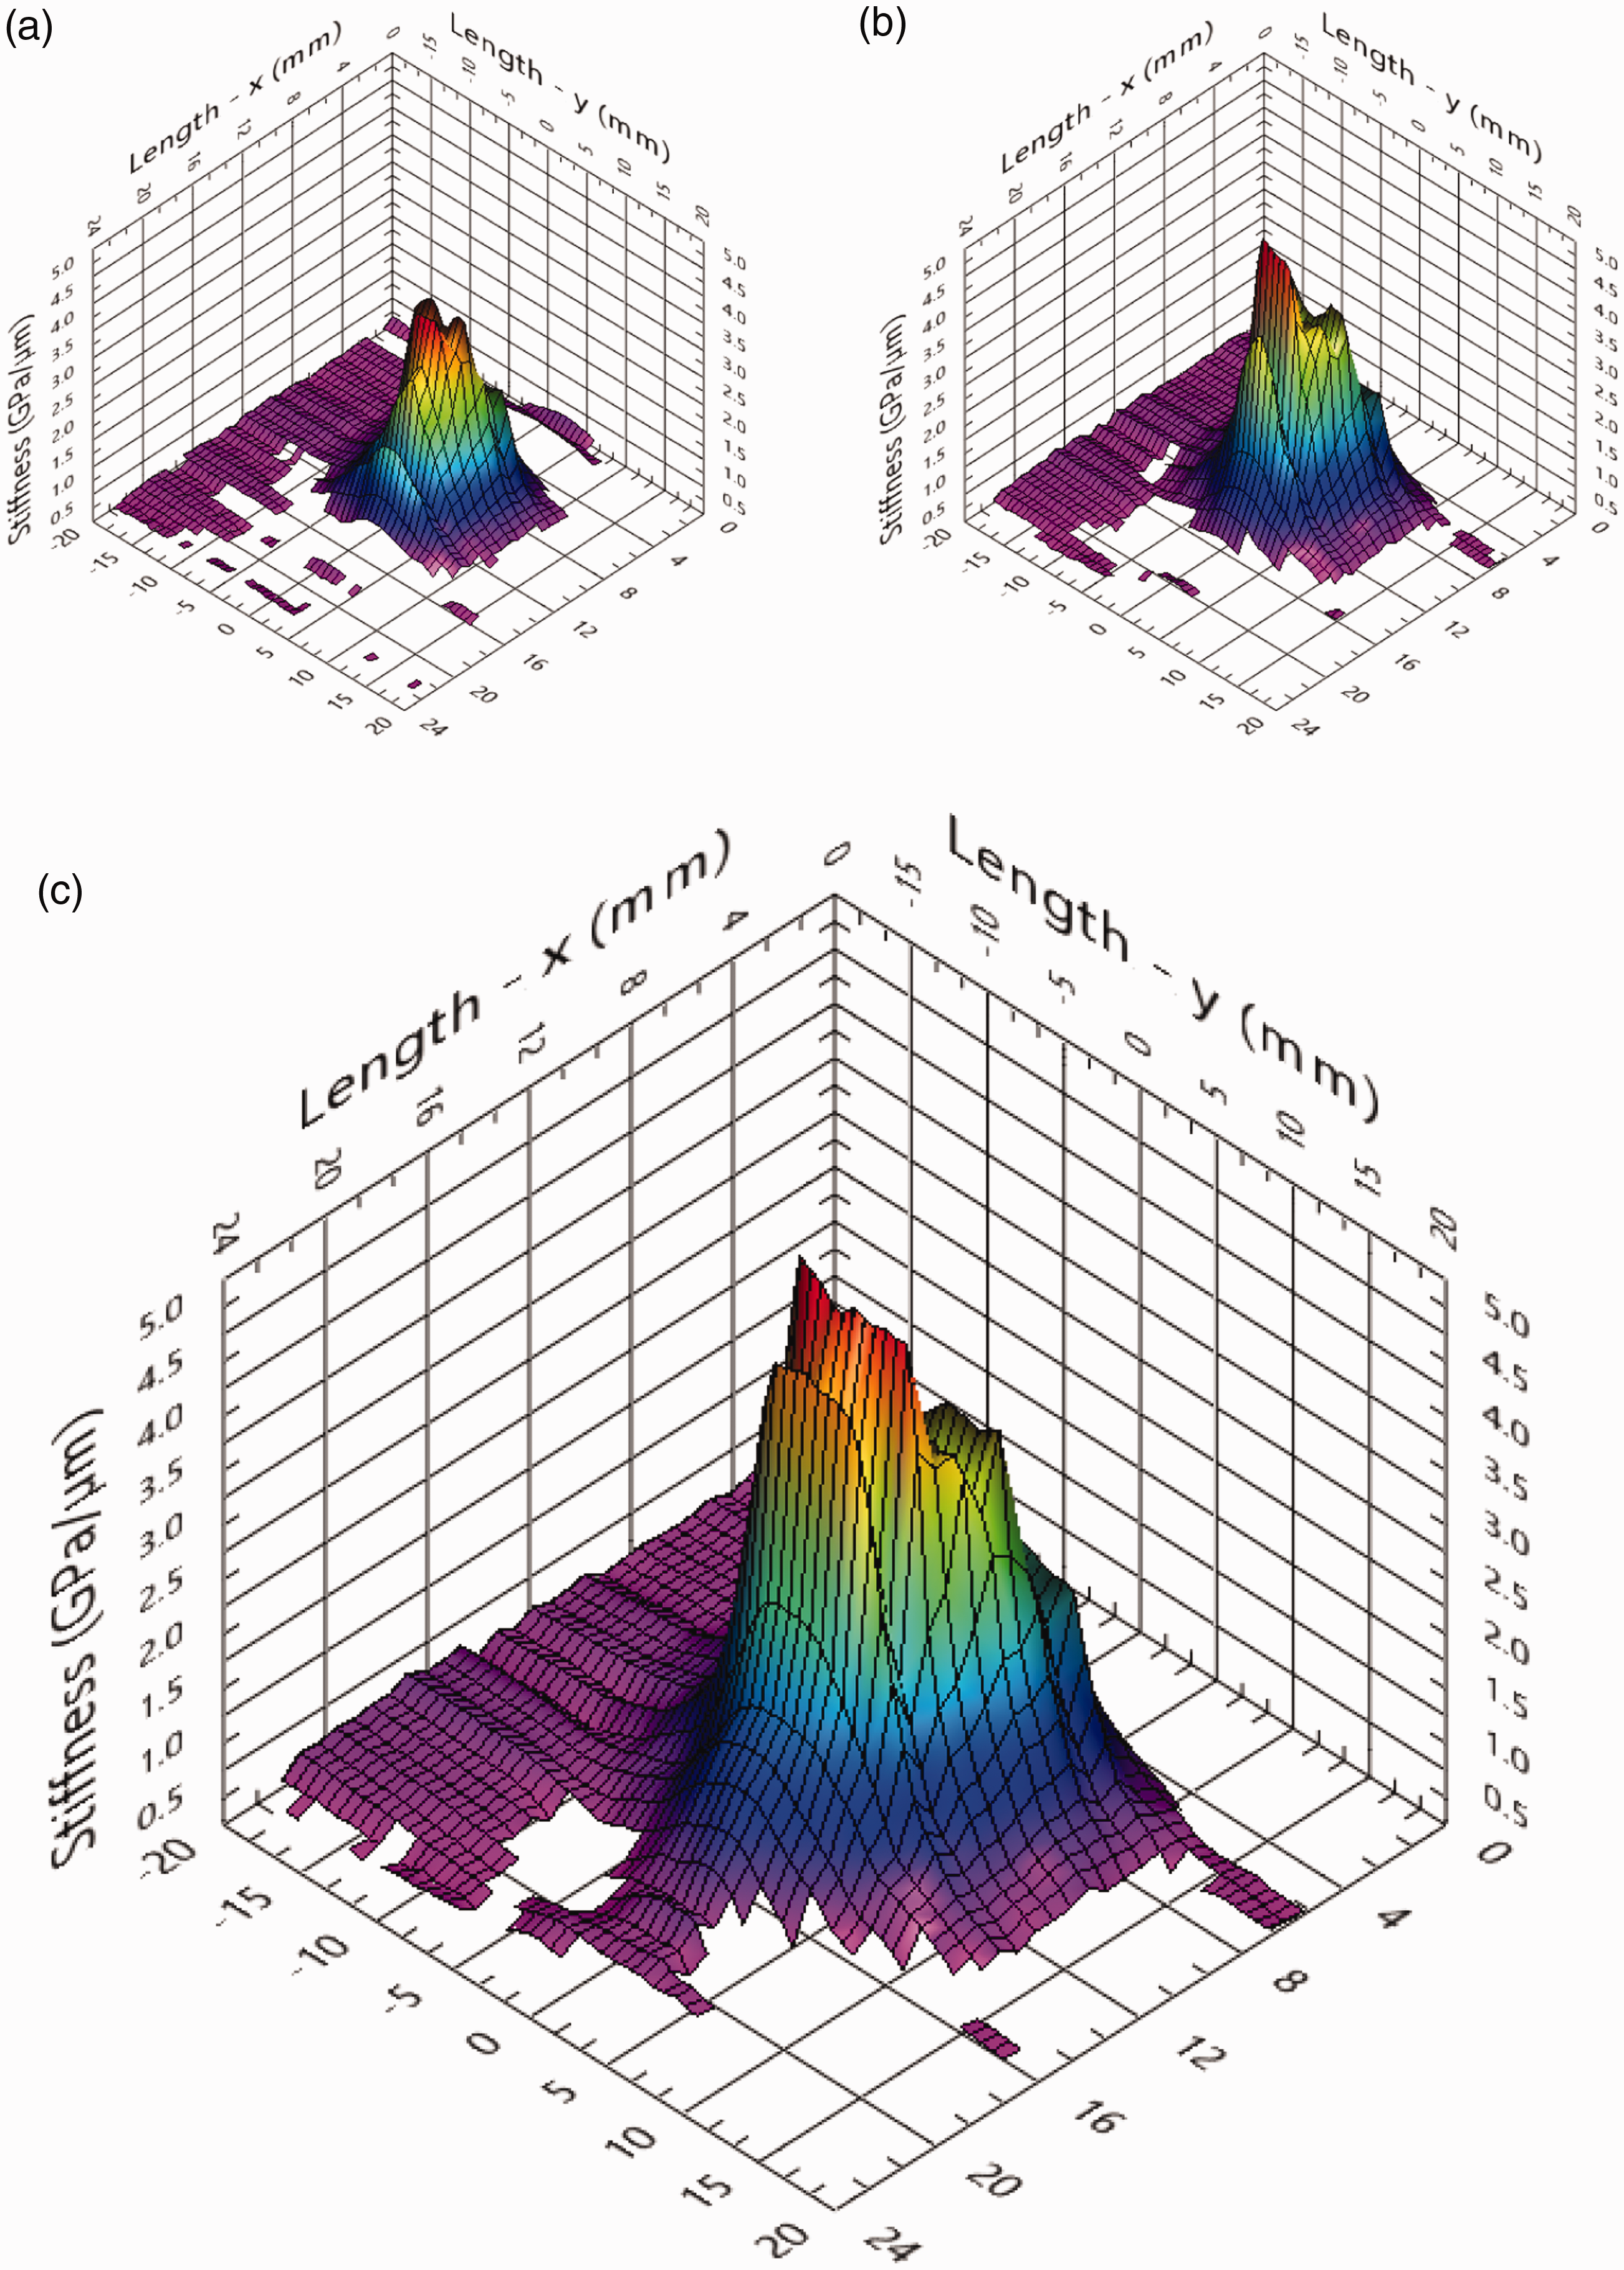
Null values are seen outside of the contact where there is an air interface. The stiffness is seen to increase with increasing normal load, as expected, and peak stiffness is in the region of 5 GPa/µm. The stiffness was converted to pressure using equation (5) to yield Figure 12.
Contact pressure for normal loads of: (a) 40 kN; (b) 80 kN; (c) 120 kN.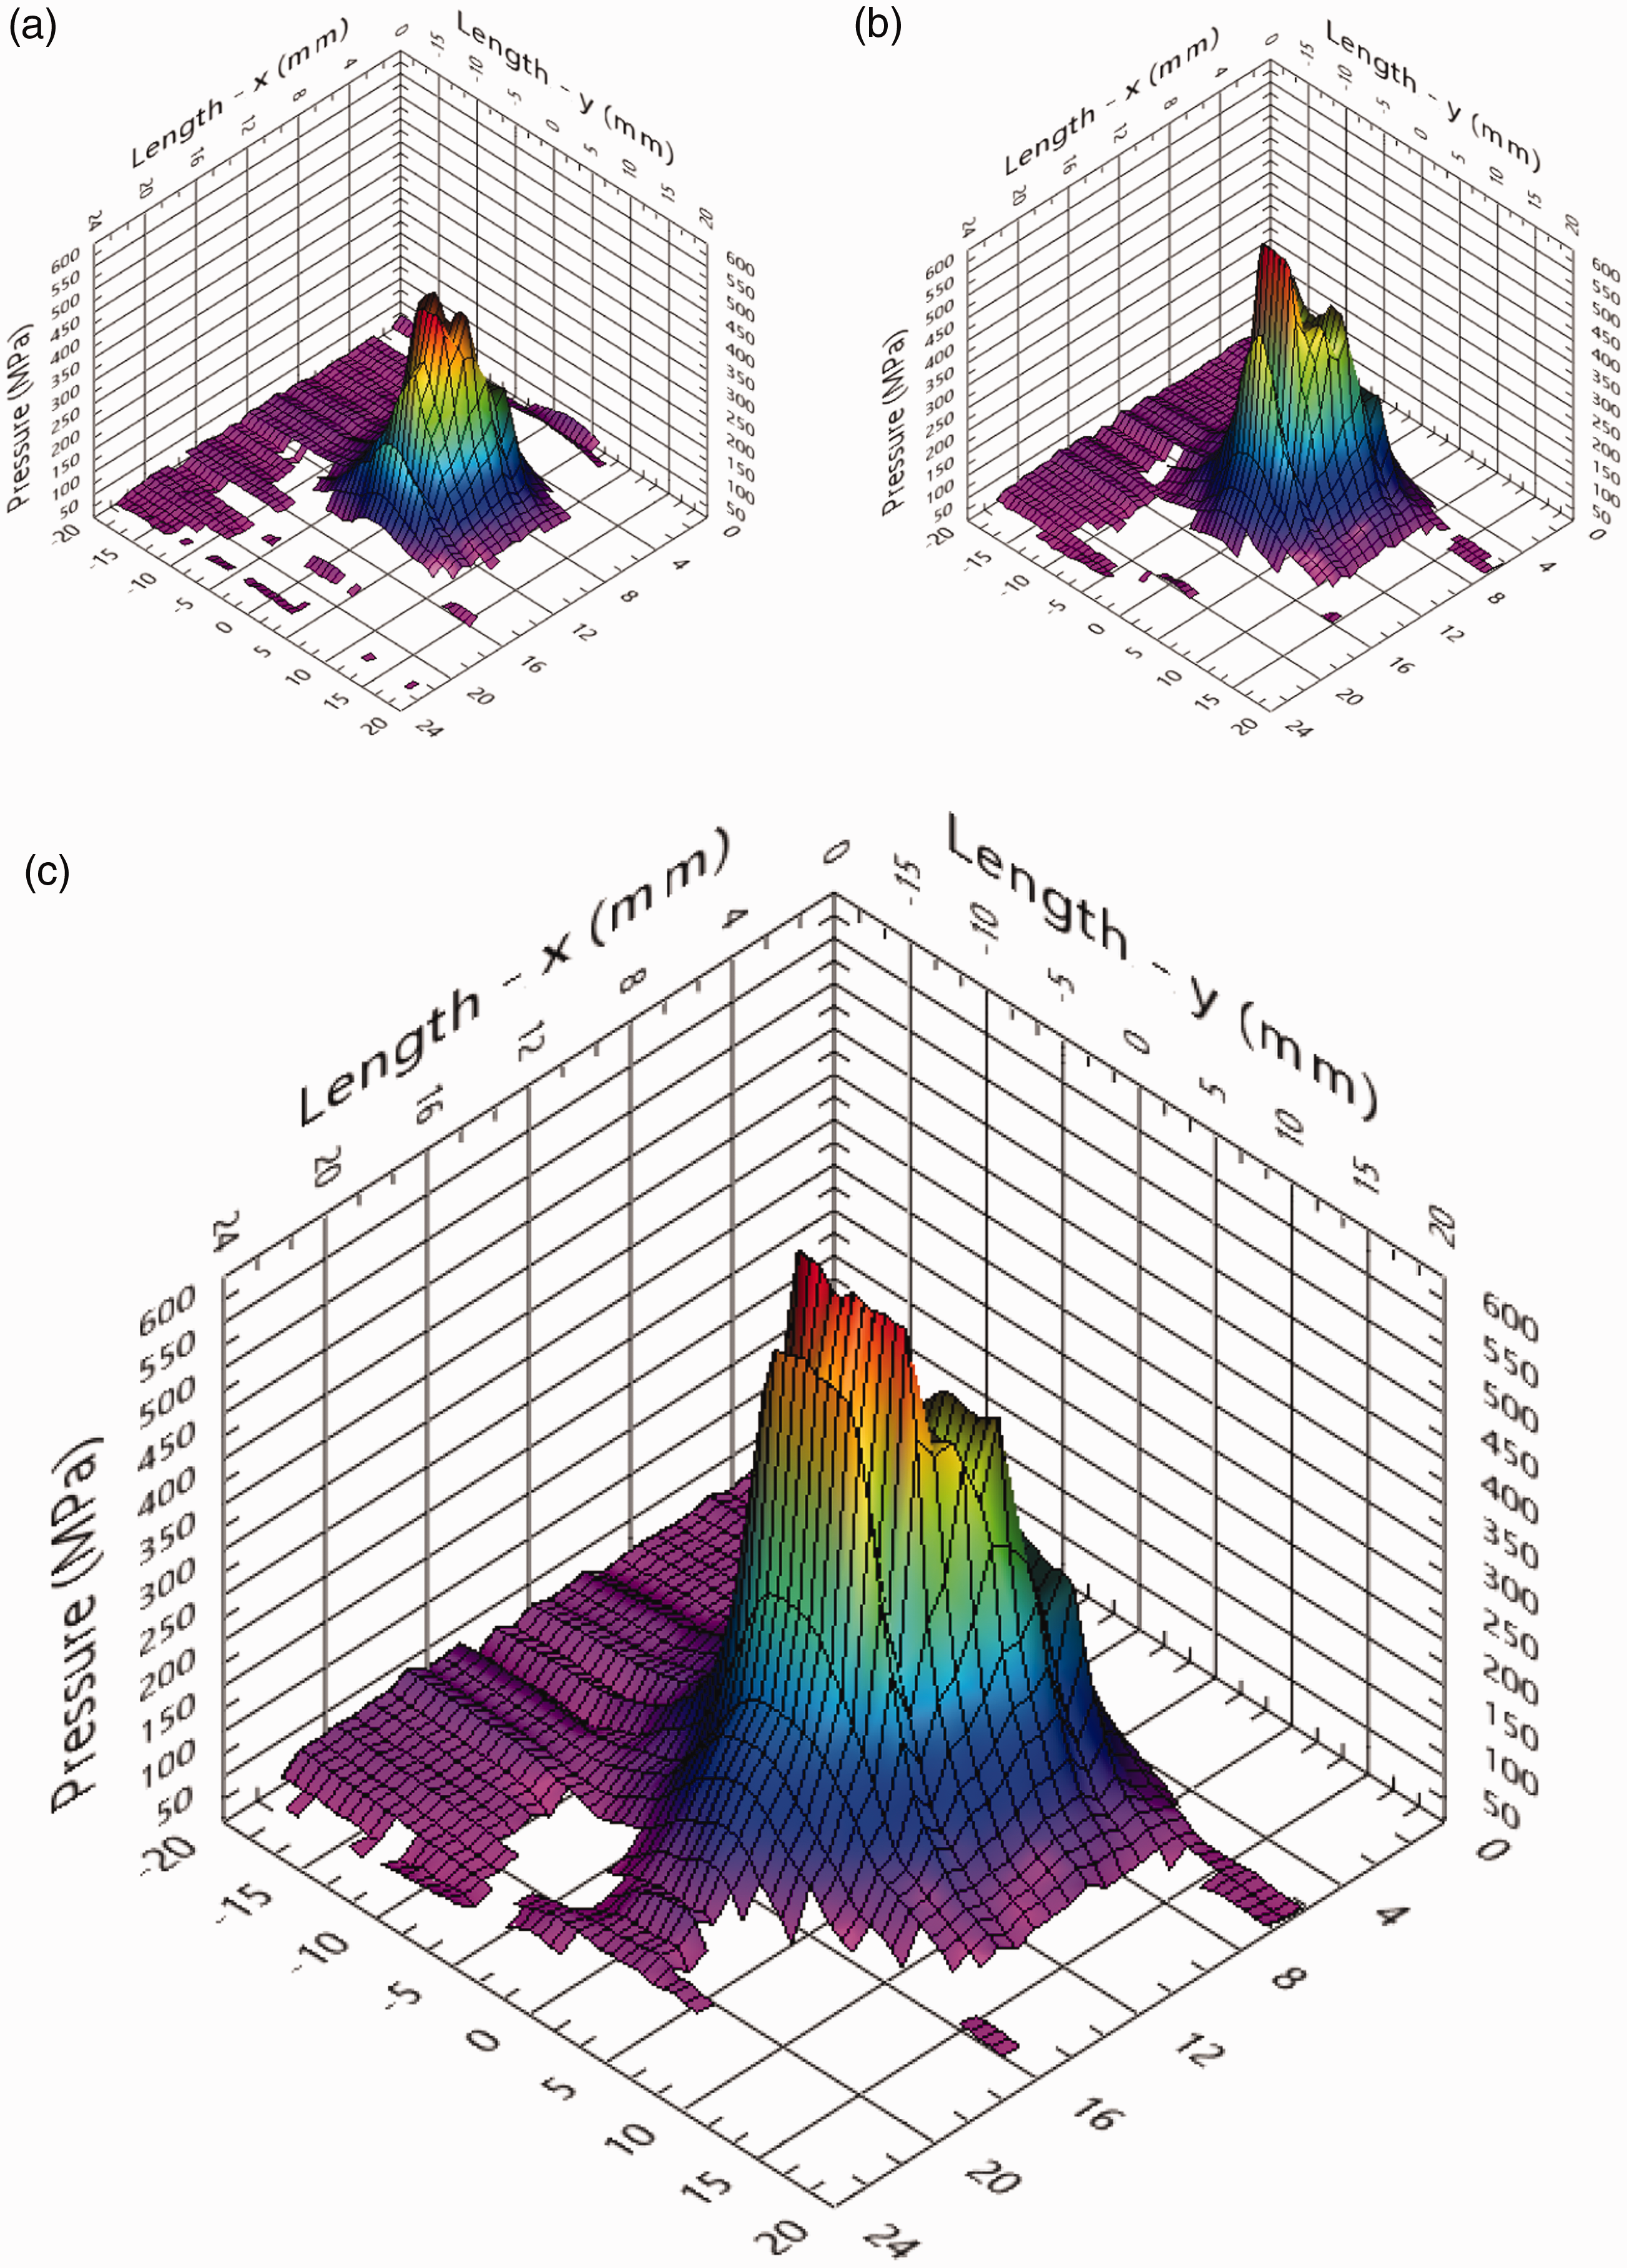
The figure shows increasing contact pressure with increasing load, and peak pressures of 400 to 600 MPa. The contact shape can be extracted from the data in Figure 12 by applying a threshold (here it was chosen as 50 MPa as minimal to no contact was seen outside of this level) and extracting a contour. Pressure contours for the three loading cases are show in Figure 13.
Contact pressure contours for normal loads of: (a) 40 kN; (b) 80 kN; (c) 120 kN.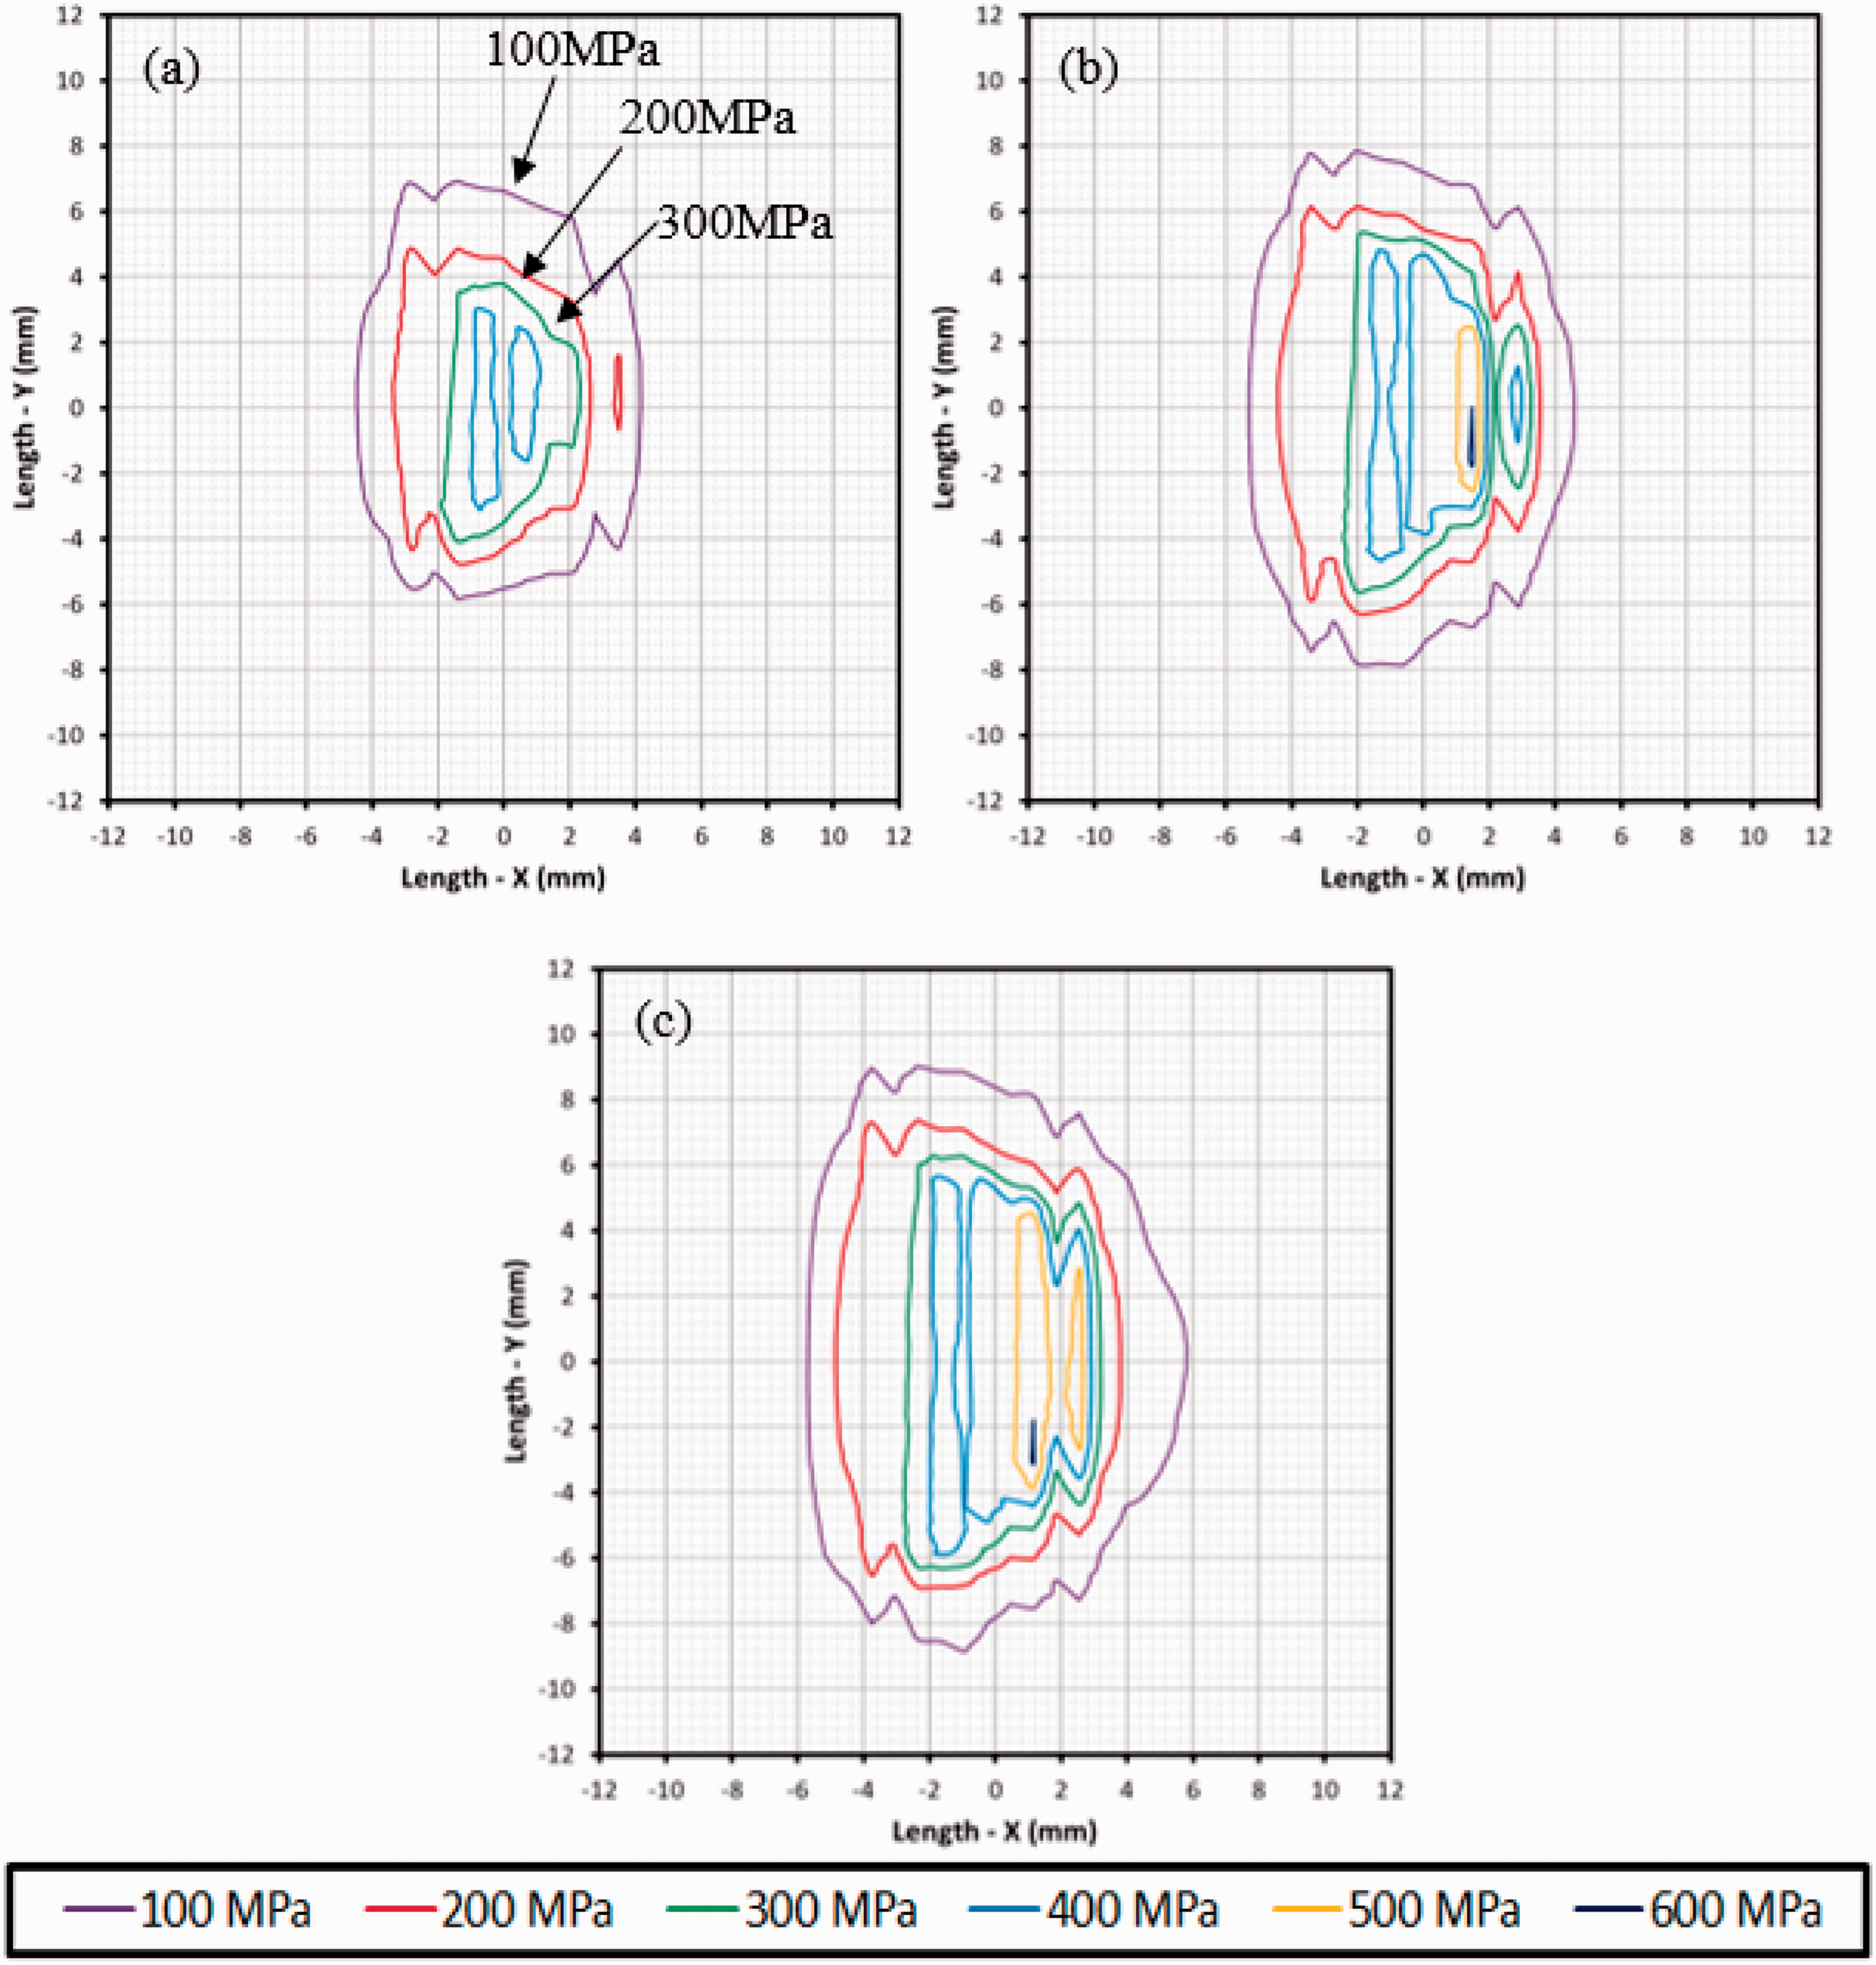
In addition to the ultrasonic measurements, high pressure-sensitive film was also used to measure the contact patch. The pressure-sensitive film was introduced into the contact and a wheel pass at each normal load was carried out. The film used had an activation pressure range of 130–300 MPa, and images of the contact shapes gained from this can be seen in Figure 14.
Contact area measurement using pressure-sensitive for normal loads of: (a) 40 kN; (b) 80 kN; (c) 120 kN.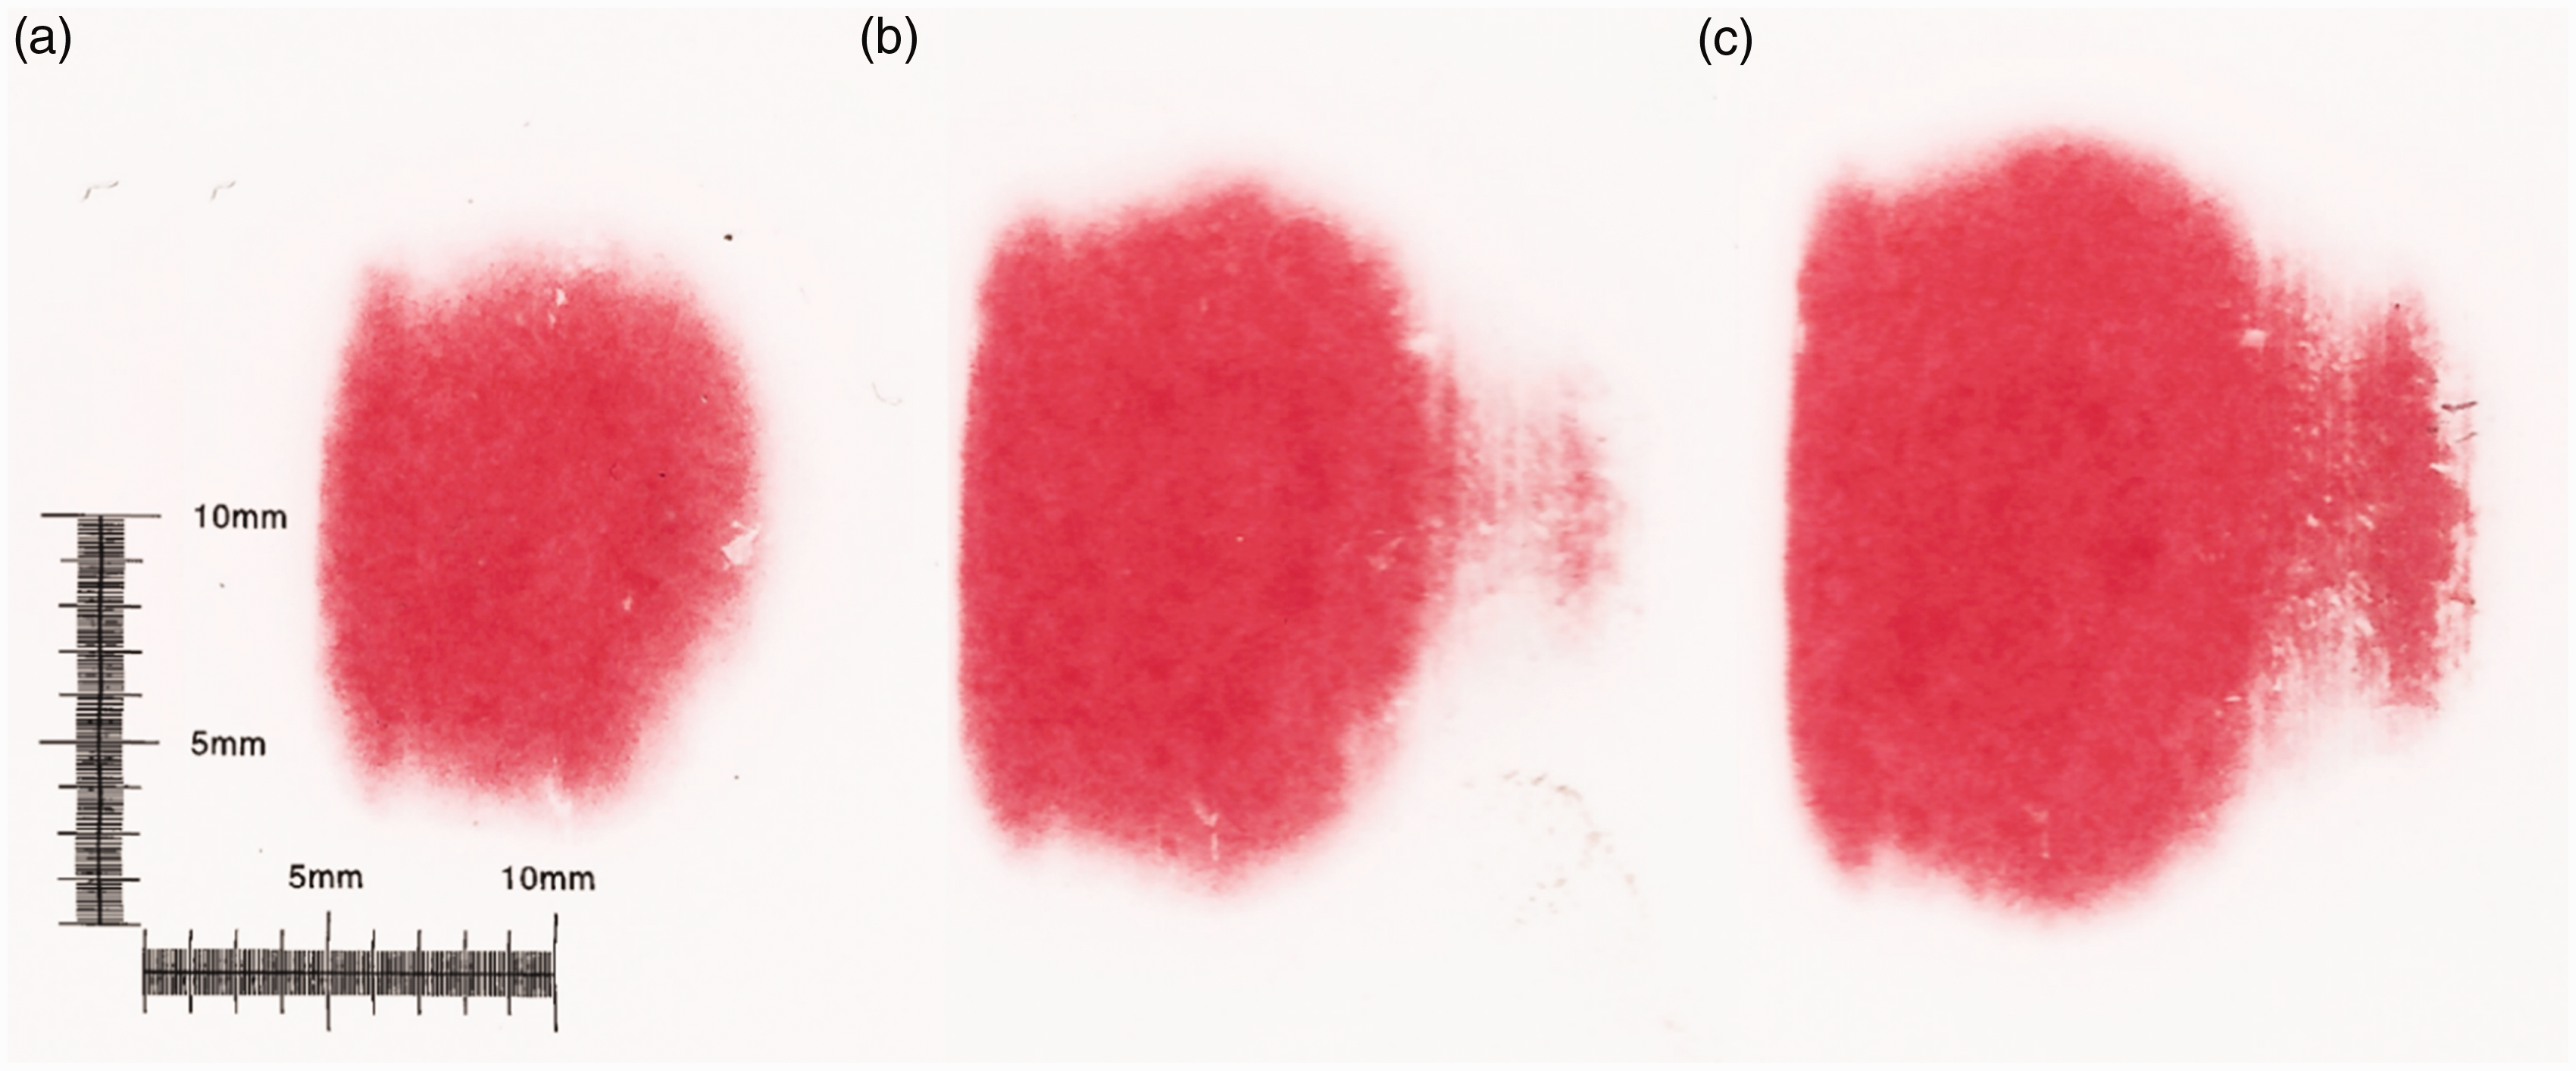
To allow comparison of the ultrasonic and pressure-sensitive film measurements pressure contours measured ultrasonically for the activation range of the film have been overplotted onto the film measurements in Figure 15. This shows very similar contact shapes gained using both methods. The pressure-sensitive film shows a slightly larger contact area than the equivalent ultrasonic methods. This occurs due to thickness of the pressure-sensitive film, this causes it to increase the contact area and slightly overestimate the contact patch.
Contact area measurement using pressure-sensitive film overlaid with ultrasonically measured 100, 200, and 300 MPa contours for normal loads of: (a) 40 kN; (b) 80 kN; (c) 120 kN.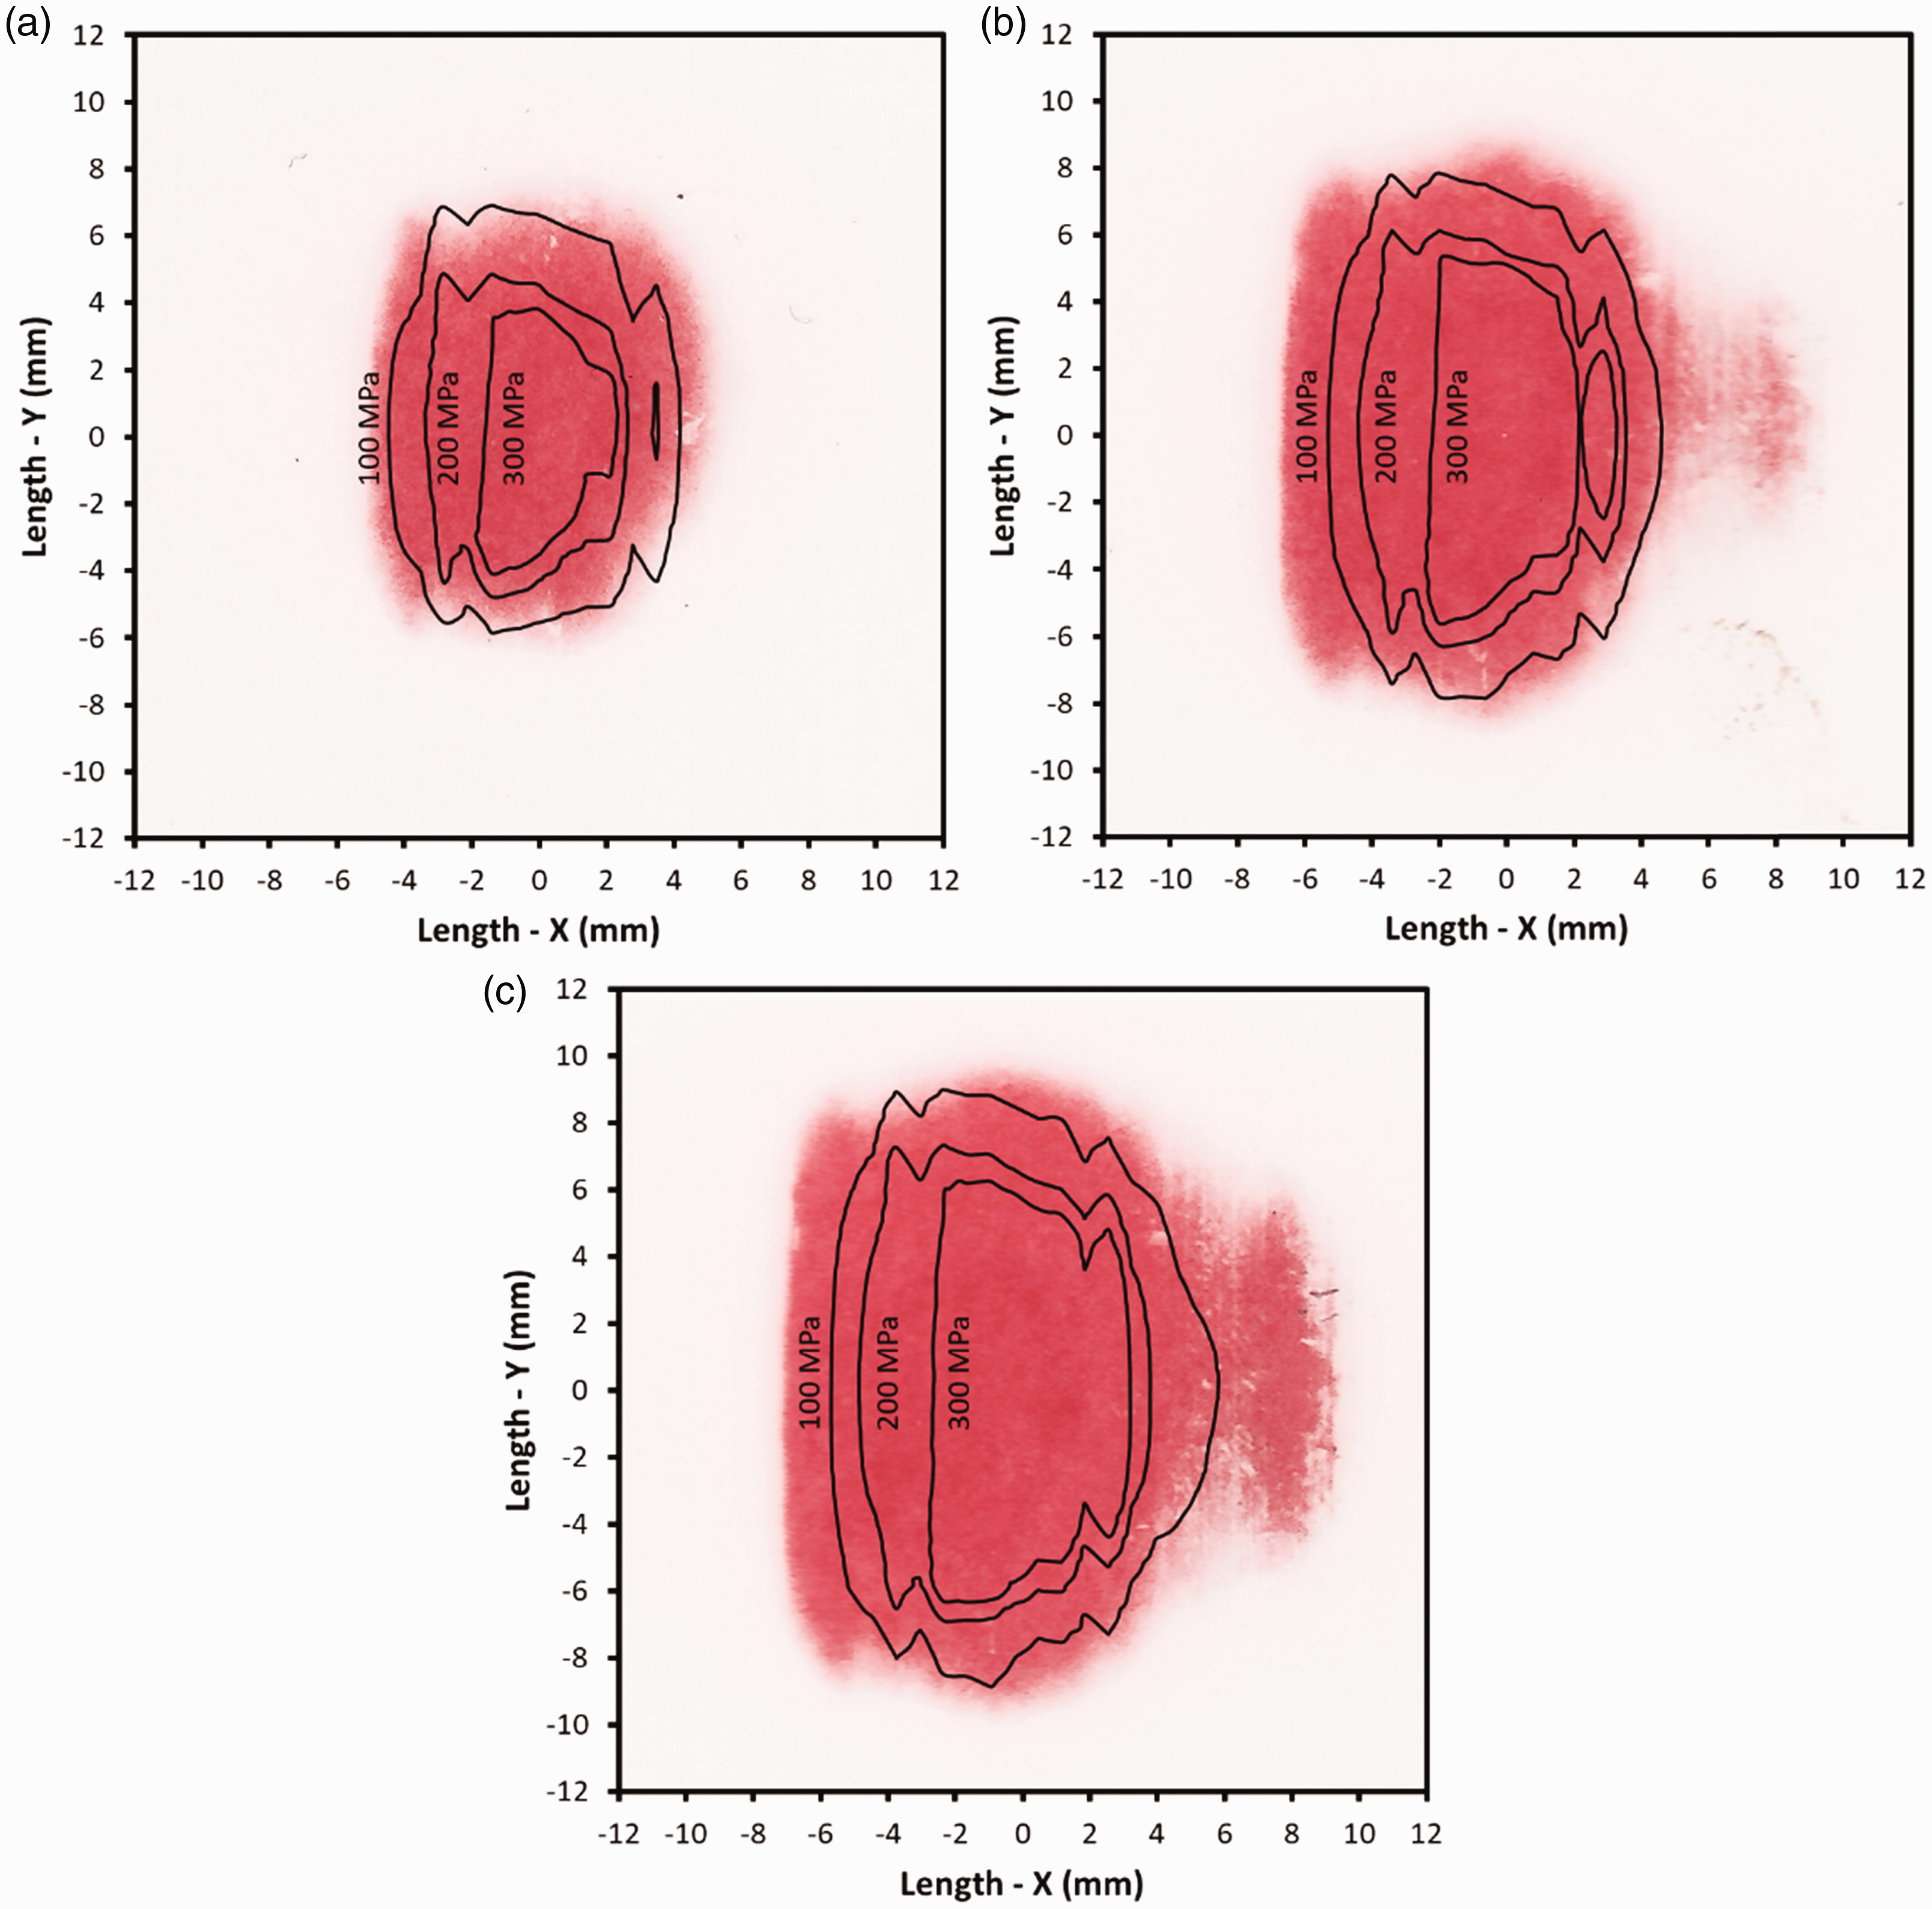
The ultrasonic measurements were found to be highly repeatable, as shown in Figure 16, which overplots the pressure contours gained for a threshold of 200 MPa for five repeat passes at loads of 40, 80, and 120 kN.
200 MPa pressure contours overplotted for five successive passes, at loads of 40 kN, 80 kN, and 120 kN.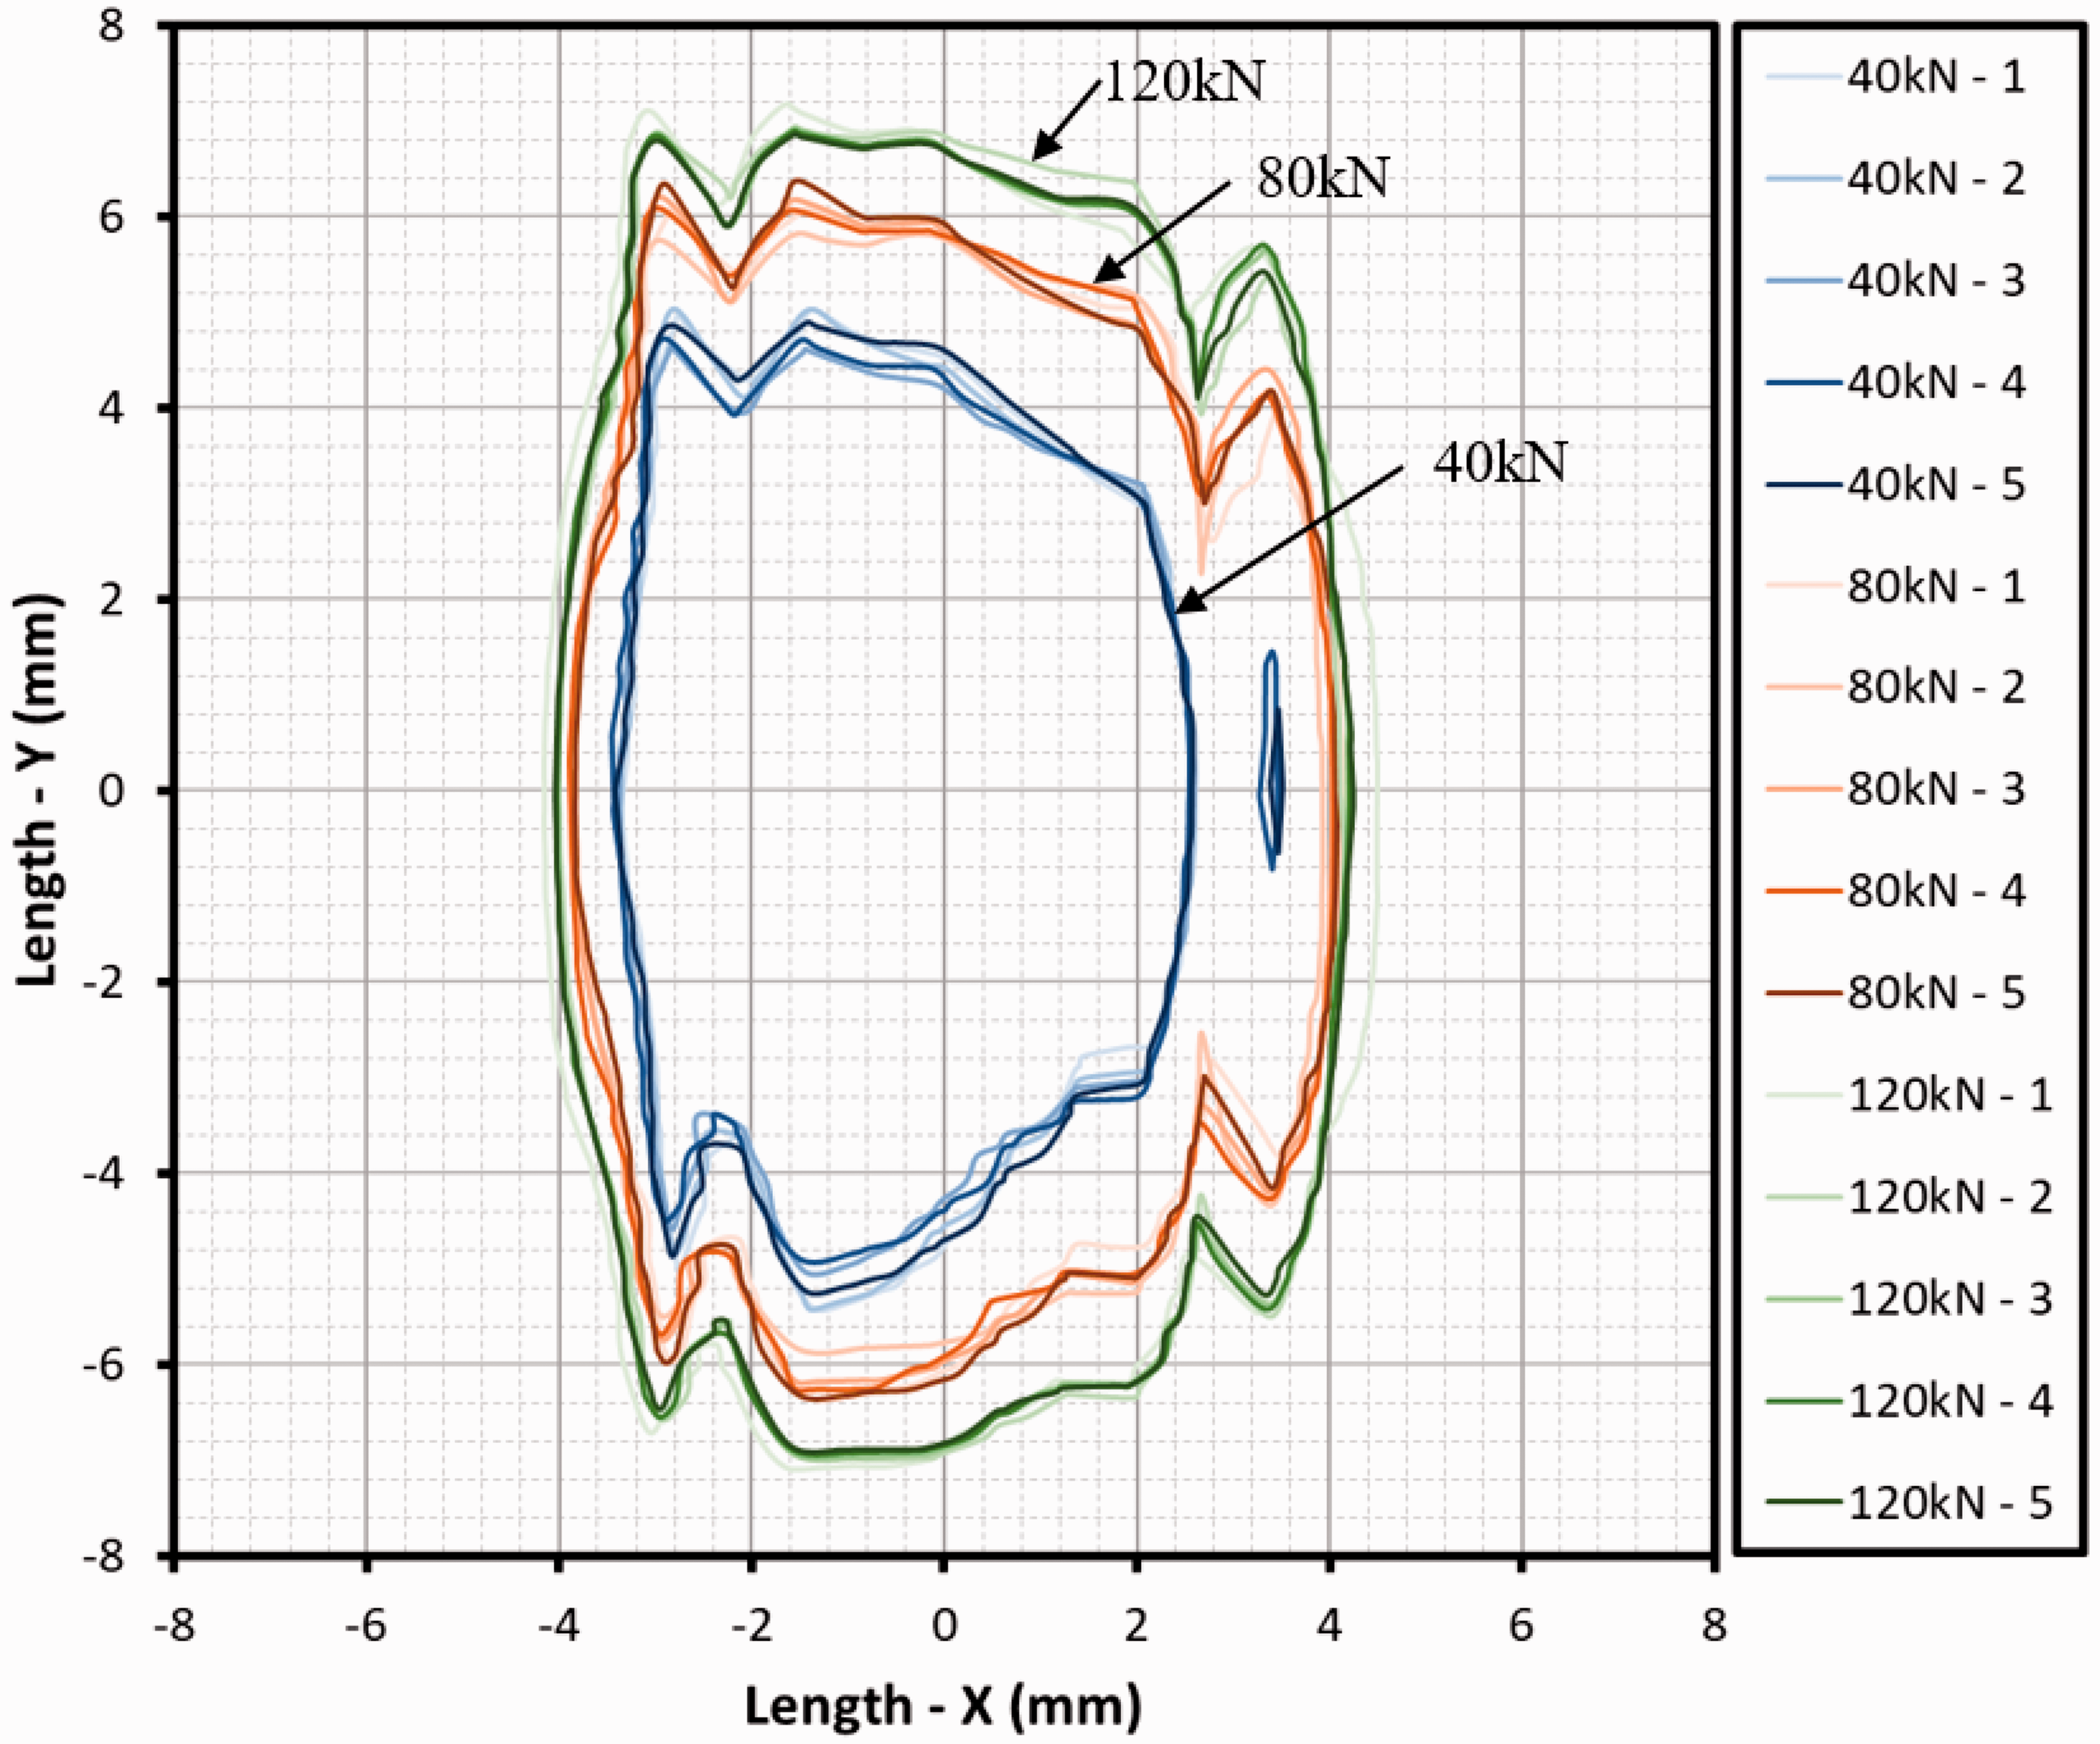
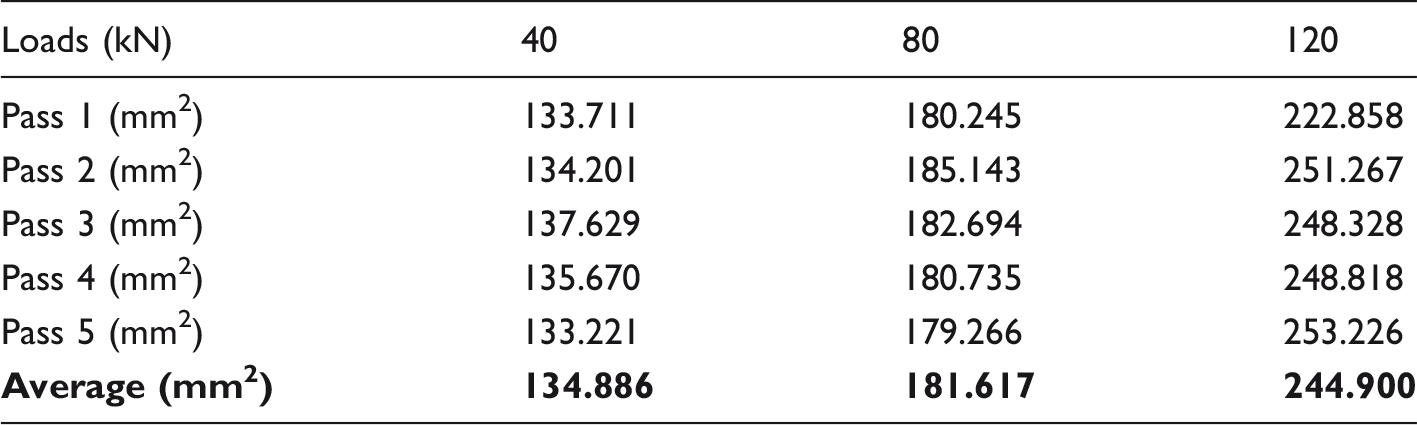
The contact areas from the ultrasonic measurement for five consecutive passes at 40 kN, 80 kN, and 120 kN using a 50 MPa threshold.
Discussion
The quasi-static investigation proved that the rail mounted array transducer is a feasible method to measure the wheel–rail contact. The width resolution of the contact pressure profile is dependent upon the width of the ultrasonic elements, which in this case is fixed at 0.7 mm. The length axis resolution is determined by the distance that the rail was moved under the wheel. The ultrasonic contact area measurements were in agreement with the pressure-sensitive film. The pressure-sensitive film used was not optimised for the pressure range and, therefore, it is not possible to extract pressure values, only areas. It is understood that the method of traversing the rail under the wheel is useful only for visualisation purposes and is not representative of a rolling wheel. The sensors were 7 mm long in the rolling plane, and this was accounted for in the contact area measurements by subtracting 6 mm from the centre of the final surface plots to reveal the true contact shape.
The measurement on the full-scale rig proved successful and dynamic wheel rail contact pressure profile measurements where achieved, albeit at low rolling speeds. The pressure-sensitive film will result in an overestimation of the contact area. This is due to the fact that the inherent thickness of the film will indicate contact when there would normally be a thin air gap at the contact edge. Furthermore, the film has a low friction coefficient, which could lead to partial sliding of the wheel as it came into contact with the rail. The pressure-sensitive film was not optimised for such high contact pressures and so therefore only contact area information could be extracted.
Cutting a hole in the rail section is not an ideal solution and would not be permitted in a live rail network. In order to utilise this technology in the field, a less invasive approach would be required. It would be possible to mount array sensors on the underside of the rail head and operate in through-transmission mode. This is where one set of sensors is used to generate the pressure waves and a second set is used to receive the waves. Such a configuration would be completely non-destructive, retro-fittable and would achieve a similar result, albeit at low resolution. The next stage of work will be to develop this non-destructive concept to enable low-cost retro-fittable contact measurement systems that can be used throughout the rail network.
To perform measurements on the rail network, the ultrasonic hardware would have to be capable of pulsing at high enough speed to accurately characterise the contact patch as the wheel passes the sensor. Figure 17 shows the number of ultrasonic line measurements that can be obtained as the wheel rolls over the rail as a function of train speed for various PRFs for a representative sized contact. This information informs the relationship between the ultrasonic PRF and the speed of the railroad vehicle to allow understanding of the achievable resolution for different ultrasonic systems for different operating conditions.
A graph showing the number of measuremens as the rail vehicle passes over the array transducer as a function of pulse repatition frequency.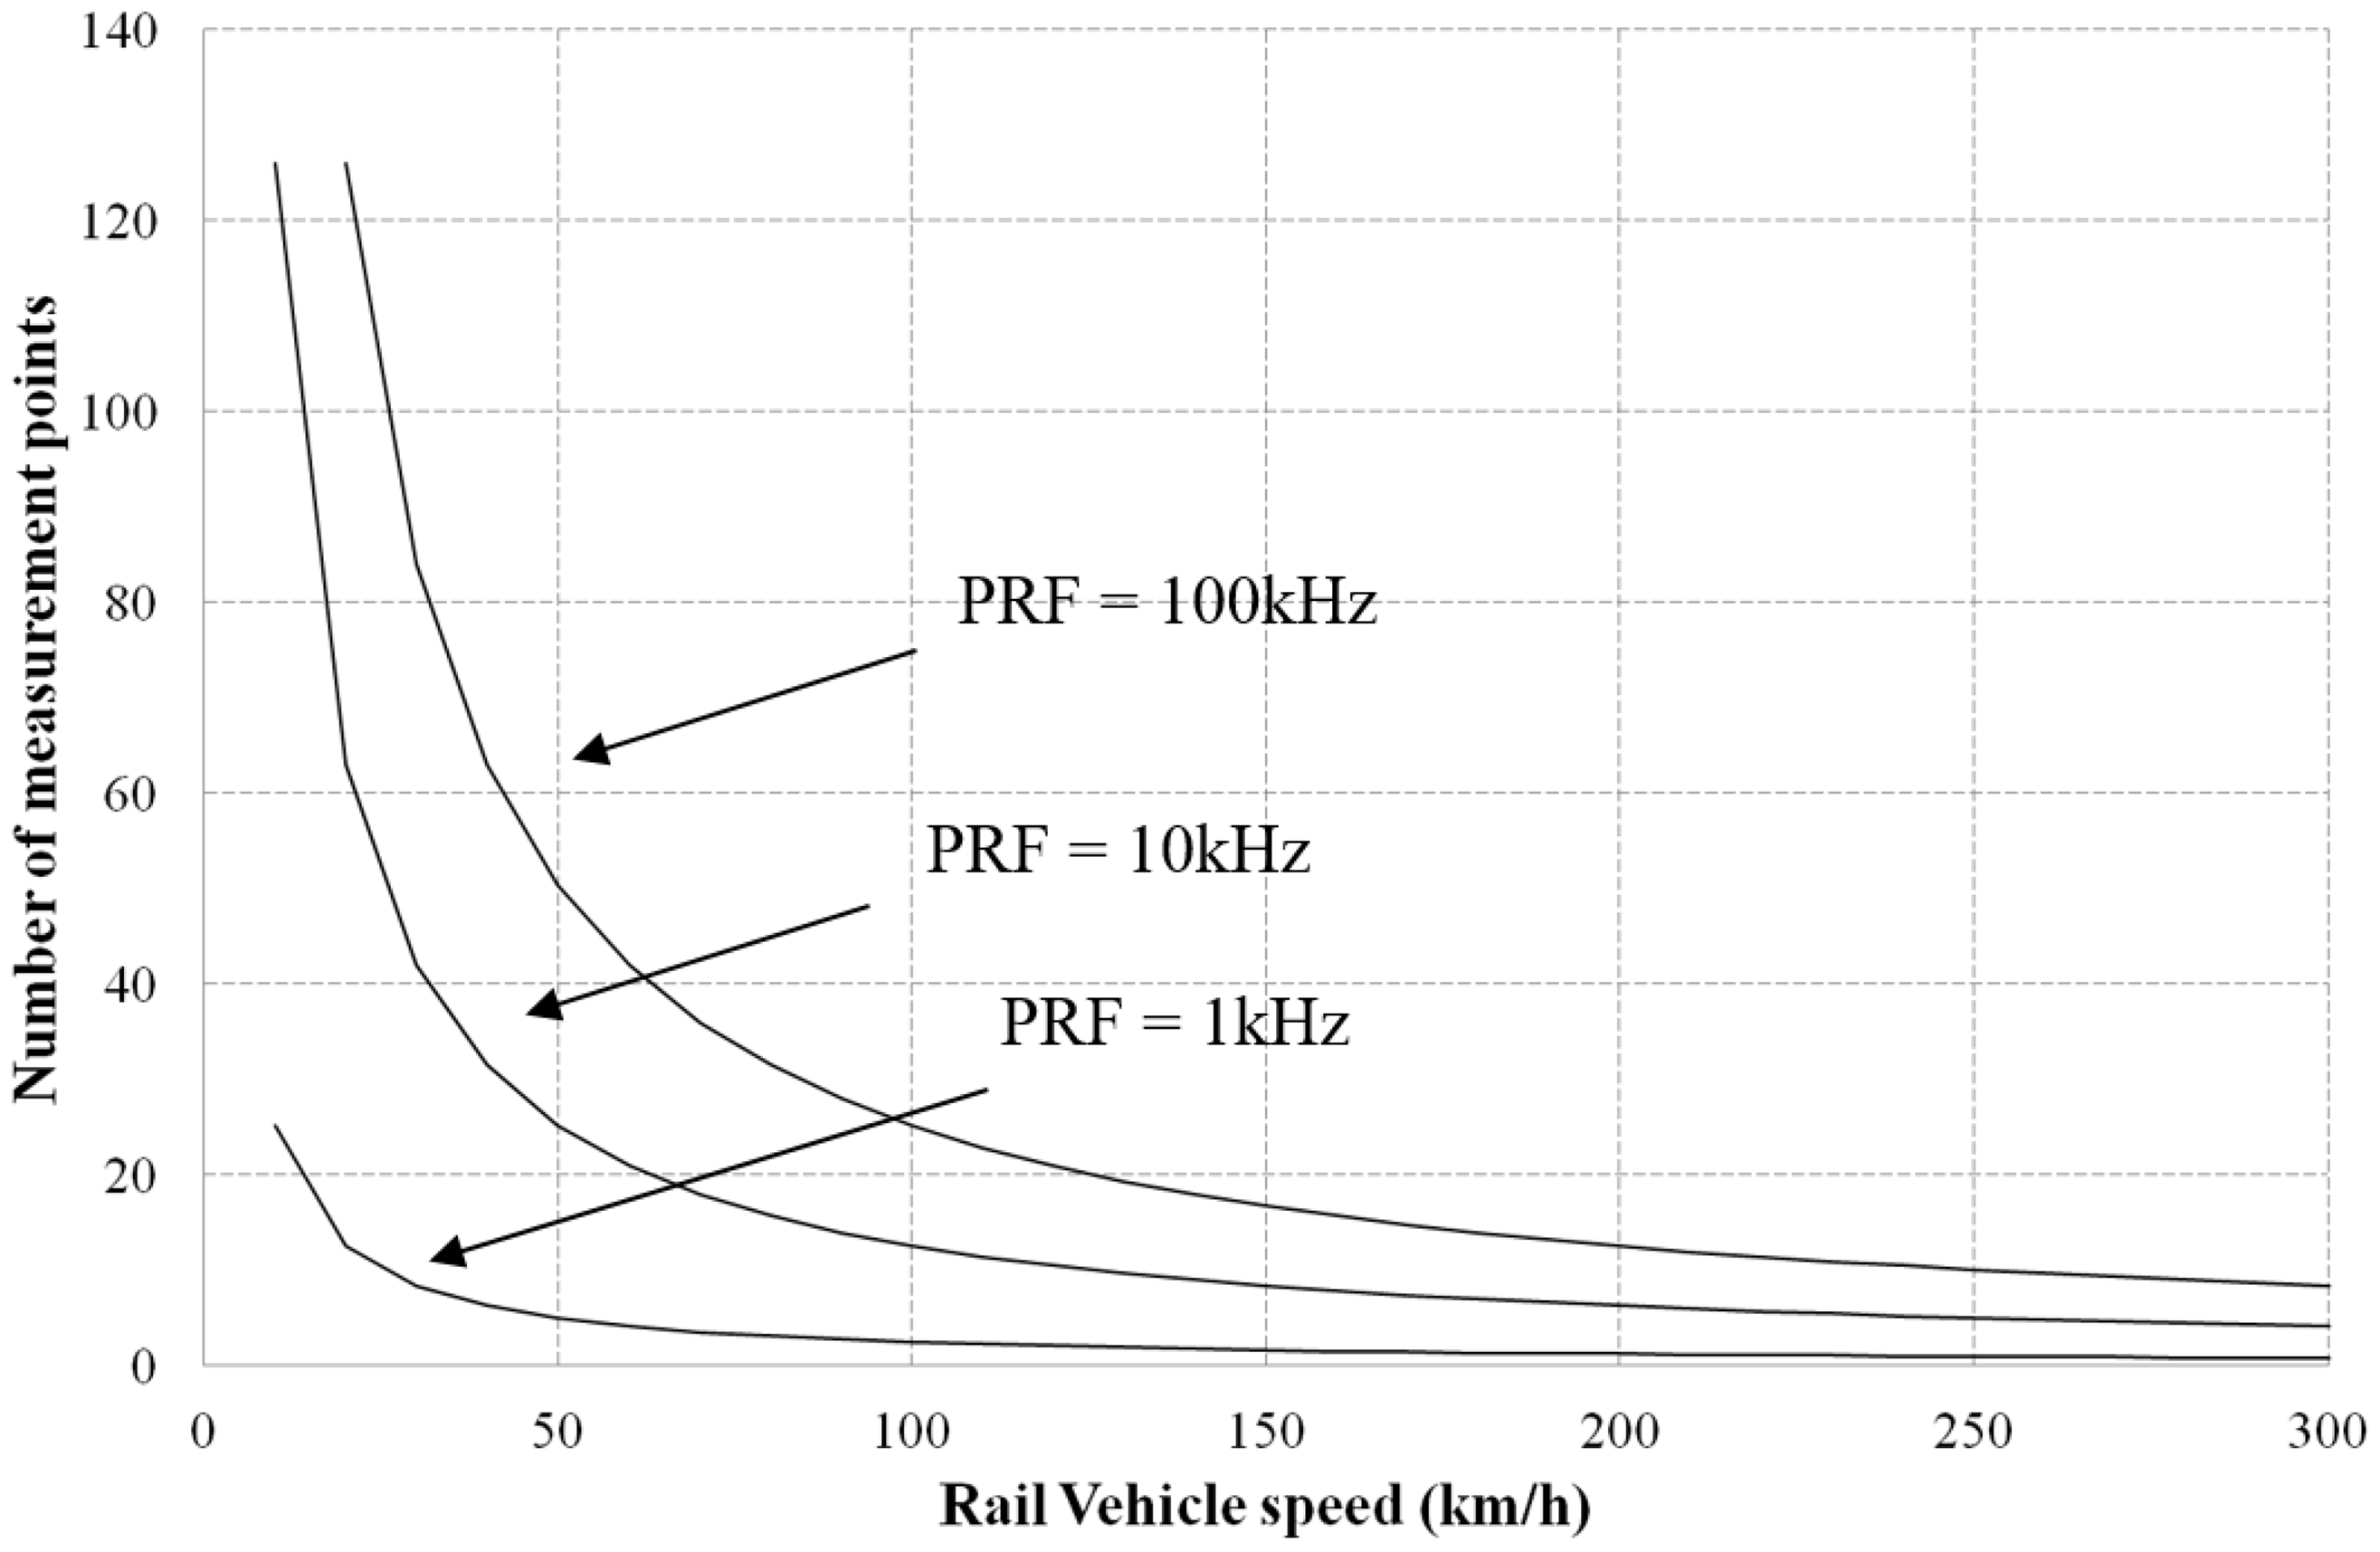
Conclusions
Ultrasonic reflectometry has previously been proven to hold much potential for the measurement of wheel–rail contact conditions. The scanning method yields high resolution data, but is very limited to laboratory investigations. A method has been introduced to allow the measurement to be performed in a full-scale dynamic wheel–rail arrangement. An initial quasi-static measurement was carried out to validate the concept and this yielded a contact pressure map similar to measurements with pressure-sensitive film.
A full-size dynamic wheel–rail rig was employed to create a loaded rolling wheel–rail interface. A rail mounted ultrasonic sensor was successfully used to measure the dynamic contact pressure profile evolution. Obvious changes in contact area and contact pressure are observed with increasing loads.
The concept currently requires the removal of a section of the rail, which would not be an acceptable solution to use in the field. A possible solution to this issue has been discussed with a through-transmission sensor configuration. This would allow truly non-destructive measurement of the wheel–rail interface. Hardware requirements for real-time measurement on the rail network have been determined.
Footnotes
Declaration of Conflicting Interests
The author(s) declared no potential conflicts of interest with respect to the research, authorship, and/or publication of this article.
Funding
The author(s) received no financial support for the research, authorship, and/or publication of this article.