
Abstract
Transmission efficiency is the main objective in the development of vehicular differential systems, comprising hypoid gear pairs. The overall aim is to contribute to improved vehicle fuel efficiency and thus levels of harmful emissions for modern desired eco-drive axles. Detailed predictive analysis plays an important role in this quest, particularly under realistic operating conditions, comprising high contact loads and shear rates. Under these conditions, the hypoid gear pairs are subject to mixed non-Newtonian thermo-elastohydrodynamic conditions, which is the approach undertaken in this paper. Such an approach for hypoid gear pair has not hitherto been reported in the literature.
Keywords
Introduction
The key objectives in modern vehicle development are fuel efficiency and reduced emissions. The former has been the cornerstone of the lightweight powertrain in addition to improved combustion and transmission efficiency. These have led to vehicles of higher power-to-weight ratio, but at the expense of a plethora of noise and vibration concerns, generally referred to as NVH (noise, vibration and harshness). 1 Therefore, the drive for fuel-efficient lightweight powertrains has resulted in some major NVH concerns, for instance driveline clonk1–4 and transmission rattle.1,5–7 With the lightweight concept remaining the over-riding objective and increased power a desired customer attribute, the excess energy leading to impulsive action needs to be somehow palliated. Under these circumstances, friction remains an important energy sink, which in turn would adversely affect the system efficiency. Therefore, the fundamental understanding of regimes of lubrication in powertrain conjunctions under realistic operating conditions assumes an important role. This is regarded as the prerequisite in powertrain optimisation, taking into account both fuel efficiency and NVH refinement.
Some friction is essential for effective traction, transmitting the engine power to the driven wheels, whilst at the same time consuming some of the excess vibration energy, causing NVH response. 8 Reduced friction often leads to repetitive impacts of gear teeth pairs or contact separation, thus loss of traction.9,10 Lubricant is subjected to changes in the regime of lubrication as shown by De la Cruz et al. 11
In automotive transmissions and differential gearing, thin films promote mixed thermo-elastohydrodynamic regime of lubrication. Therefore, friction is generated as the result of viscous shear of lubricant as well as counterface asperity interactions. In transmission systems, lubricant shear may be assumed to be Newtonian, except for the thin adsorbed films at the summits of asperities. 11 However, for highly loaded contacts of hypoid gears, a non-Newtonian regime of lubrication is prevalent. Hence, a constant coefficient of friction cannot be assumed as in some reported cases,12,13 nor the use of empirical formulae.14–17 Another approach is proposed by He et al., 18 Velex et al.19,20 and Kar and Mohanty, 21 describing friction as a function of the length of the line of contact for the meshing of spur or helical gear teeth pairs.
It is more accurate to represent the meshing of gear problem as lubricated conjunctions as highlighted by De la Cruz et al. 11 for the case of helical gears. An analytical approach is highlighted by Karagiannis et al., 22 using the Grubin’s extrapolated oil film thickness equation as a function of contact load and sliding velocity. 23 In Karagiannis et al., 22 thin thermo-elastohydrodynamic films under non-Newtonian shear promoted asperity friction. De la Cruz et al. 11 showed that predicted film thickness, using the Grubin’s equation can be as much as 50% larger than that under the same operating condition when a numerical elastohydrodynamic analysis is used. Therefore, ideally a numerical analysis for hypoid gear pairs should be undertaken.
For helical gears, the contact footprint shape is elliptical with a large aspect ratio. Thus, line contact geometry is often assumed. 24 For the case of hypoid gear pairs, an elliptical contact footprint with angled lubricant entrainment into the contact results. This is demonstrated by Mohammadpour et al.25,26 who provided isothermal elastohydrodynamic solutions for hypoid gear teeth pairs throughout a meshing cycle both under assumed Newtonian and non-Newtonian lubricant behaviour.
Contact friction results in generated heat, which among other issues affects the lubricant viscosity, and hence the load-carrying capacity and friction. Crook 27 was the first to present a detailed method for determination of generated heat and its removal in line contacts. In particular, he predicted a fall in traction as the slide–roll ratio increases. Subsequently, Cheng and Sternlicht 28 and Dowson and Whitaker 29 introduced numerical procedures for the coupled solution of Reynolds, elasticity and energy equations for line contacts.
Kim and Sadeghi30,31 were among the first to present a full numerical solution for thermal elastohydrodynamic lubrication (TEHL) of point contacts for pure rolling under low-slip conditions. Yang et al. 32 studied the general transient TEHL problem, including the first full numerical solution of the energy equation using finite differences. However, the inlet flow entrainment was assumed to be either along the minor or the major axis of the elliptical contact footprint. Their results showed the insignificant influence of rising temperature on the lubricant film thickness, but a noteworthy effect upon coefficients of traction and friction. This work was extended to the non-Newtonian investigation by Yang et al. 33 None of these contributions took into account the angled inlet flow which gives rise to side leakage of the lubricant from the contact, thus affecting the heat balance. Such conditions are prevalent in the case of hypoid gears, which is the subject of the current study. Sharif et al. 34 presented a thermal non-Newtonian model to obtain film thickness and traction in a variable traction drive rig. The model was presented for circular point contacts only. Habchi et al. 35 also presented a non-Newtonian thermal model for circular point contacts. The model did not take into account the effect of asperity interactions. The same approach was also used by Paouris et al. 36 for circular point contact of a sphere against a very smooth disc using a mini-traction machine (MTM). Inlet lubricant starvation and shear heating were included in the model, which agreed well with the experimental measurements of generated friction.
For hypoid gears, Kolivand et al. 37 provided an equation for friction of mixed elastohydrodynamic with non-Newtonian lubricant shear. However, a line contact geometry was assumed. Simon 38 presented a thermo-elastohydrodynamic analysis of hypoid gear pairs with elliptical point contact geometry, but with the entrainment flow vector was along the minor axis of the contact ellipse. Furthermore, a low applied input torque, not representative of vehicular differentials, was used. As already noted, the entrainment flow into the contact occurs at an angle to the minor axis of the contact ellipse. This is shown by Gohar 39 through optical interferometry with significant side leakage flow at an angle to the major axis of the contact ellipse. 40 Pu et al. 41 further developed the work of Mohammadpour et al. 26 by adding an empirical flash temperature model to the analysis. Their analytical thermal model is a control volume-type model for the average temperature of the lubricant and those of the contacting surfaces. Clearly, the temperature of the lubricant alters in the contact at any point into its depth, in the direction of sliding as well as in the side leakage direction. Therefore, a more realistic model is required, using the solution of energy equation, leading to accurate estimation of lubricant viscosity and determination of film thickness. Furthermore, Pu et al. 41 assume a constant coefficient of friction within the contact area, which also varies from point-to-point in the contact. Therefore, an integrated analysis using Reynolds and energy equation and heat transfer from the solid surfaces is essential, which is the approach of the current paper.
This paper extends the non-Newtonian mixed elastohydrodynamic analysis of hypoid gears in a vehicular differential system at realistic high loads through a combined solution of Reynolds, elasticity and energy equations. It also takes into account the inlet starvation effect as well as angled lubricant flow into the contact. Furthermore, tooth contact analysis (TCA) 42 is used to determine the contact footprint geometry during the meshing cycle of pinion and ring gear as well as surface velocities of the contiguous solids. This approach has not hitherto been reported in literature.
The hypoid gear pair model
The hypoid gears’ model comprises simultaneous contacts of a number of teeth pairs. For the automotive differential investigated, 2–3 pairs of teeth are in simultaneous mesh. Therefore, it is necessary to calculate contact geometry, kinematics and load share for each meshing pair through tooth contact analysis (TCA). 42 A full description of the approach is provided in Mohammadpour et al. 25
The meshing teeth pairs are subject to mixed-elastohydrodynamic regime of lubrication and subjected to quite high loads, and the lubricant undergoes non-Newtonian shear. Therefore, a suitable non-Newtonian model for lubricant shear behaviour should be used, as well as a suitable form of Reynolds equation.
The non-Newtonian elastohydrodynamic conjunction
Conry et al.
43
developed the Reynolds–Eyring equation, based on Johnson and Tevaarwerk’s shear model,
44
neglecting lubricant elastic shear for large strain rates (i.e. Representation of an elliptical point contact conjunction with angled entrainment flow.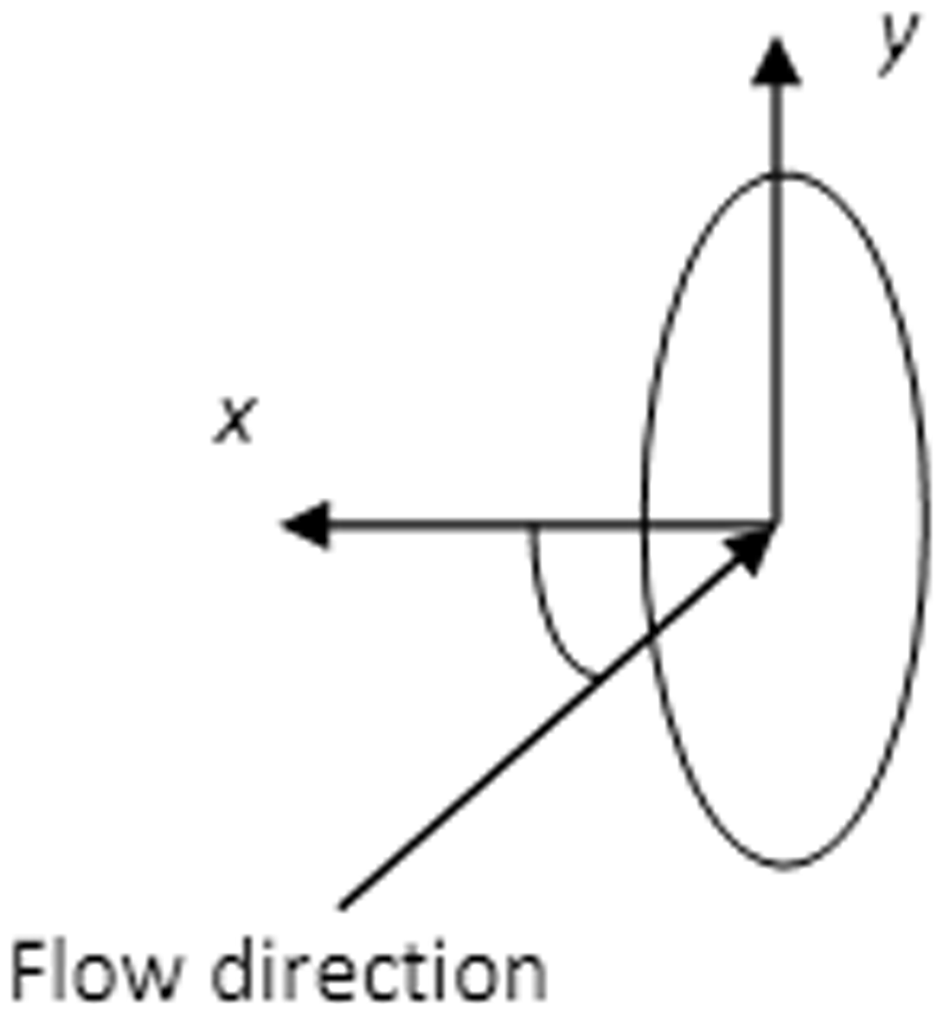
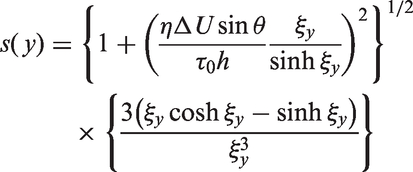
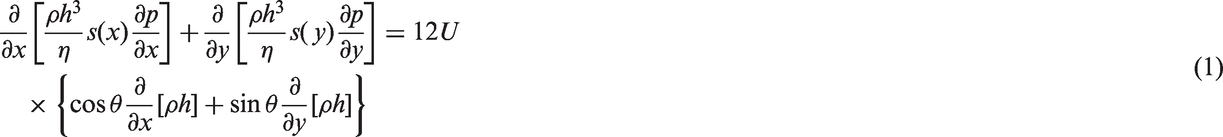
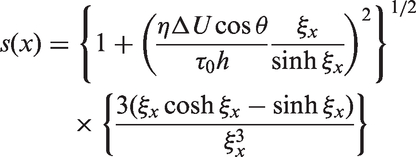
Extending the approach of Conry et al.
43
to the case of elliptical point contacts of a hypoid gear teeth pair yields


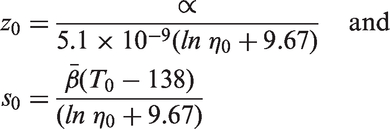
And η is the average viscosity in the direction of the film thickness updated by pressure and temperature iteratively
46

The above viscosity relationships do not adequately deal with high pressure high shear lubricant characteristics. Recent rheological models are more suited for this purpose as highlighted by Habchi et al. 35 and Paouris et al. 36 However, the focus of this paper is on mixed non-Newtonian conditions.
Lubricant density variation with pressure and temperature is given as
47
The speed of entraining motion of the lubricant U and the relative sliding velocity of the surfaces are obtained through TCA 42
The limiting shear stress is

The combined non-Newtonian shear model is used, where shear stress is continually monitored during the meshing cycle of any pair of teeth and at any computation point in the conjunction, using equation (9). If its value exceeds that obtained from equation (8), then it is replaced by the limiting shear stress at the pressure at any given computation point

It should be noted that the pressure at any grid is assumed to represent the behaviour on the grid area. Equation (9) is the rheological model for the lubricant when the shear stress reaches its limiting value locally according to Johnson and Tevaarwerk’s shear model 44
The elastic film shape is given as

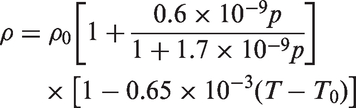
Equivalent contact geometry of the equivalent ellipsoidal solid.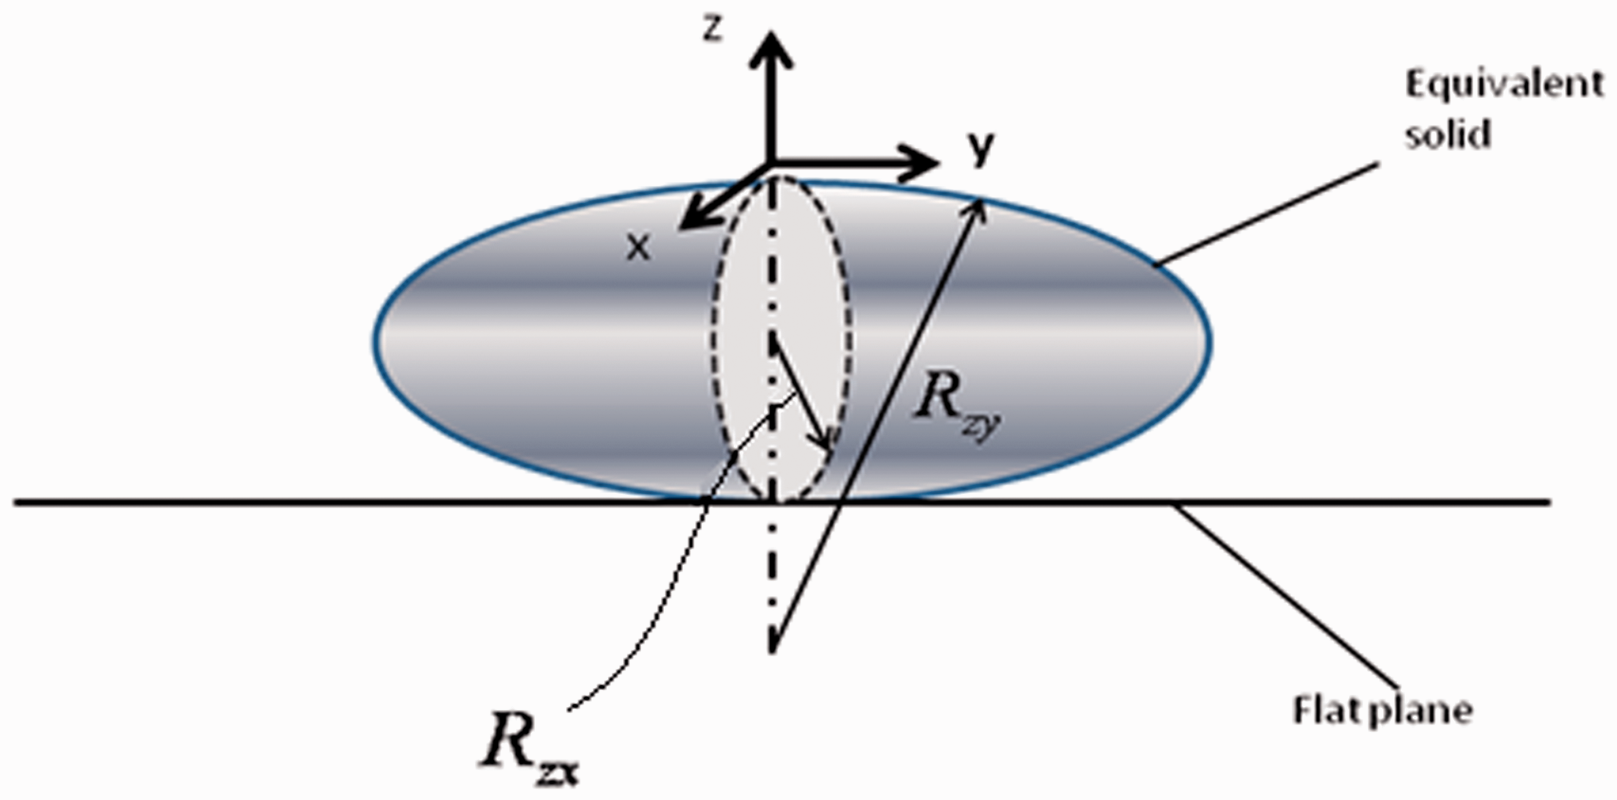

The instantaneous radii of pinion and gear teeth are determined through TCA 42
The localised contact deflection

Boundary and initial conditions for Reynolds equation
Commonly, a fully flooded inlet is assumed in most numerical analysis of EHL problems. In order to ensure this, the following conditions are set:

The inlet condition is established as
The initial estimation of the central contact oil film thickness is due to Grubin
23
with the inclusion of a side-leakage correction factor
53
The contact load is

The inlet boundaries given by xi and yi are set, using Hamrock and Dowson’s inlet boundary location.
52
The outlet boundary conditions used are those of Swift
54
and Stieber
55
:
Thermo-elastohydrodynamics
The thermal elastohydrodynamic analysis comprises simultaneous solution of Reynolds (see The non-Newtonian elastohydrodynamic conjunction section) and the energy equations.
The energy equation for the lubricant film, neglecting heat conduction in the x- and y-directions due to the thinness of the lubricant film and convection in the z-direction (no convection by the lubricant film into the adjacent solid boundaries) becomes
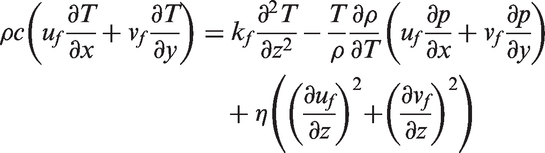
The velocities and velocity gradients in the fluid film are given as


These velocity distributions are based on the Newtonian flow assumption. This assumption somewhat simplifies the problem and can be justified by the presented results in Figure 12. The figure shows that severe thermal thinning forces acting on the lubricant closely follow Newtonian shear. Velocity distributions, based on Newtonian and non-Newtonian assumptions, are shown in the Results and discussion section. The viscosity used in equations (16) to (20) is the average viscosity in the direction of film thickness, updated by the pressure and temperature iteratively. It is obtained from equation (6). It is noteworthy that effective viscosity is given by equations (16) to (20) if its local value reaches the limiting shear stress.
The boundary condition for the lubricant at the inlet conjunction is assumed to be that of the bulk sump temperature as

The contacting solids are simplified in the form of an ellipsoidal solid and a semi-infinite plane. The energy equations for these conjunctional solid boundaries are

The index s denotes the ellipsoidal solid with the surface speed of the pinion tooth. Similarly, index p denotes the semi-infinite plane which is considered to be moved by the gear surface velocity. The boundary conditions for equation (27) are

The first boundary condition (I) assumes a constant bulk housing temperature of the lubricant. This assumption is based on a thermal balance having been reached for the differential unit. The remaining boundary conditions II and III assume temperature penetration depths of d and –d into the solid boundaries. These are finite depths, sufficiently large to constitute a zero temperature gradient into the solid boundaries. The value of d in the current analysis is taken as three times the Hertzian contact semi-half-width in the direction of entraining motion.32,33
The thermal conductivity and heat capacity of the lubricant has been assumed to be constant. In reality, both of these quantities change with the pressure and temperature. The effect of these properties on the film thickness and friction of a circular point contact is presented by Habchi et al. 56 They showed that the variable thermal conductivity and heat capacity could change the friction as the main tribological quantity up to 8%.
To satisfy the continuity of heat flux between the solid surfaces and the lubricant film, the following interfacial boundary conditions should be satisfied
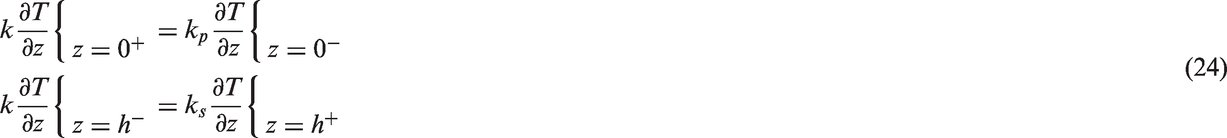
Figure 3 shows the thermal boundary conditions and the employed coordinate system.
Boundary conditions and the coordinate system used in the thermal model.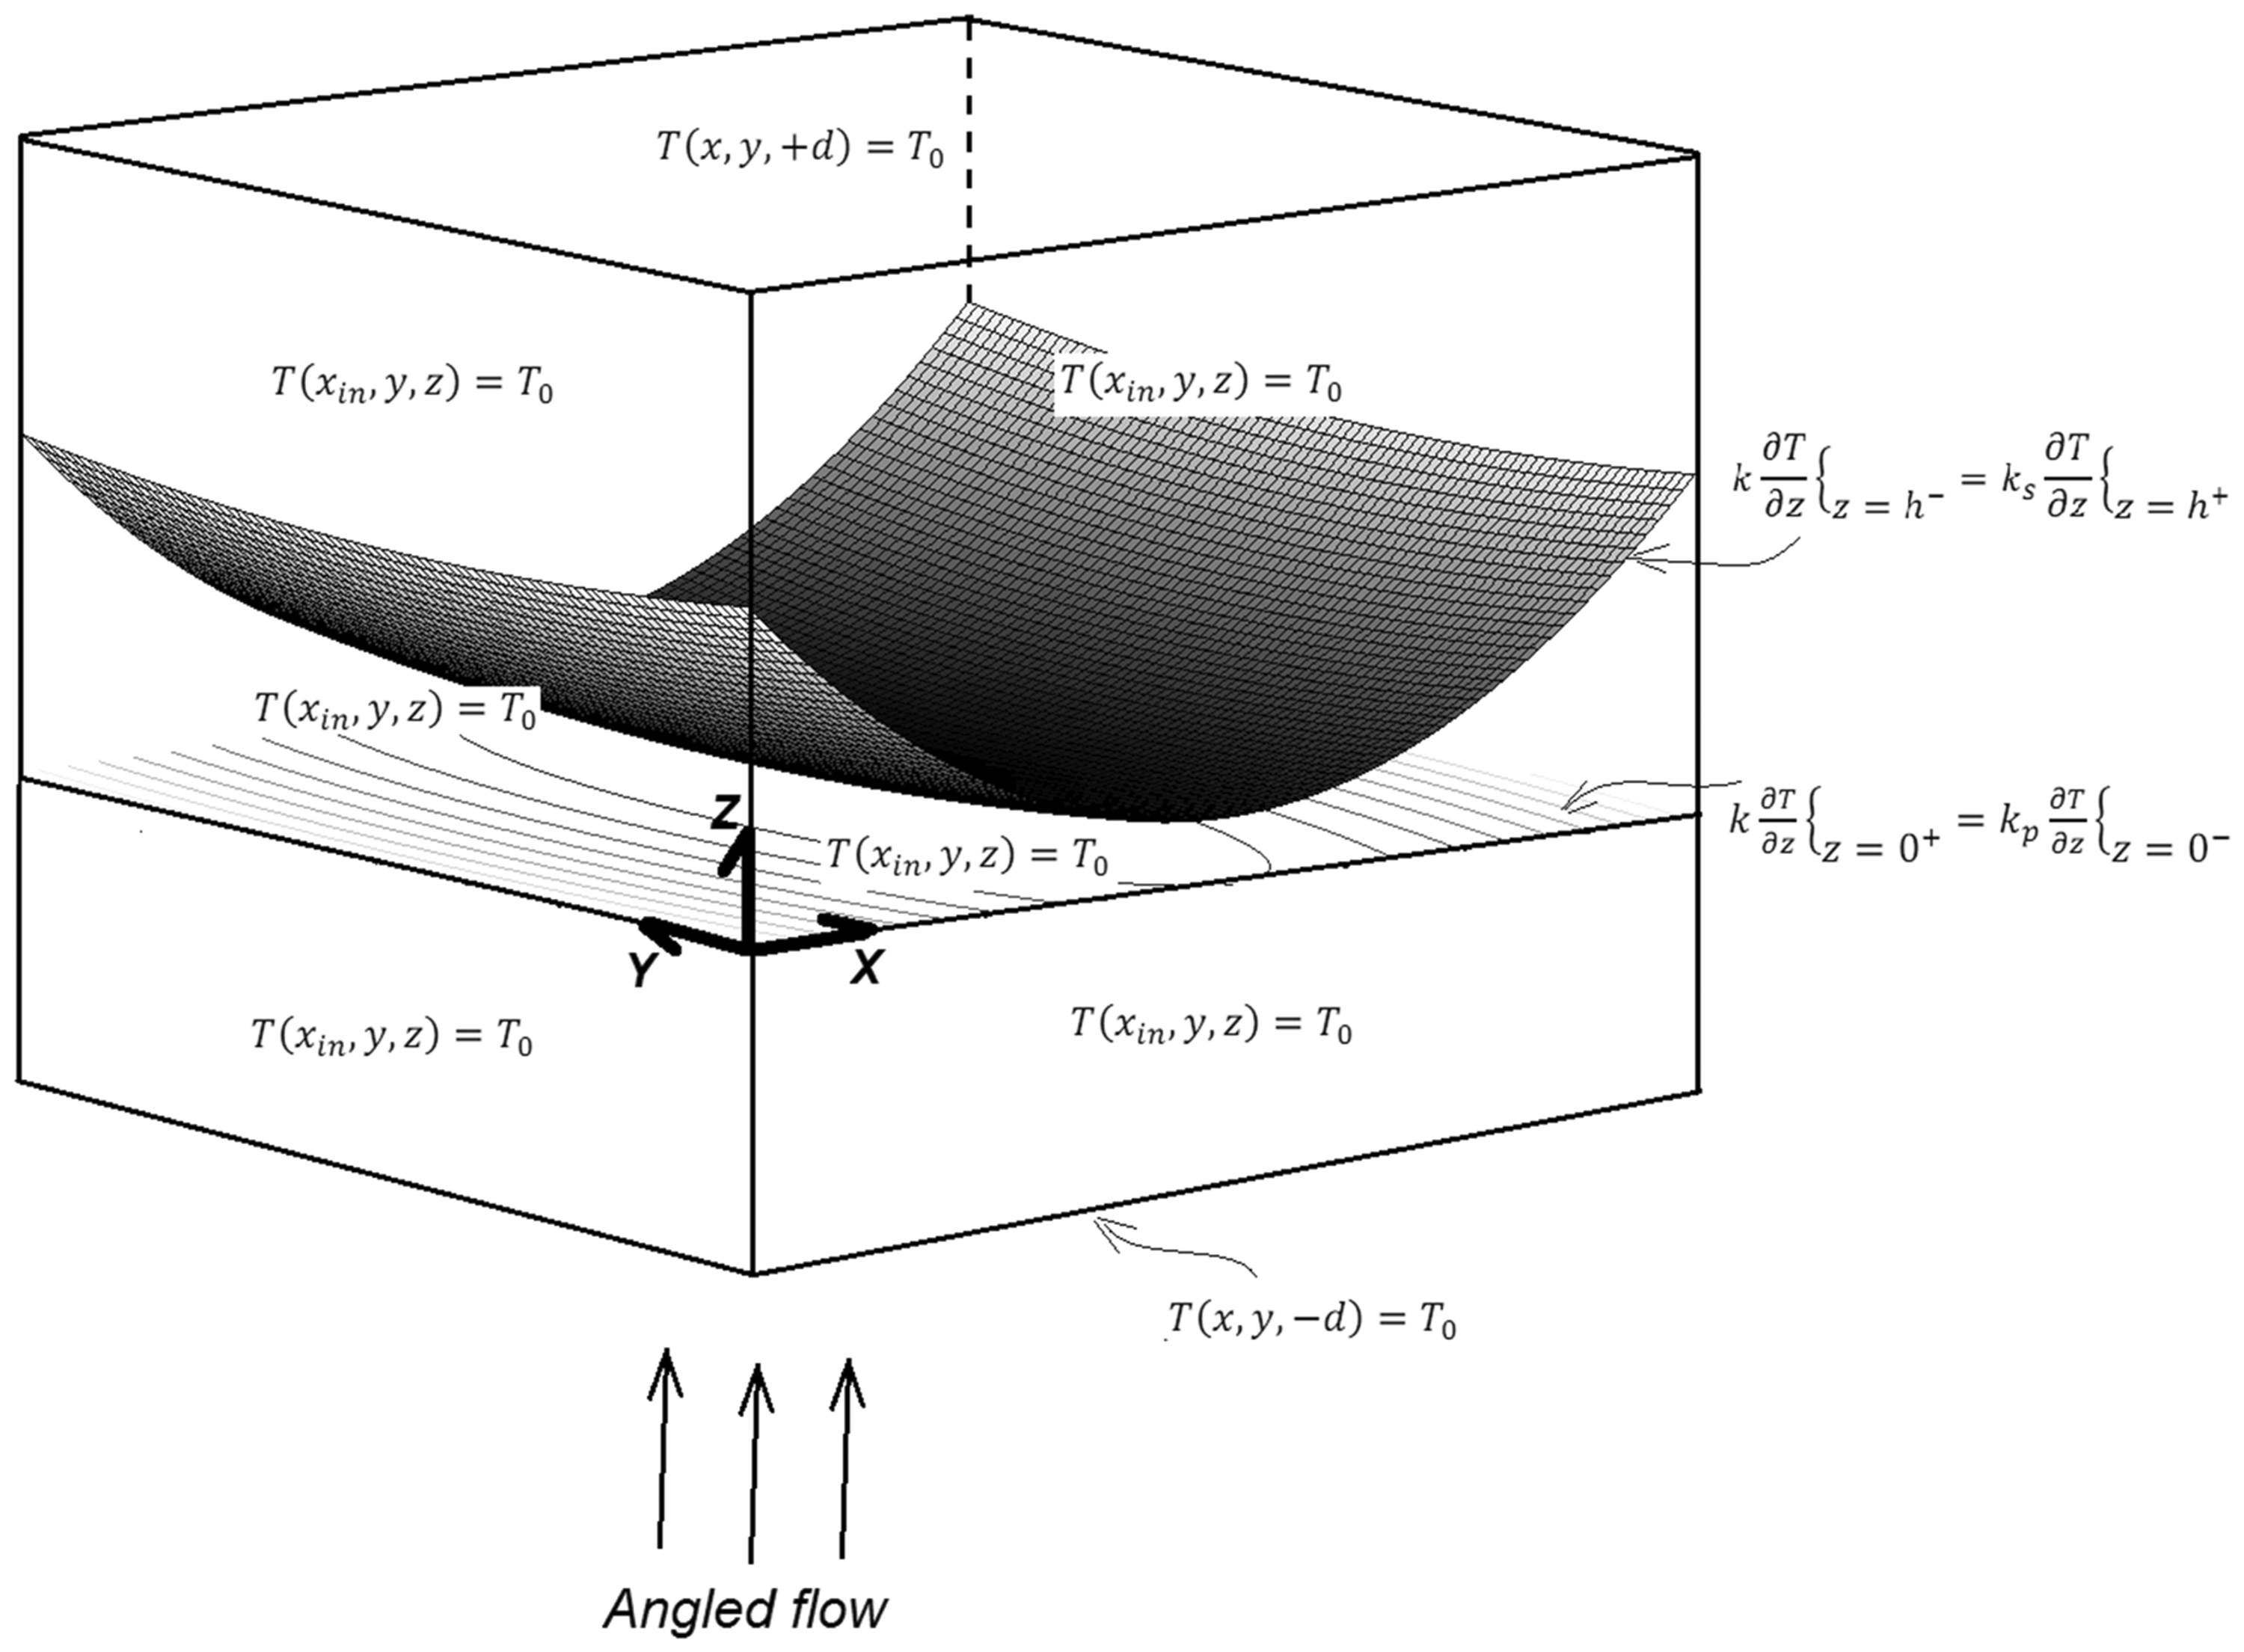
Prediction of friction
Hypoid gears usually operate with quite thin lubricant films under partially lubricated non-Newtonian conditions. Thus, the generated friction is the combined result of non-Newtonian viscous shear of the lubricant film as well as some degree of boundary friction due to interaction of asperities of counter face surfaces. Therefore, the prevailing conditions can be termed as mixed-thermo-elastohydrodynamic. The extent of direct solid boundary interaction is determined through calculation of oil film parameter, λ at any instant through the meshing cycle for any pair of contacting teeth, where


The surface of the hypoid gear pair, subject of the current study, is lapped and super-finished, and thus fairly smooth,37,57 where boundary interactions are expected to follow the method proposed by Greenwood and Tripp. 58 This method assumes a Gaussian distribution of asperity heights, which is not always the case in practice. However, this is the case considered here (see Appendix 1).
The real area of interacting asperity peaks,Aa, is a function of bulk separation and is described by the statistical function

The proportion of load carried by the asperities is obtained as

In these, formulae A is the Hertzian contact area (apparent area of contact for perfectly smooth counter face surfaces),ξ is the density of asperity peaks per unit area and β is the average radius of curvature of asperity peaks. In addition,
According to Teodorescu et al.
59


According to Greenwood and Tripp,
58
the roughness parameter

Also, using the measured topography:

The conjunctional friction is the result of combined viscous shear of a thin lubricant film, Fv and direct interaction of asperities on the counterface surfaces (boundary friction, Fb), thus

The viscous friction becomes

The viscosity is the average viscosity in the direction of film thickness, updated by the pressure and temperature using equation (6). It should be noted that viscosity assumes its effective value as the local viscosity promotes limiting shear stress. The double integral is calculated over the apparent contact area.
Boundary friction is as the result of direct interaction of a very thin film adsorbed to the summit of counterface asperities, which is subject to non-Newtonian shear. It is assumed that limiting shear stress at the asperity pressure governs these interactions, where


Method of solution
Coupling between Reynolds and energy equations is not explicit as temperature affects Reynolds equation indirectly through changes in the lubricant rheological state (density and viscosity). In the conjunctional inlet, flow and thermal effects are strongly coupled due to the viscous nature of the flow. On the other hand, in the high pressure region of the contact, viscosity increases significantly with pressure, whilst the lubricant film thickness decreases. Therefore, the Poiseuille component of flow becomes negligible and the convective heat transfer is no longer significant. This is also shown by Kim et al.60,61
Reynolds equation is discretised using finite differences in the same manner as that described by Jalali-Vahid et al. 40 Solution for pressure at any nodal position (i,j) within the computational grid is based on low relaxation effective influence Newton–Raphson method, fully described by Jalali-Vahid et al.40,62
A full numerical solution using finite difference form of the energy equations is required to calculate the temperature distribution in the fluid film. Lubricant film temperature alters three-dimensionally, unlike the pressure distribution (where:
The following iterative procedure is used:
At any pinion angle, ϕ (commencing at the beginning of a meshing cycle), an initial guess is made for the central lubricant film thickness using equation (14). The required data for contact geometry, load and speed of entraining motion are obtained through TCA
42
Using the film thickness obtained in step 1, the inlet boundary condition is set as The pressure distribution and the corresponding lubricant film contour are obtained by simultaneous solution of equations (1) to (7) and (10) to (12) in an iterative manner, where two convergence criteria should be satisfied. The first criterion seeks to compute nodal pressures within a specified limit
The second criterion seeks to obtain the temperature distribution. Using the obtained pressure distribution and film thickness, the temperature distribution is obtained as described in the Thermo-elastohydrodynamics section. The average temperature at any cross section through the lubricant film is used to update the lubricant viscosity and density (equations (6) and (7)). It should be noted that the temperature variation can be directly integrated into Reynolds equation. Such an approach has been reported in Peiran and Shizhu.
63
New pressure distribution is obtained using the updated values of viscosity and density, repeating steps (1)–(4). After new converged thermo-elastohydrodynamic pressures are obtained, an instantaneous load balance is sought between the lubricant reaction (equation (15)) and the applied contact load (determined through TCA). Therefore, the third convergence criterion is
The convergence criteria for temperature are similar to that for pressure, but the summation is carried out volumetrically in the (x, y and z) domain as
where


In the above process, the indices i and j refer to a computational grid position, k denotes the pressure convergence iteration counter and l the load convergence iteration counter.
When all the convergence criteria are met, the pinion angle is advanced within the meshing cycle and the entire process is repeated. To observe the contact conditions for any pair of meshing teeth, the meshing cycle is sub-divided into 20 discrete steps of the pinion rotation angle.
Results and discussion
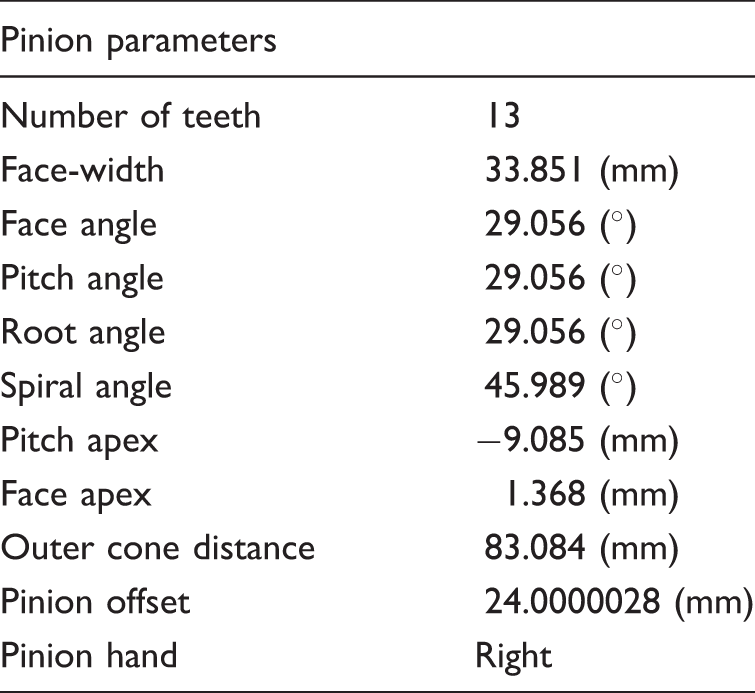
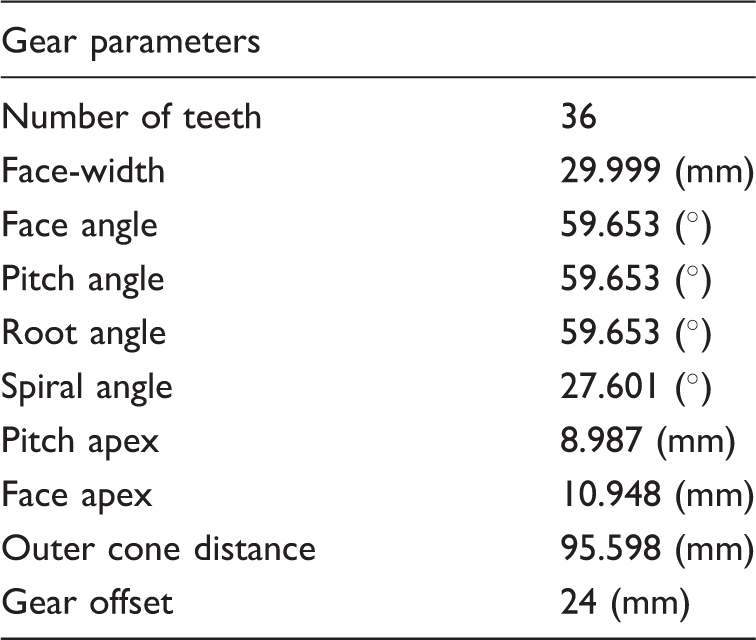
Pinion specification.
Gear specification.
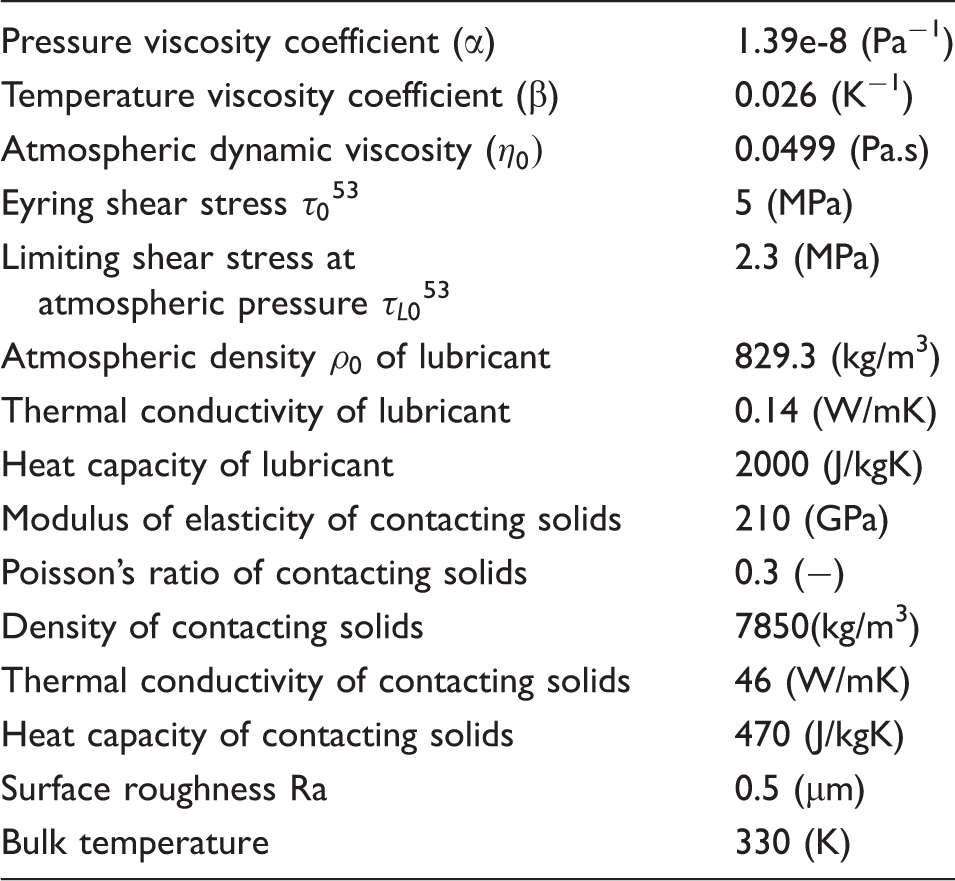
Lubricant and solids data.
Simulation studies were carried out on a 2.93 GHz Pentium Intel i7 machine with the total CPU time of 5000 s.
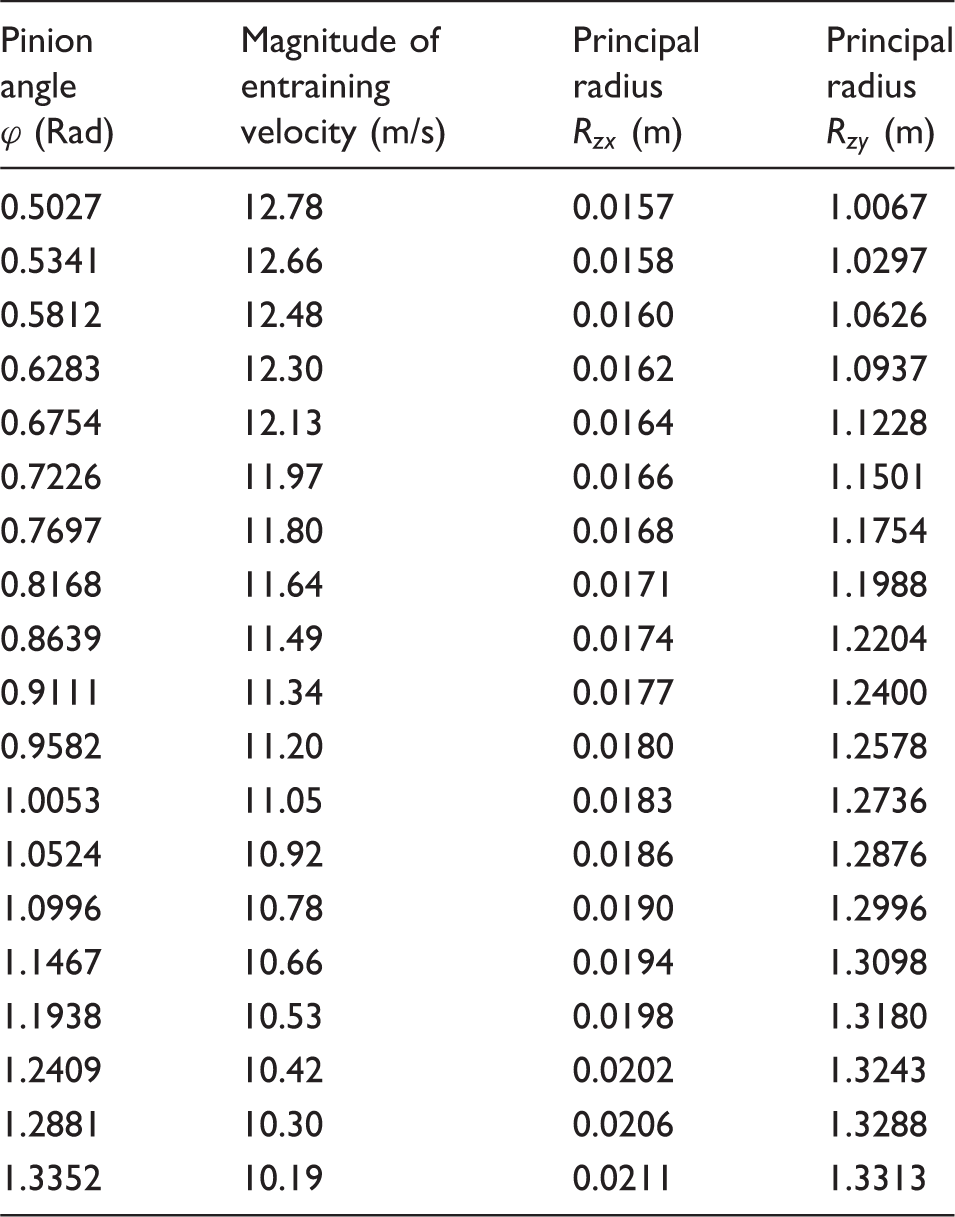
Speed of entraining motion and radii of curvature of a teeth pair through mesh.
The hypoid gear pair is subject to high contact loads during a typical meshing cycle under the simulated conditions. This is shown in Figure 4. There is also significant side leakage of the lubricant from the contact along the major axis of the elliptical contact footprint. This is also shown in the same figure, indicating that the side leakage flow accounts for 50% of the inlet entrained lubricant flow. Therefore, solutions for hypoid gear pair meshing should always take into account the angled flow entrainment into the contact and embody two-dimensional solution of Reynolds equation irrespective of the large aspect ratio of the elliptical contact footprint during parts of the meshing cycle. High contact loads and significant side leakage flow out of the contact domain yield thin thermo-elastohydrodynamic films with high generated pressures and viscous shear, thus promoting non-Newtonian conditions, which significantly deviate from the usual isothermal elastohydrodynamic analyses reported in earlier literature.
Contact load and percentage side leakage flow in a meshing cycle.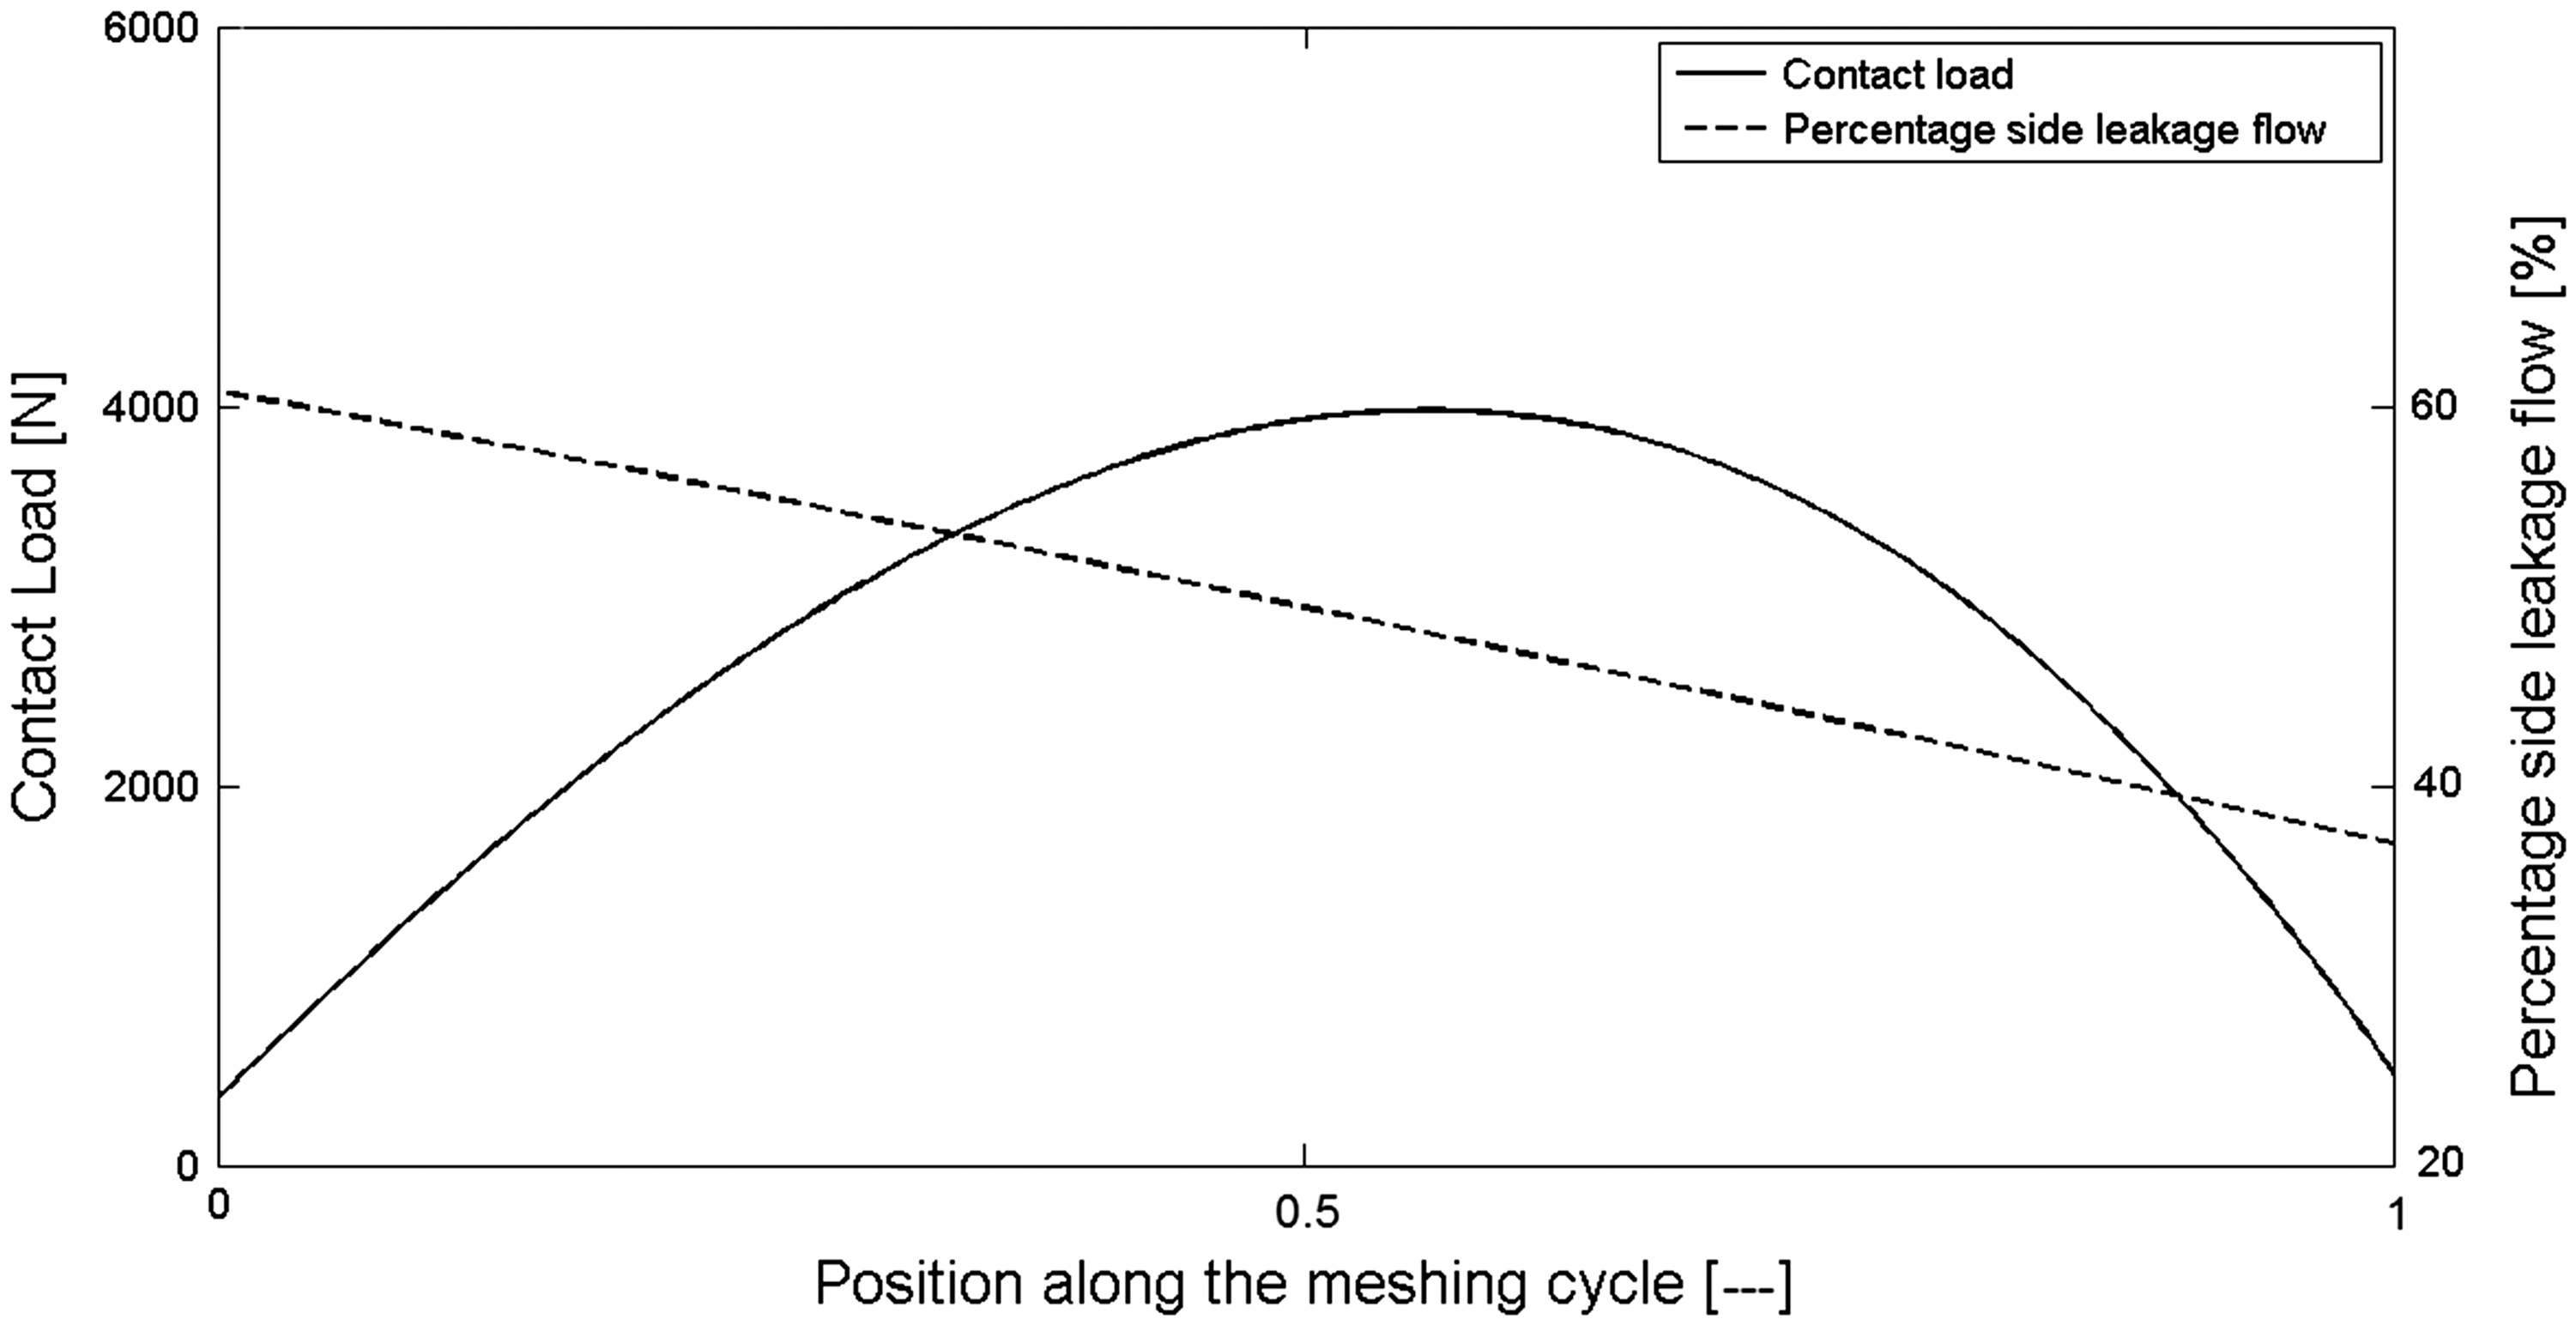
Solutions are obtained for 10 instantaneous contacting locations of the hypoid gear teeth pair during the simulated meshing cycle, using a 60 × 60 grid across the elliptical contact footprint. The number of grid points is chosen after a grid sensitivity study. The result of this test is shown in Figure 5 at the centre of the meshing cycle. Results are presented for 60 × 60 and 120 × 120 grid points. The latter predicts 0.57 µm and 0.60 µm for the central and minimum exit film thickness positions respectively. These results are 0.56 µm and 0.58 µm, when using a 60 by 60 computational grid. This difference translates to 1.75% and 3.3% absolute differences for the central and the minimum exit oil film thickness, respectively. The temperature distribution at any grid location (cross section into the depth of the lubricant film and the adjacent solid contacting surfaces) is obtained at 25 equally spaced grid locations in each case (for the lubricant film thickness and solid surface layers).
Pressure distribution and film thickness along the minor axis for different grid numbers.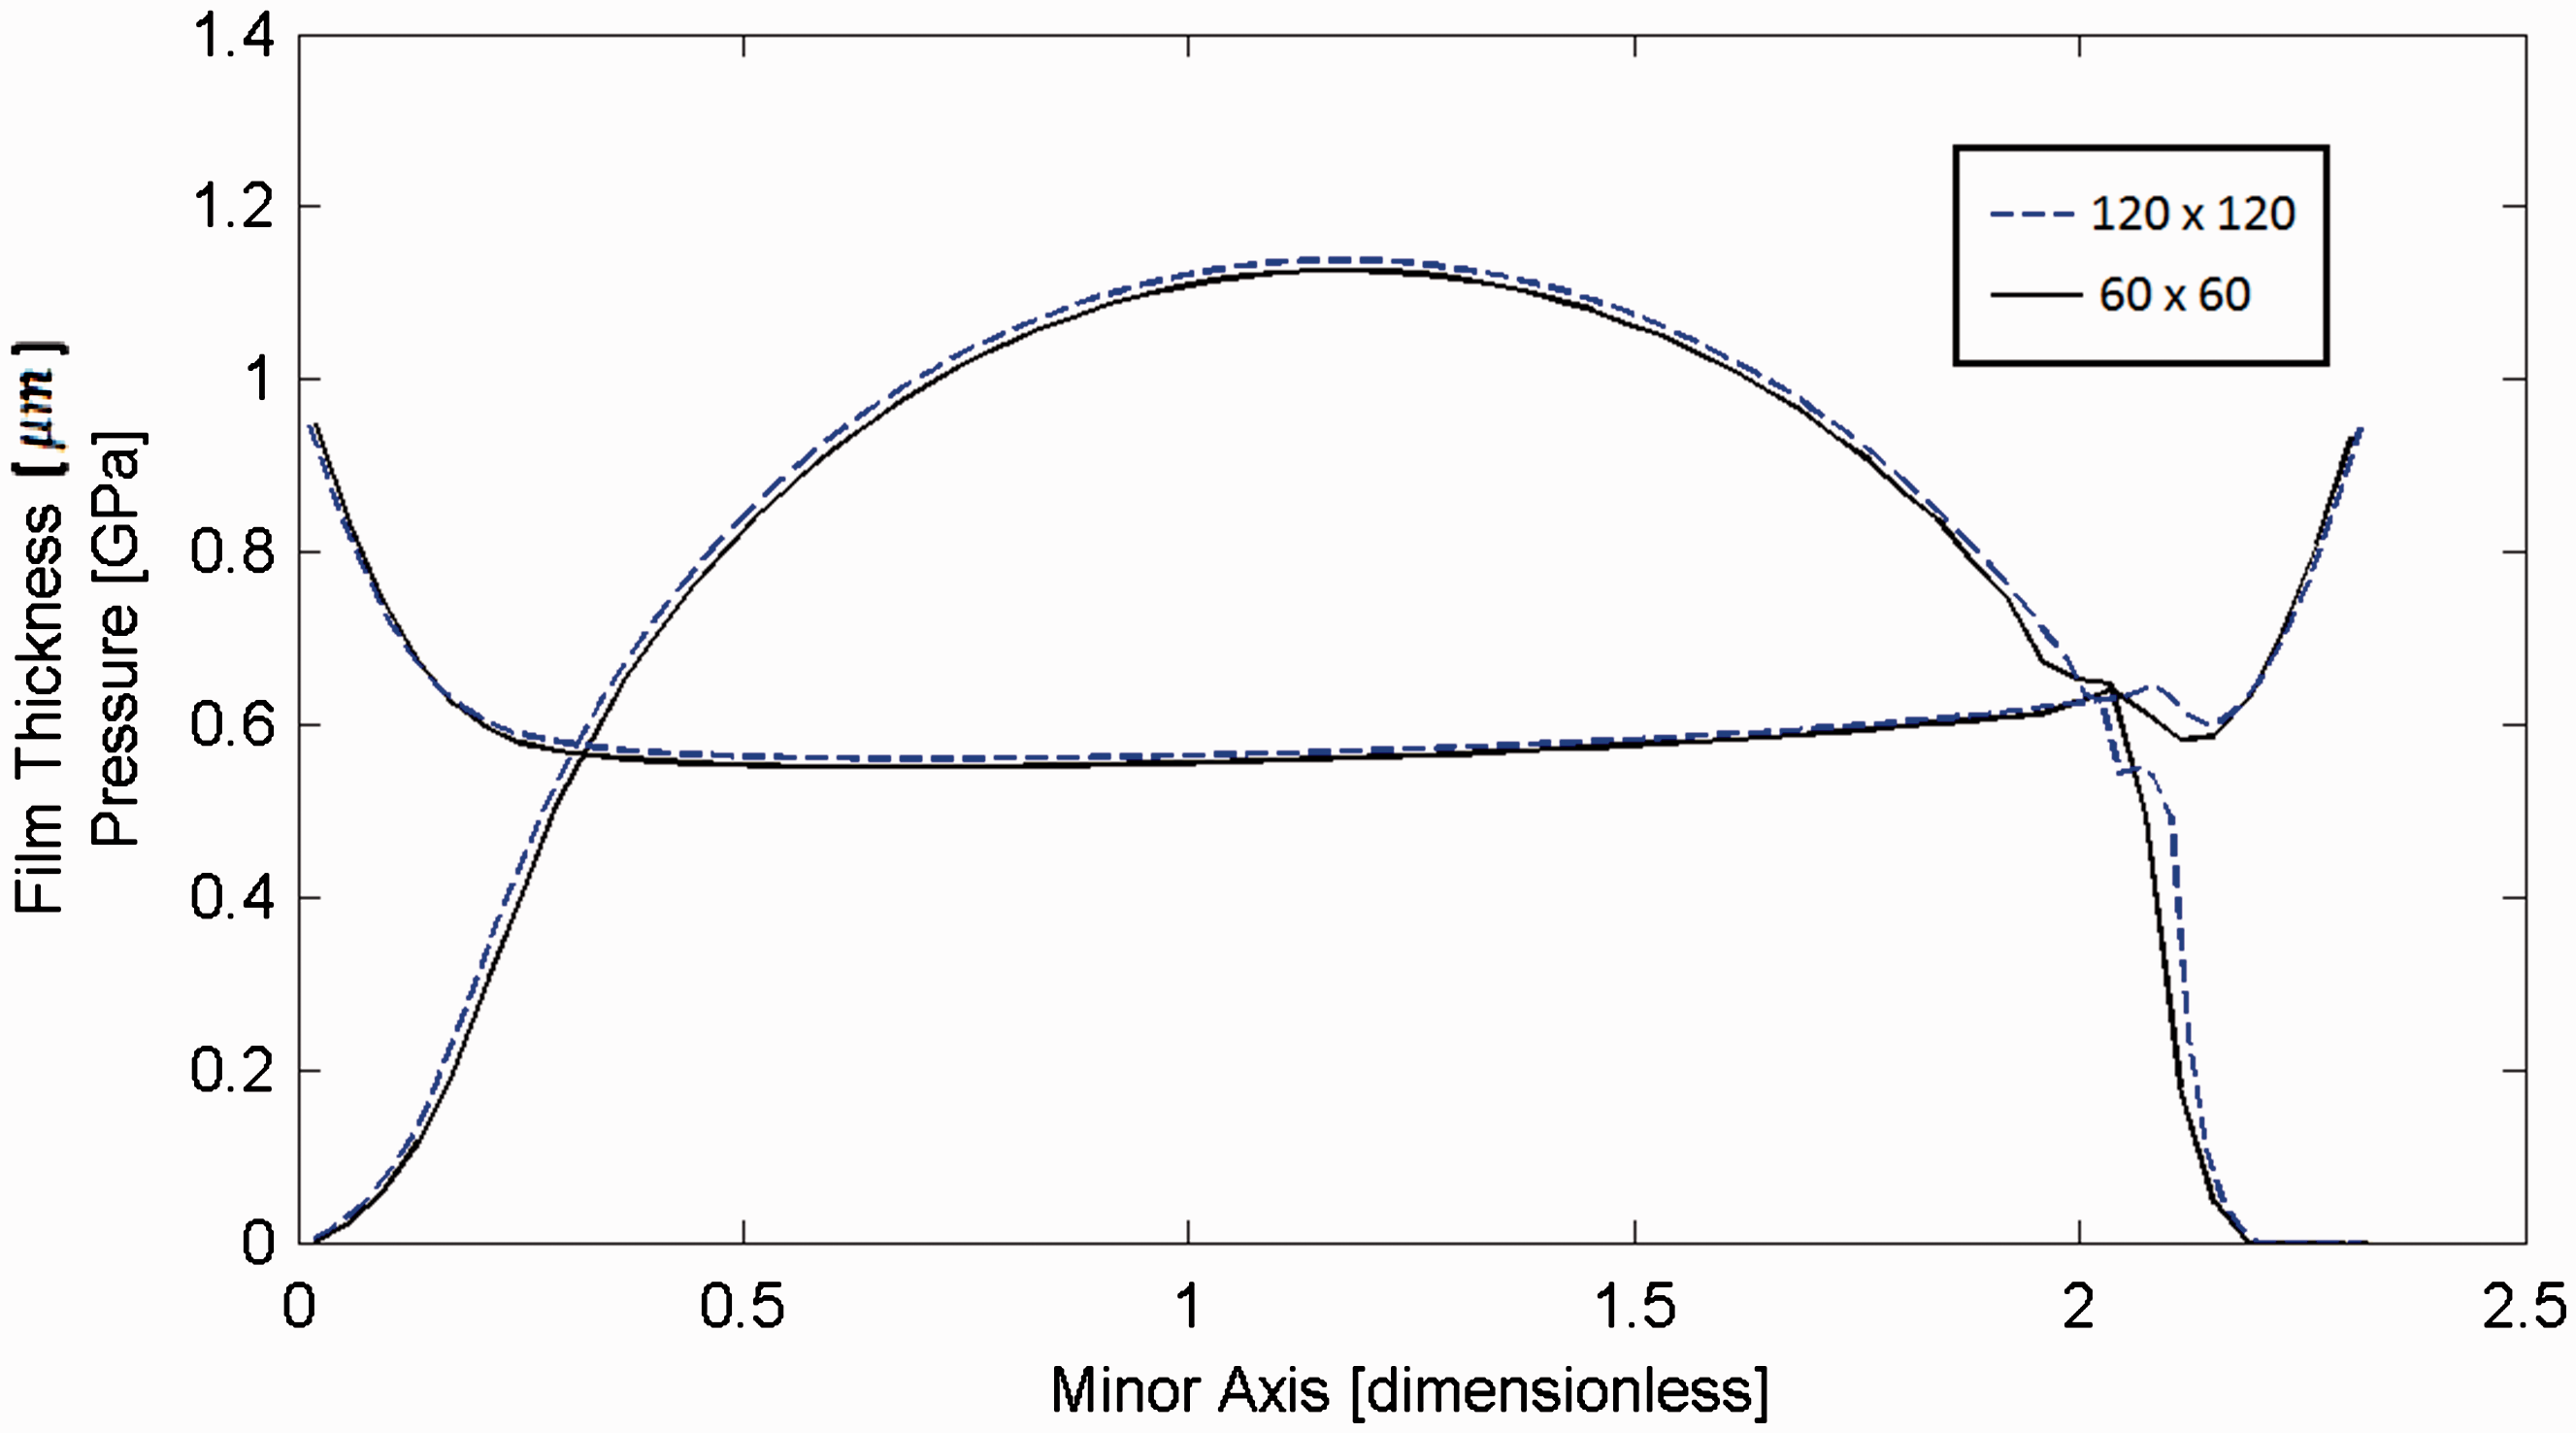
Figure 6 shows the pressure distribution for an isothermal, as well as a thermal non-Newtonian analysis for the pinion angle of 1.3352 rad (this marks the end of the meshing cycle). The main difference in the results is the diminution of the secondary pressure peak at the contact outlet in the latter case, caused by reduced lubricant viscosity in a thermal contact.
3D pressure distribution at the end of meshing cycle.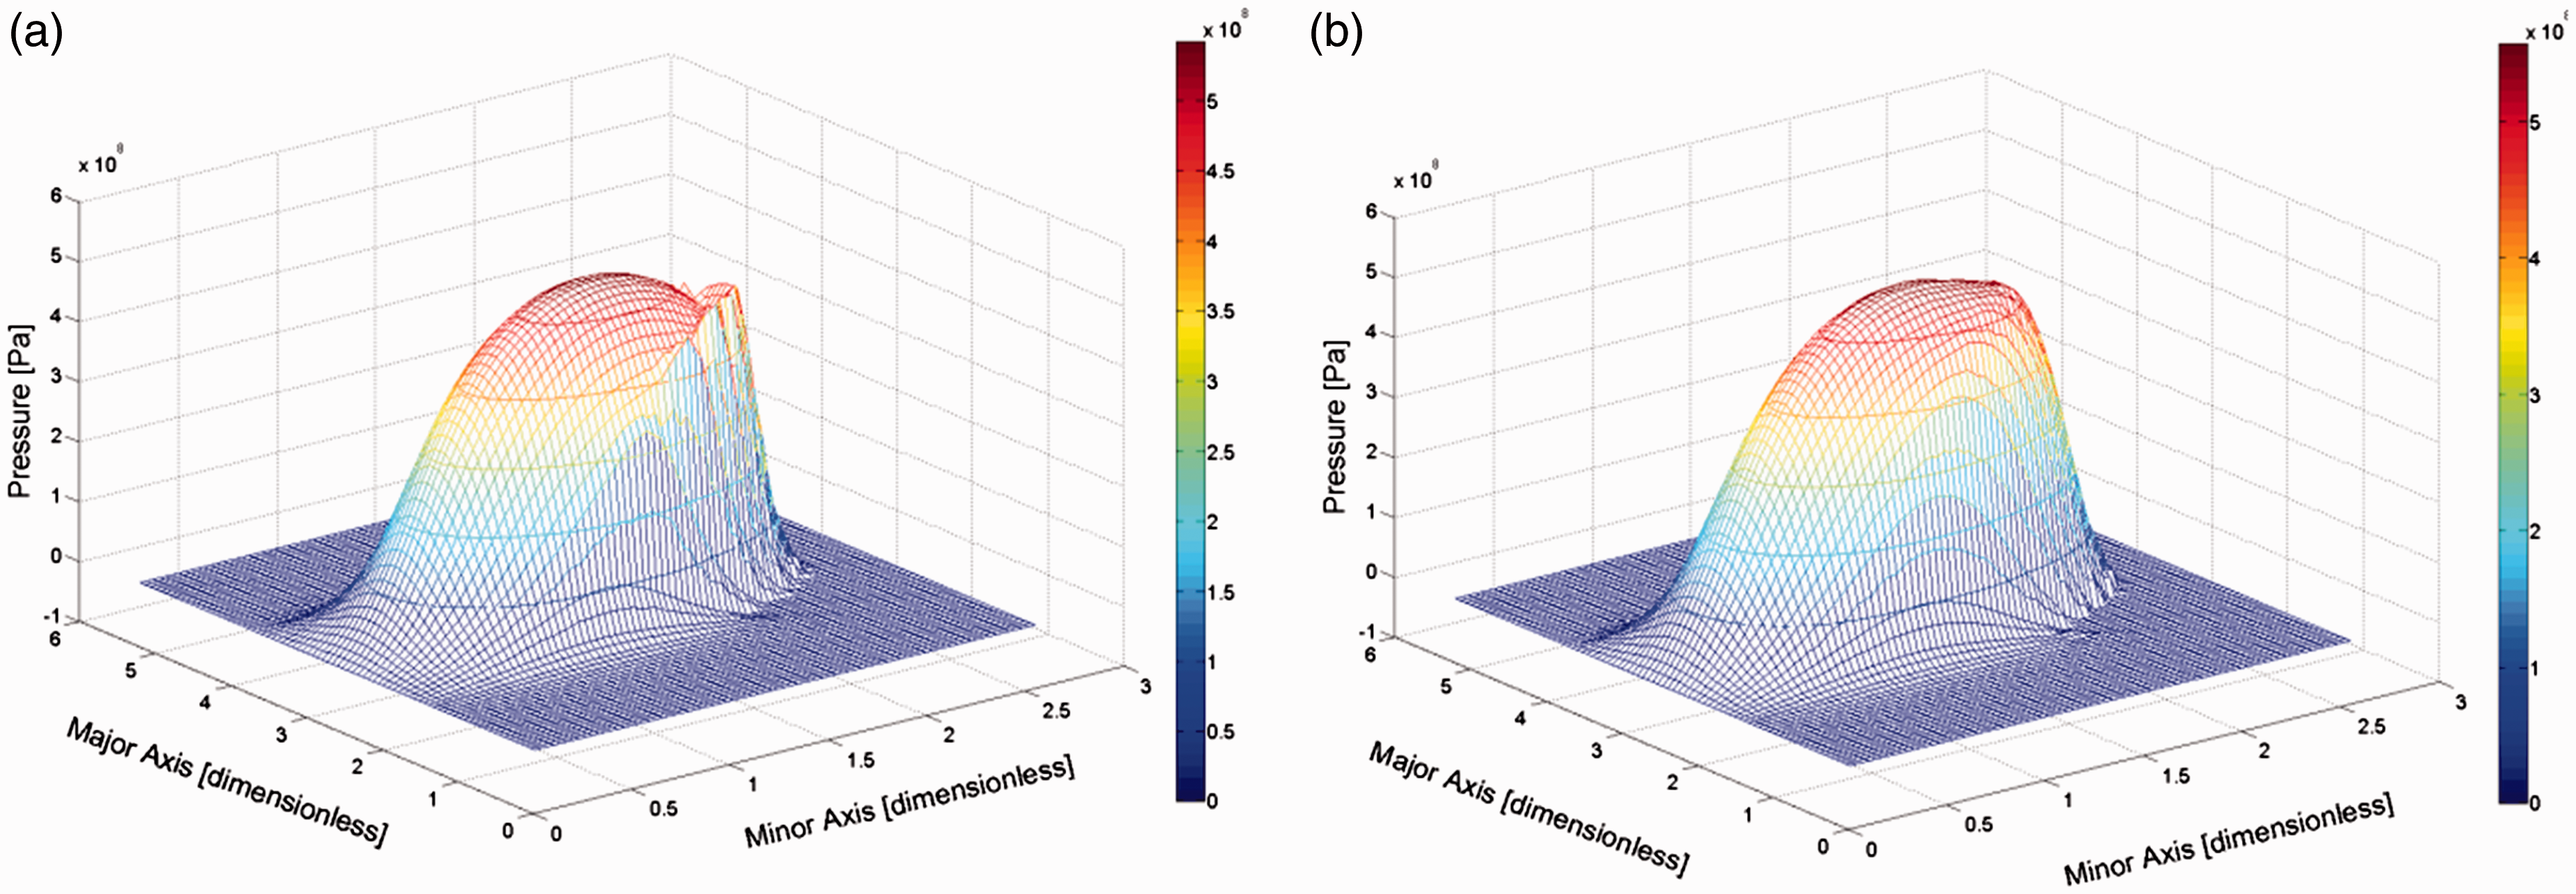
Figure 7 shows the cross-sectional pressure profile along the minor axis of the contact footprint at the mid-point of the major axis of the 3D distributions in Figure 6. It also shows the corresponding film shape. In general, there is an insignificant difference in the lubricant film thickness between the two analyses, except for a small change in the minimum film thickness due to reduced lubricant viscosity when thermal analysis is included.
Pressure profile and corresponding film shape at the contact mid-section along the minor axis of the elliptical contact footprint.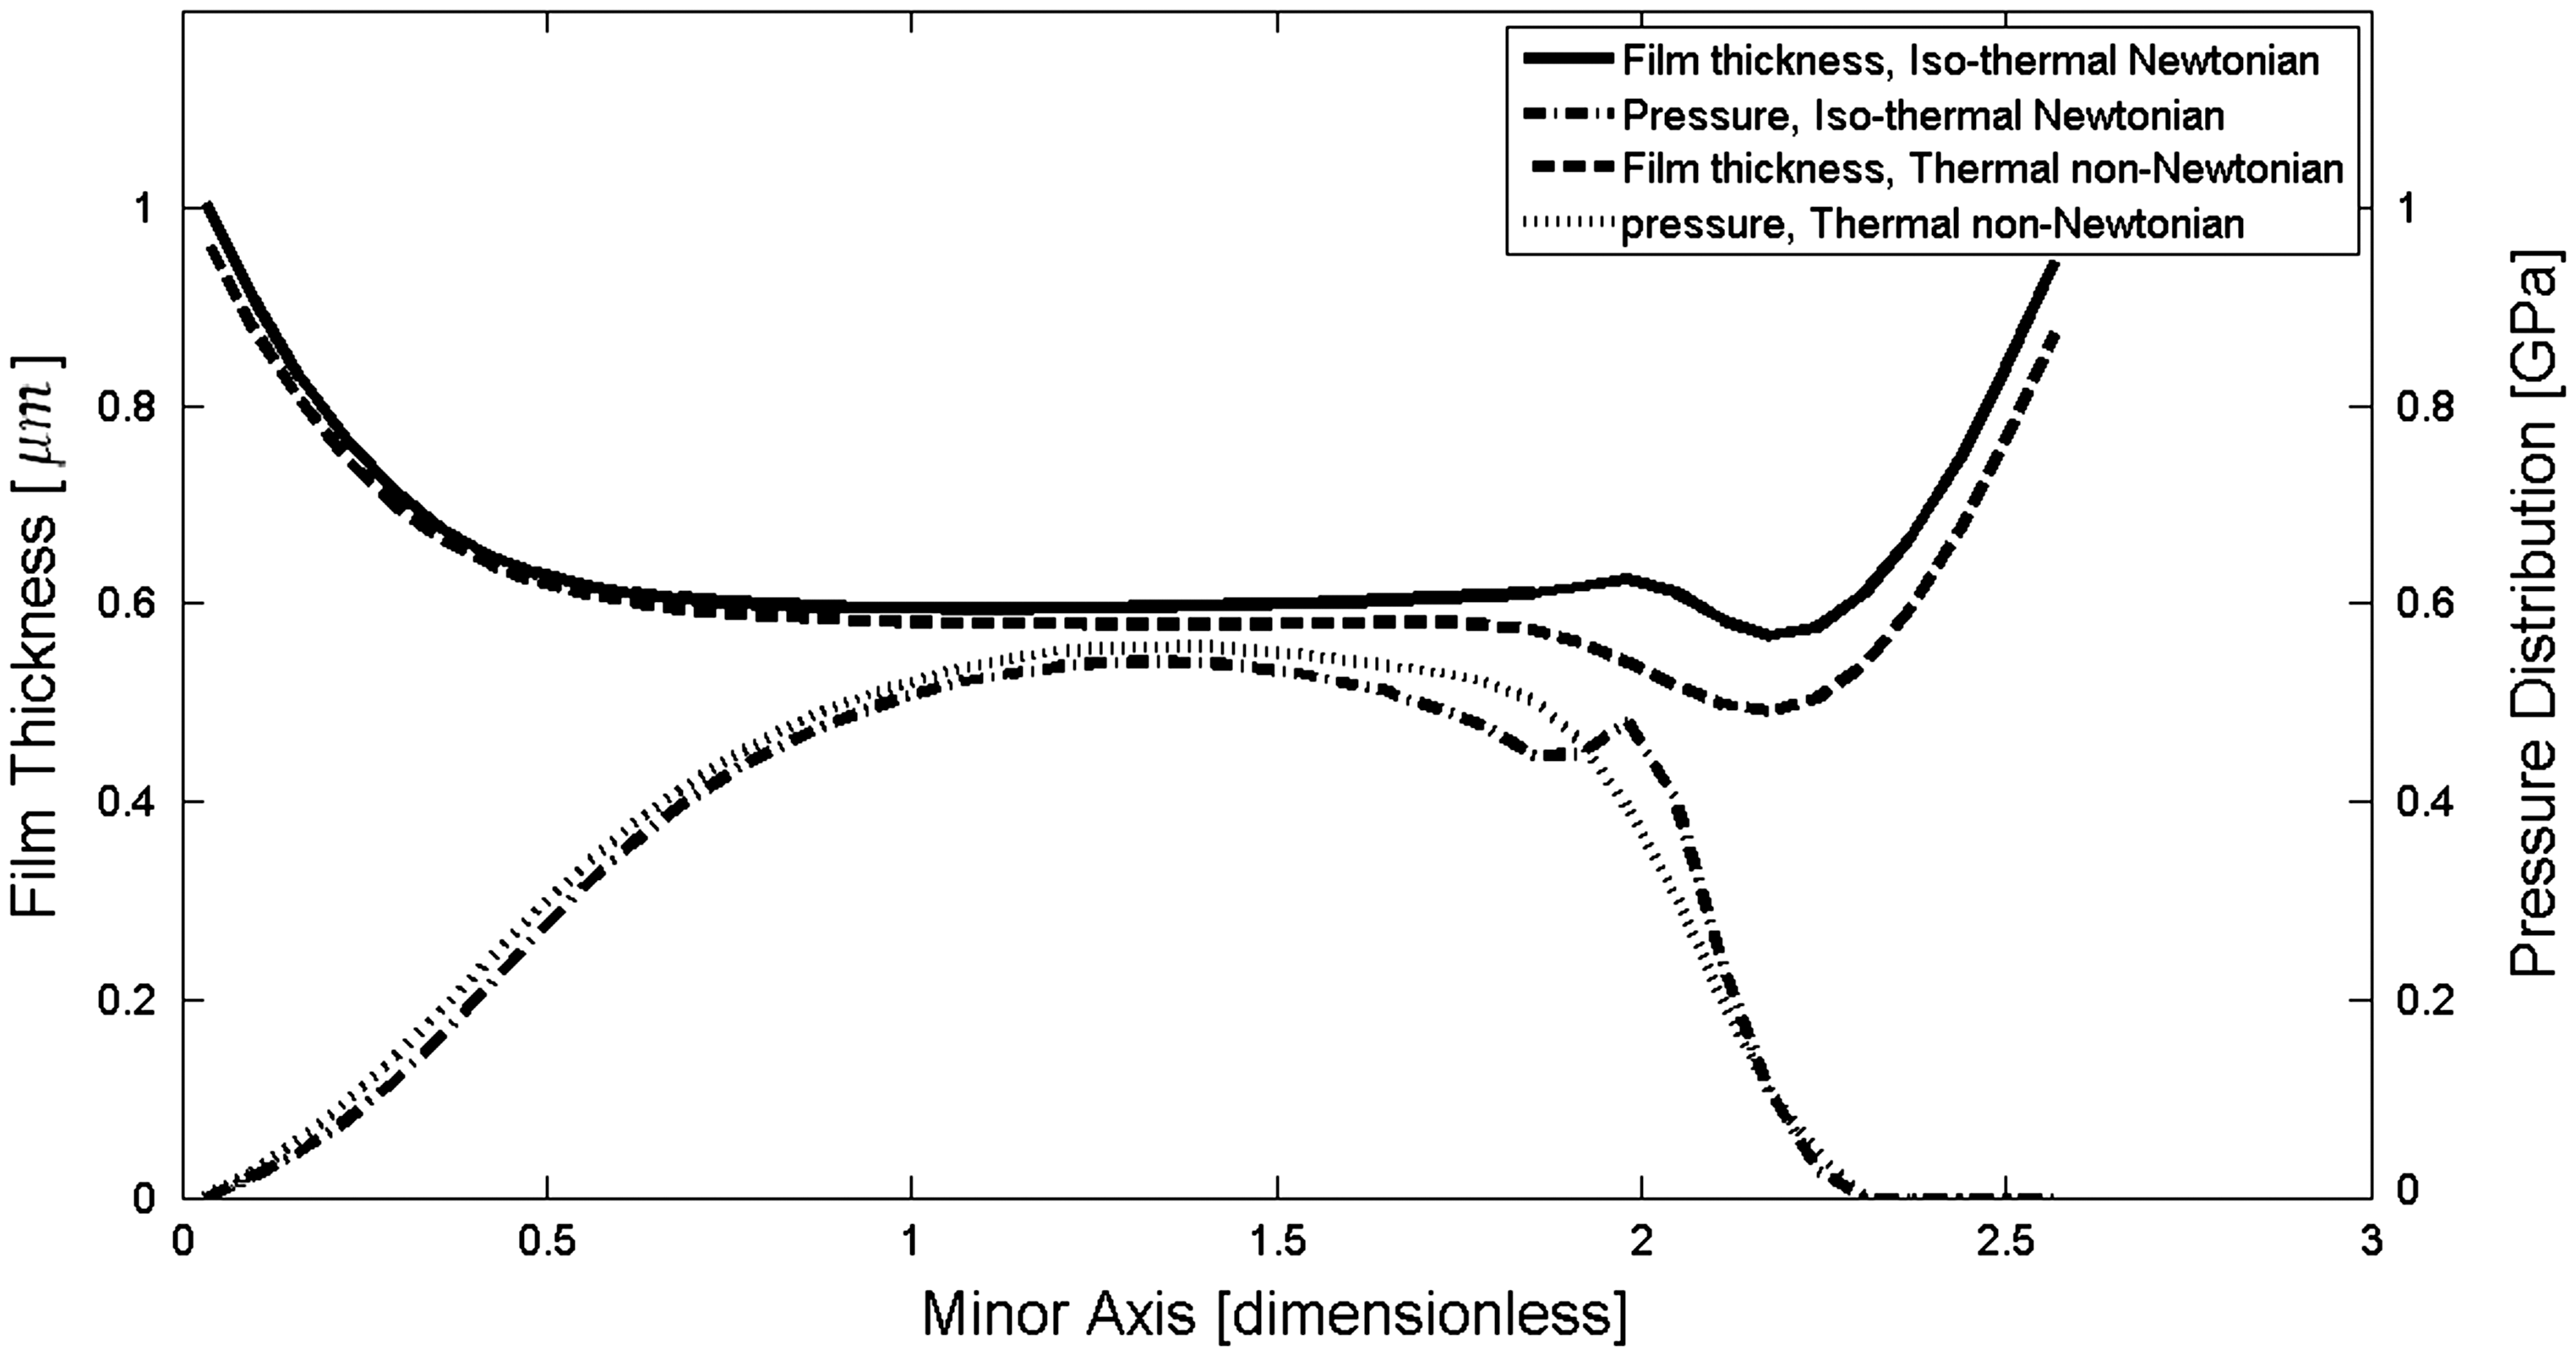
The results in Figure 7 correspond to the instance at the end of the meshing cycle. Figure 8 shows the variation in the minimum film thickness and the maximum primary pressure peak (corresponding to the equivalent maximum Hertzian pressure) during a typical steady state meshing cycle. The maximum pressure occurs approximately at mid-meshing cycle, where the absolute minimum film thickness occurs as well. The thermo-elastohydrodynamic minimum film thickness is significantly lower than that predicted by the idealised isothermal analysis due to reduced lubricant viscosity with temperature, thus its load-carrying capacity.
Variation of maximum primary peak pressure and minimum film thickness during a meshing cycle.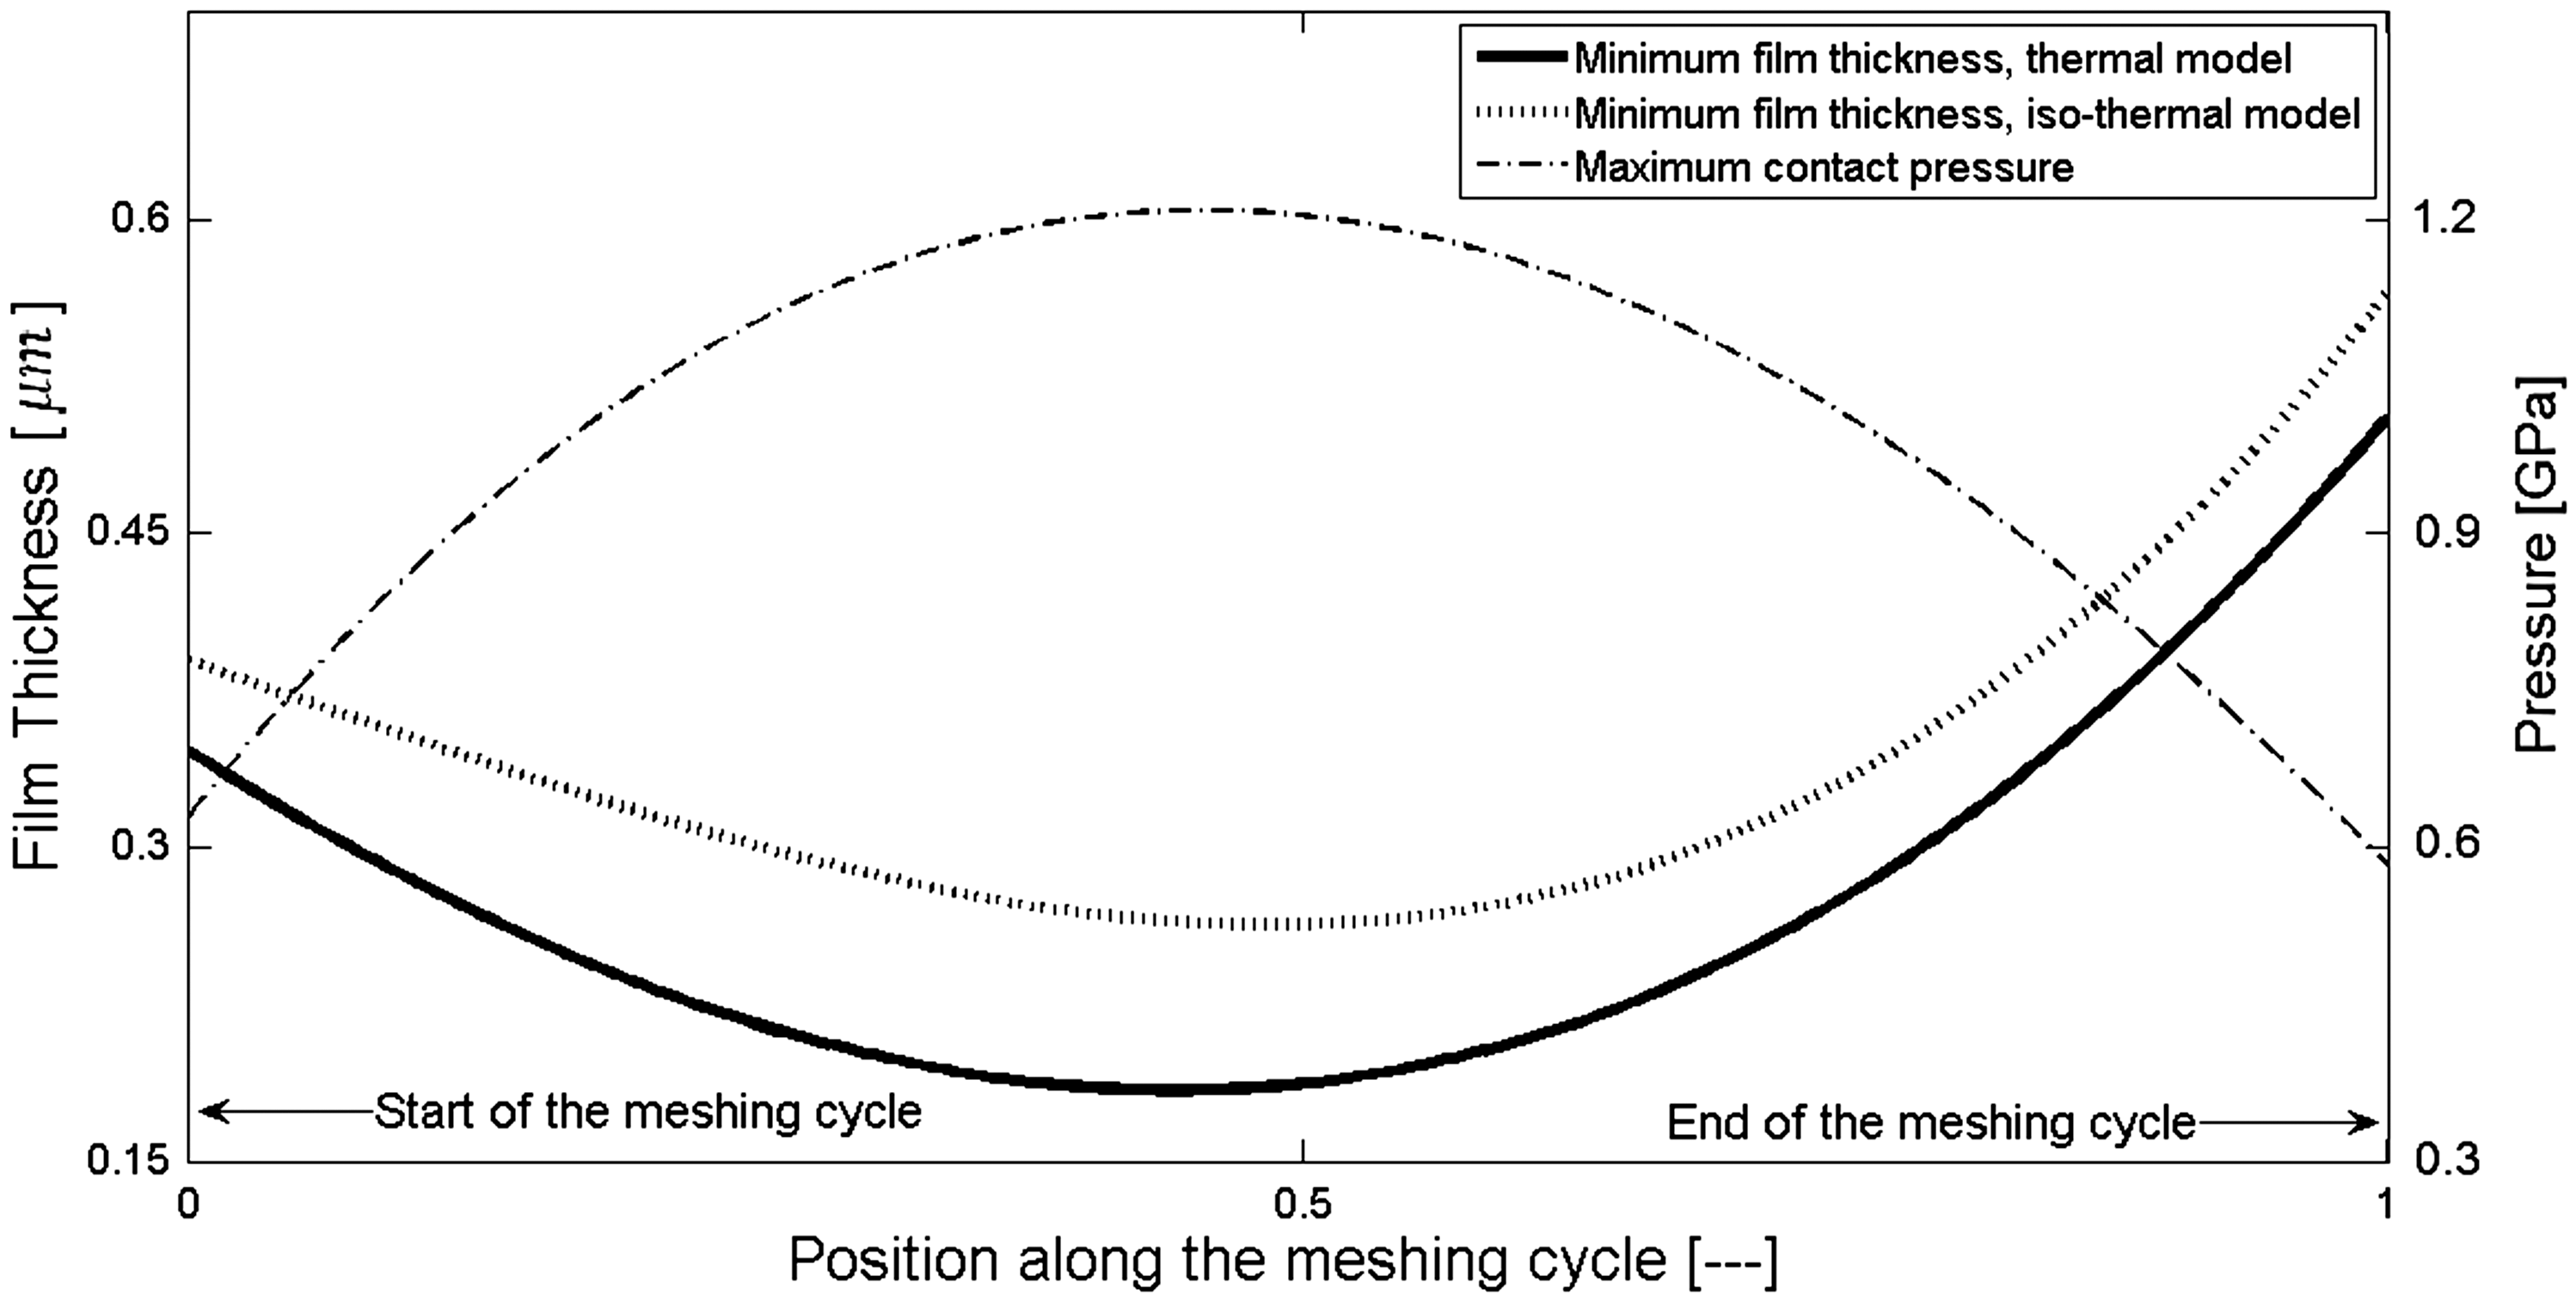
An important point to note in Figures 7 and 8 is that the film thickness is barely in excess of the root mean square roughness of the contiguous surfaces (measured to be 0.5 µm). Therefore, a mixed regime of lubrication would be expected, which is in fact the case throughout the meshing cycle. This is the reason for the current mixed thermo-elastohydrodynamic analysis.
Figure 9 shows the 3D average (through the depth of the film) lubricant temperature distributions at the mid and at the end of the meshing cycle, where maximum and minimum loading occurs. In this transition, the contact load decreases from 4 kN to 750 N, whilst the side leakage flow is reduced by 20% (see Figure 4). At the same time, the maximum lubricant temperature is reduced by 80 K. This reduction in temperature not only shows the significance of compressive heating, but also demonstrates the important role of shear heating. The latter is influenced by viscosity variation under high pressures.35,36 The contours of lubricant temperature at mid-section of the major axis of the elliptical contact footprint, along its minor axis are also provided in the figure. These show the temperature variation in the lubricant, as well as the adjacent solid contacting surfaces; the equivalent ellipsoidal solid (Figure 2) and the semi-infinite elastic half space. Figure 9(c) also shows the velocity distribution, based on the equations (17) to (20), as well as that based on a non-Newtonian assumption provided by Conry et al.
43
These velocity distributions are for different positions along the minor axis of the contact footprint for the highly loaded condition at the centre of the meshing cycle. This condition corresponds to the most severe non-Newtonian behaviour and is the most appropriate condition for ascertaining the validity of using a Newtonian velocity distribution in the energy equation.
(a) 3D temperature distributions and contours for maximum and minimum loaded conditions along the meshing cycle; (b) velocity distributions.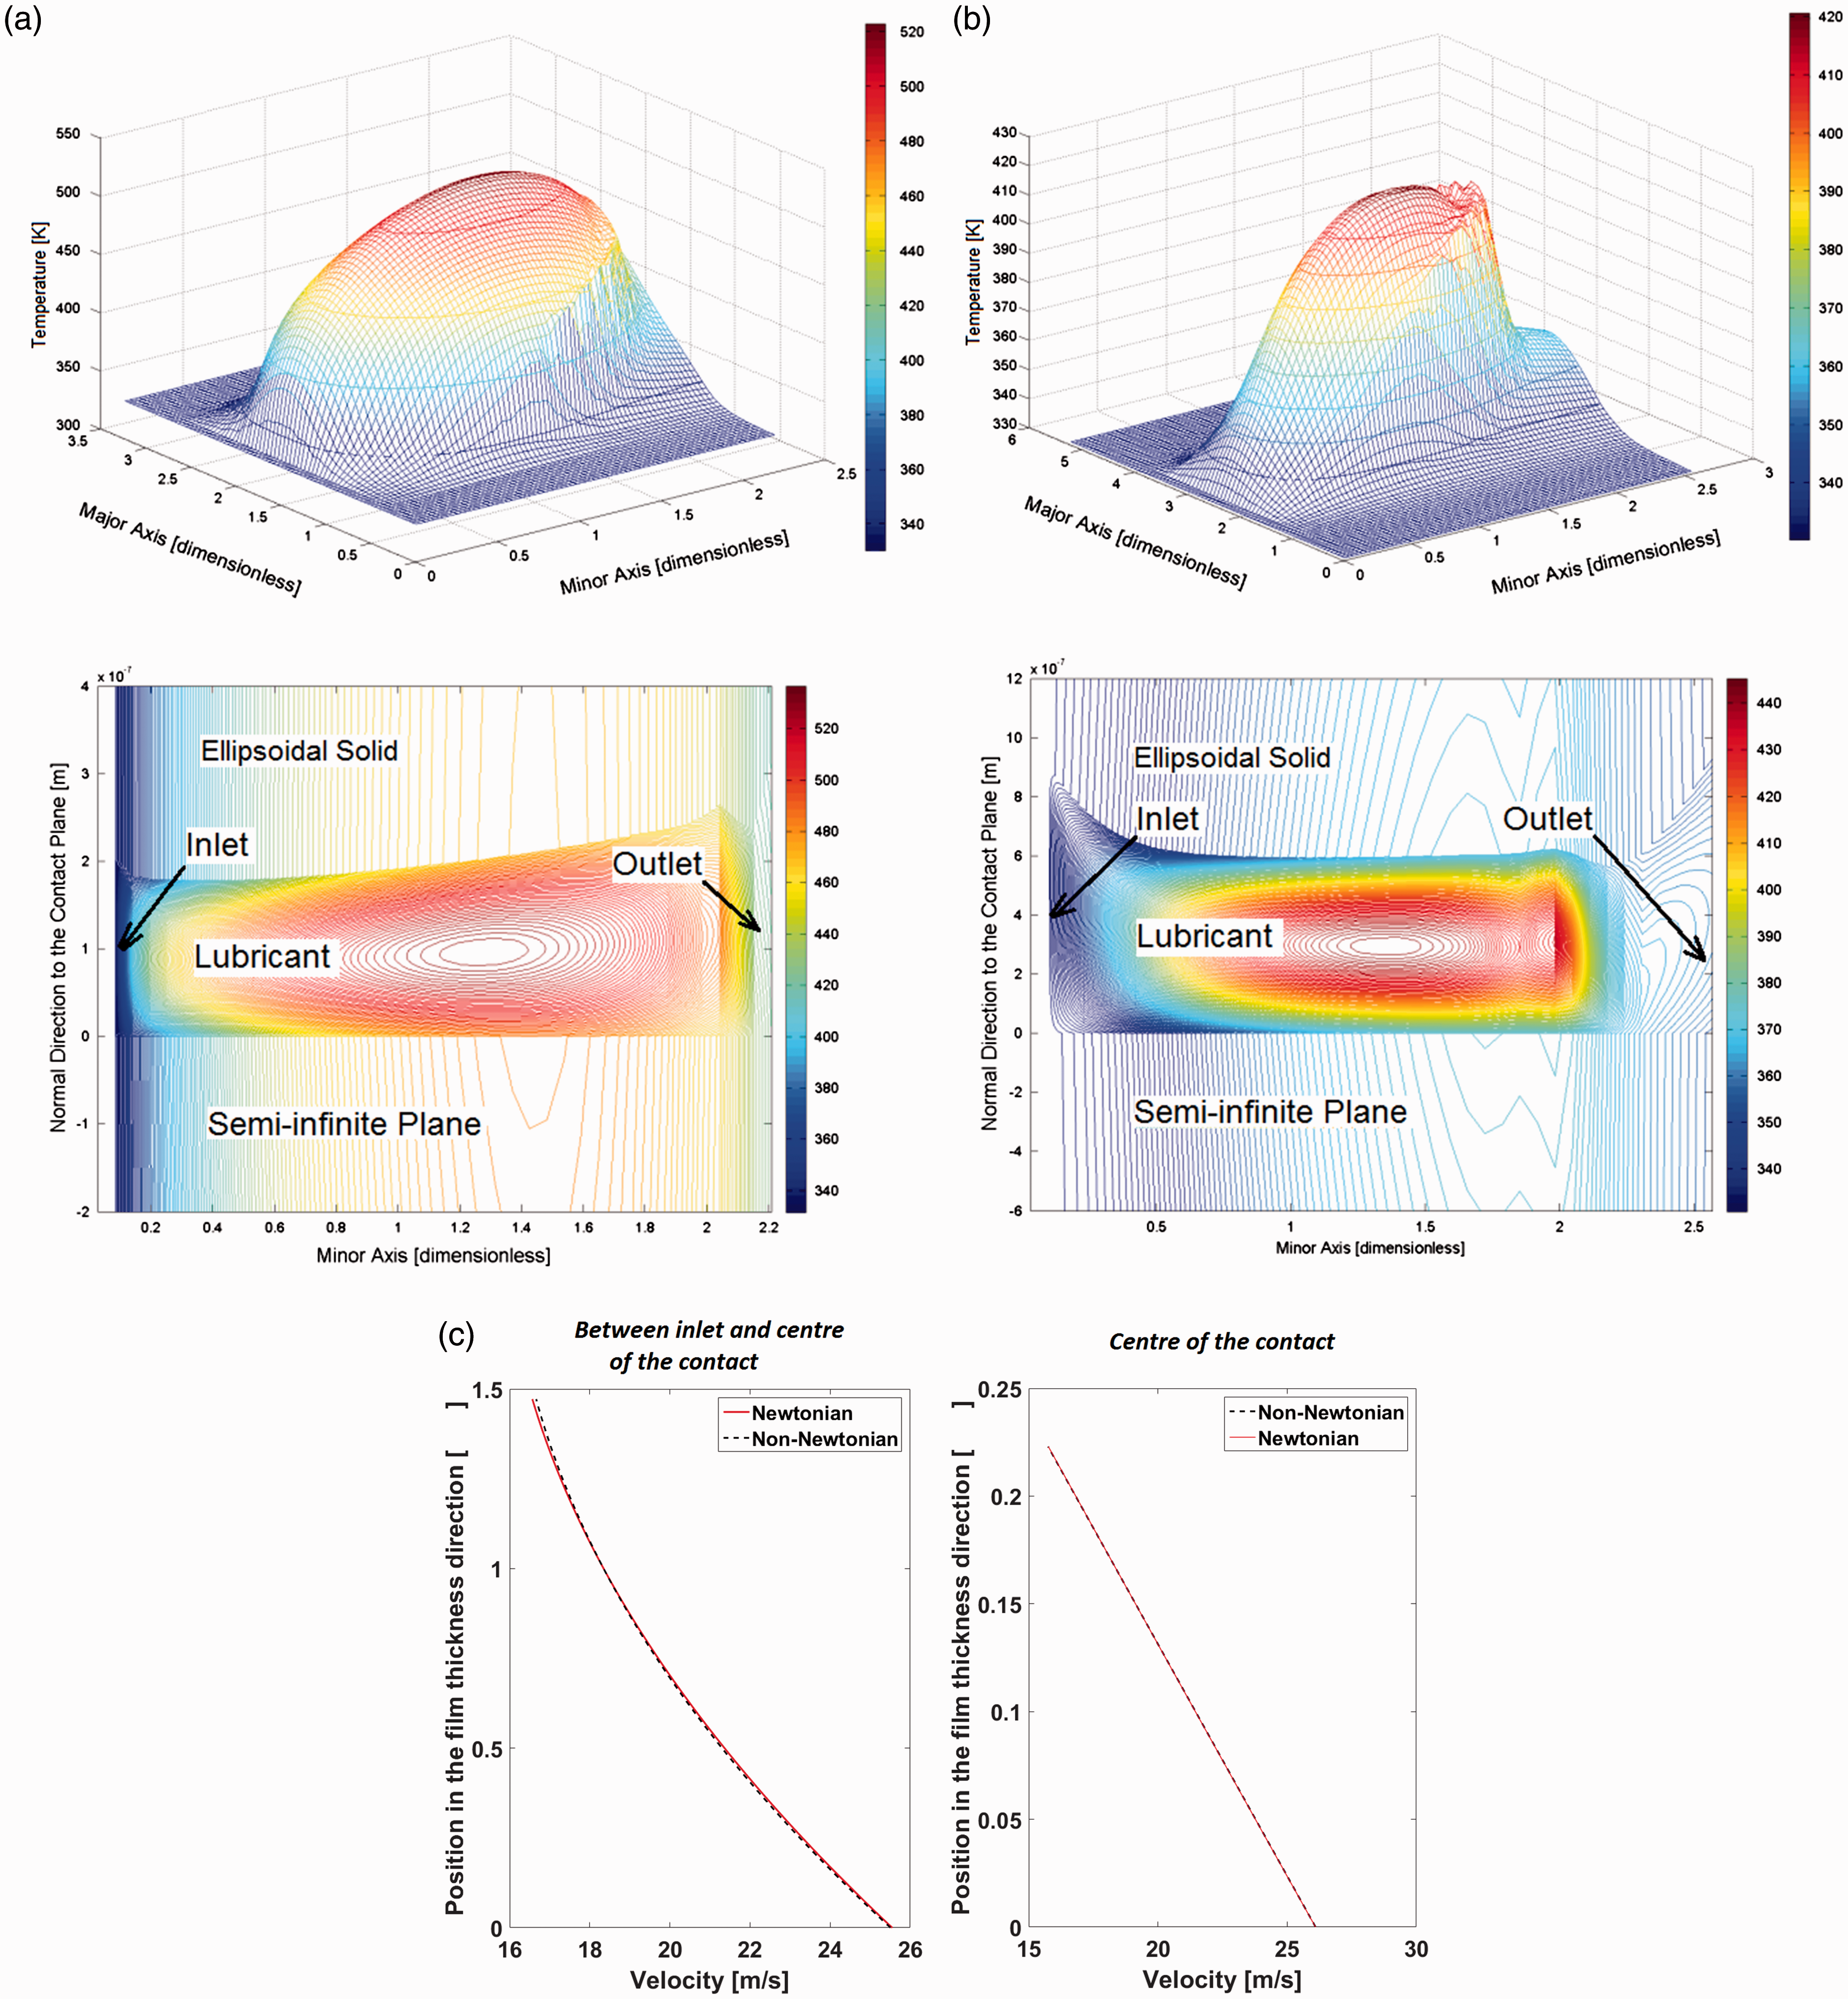
The results show that for a realistic prediction of film thickness, it is necessary to undertake thermo-elastohydrodynamic analysis. Figure 10 shows the results for the average lubricant temperature profile (into the depth of the film) along the minor axis of the contact ellipse at two instances along the meshing cycle. The corresponding temperature of the surfaces (equivalent ellipsoidal solid and the semi-infinite plane, see Figure 2) is also shown. As expected, the lubricant temperature is higher than the adjacent solid surfaces due to its shear heating. The lubricant conducts the heat into the solid boundaries. The temperature of the semi-infinite elastic half-space (represented by the lower surface velocity of the gear surface) remains higher than that of the equivalent ellipsoidal solid which is represented by the higher pinion surface velocity. At the start of the meshing cycle, the lubricant temperature is that of the bulk and ascends to the temperature of the solid surfaces, assumed to be the same. In physical terms, the hotter surfaces convect heat into the incoming lubricant at the bulk temperature of the differential bath. At the end of the meshing cycle, the temperature of lubricant and the surfaces converge to that of the lubricant bath. The maximum temperature occurs at the maximum contact pressure, not the maximum sliding velocity. This is due to two effects; first compressive heating, and second the rise in lubricant viscosity due to increased pressures and subsequent higher shear heating.
Cross-sectional temperature profile for maximum and minimum loaded conditions along the minor axis of the contact ellipse during a meshing cycle.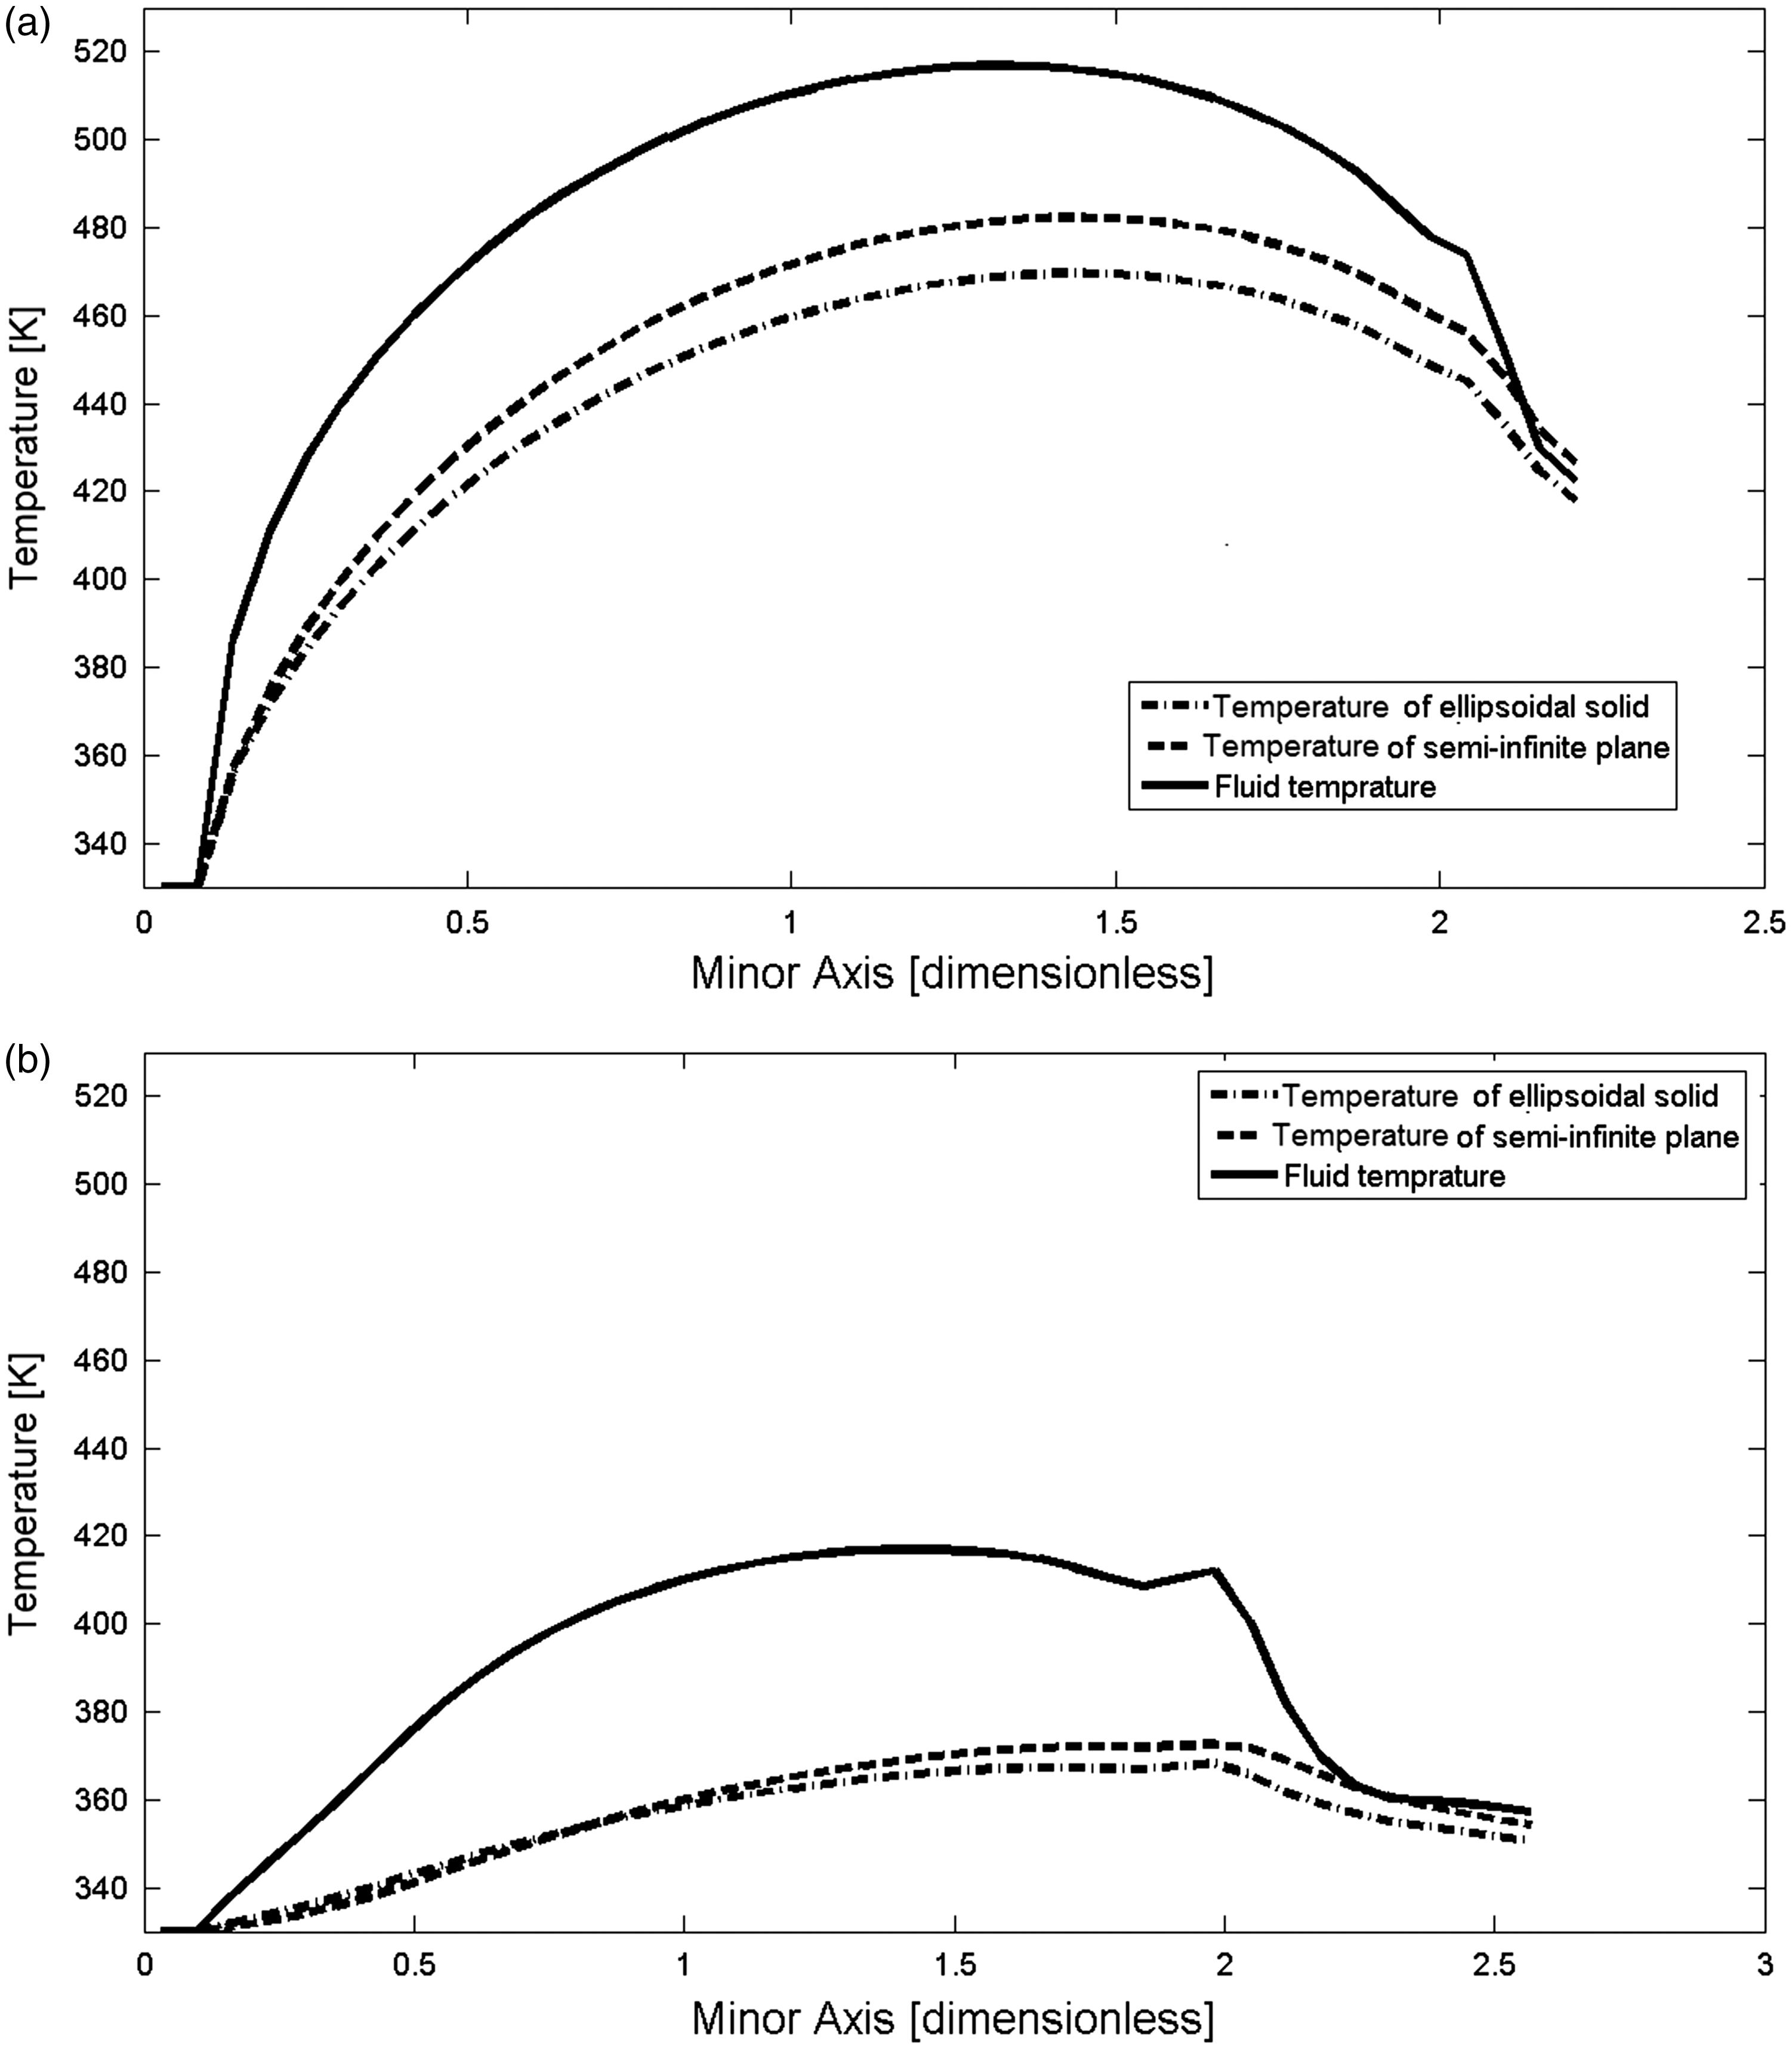
Figure 11 shows the maximum lubricant temperature in the contact as well as its maximum exit temperature. At any instant in the meshing cycle, the difference between these two temperatures is indicative of the lubricant heat loss mainly into the adjacent solid surfaces for the predicted thin lubricant films. The temperature variation of the surfaces closely follows that of the lubricant with lower values for the moving surface (semi-infinite plane) and the assumed stationary surface (the equivalent ellipsoidal solid). The surfaces conduct the heat to the assumed penetration depth of d (see boundary conditions (23)).This means that the lubricant exit temperature would always remain below that of the solid surfaces, as would be expected.
Transient variation in the lubricant and solid surface temperatures for a meshing cycle.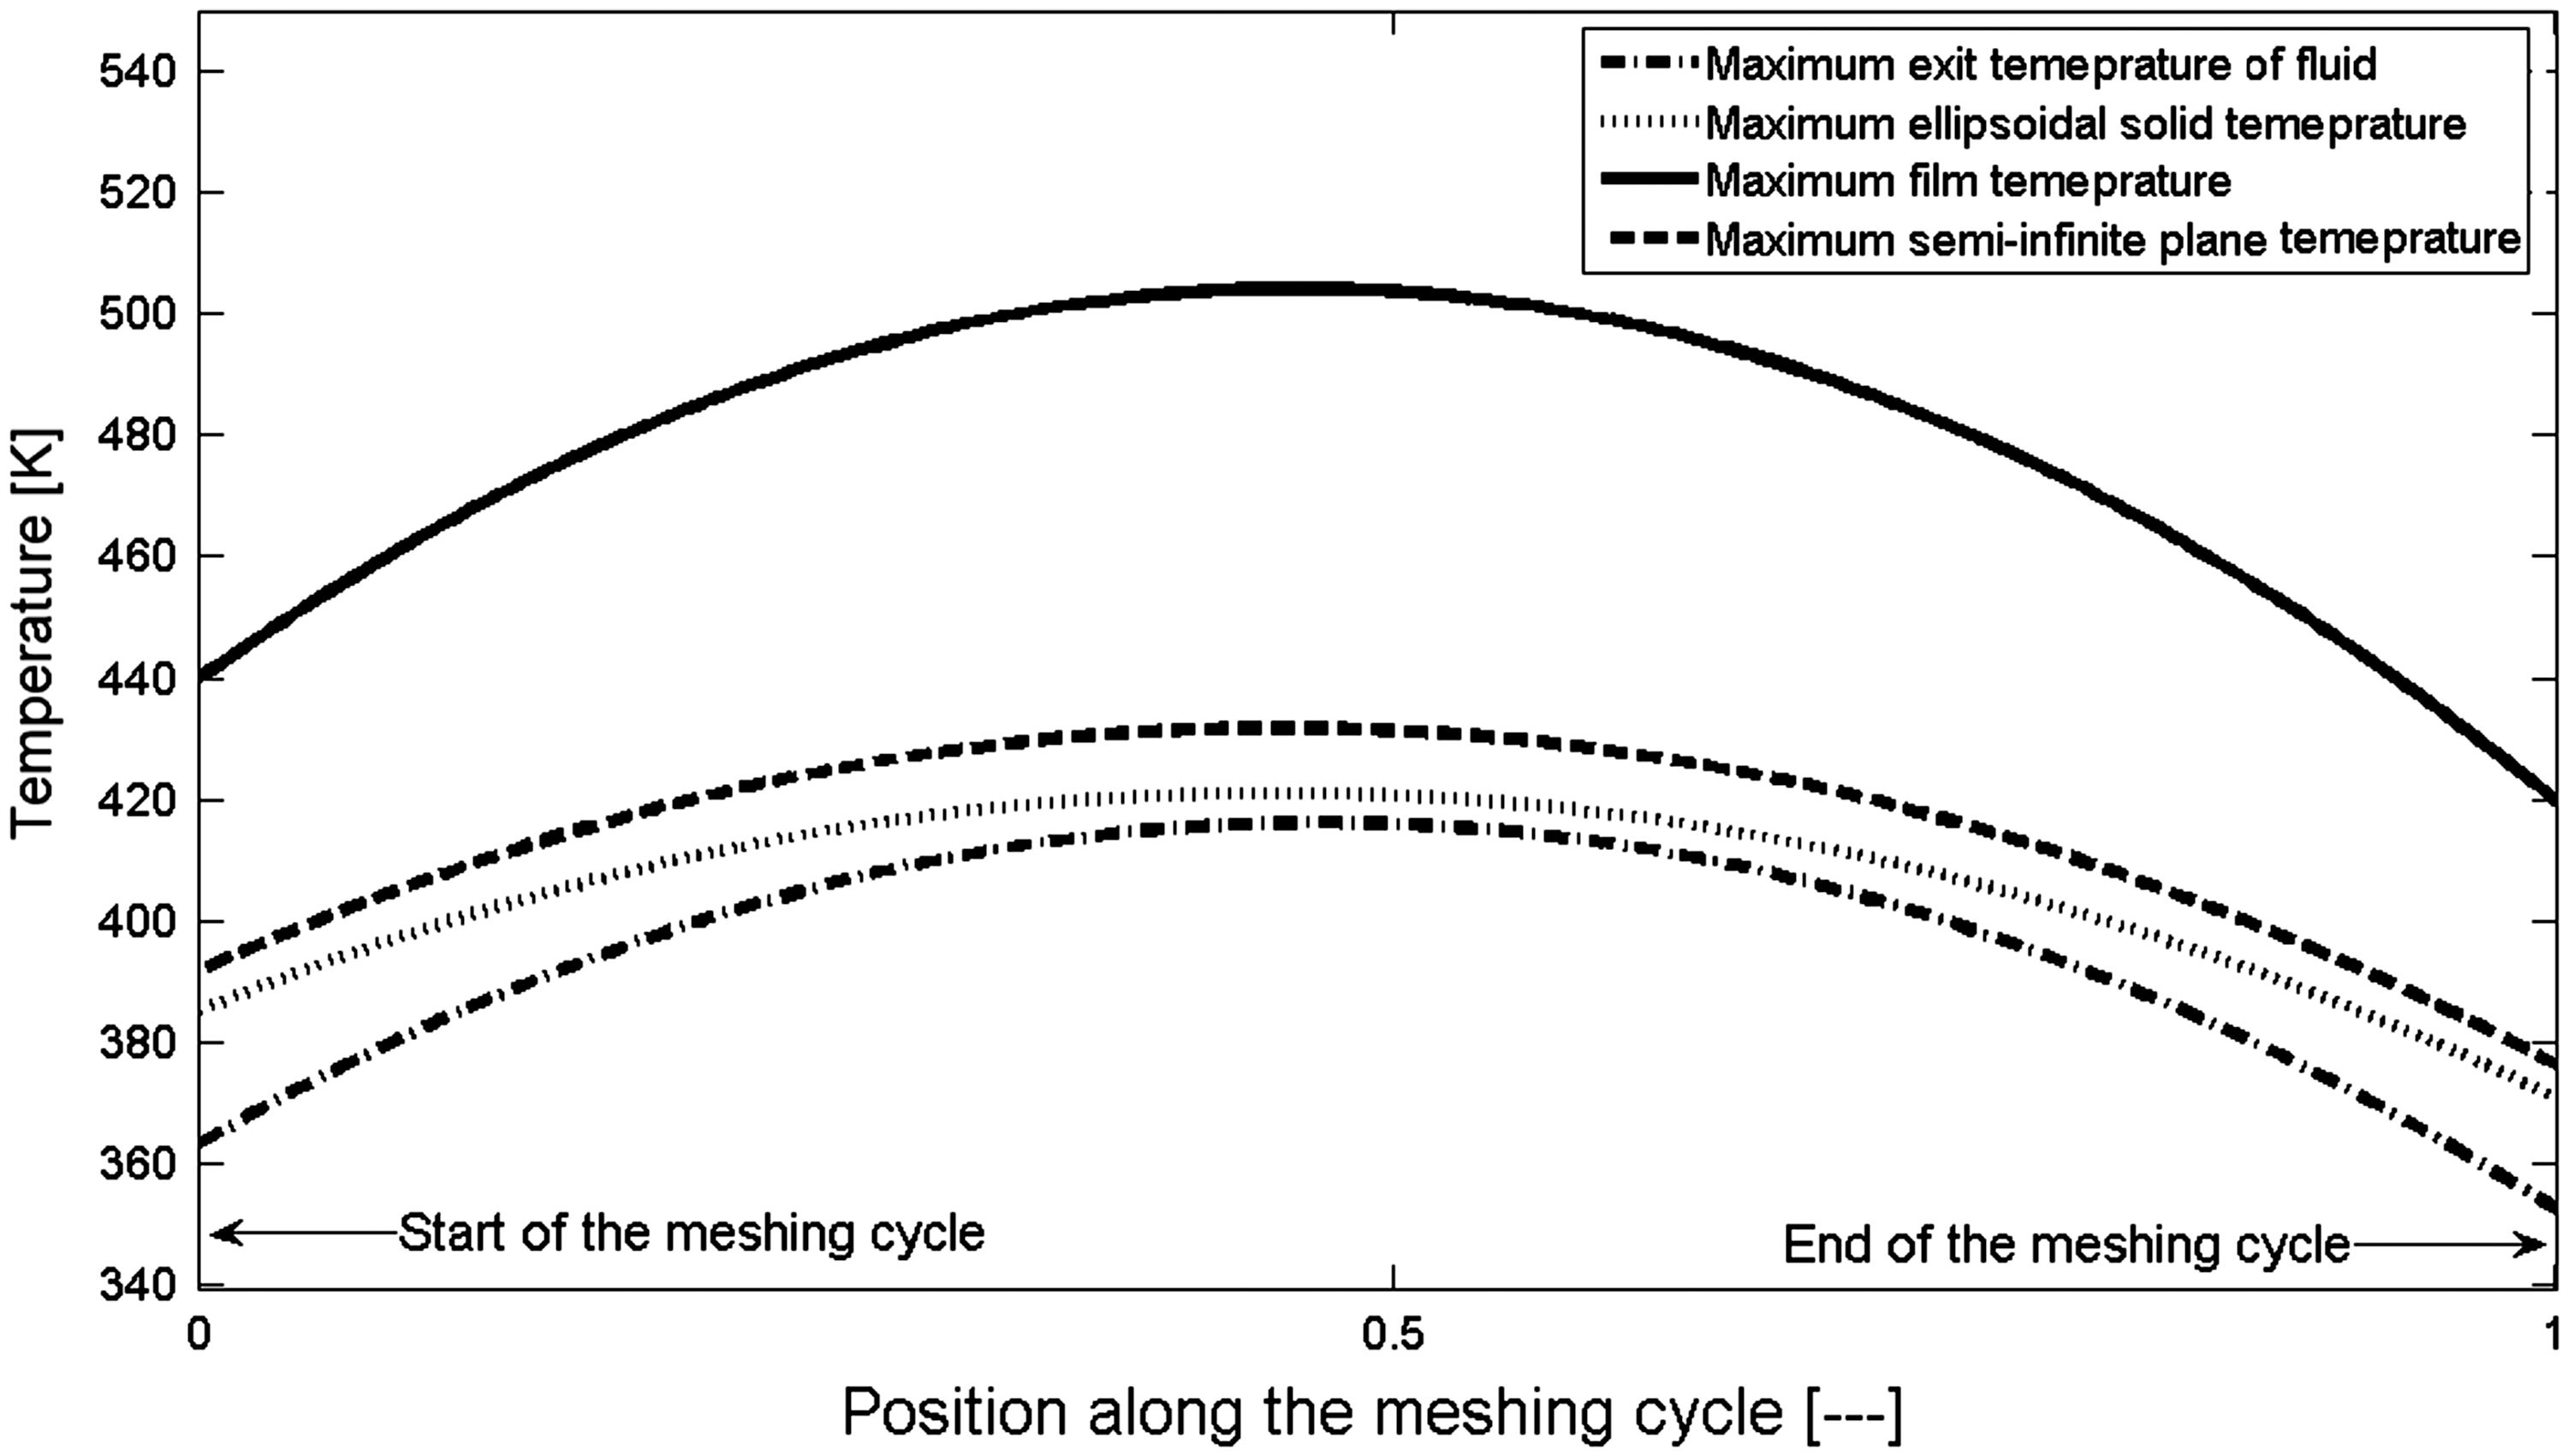
As already noted in the Introduction section, reduction of friction (thus, improved efficiency) is the primary objective in transmission engineering. Therefore, prediction of friction, comprising viscous shear and asperity interactions, is important. Figure 12 shows the viscous shear stress distribution along the minor axis of the contact ellipse through the mid major axis location. The Eyring shear stress limit is shown in the figure, together with the limiting shear stress of the lubricant (equation (8)) for given local pressure, p. The figure also includes the predicted shear stress for isothermal Newtonian and non-Newtonian analyses. It can be seen that in both cases, the shear stress distributions exceed both the Eyring and limiting shear stress, particularly excessively in the case of the former. This indicates that assumption of isothermal Newtonian behaviour cannot be upheld. When thermal effects are taken into account, more realistic shear distributions are predicted, because under isothermal non-Newtonian condition the shear stress is allowed to exceed its limiting value. The shear stress falls in the region between its Eyring value and the limiting shear. Therefore, the appropriate viscous shear stress characteristics is thermal non-Newtonian. At the end of the meshing cycle for lower contact load and sliding velocity, both thermal Newtonian and non-Newtonian shear stress distributions coincide and fall below Eyring shear stress. This indicates that for low to medium contact loads and sliding velocity, a thermal Newtonian traction regime may be assumed.
Shear stress distribution along the minor axis of contact ellipse.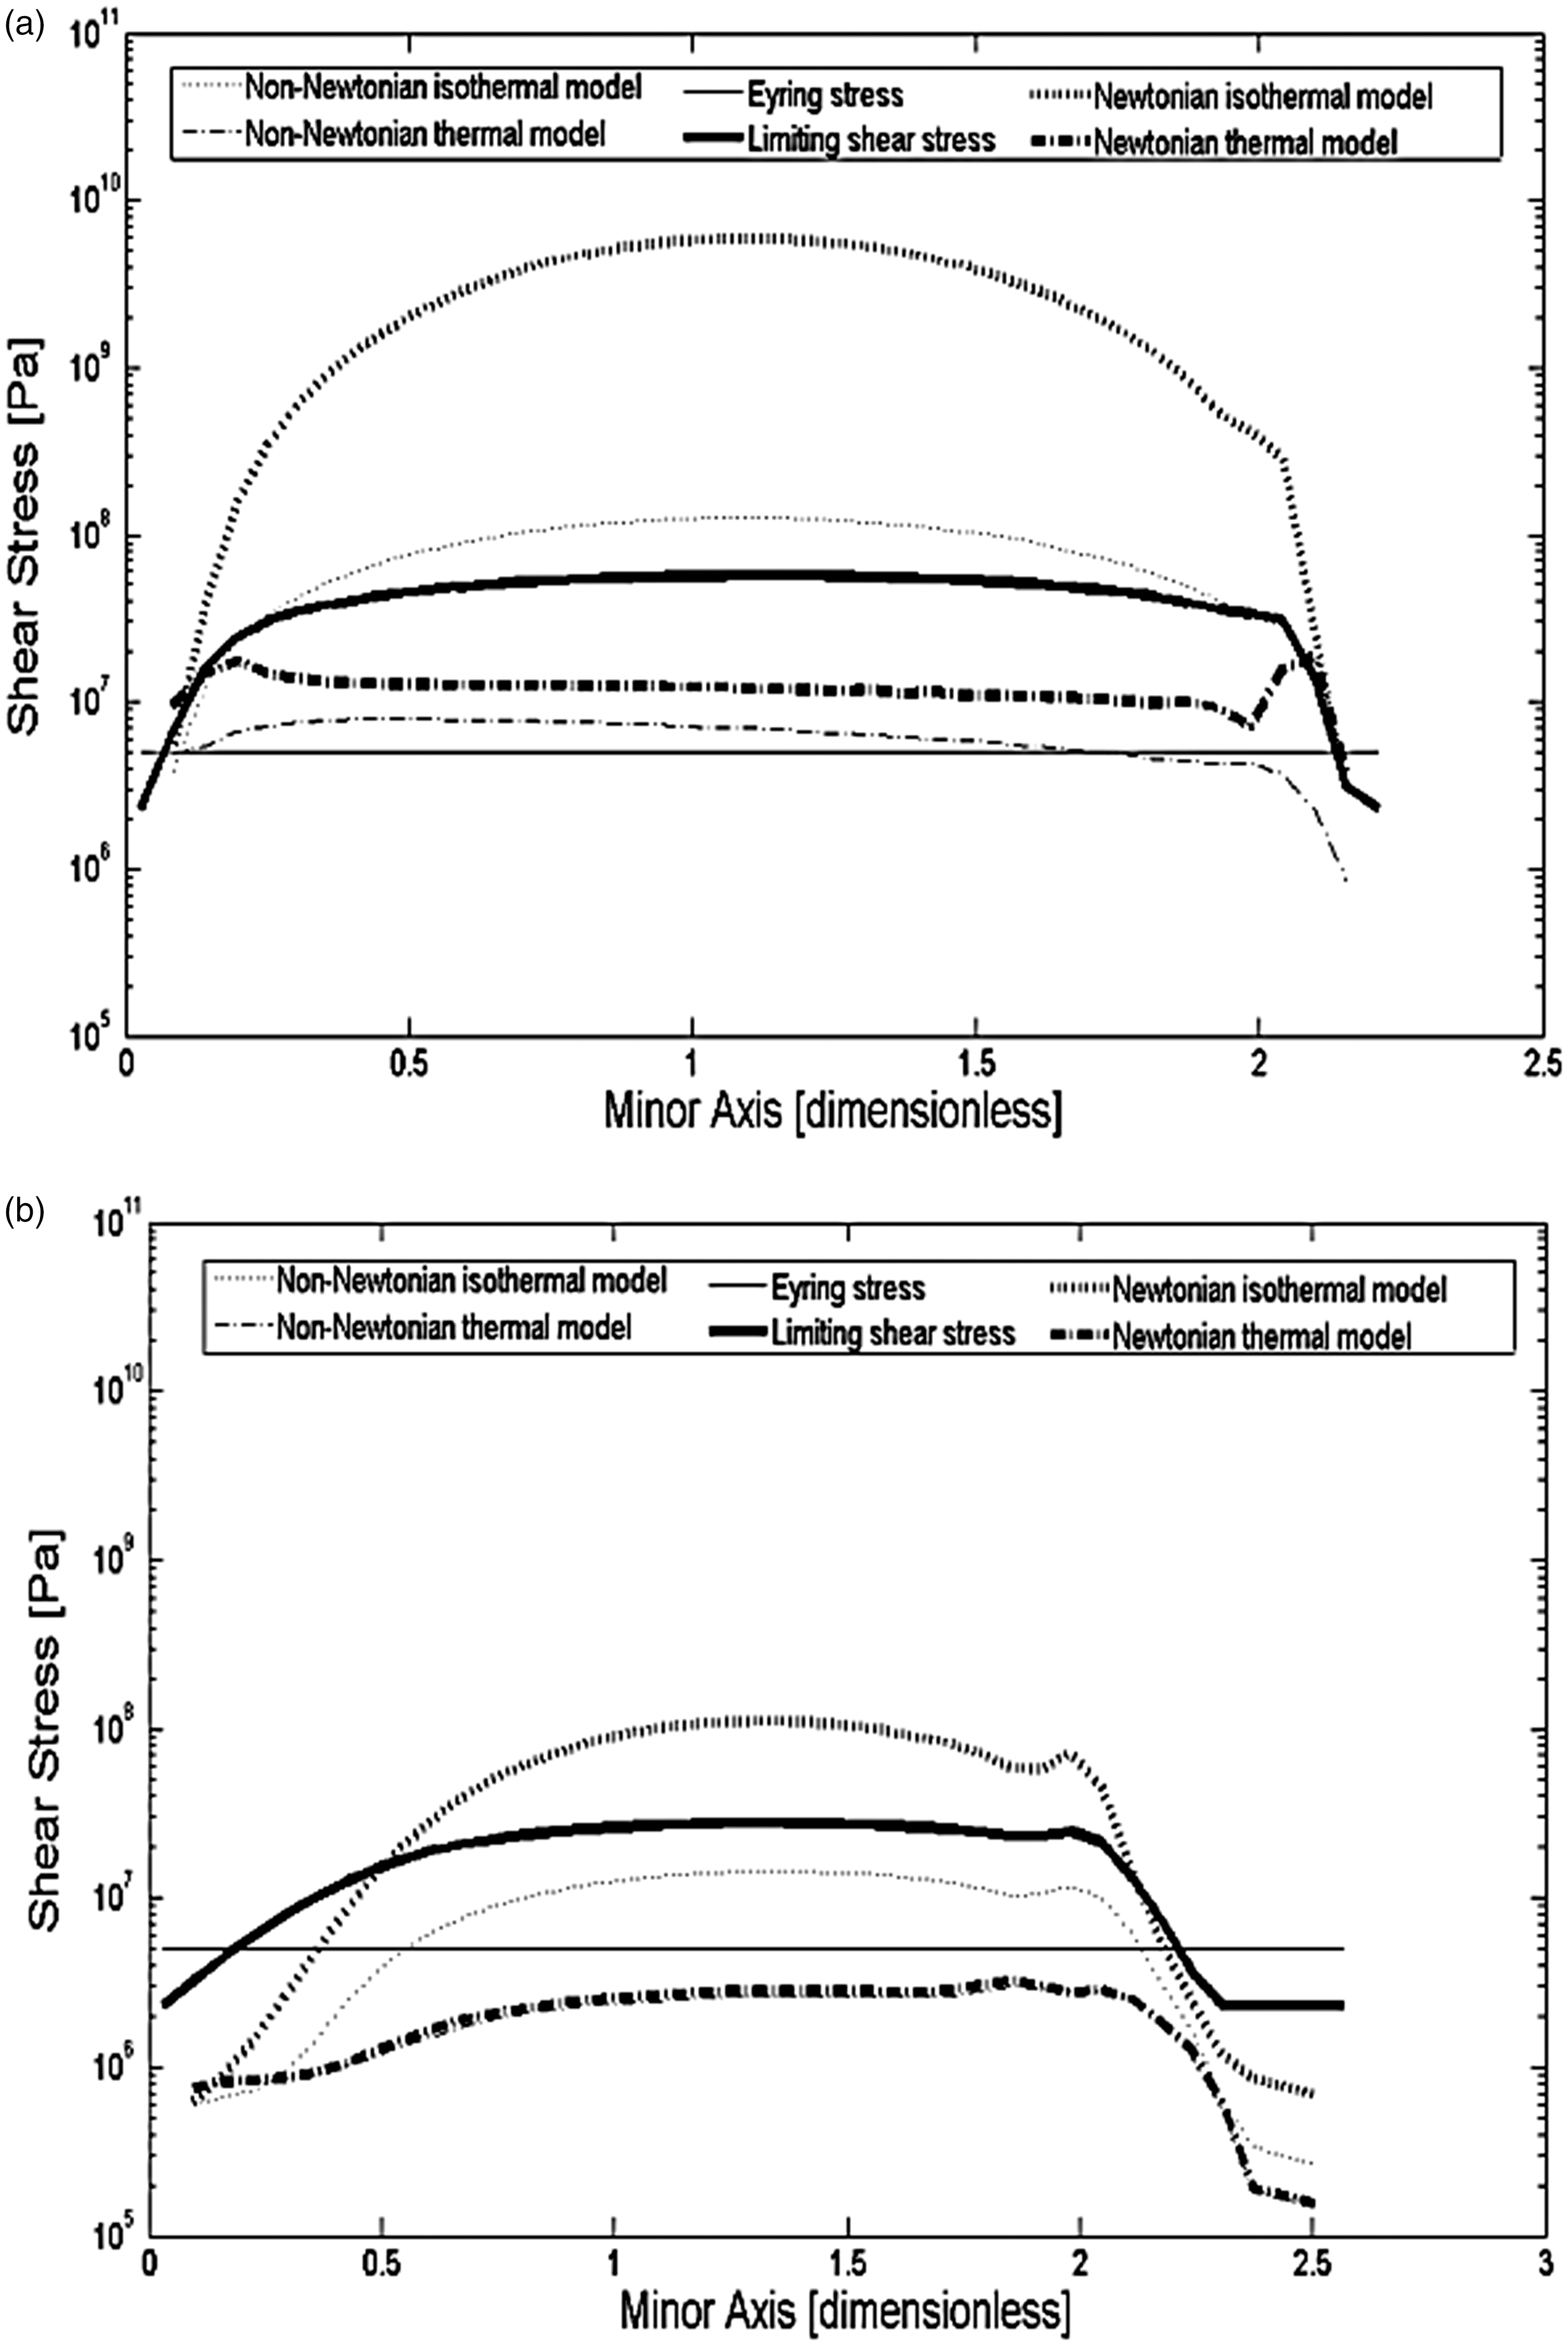
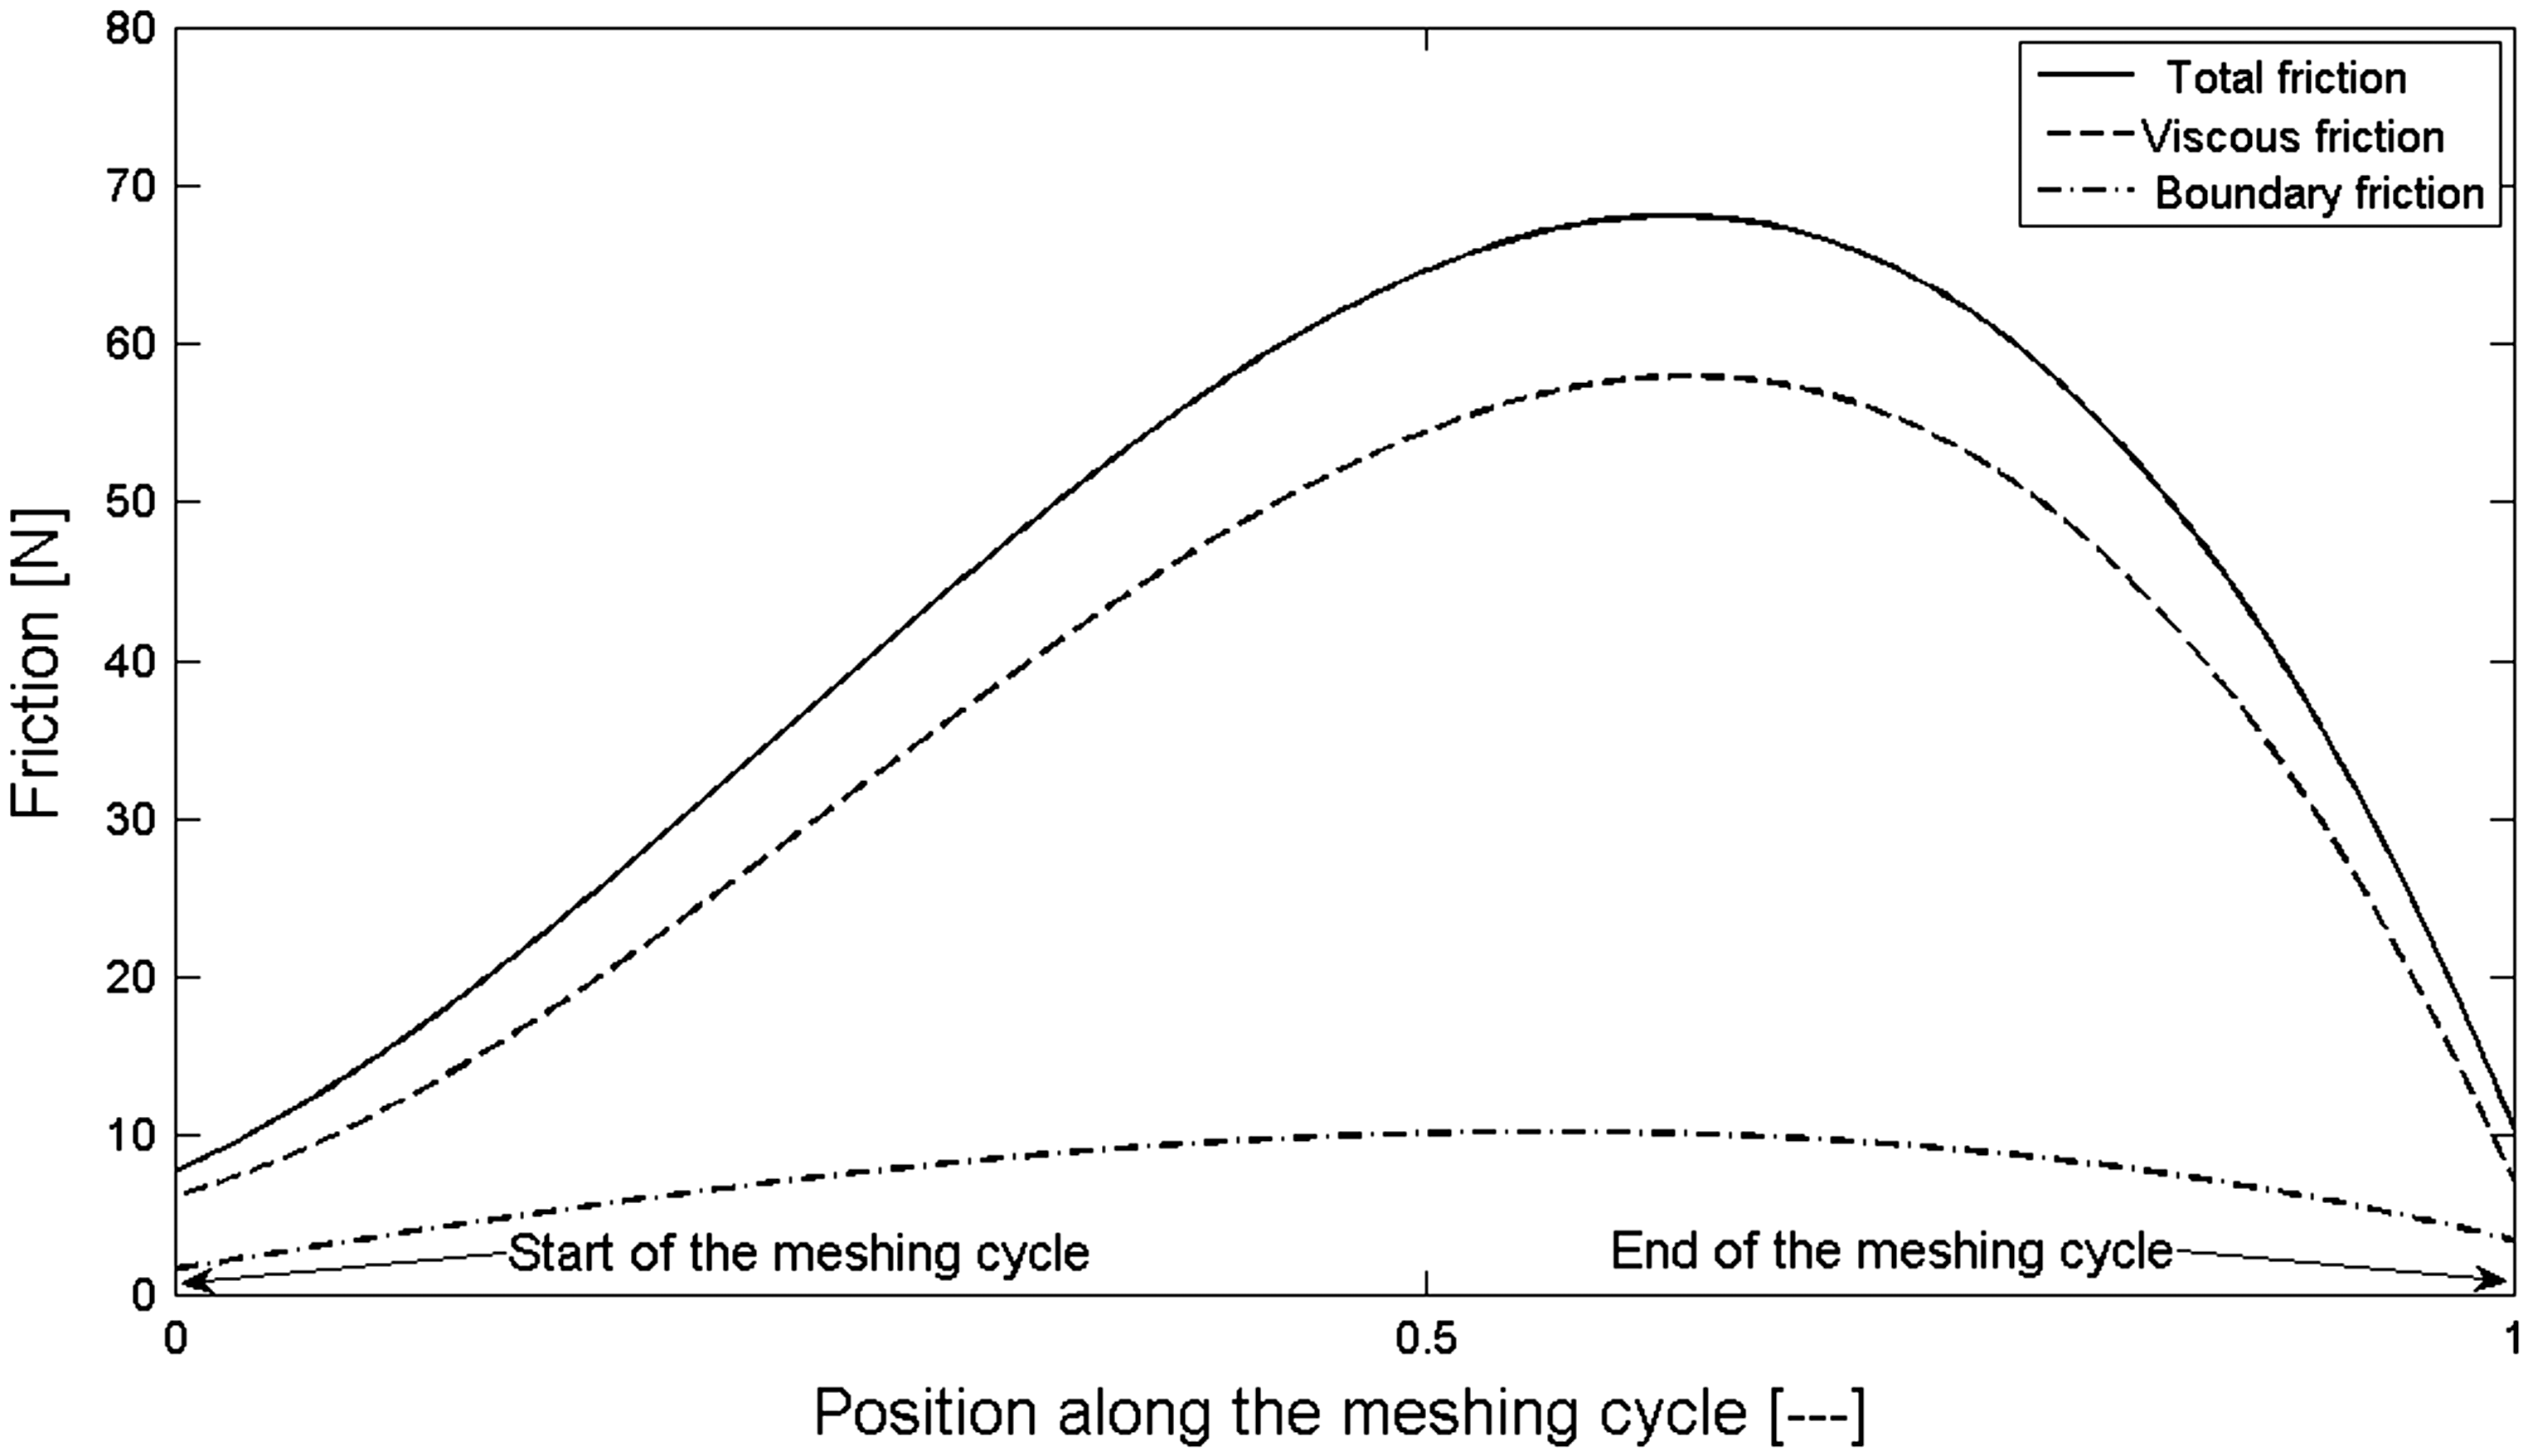
With predicted thin films, some of the load is carried by the interaction of asperities on the counter face surfaces. Figure 13 shows the asperity contact area as a proportion of the apparent area as well as the percentage of load carried by direct boundary interactions. These account for several percentage of the total contact area and contact load. The same is also true in the case of generated friction (Figure 14). The boundary friction contribution accounts for a larger proportion of generated friction at the beginning and at the end of the meshing cycle. This behaviour is as a result of complex interactions between several effects. Lower sliding velocities at the beginning and the end of meshing cycle leads to reduced shear rate and shear stress. On the other hand, this also leads to reduced shear thinning and a higher effective lubricant viscosity. Hence, a rise in shear stress as well as thicker film thickness would be expected, leading to reduced asperity interactions. A balance between these effects is found by the iterative numerical solution which is presented here.
Asperity contribution to contact conditions. Friction variation during a meshing cycle.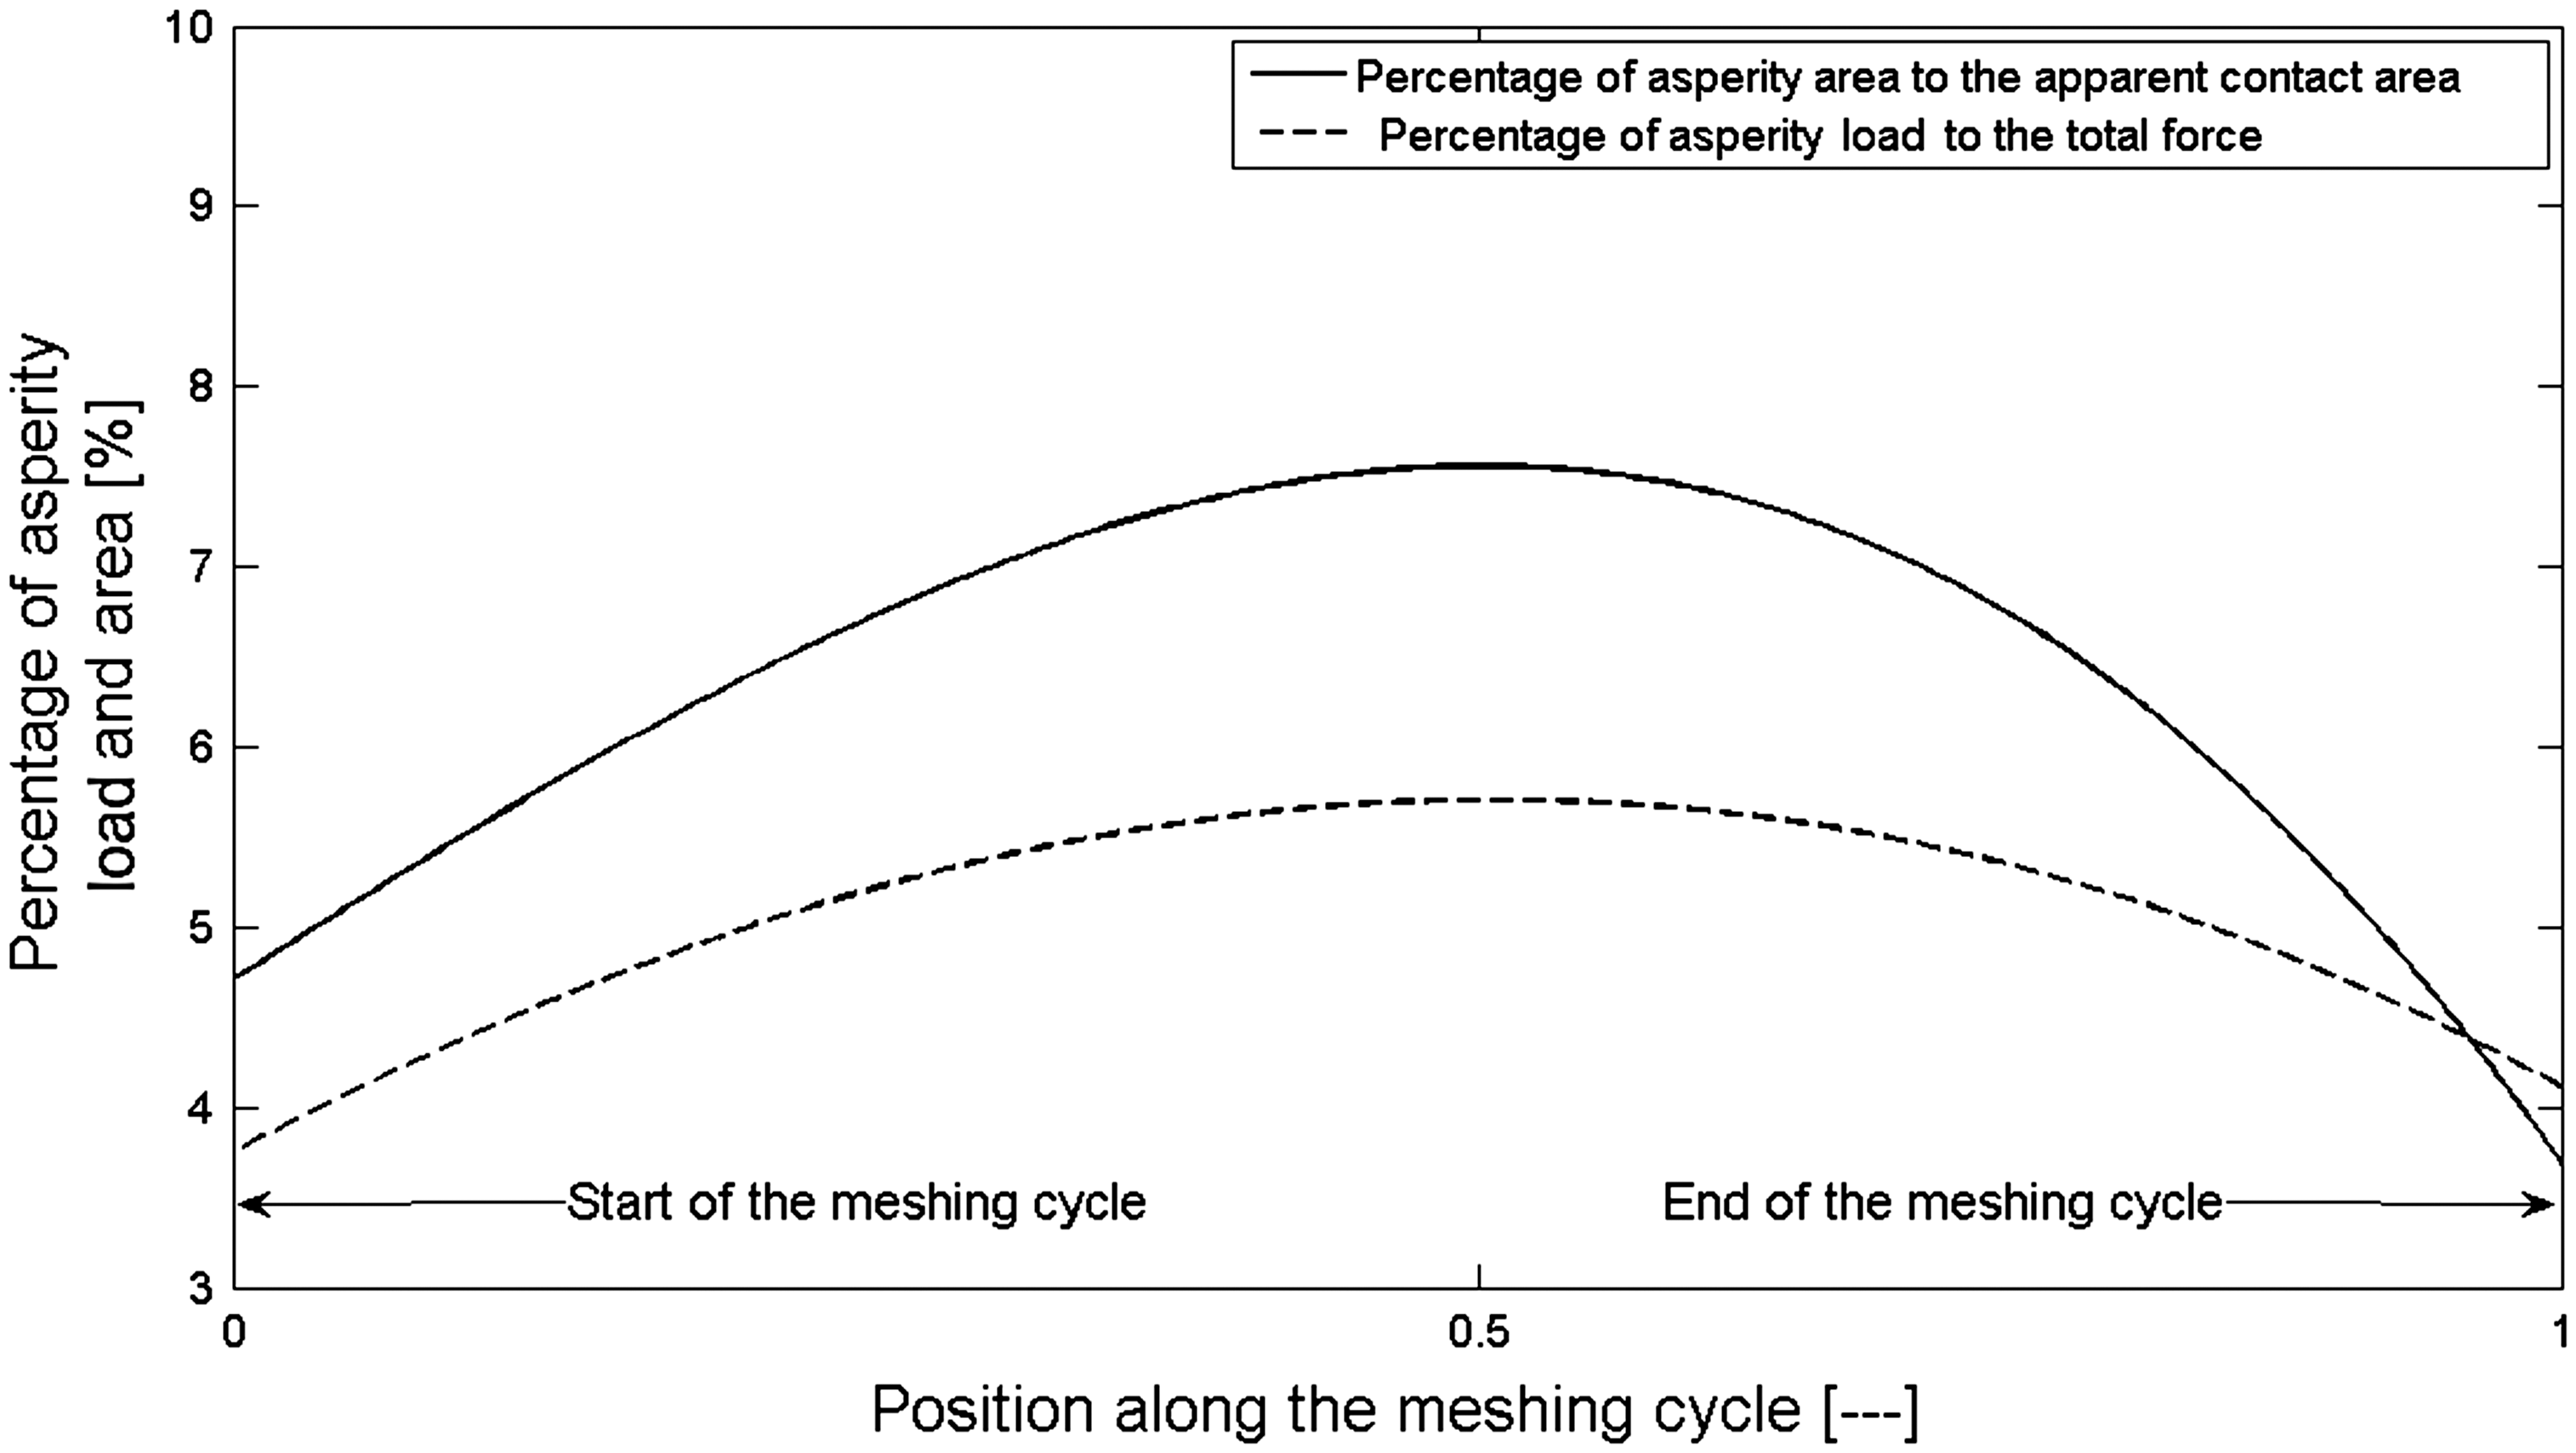
Finally, the variation of coefficient of friction is shown in Figure 15. For purely elastohydrodynamic conditions, one would expect a coefficient of friction < 0.05.
34
It also shows that a constant value cannot be assumed with such transient meshing conditions.
Variation of coefficient of friction during a meshing cycle.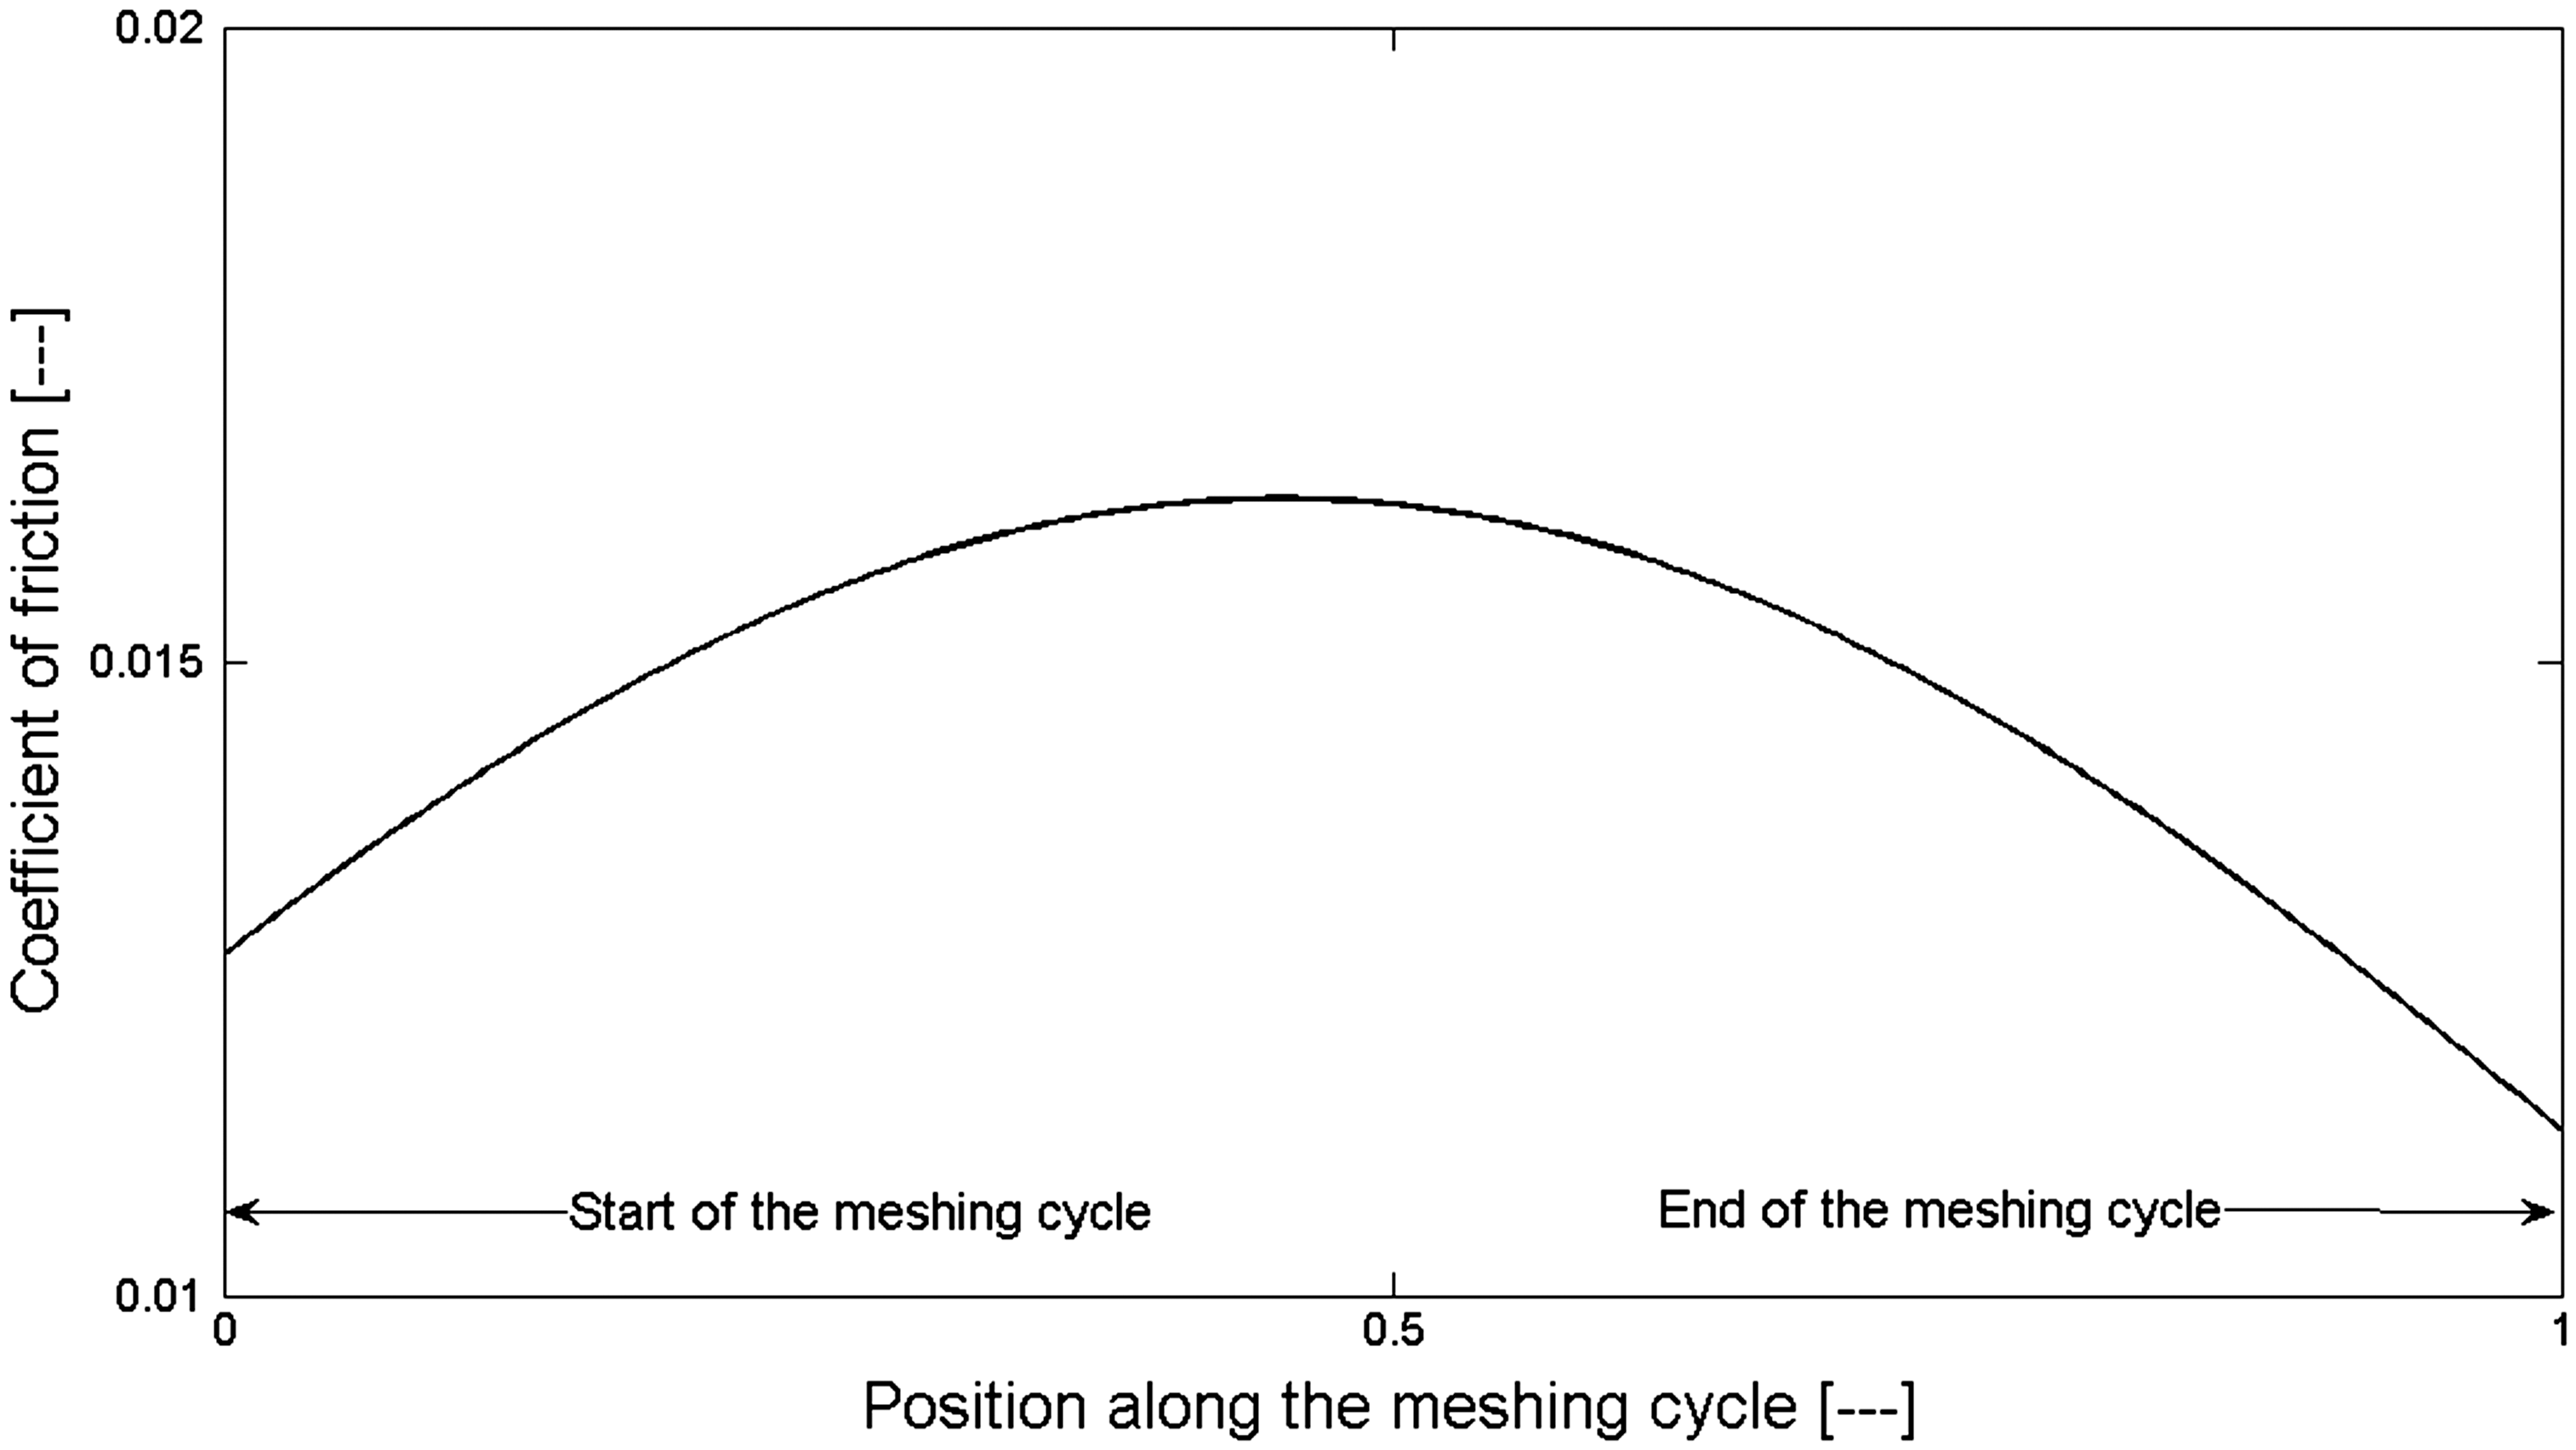
It is noteworthy that the isothermal Newtonian model yields high values of coefficient of friction, given higher predicted values of shear stress in Figure 14. Of course, this is not a realistic representation of the prevailing conditions.
Concluding remarks
The results show that under realistic driving conditions, the differential hypoid gear of a C-segment vehicle is subjected to high contact loads and thin elastohydrodynamic films of the order of the composite roughness of the contacting surfaces. Angled lubricant entrainment flow occurs into the elliptical contact footprint with significant side leakage flow out of the contact, resulting in thinning of the lubricant film. Furthermore, high rate of shear for the investigated conditions promotes non-Newtonian lubricant behaviour, as well as the generated temperature due to both compressive and shear heating. Thus, a realistic analysis should be mixed non-Newtonian thermo-elastohydrodynamics, such as the one reported in this paper. In fact, the analysis shows that asperity friction can account for up to 7–8% of the total friction. Nevertheless, the generated heat has a small effect on the film thickness relative to an isothermal analysis, except for the minimum film thickness as the result of reduced lubricant viscosity with the generated temperature and shear thinning. The effect of temperature is more pronounced on the viscous shear stress distribution, indicating lubricant shear stress residing within the Eyring regime of traction, unlike unreasonable predictions with an isothermal analysis exceeding the lubricant limiting shear stress. It should be noted that the current analysis does not take into account the heat generated as the result of local interaction of counterface asperities. The inclusion of this constitutes a future development of the model. One should also note that the presented model can be enhanced by incorporating more recent rheological models as described in literature.35,36
Footnotes
Acknowledgement
The authors would like to express their gratitude to Advanced Numerical Solutions Inc. for access to the TCA tool CALYX.
Declaration of Conflicting Interests
The author(s) declared no potential conflicts of interest with respect to the research, authorship, and/or publication of this article.
Funding
The author(s) received no financial support for the research, authorship, and/or publication of this article.