
Abstract
Increasingly stringent legislation controlling vehicular emissions is motivating research to maximise engine efficiency. The frictional power loss associated with the ring pack–cylinder interface is one such focus. In addition to this, increased reliance on simulation to predict the lubrication characteristics requires that numerical codes model the physical situation accurately and reliably. Experimental validation provides the crucial role of assessing performance and lubricant film thickness provides a key comparable parameter. This paper outlines oil film thickness results obtained from the compression ring–cylinder interface of a fired, single-cylinder gasoline engine using a method based on ultrasonic reflection. The magnitudes of the film are discussed and compared with work published by other experimental investigators using alternative techniques.
Introduction
The piston assembly of an internal combustion engine is responsible for up to 50% of the total friction loss of the engine.1,2 As automotive manufacturers continue to strive for more efficient vehicles, the engine is seen as a key system to drive improvements in friction losses, enabling improved fuel consumption and reduced CO2 emissions. A significant portion of friction loss occurs between the piston rings and cylinder and efforts are being made to optimize the lubrication between these contacts.
Bench-top reciprocating rigs and full-scale test engines are required to validate computer models created to predict tribological conditions in the piston during operation. 3 Various methods have been implemented to measure the oil film thickness between ring pack and cylinder wall: capacitative,4–6 laser-induced fluorescence (LIF),7–12 induction 13 and resistance,14,15 each of which has associated strengths and weaknesses. 16 Ultrasonic measurement represents another route which has been successfully demonstrated for skirt measurements in Dwyer-Joyce et al. 17 and simultaneous skirt and compression ring measurements in Mills et al. 18 This study aims to expand and improve measurements at the compression–ring liner junction of a high-performance engine and propose a method to account for the relative size of the sensing element, when compared to the width of the ring.
Background to ultrasonic technique
Reflected ultrasound signals can be used to determine lubricant film thickness using one of three approaches: time of flight (TOF) for very thick films, the resonant-layer model for intermediate films or the spring-layer model for very thin films (typically sub 20 µm). 19 The piston ring–oil-liner contact outlined in this paper has been modelled using the spring-layer model. The stiffness of a fluid layer, K, is dependent on its bulk modulus, B, and thickness, h, such that ultrasonic transmission increases inversely with layer thickness, K = B/h. 20
The proportion of the pulse reflected from the layer is referred to as the reflection coefficient and is calculated from the film stiffness, K, and acoustic impedance, Z, of the materials bounding the film and ultrasonic angular frequency, ω
21
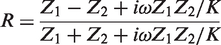
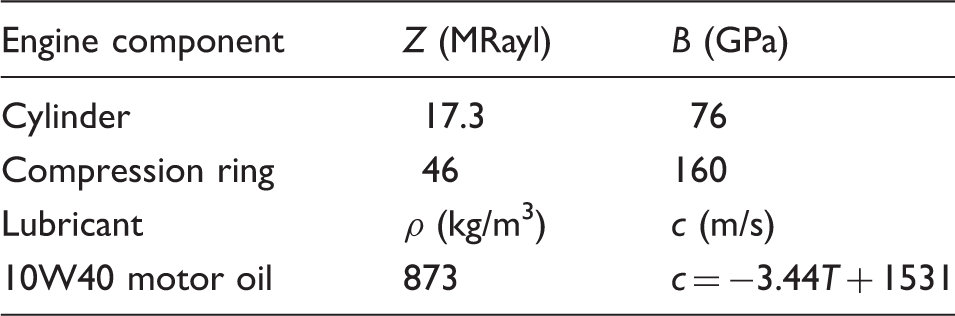
To solve equation (1), the bulk modulus must be known but is not always readily available. It can be found using the relationship B = c2ρ, where c is the measured speed of sound of the fluid and ρ is its density. The speed of sound is obtained by using an oil-filled chamber of known dimensions. The time-of-flight of an ultrasonic pulse over this known distance can then be used to find c. It is assumed that B in the contact is similar to that at ambient pressure. This approach too, is used to obtain the speed of sound within the engine components (using a section of know thickness). Acoustic impedance of the engine components is then the product of its speed of sound and density. It is assumed that B in the contact is similar to that at ambient pressure. The lubricant layer stiffness can now be rewritten in terms of known properties ρ and c. By substituting this relationship into equation (1) and rearranging, the film thickness can be found using the following equation
Materials and methods
Apparatus
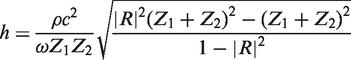
Selected Honda CRF450R engine specifications.
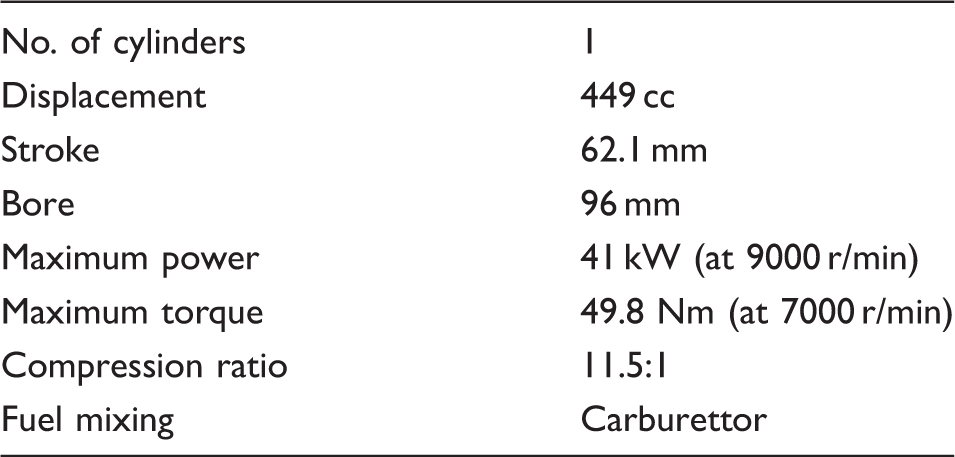
The engine was instrumented to measure crank speed, mean torque, in-cylinder pressure and sump temperature. The temperature was recorded at the start and conclusion of each test run. In-cylinder pressure was measured using a head-mounted pressure transducer. The temperature and torque were displayed by a transient AC dynamometer that was coupled to the gear box of the engine. The dynamometer could be run in absorbing mode for fired tests or driving for motored tests and provided stable speed and load conditions. Figure 1 shows the situated engine and measured signal pathways.
(a) engine test apparatus and (b) signal pathway schematic.
Materials
Engine component and lubricant acoustic properties.
Ultrasonic instrumentation
To generate and receive the ultrasonic pulses, piezoelectric elements were used, mounted onto the exterior surface of the cylinder. Three windows were machined into the standard block of the CRF450R engine on the thrust, anti-thrust and neutral sides of the water jacket in order to expose the exterior surface of the cylinder. To facilitate mounting of the sensors, flats were machined onto the exposed surfaces after which, fifteen piezoelectric elements were mounted axially along the cylinder length, spaced to give increased resolution around TDC (as shown in Figure 2).
Schematic showing sensor placement on the exterior surface of the engine.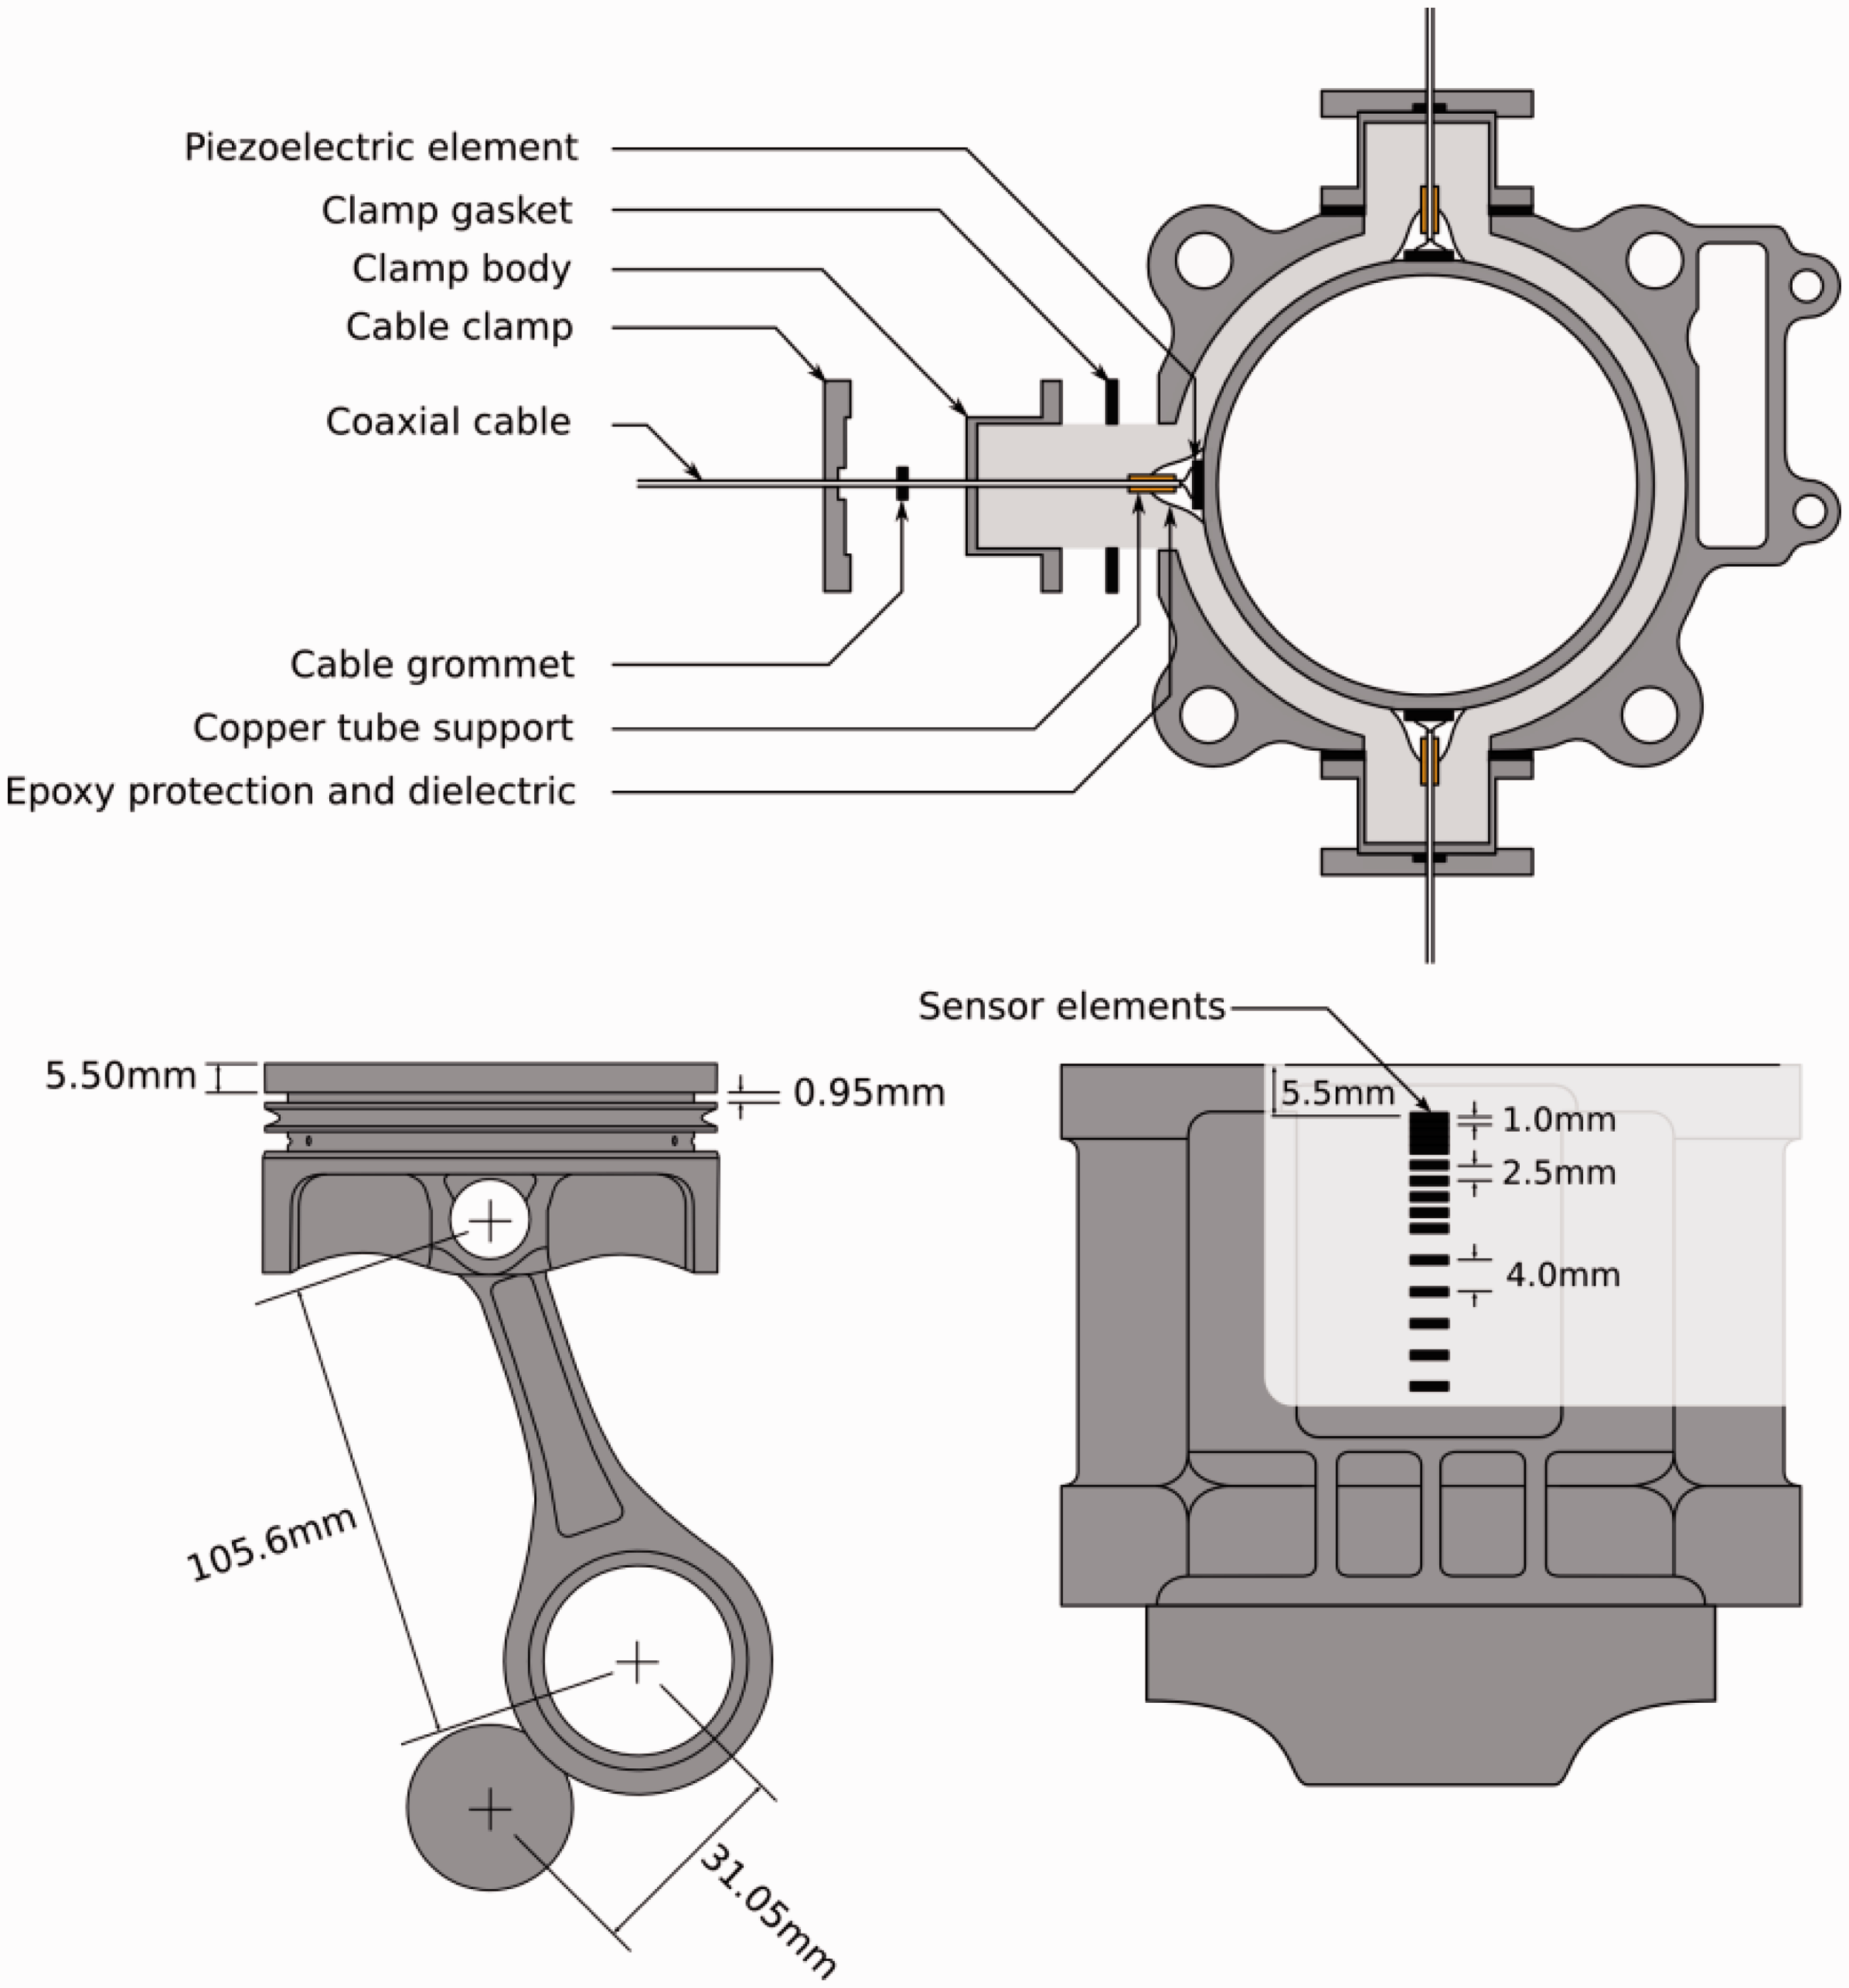
The piezoelectric (lead–zirconate–titinate) elements used had a thickness of 0.2 mm, corresponding to a central excitation frequency of 10 MHz and were cut to form strips of 1 mm × 5 mm to enhance their spatial resolution. The sensors were bonded to the liner using a high-temperature strain gauge adhesive having an upper operational temperature limit of 250 ℃ and wired with shielded coaxial cable. Sealing against the cooling water was achieved using a high temperature epoxy to cover the elements while casings were fabricated to route the wires out of the water jacket. It should be noted that the effect of the curvature of the barrel has an equal influence on both the reference and measurement ultrasonic signals. This influence was effectively removed as a consequence of the normalising procedure, when calculating the reflection coefficient.
Procedure
Fired engine tests were carried out at 3200 r/min under both high and low load conditions. During high load testing, generated torque was 36 Nm and low load torque generation was 25 Nm.
The response of each sensor varied owing to subtle differences introduced during wiring and bonding operations. Therefore, prior to testing, each element was characterised to ensure optimal pulsing was achieved. During the experimental runs, the elements were pulsed at a rate of 80 kPulse/s and the reflected wave digitized at a rate of 100 MSamples/s. A total of eight sensors per side were monitored (24 in total), each sensor being pulsed continuously for a period of 2 s over the acquisition period. A remotely operated multiplexer was used to switch the different elements. The reflected signals were streamed to the hard disk of a PC for post-processing.
Analysis
During this sequence of tests, it was not possible to synchronously acquire both ultrasound and shaft positional measurements, though during the 2 s capture period, film thickness measurements from 26 full engine cycles were recorded. A routine was written in LabVIEW to extract the measurement sequence from a single cycle (user selected) and identify other sequences by cross-correlation (in a similar manner to that described in Mills et al. 18 ). On average, this resulted in approximately 20 identified cycles per sensor dataset. Identification of the individual strokes was achieved by considering in-cycle shaft speed variation and high-pressure ring loading during the combustion stroke, visible in the reflected signals.
The fast Fourier transform (FFT) was applied to the reference and ring contact signals to yield variation of pulse amplitude with ultrasonic frequency (Figure 3). The reflection coefficient was calculated using from the FFT amplitude ratios using the region within −6 dB bandwidth to optimise signal-to-noise ratio.
Reflected ultrasound: (a) time domain signal and (b) frequency content.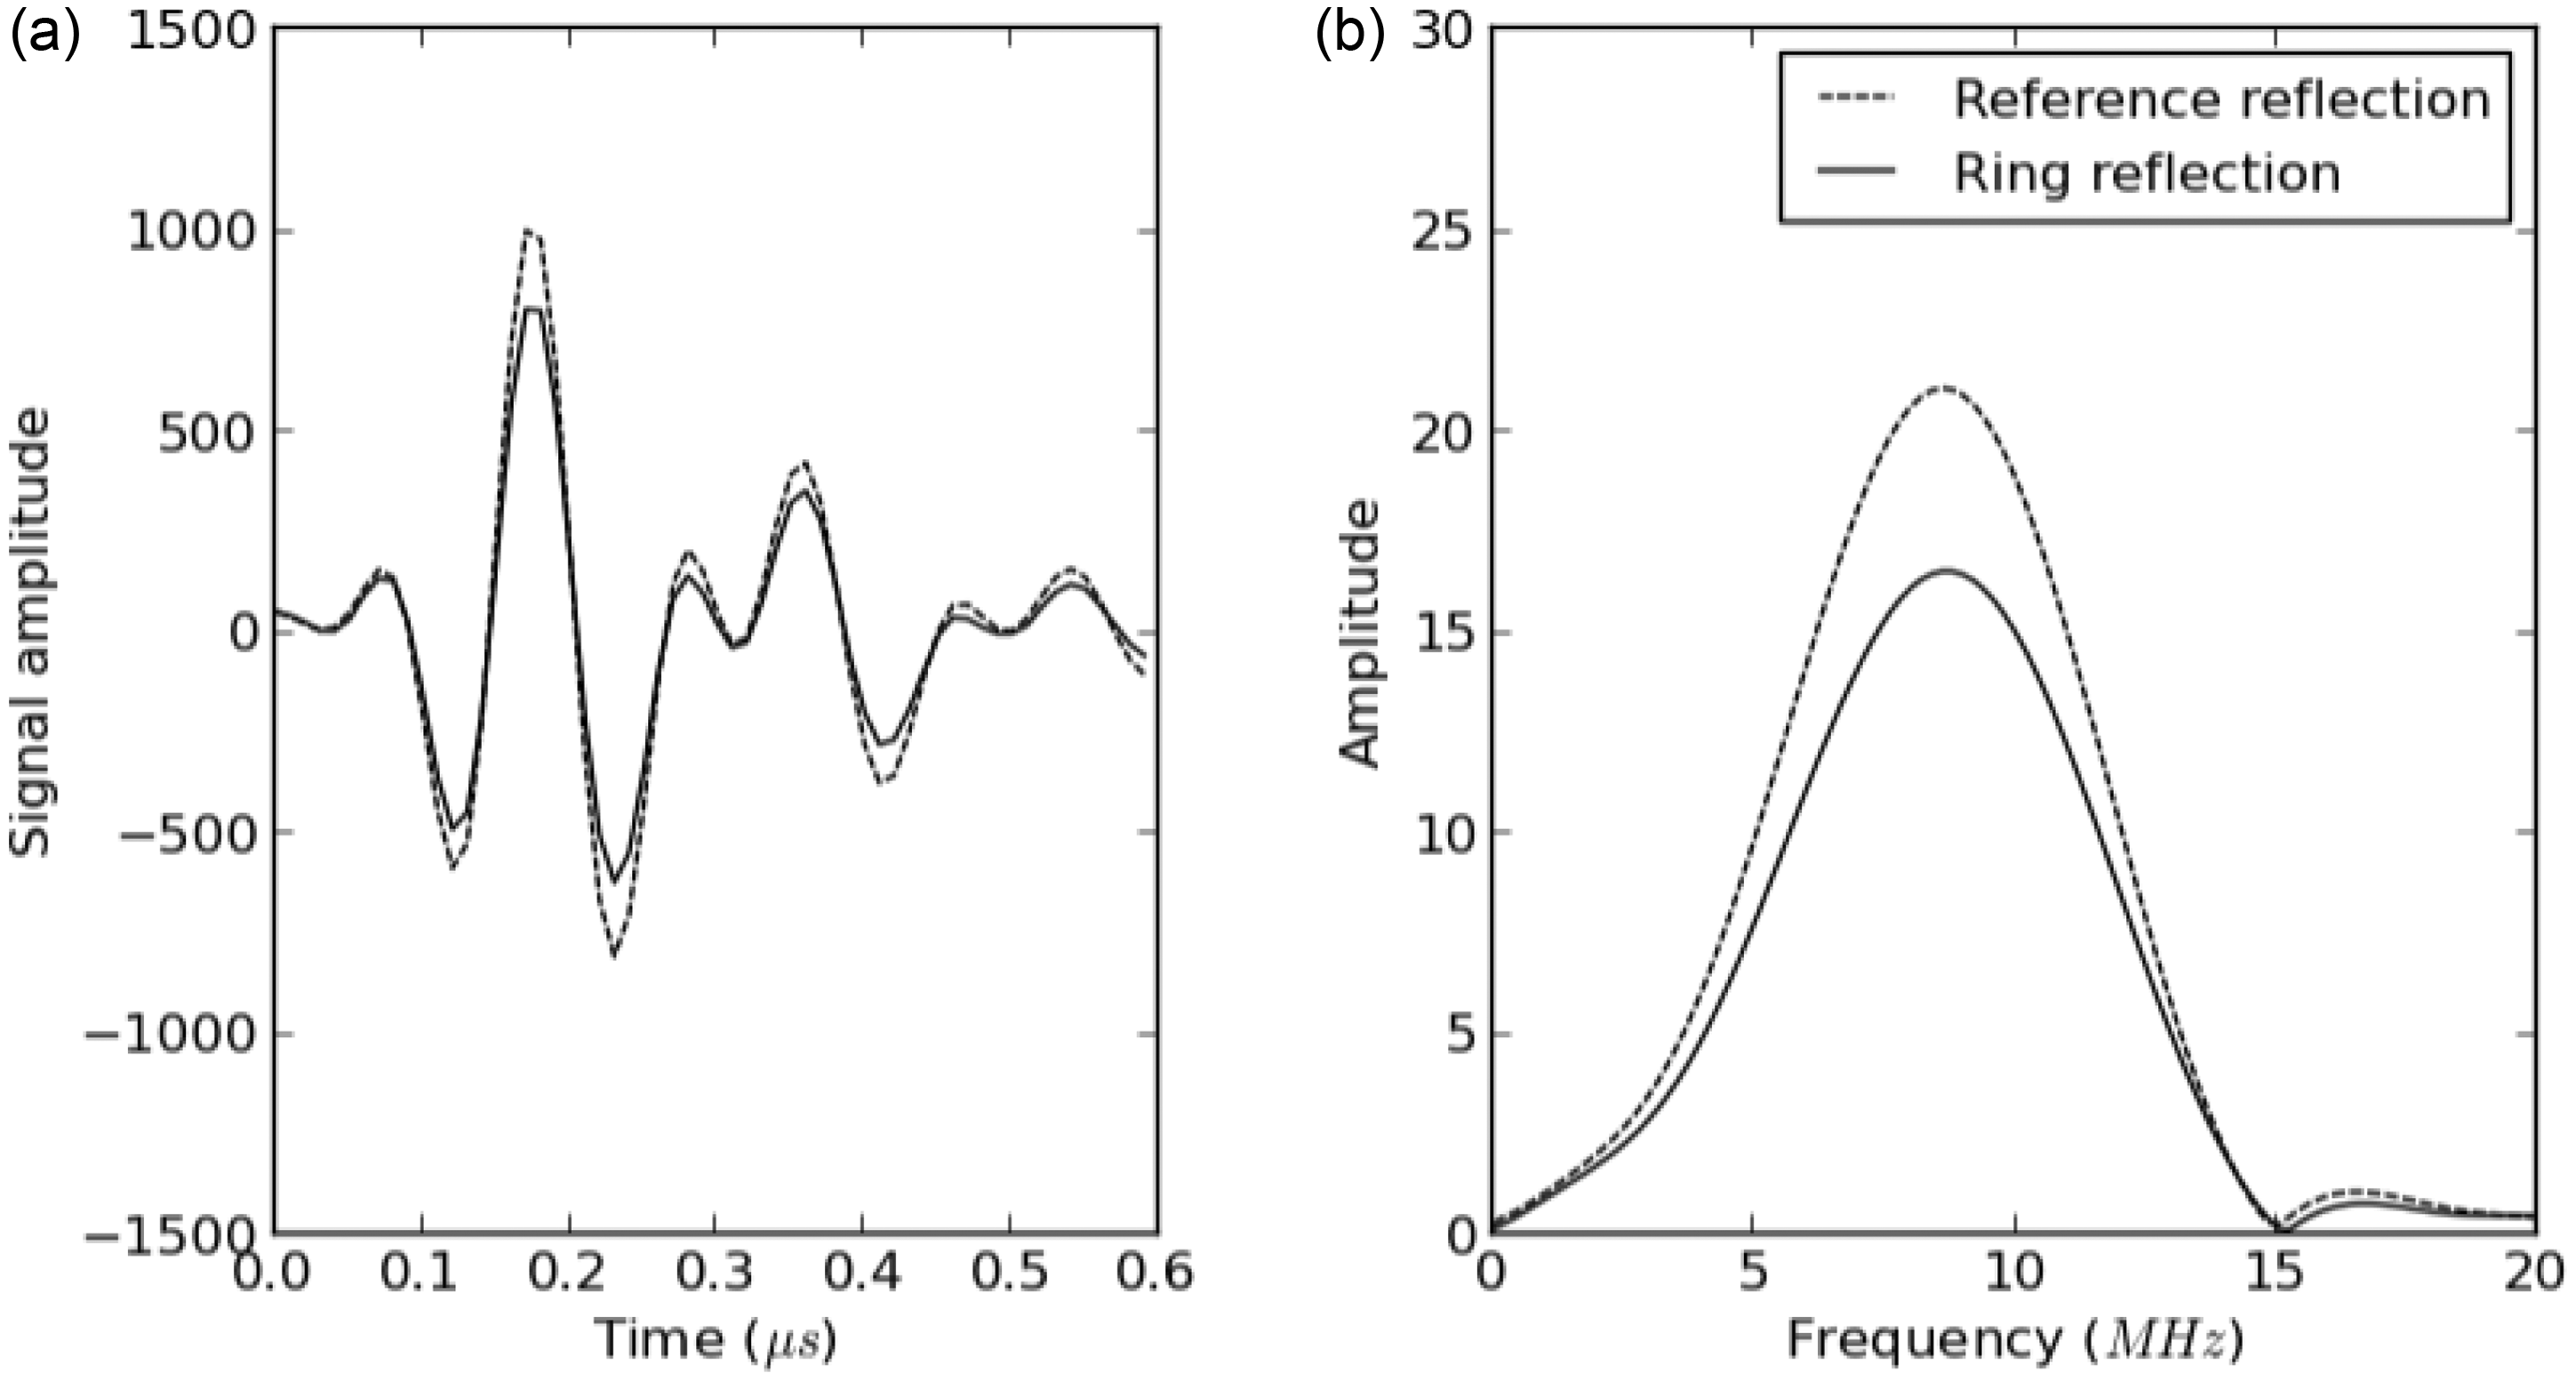
For each sensing element, the reflected signals corresponding to the passage of the compression ring were identified for the combustion and compression strokes, an example of which can be seen in Figure 4. A reference reflection was taken from measurements of the air–cylinder interface and used as the incident signal. Due to the acoustic mismatch of the interface materials (air and steel), almost the entire signal was reflected. This reference was obtained by identifying pulses not involved with a fluid film (i.e. when the piston is not adjacent to the sensing element). The air interface is observed most often during testing so the modal value of the maximum peak to peak values of all the reflected pulses was taken. All signals falling within ± 1% of the modal value were averaged to determine the reference reflection.
Example trace showing one full engine cycle. Passage of individual piston elements are shown (note that non-linear crank angle results from variable rotational speed within single cycle).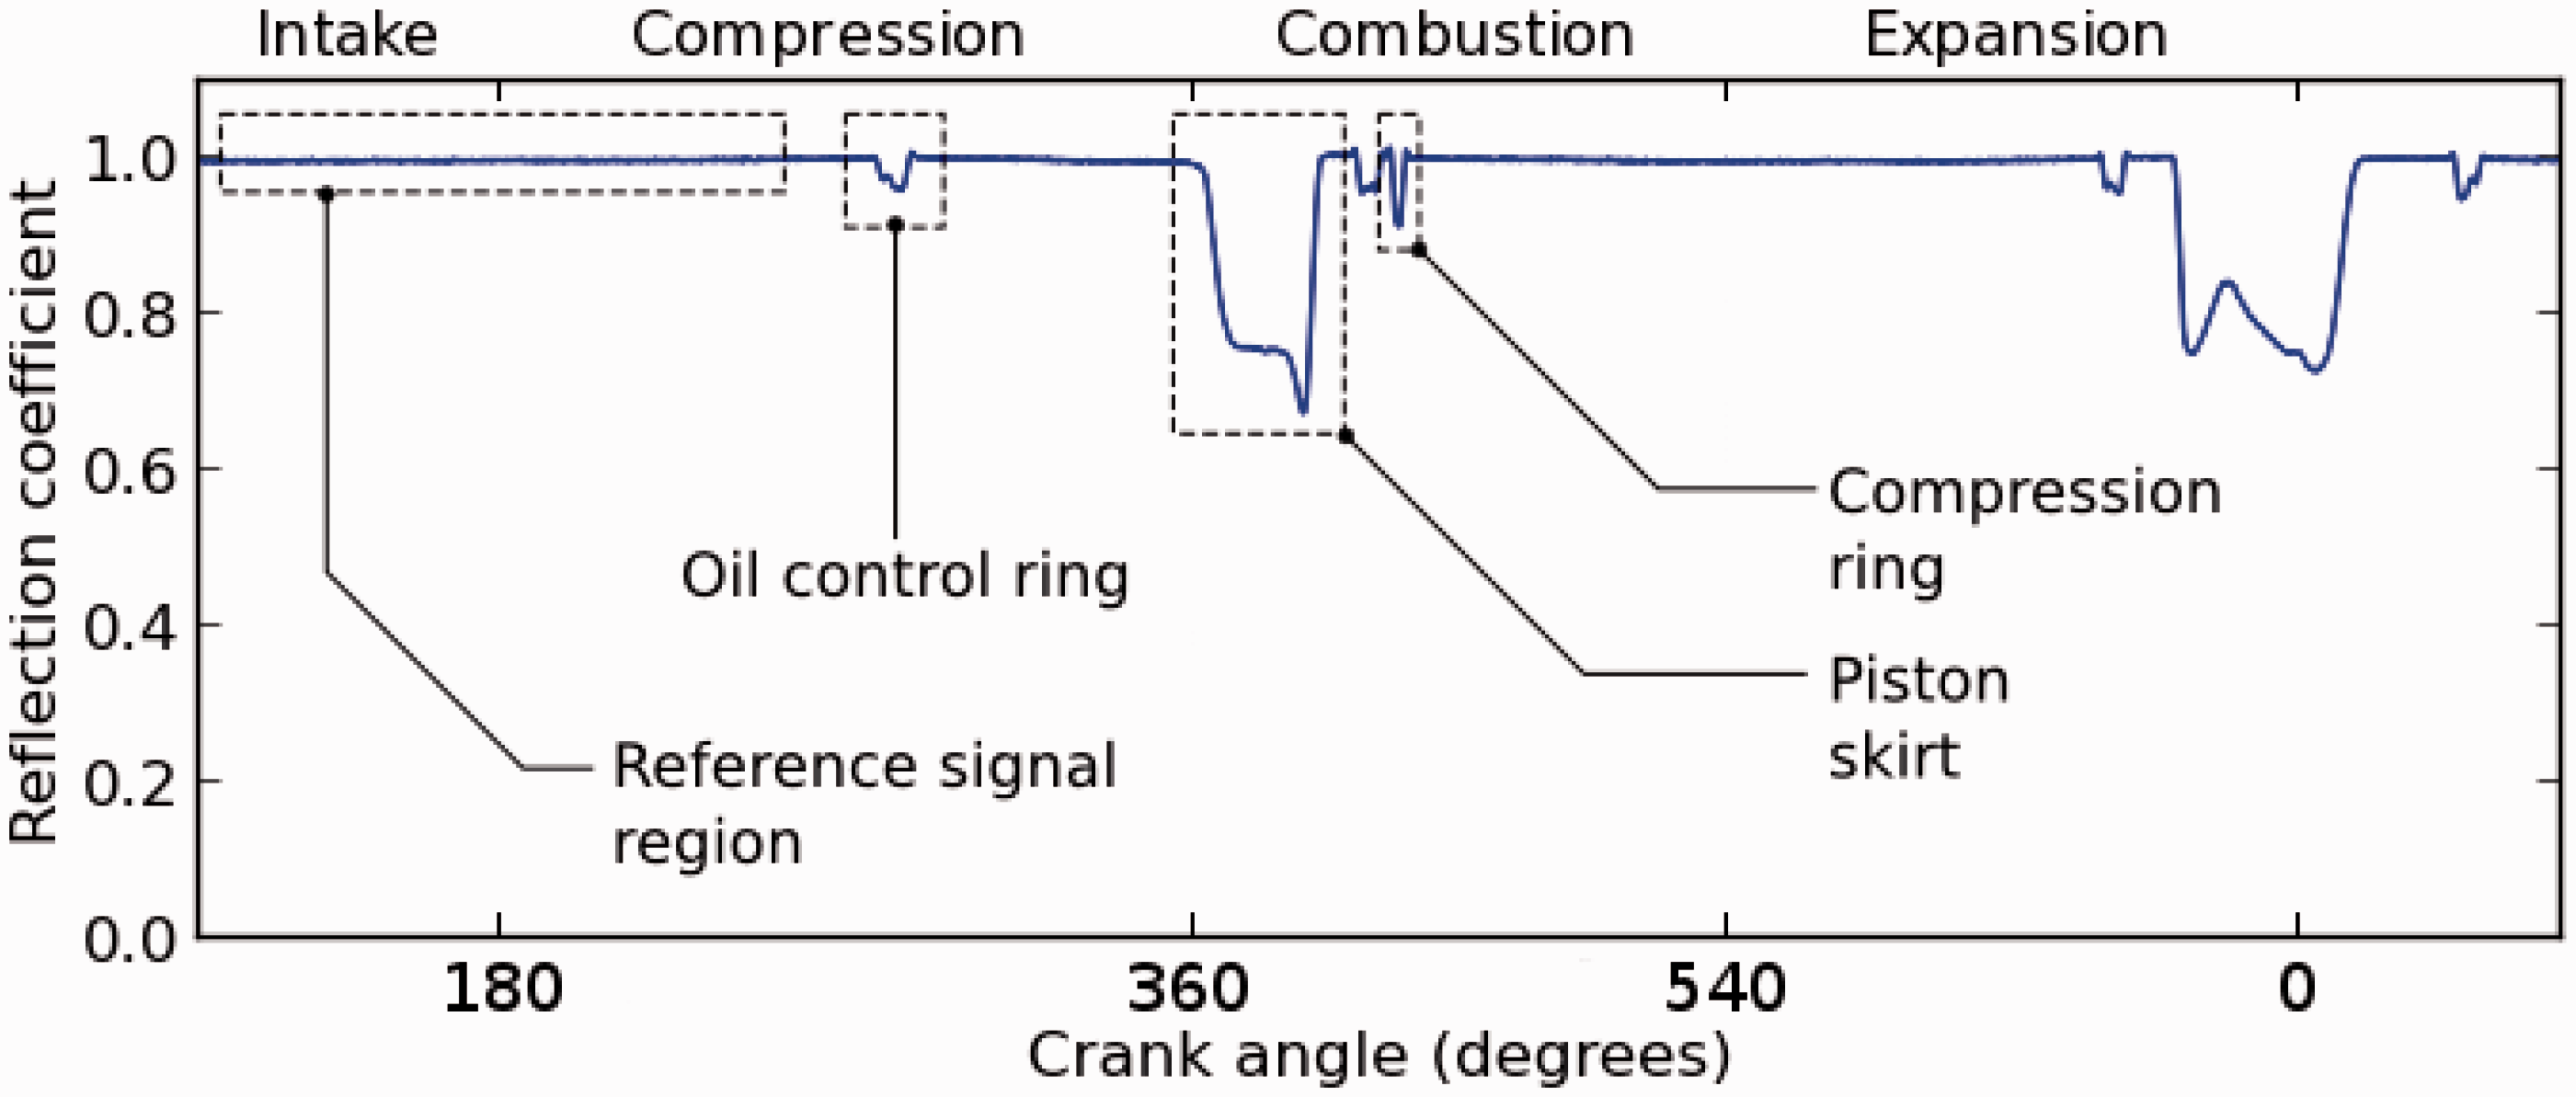
The oil temperature (interpolated from the temperatures at the beginning and end of the test run) was applied to calculate the acoustic velocity of the oil and the film thickness was calculated using equation (2).
Results
Figure 5 shows the mean values of minimum film (obtained from multiple cycles) together with the first standard deviation extent, for the compression and combustion strokes while the engine was operating at 90% load. Results from the thrust, anti-thrust and neutral sides are superimposed and the resultant mean plotted. The spring model for this material and frequency configuration was stable for films smaller that 10 µm, corresponding to a measured reflection coefficient of 0.98. Beyond this limit, the influence of noise is too significant to provide an accurate measurement.
Minimum film thickness under compression ring located on thrust, anti-thrust and neutral surfaces for high load case. Single standard deviation limits shown to give indication of cycle–cycle measurement variation.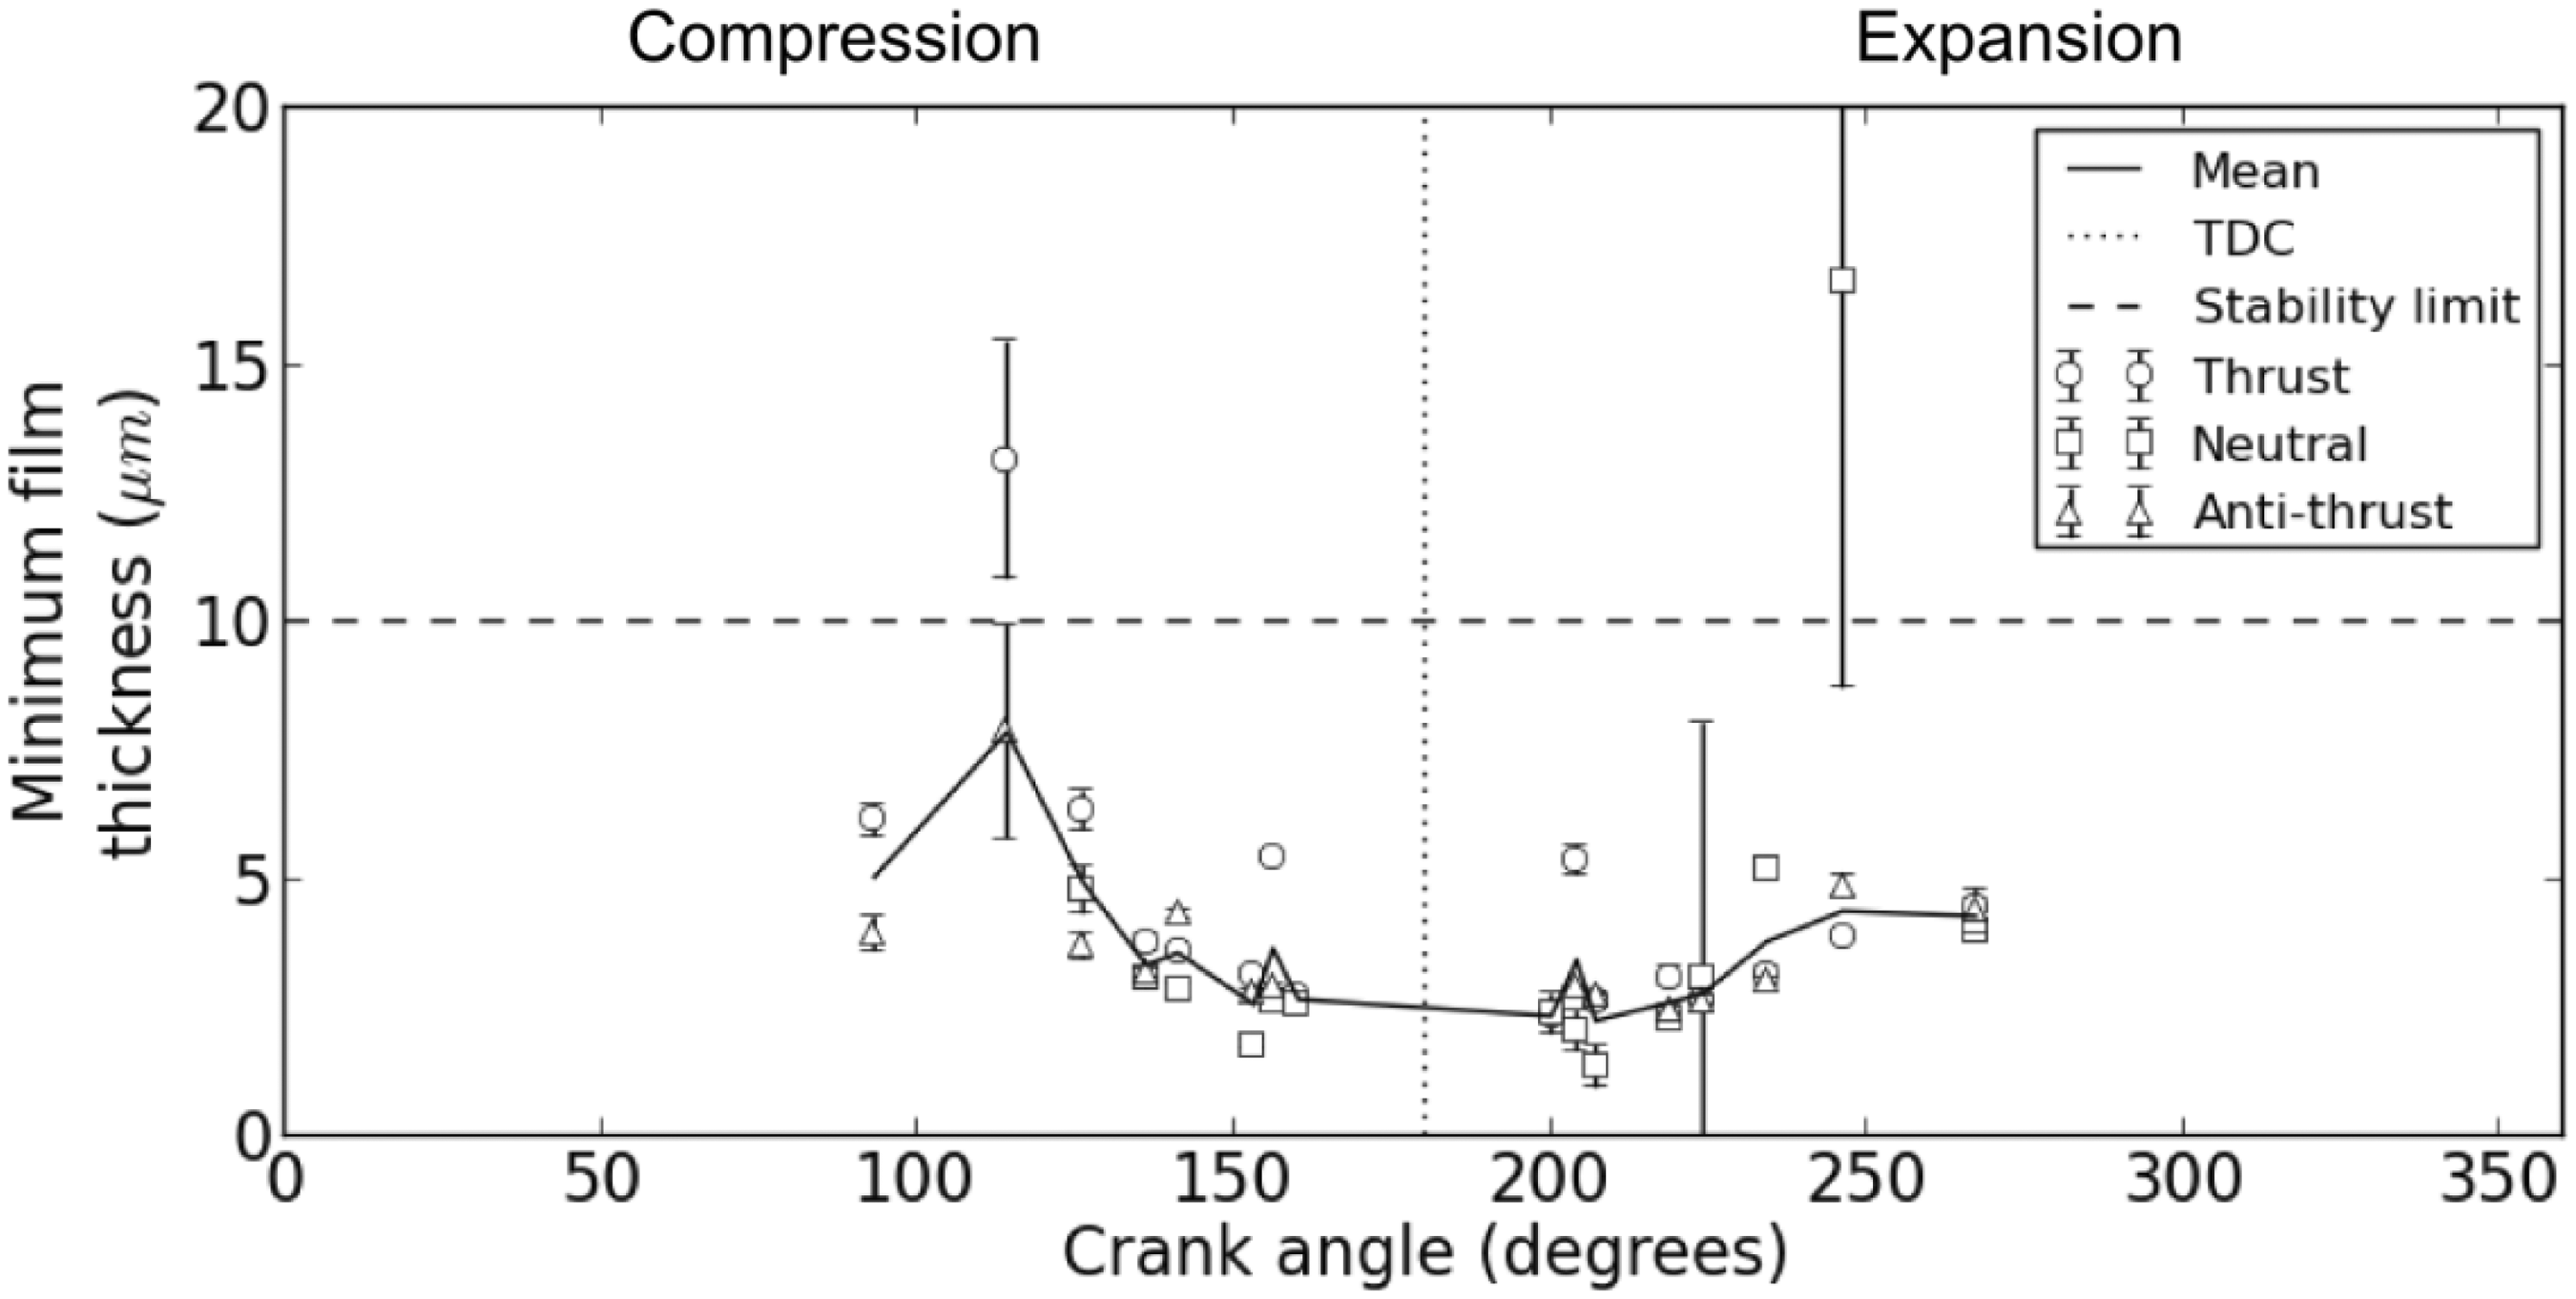
Generally, measurements of minimum film thickness at corresponding axial locations around the circumference are comparable, suggesting that the charge pressure is causing the ring to conform well (circumferentially) with the cylinder. However, local deviations are observed and may be the result of bore distortions resulting from the machining operations outlined previously. Minimum oil film thickness (MOFT) values of between 2 and 3 µm were measured; however, this result is convoluted by the aperture size of the sensor. Figure 6 shows example film traces as the compression ring passes the sensor when compared to the stylus measured profile. This suggests that the film thickness results of Figure 5 are larger than those truly present during testing. This situation of geometric convolution exists for the majority of the film measurement techniques, but is often neglected on grounds that the size of the sensing element is sufficiently smaller than the ring. While this is perhaps justified for larger diesel engines with correspondingly thicker rings, this case considered a ring of width comparable to that of the width of the piezo element, limiting the validity of this assumption. In an effort to remove this aperture effect, a simple deconvolution routine was applied, providing a more realistic value of the ‘true’ minimum film.
Comparison of stylus measured ring profile with ultrasonically measured film thickness.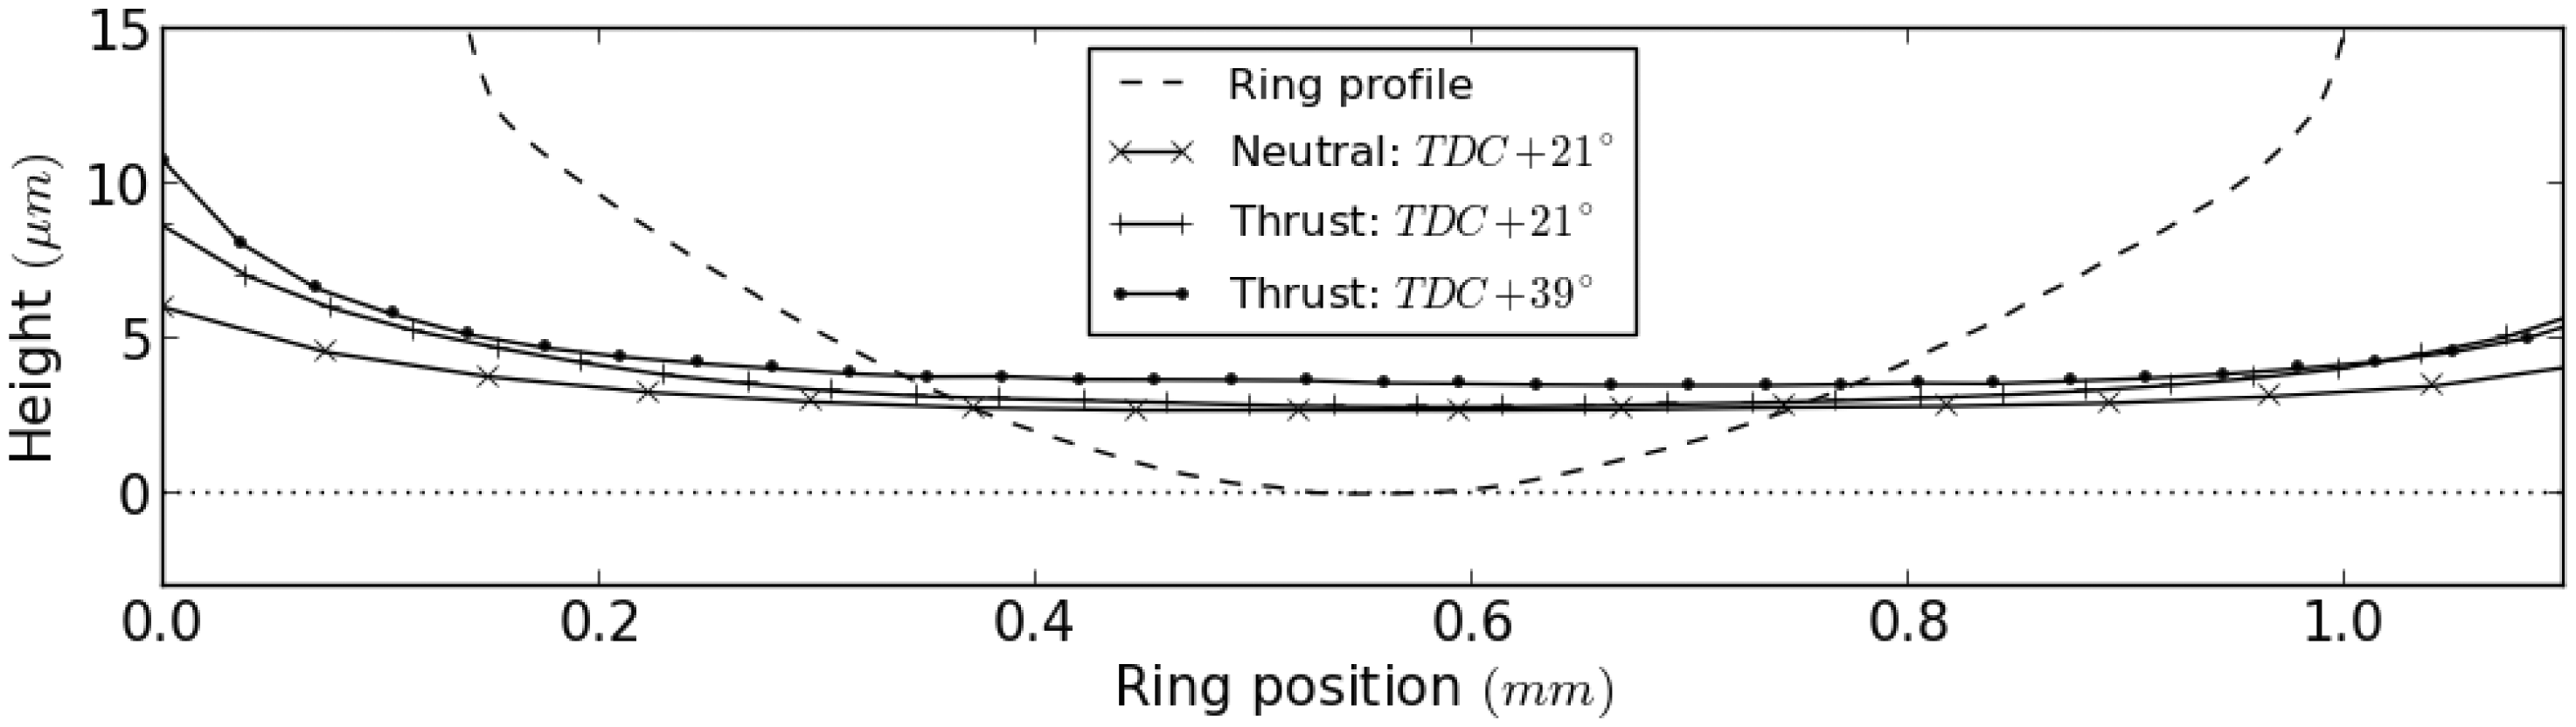
The spring-model (equation (2)) used to calculate the film thickness assumes the ultrasound is reflecting from a parallel interface, i.e. the thickness of the film is constant over the area of the ultrasonic wave front. If the contacting surfaces deviate from parallel, the amplitude of the reflected sound energy will depend on the local film thickness. The piezoelectric element spatially averages the reflected ultrasound, essentially causing the measured minimum film thickness to be larger than the true minimum separation between the ring face and the cylinder wall. Figure 7 shows this effect schematically for an exaggerated ring geometry.
Representation of spatial averaging effect of sensing element.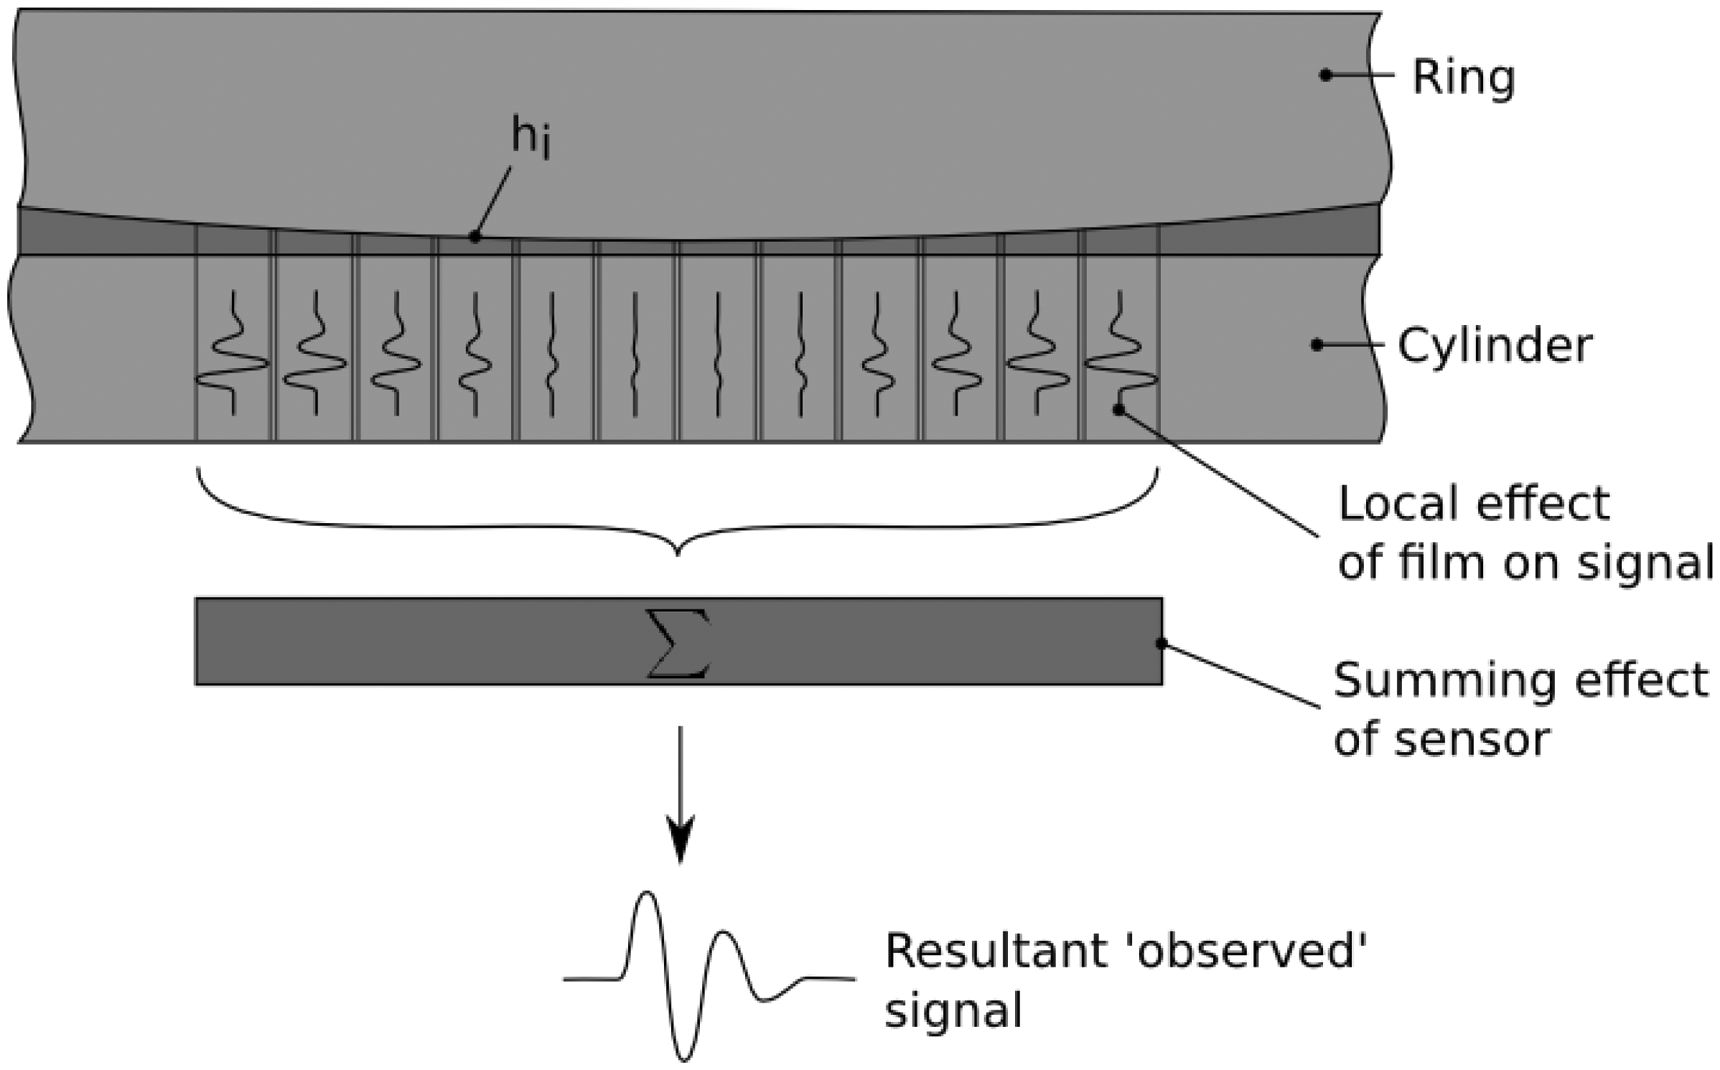
To account for this convolution and to calculate the minimum separation between the piston ring and cylinder from the measured reflection data, the following routine was adopted:
Using ring profile geometry obtained by stylus profilometry, a low pass spatial filter was applied to extract the nominal profile of the ring. The resulting profile was then discretised according to the local curvature, i.e. Δx is smaller for greater curvature. The position of a window of width equal to that of the sensor was found, such that the area between ring and cylinder wall was minimised. This was assumed to correspond to relative position of the ring over the transducer at the point when the minimum measured film was recorded. It should be noted that ring tilt was assumed to be zero during this process, though small tilt angles would not result in a significant deviation. The equivalent measured reflection coefficient (Rloc) for a prescribed film thickness (obtained from the digitised ring profile) was calculated using equation (2) rearranged in the form The effective reflection coefficient (Reff) for the ring profile was then calculated using equation (4) over the sensor window. This gives the expected measured reflection coefficient for a given minimum separation distance between ring and cylinder wall The process was repeated for increasing ring-cylinder separation, providing a relationship between the measured reflection coefficient (and film thickness) and the ‘effective’ minimum film, taking into account the shape of the ring profile.
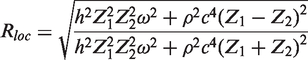
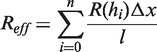
Figure 8 shows the result of the deconvolution process and how the ‘effective’ minimum film can be extracted from the measured minimum film. Below 3 µm ‘effective’ film thickness, the process is more sensitive to the measured film resulting from the dominant influence of the ring geometry. Separate curves calculated at different temperatures were applied to account for varying lubricant temperature.
Proposed relationship between measured MOFT and ‘effective’ MOFT given the compression ring geometry of the CRF450 engine.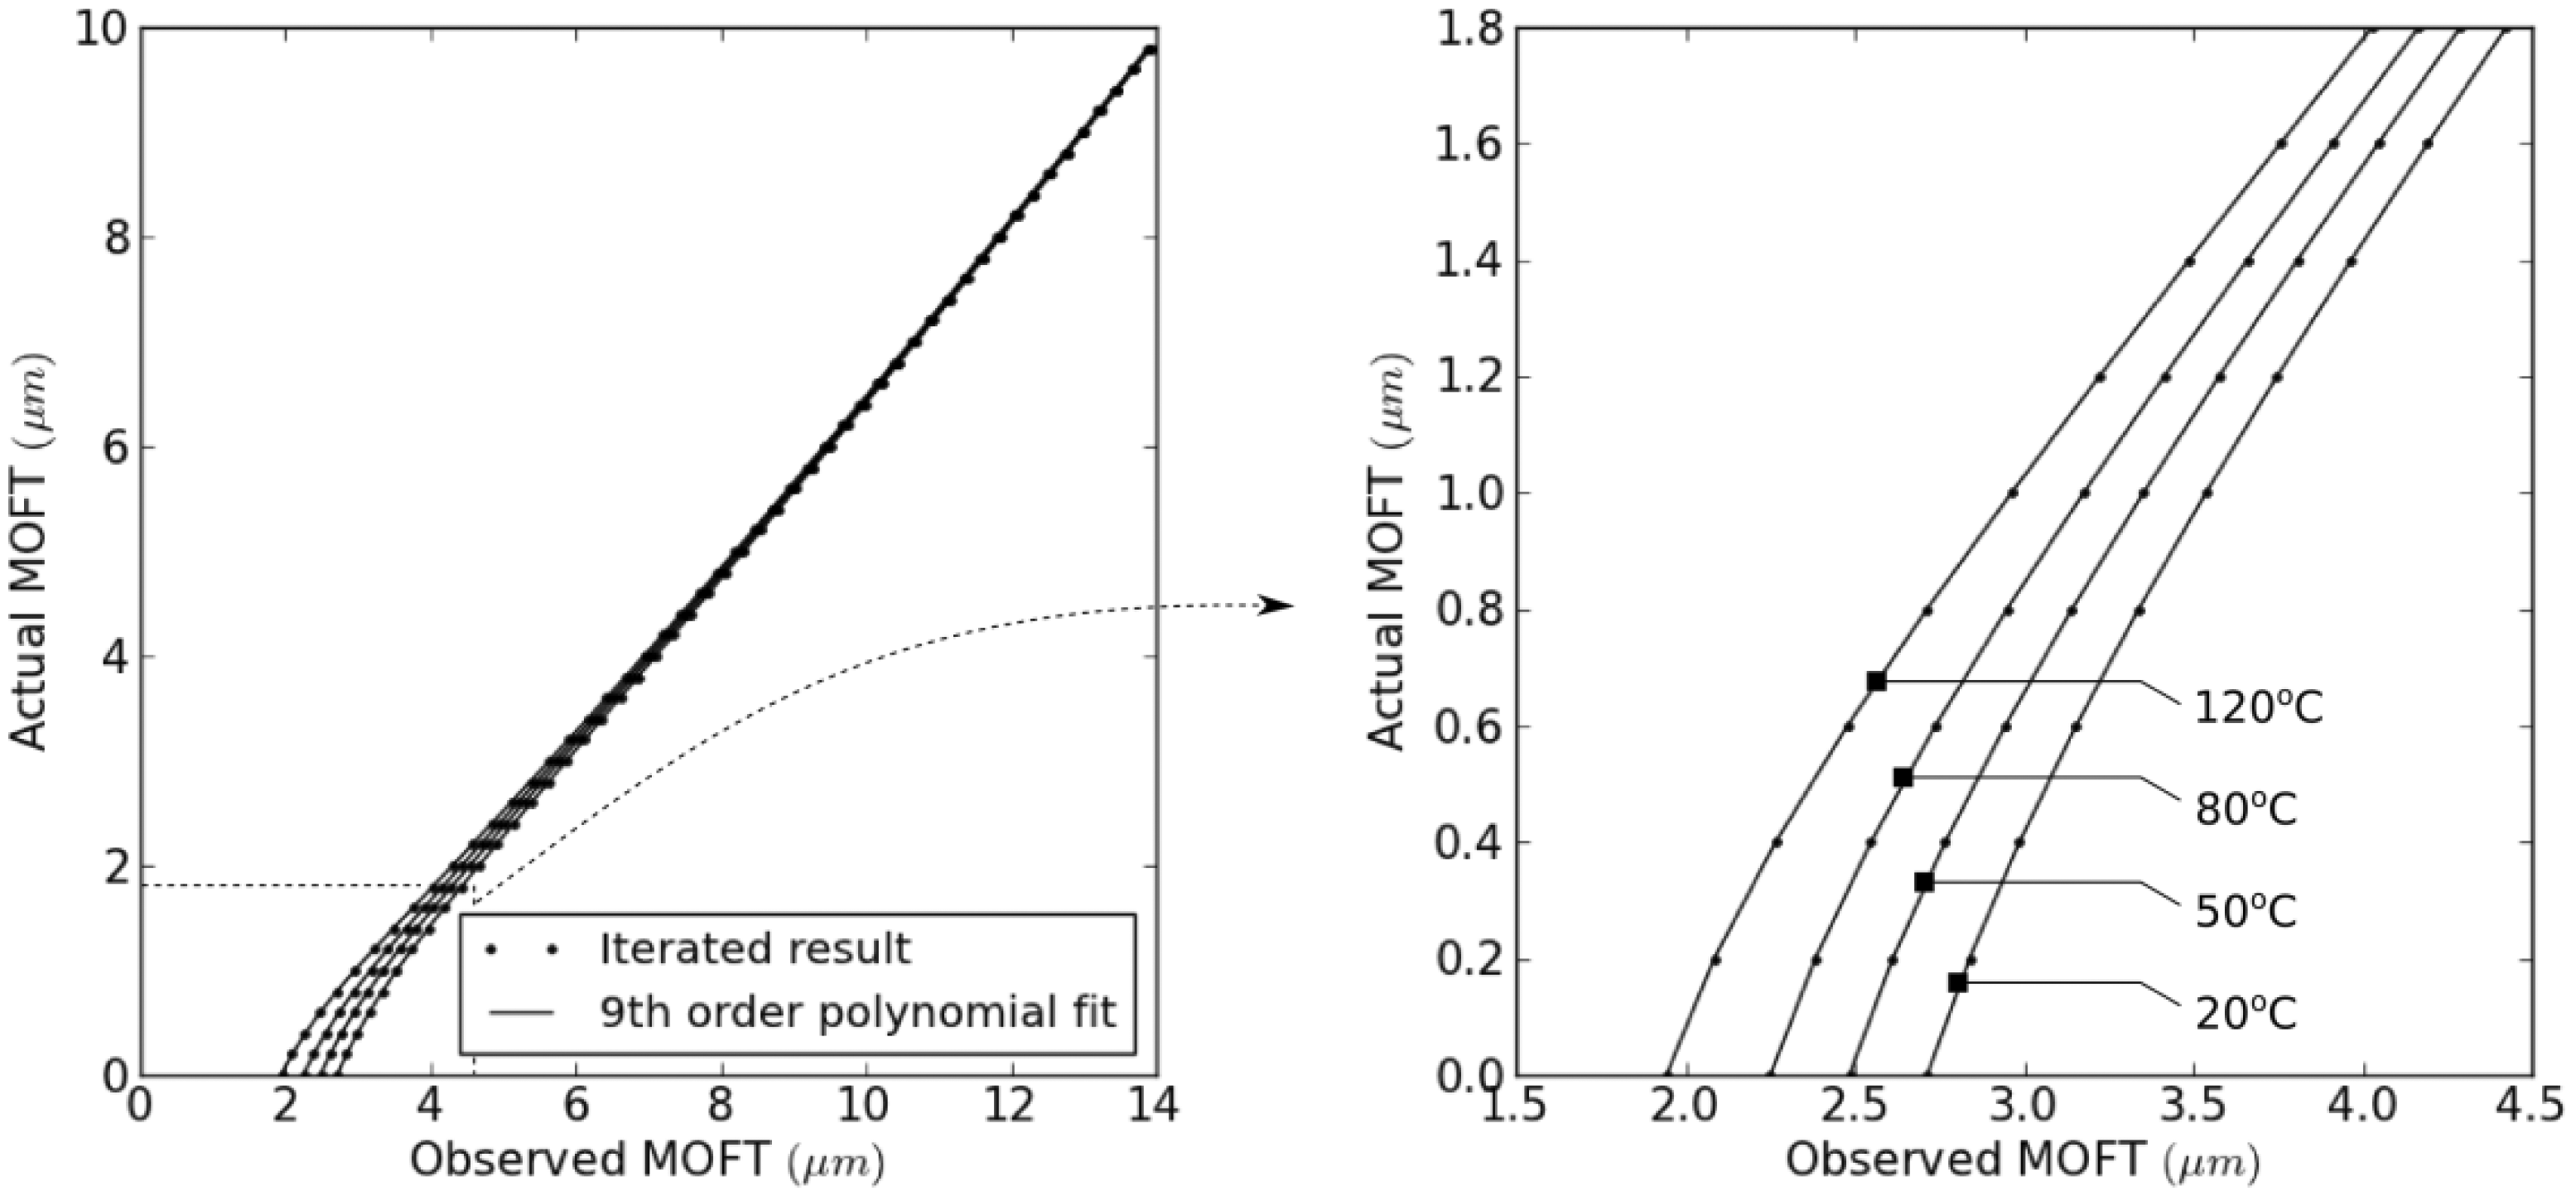
Figure 9 shows the data of Figure 5 with the described deconvolution algorithm applied. It can be seen that the minimum film is reduced significantly. During the early portion of the combustion stroke, it is likely that asperity contact was occurring, owing to the near-zero film thickness being measured. At this point, it should be clarified, however, that all analysis was carried out assuming fully hydrodynamic lubrication without asperity contact. Interestingly, one of the sensors measures a negative film (−0.1 µm). Clearly the ring cannot penetrate the cylinder and so may result from increased acoustic coupling at the asperity junctions, not accounted for in the prescribed model.
Mean deconvoluted compression ring MOFT results for two load cases. Engine speed was 3200 r/min.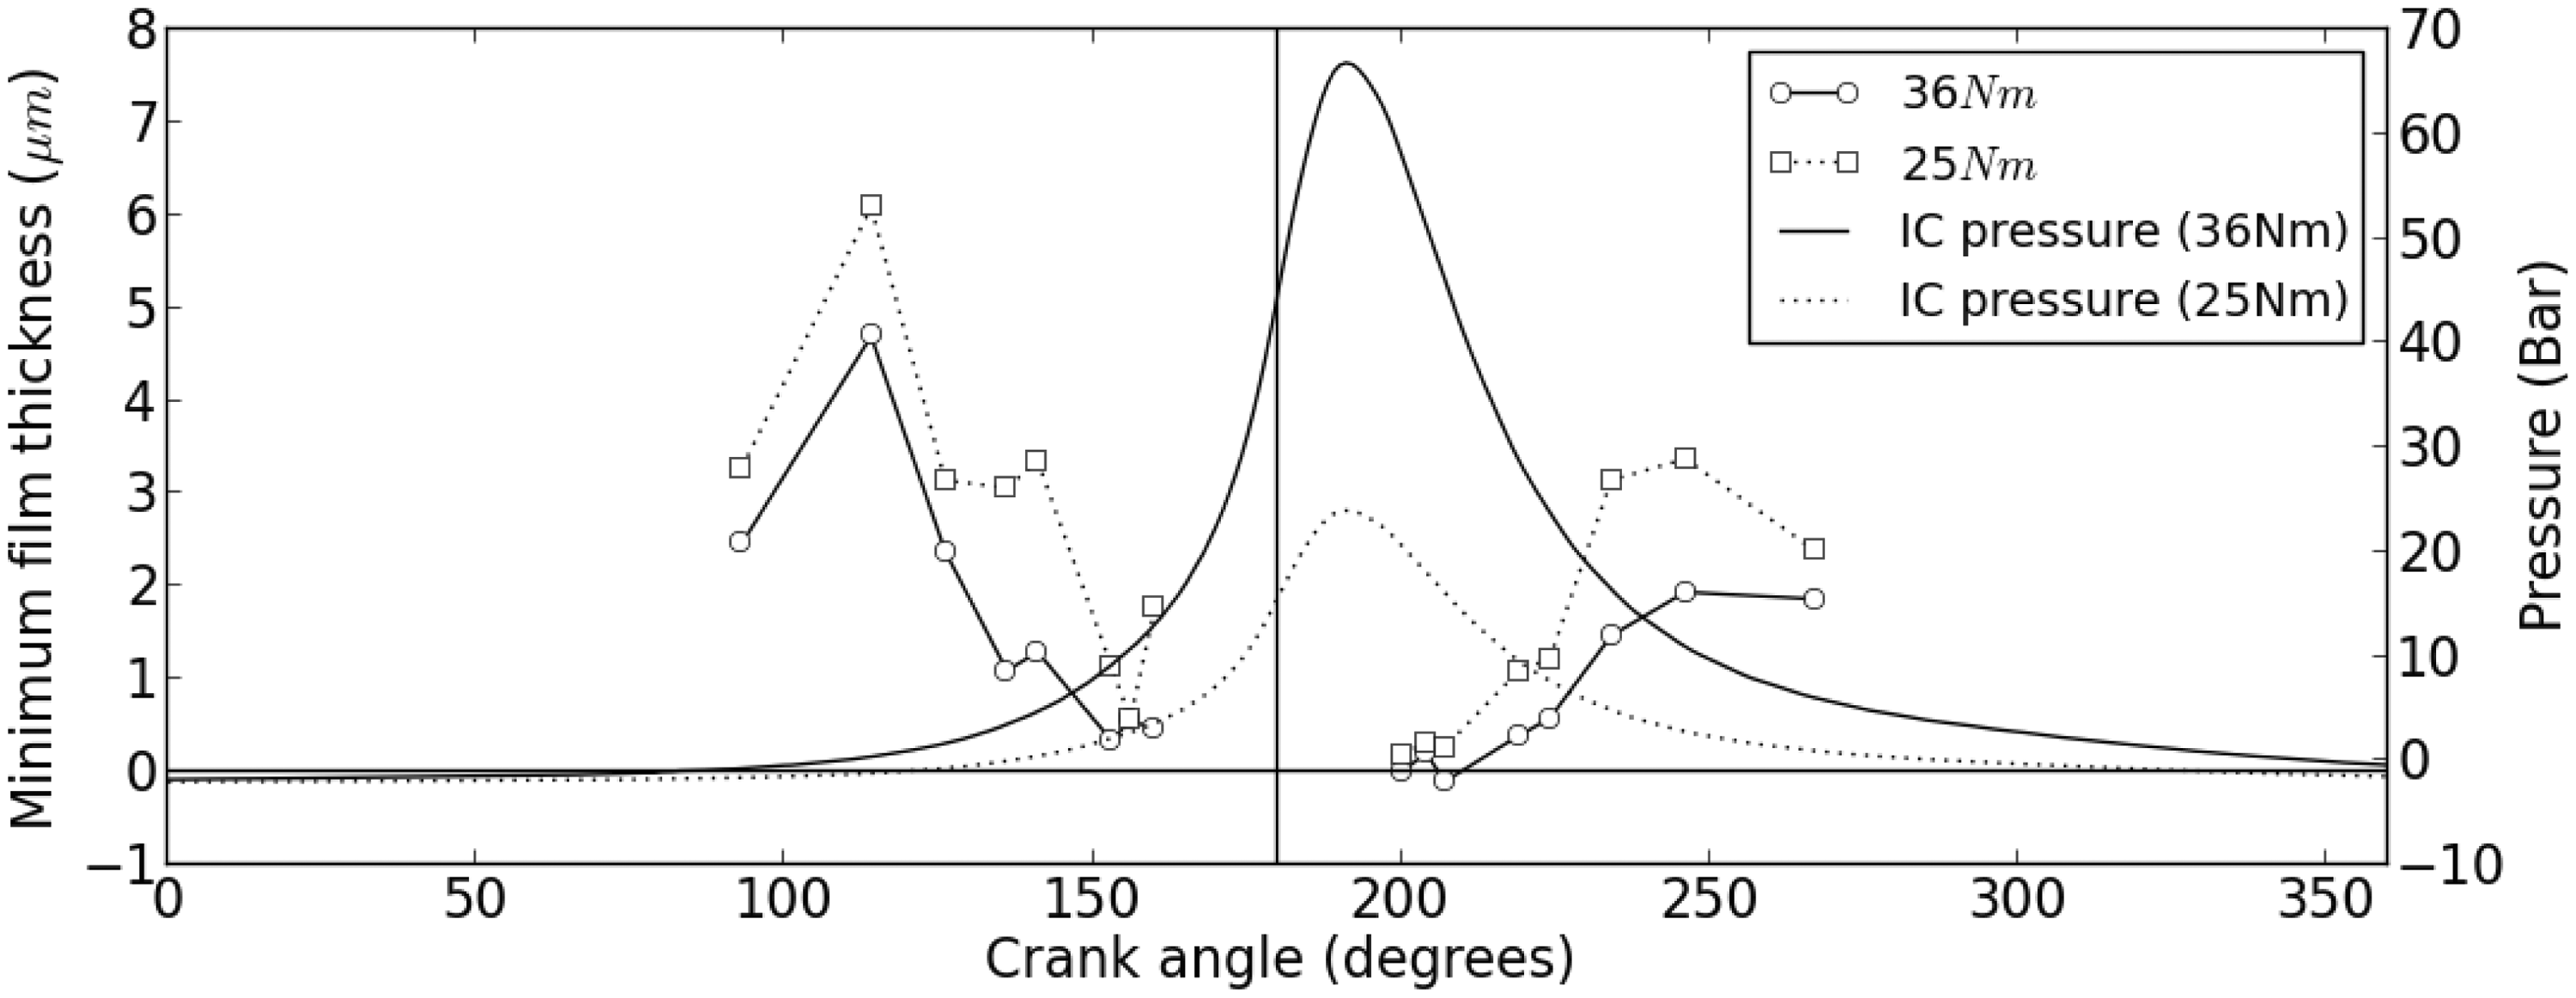
Discussion
The presented results compare favourably to those documented by other authors. Seki et al.
10
used LIF to measure the film over the ring pack and recorded values of approximately 0.3 to 0.4 µm, which was attributed to the roughness of the fibre optic tip and ring surface. Figure 10 superimposes a plot of the results from Seki et al.
10
over those obtained ultrasonically.
Comparison of results documented in Seki et al.
10
with ultrasonic measurements.
Though obtained using a single-cylinder diesel engine operating at 1500 r/min and 75% load, the general shape of the minimum film profile is in good agreement with the current work. For the engine of Seki et al., 10 the roughness (Ra) of the cylinder wall was 0.28 µm and that of the compression ring was 0.2 µm. Correspondingly, this compares favourably with the minimum films observed ultrasonically, following deconvolution.
Again, using LIF, sub 1 µm films were observed in Takiguchi et al., 11 though larger films were observed during the expansion stroke, attributed to improved oil conditioning and inertial ‘fling’ of the oil toward the compression ring during reversal at TDC. Minimum film thickness measurements of 4–5 µm were documented in Söchting and Sherrington 6 on a diesel engine. Access limitations meant the capacitative sensors could not be placed at TDC, which may have meant the documented films were relatively thick, though as with ultrasound, such measurements are also subject to geometric convolution.
It is prudent to note that a number of key assumptions have been applied, namely that the junction is fully flooded and that no cavitation/flow detachment occurs over the ring surface. Verifying these assumptions with any non-visual techniques presents quite a challenge. The presence of cavitation/flow detachment will tend to manifest itself towards the exit of the contact; however, application of the spring model within this thicker film region will mean that the affect of the cavitation on the result will be relatively small, a thick film will look similar to a cavitated region. The response of the thin film region of the contact will therefore, dominate the observed reflection. Whether the contact is operating in starved conditions is perhaps more difficult to assess. However, it was noted that the engine tended to have a relatively high oil consumption (primarily caused by the lack of a scraper ring) meaning that oil was likely to be being transported into the combustion chamber and evaporated/combusted. This situation would have meant that the remaining liner bound lubricant would have provided an oil source ahead of the ring during the compression and exhaust strokes. During the expansion strokes, the conditioning of the oil by the control ring was assumed to have provided favourable inlet conditions to the compression ring. Results presented in Seki et al. 10 suggest a ‘bow-wave’ of oil was scraped ahead of the compression ring during upward piston strokes, providing a source of oil for the contact. However, capacitative techniques, examining the extent of the oil film over the section of the ring have suggested that starvation and flow detachment may be occurring during running. 22 This raises an interesting question regarding the consistency of the oil conditioning across different operating conditions of an engine. Additionally, oil film thickness measurements are presented that at, and around TDC, are approximately 10 µm thicker than those at BDC despite the combustion pressure acting behind the ring. With improved spatial resolution of the ultrasonic transducers, future measurements of film thickness at the oil control ring could help to predict the oil availability for the compression ring during the combustion stroke.
Though the peak pressures within the ring contact have been estimated at around 60 MPa, 23 this will exist over only very small linear section of the ring. The sensor which, as has been discussed, spatially averages the condition over the ring width, will observe the mean pressure across the ring (in the order of 10 MPa). Applying the analysis of Reddyhoff, 24 a variation in bulk modulus would cause a change in bulk modulus of approximately 3%, corresponding to a deviation of 0.1 µm. The aggressive water cooling and small thickness of the cylinder wall meant the oil temperature during the experiments was relatively low. However, a deviation of 10 ℃ would result in a film thickness deviation of approximately 5% or 0.18 µm. Future work will involve the use of an instrumented wet liner, able to measure temperature at the cylinder surface, giving greater certainty of the temperature at the measurement locations. Though the measurement of the fluid properties in situ remains a challenge, the comparability of the results to those of other experimental techniques encourages confidence in the use of ultrasound for piston ring film measurements.
Conclusions
The oil film existing between compression ring and cylinder wall was measured on a single-cylinder engine operating at 3200 r/min using ultrasound. The following conclusions can be drawn from the study:
Compression ring film thickness was measured at locations around the circumference of the engine from within the water jacket and without the need to penetrate the cylinder wall. Observed results showed comparable measurements of film thickness around the circumference. The relatively large size of piezoelectric transducer as compared to the thickness of the ring meant that the processed result was exaggerating the true MOFT. A deconvolution process was therefore implemented to account for the profile of the ring. Measured film thickness values compare favourably with other authors using alternative techniques, providing confidence to the ultrasonic technique. However, as with other techniques, obscurity concerning the temperature and pressure of the oil within the contact mean that total certainty of the measured film requires further investigation.
Footnotes
Conflict of interest
None declared.
Funding
This work has been financed in part by the Encyclopaedic consortium set up by the EPSRC. The authors would like to express their gratitude to the funding agency and to the academic and industrial partners in the consortium for help and support.