
Abstract
Computational wear modelling has been improved using a contact area dependent wear law for the conventional ultra-high molecular weight polyethylene used in total hip joint bearings. The current designs of polyethylene bearings tend to use larger diameter heads to achieve improved motion function for patients in clinical practice, but the wear of the bearing may also increase due to the increase in contact area associated with the larger bearings. Additionally, bearing clearance, which is the difference in diameter or radius between the cup and head bearing surfaces, may also play an important role in affecting the wear. This study particularly investigates the effect of bearing clearance on polyethylene wear, for different femoral head diameters, through a parametric study using the computational modelling method. The effect of creep of polyethylene on the contact area and wear was considered, since polyethylene creep can account for a significantly large proportion of volumetric change, particularly during the initial loading stage, and an increase in the contact area. The predicted wear rate was found to be comparable to the experimental wear rate found in independent simulator tests. The polyethylene bearing with decreased bearing clearances led to a substantial increase in the wear rate, particularly when combined with large diameters.
Keywords
Introduction
Ultra-high molecular weight polyethylene (UHMWPE) is one of the most common materials considered for joint replacement bearings. 1 Polyethylene (PE) bearings have widespread use in hips, knees, shoulders, ankles and spinal disc replacements. 2 – 5 The PE total hip joints, consisting of a UHMWPE cup and a metallic/ceramic femoral head, are clinically the most widely implanted. The bearing surface wear and PE wear debris in the artificial joint have been the main causes of implant failure limiting the long-term performance of the joint replacement treatment. 6 Wear assessment therefore has been extensively conducted in the design process to minimise the wear.
The design of PE hip joints has constantly evolved to improve the biomechanical function of the joints in clinical practice. The use of larger diameter bearings in total hip joints has the benefits of enhanced joint stability and motion range. 7 However, clinical investigation has shown increased wear associated with larger bearings, which may compromise their use. 8 The wear increase has been generally considered as a result of increased sliding distance as the femoral head size increases. In more recent studies, the increase of the PE wear for larger heads has been mainly attributed to the increase in contact area, in which wear has been found to be directly proportional to contact area.2,9 Another parameter, the bearing clearance, which is defined as the difference in diameter or radius between the acetabular cup and femoral head bearing surfaces, may also have an influence on bearing wear, since the clearance can significantly affect contact area and hence wear. This has also been demonstrated in a laboratory simulator study. 10 However, that experimental study attributed the effect of the clearance on wear to increased pressure and lack of lubrication rather than contact area. The role of the clearance in the design has not been fully investigated, and the quantitative understanding of its effect may provide better design options with improved wear performance.
The wear of artificial joints has been largely investigated experimentally using dynamic, multi-station joint wear simulators. 11 As an alternative, computational modelling is particularly suitable for parametric studies. 12 – 15 Wear modelling relies on a wear law. The Archard wear equation has been the general consideration in most of the computational wear studies. 16 – 18 However, the wear factor of UHMWPE bearings has been found to be a strong function of contact pressure rather than a constant, as is required by the Archard law. 9 Wear modelling has been improved recently by the development of a contact area dependent wear law, 9 in which wear coefficient can be generally seen as a constant over the range of contact pressures likely to be experienced in PE hips and knees. Moreover, PE creep can be a significant factor in affecting bearing surface deformation; a numerical creep calculation method has been developed previously, 17 but its effect on wear was not able to be predicted using the Archard wear law. In this study, creep was incorporated into the contact area dependent wear model. The focus of this study was on the effects of both creep and bearing clearance on the PE wear of total hip joints using the contact area dependent wear law in computational modelling.
Materials and methods
Total hip joint replacements using conventional UHMWPE (GUR 1050, non-cross-linked) as the acetabular cup bearing articulating against a cobalt–chromium femoral head under simulated walking conditions were modelled. A three-dimensional representation of the artificial hip joint is shown in Figure 1(a), with motions and loading illustrated. The motion and loading conditions adopted were based on a ProSim hip simulator (Simulation Solutions, Macclesfield, UK) used for wear testing under simulated walking conditions.
19
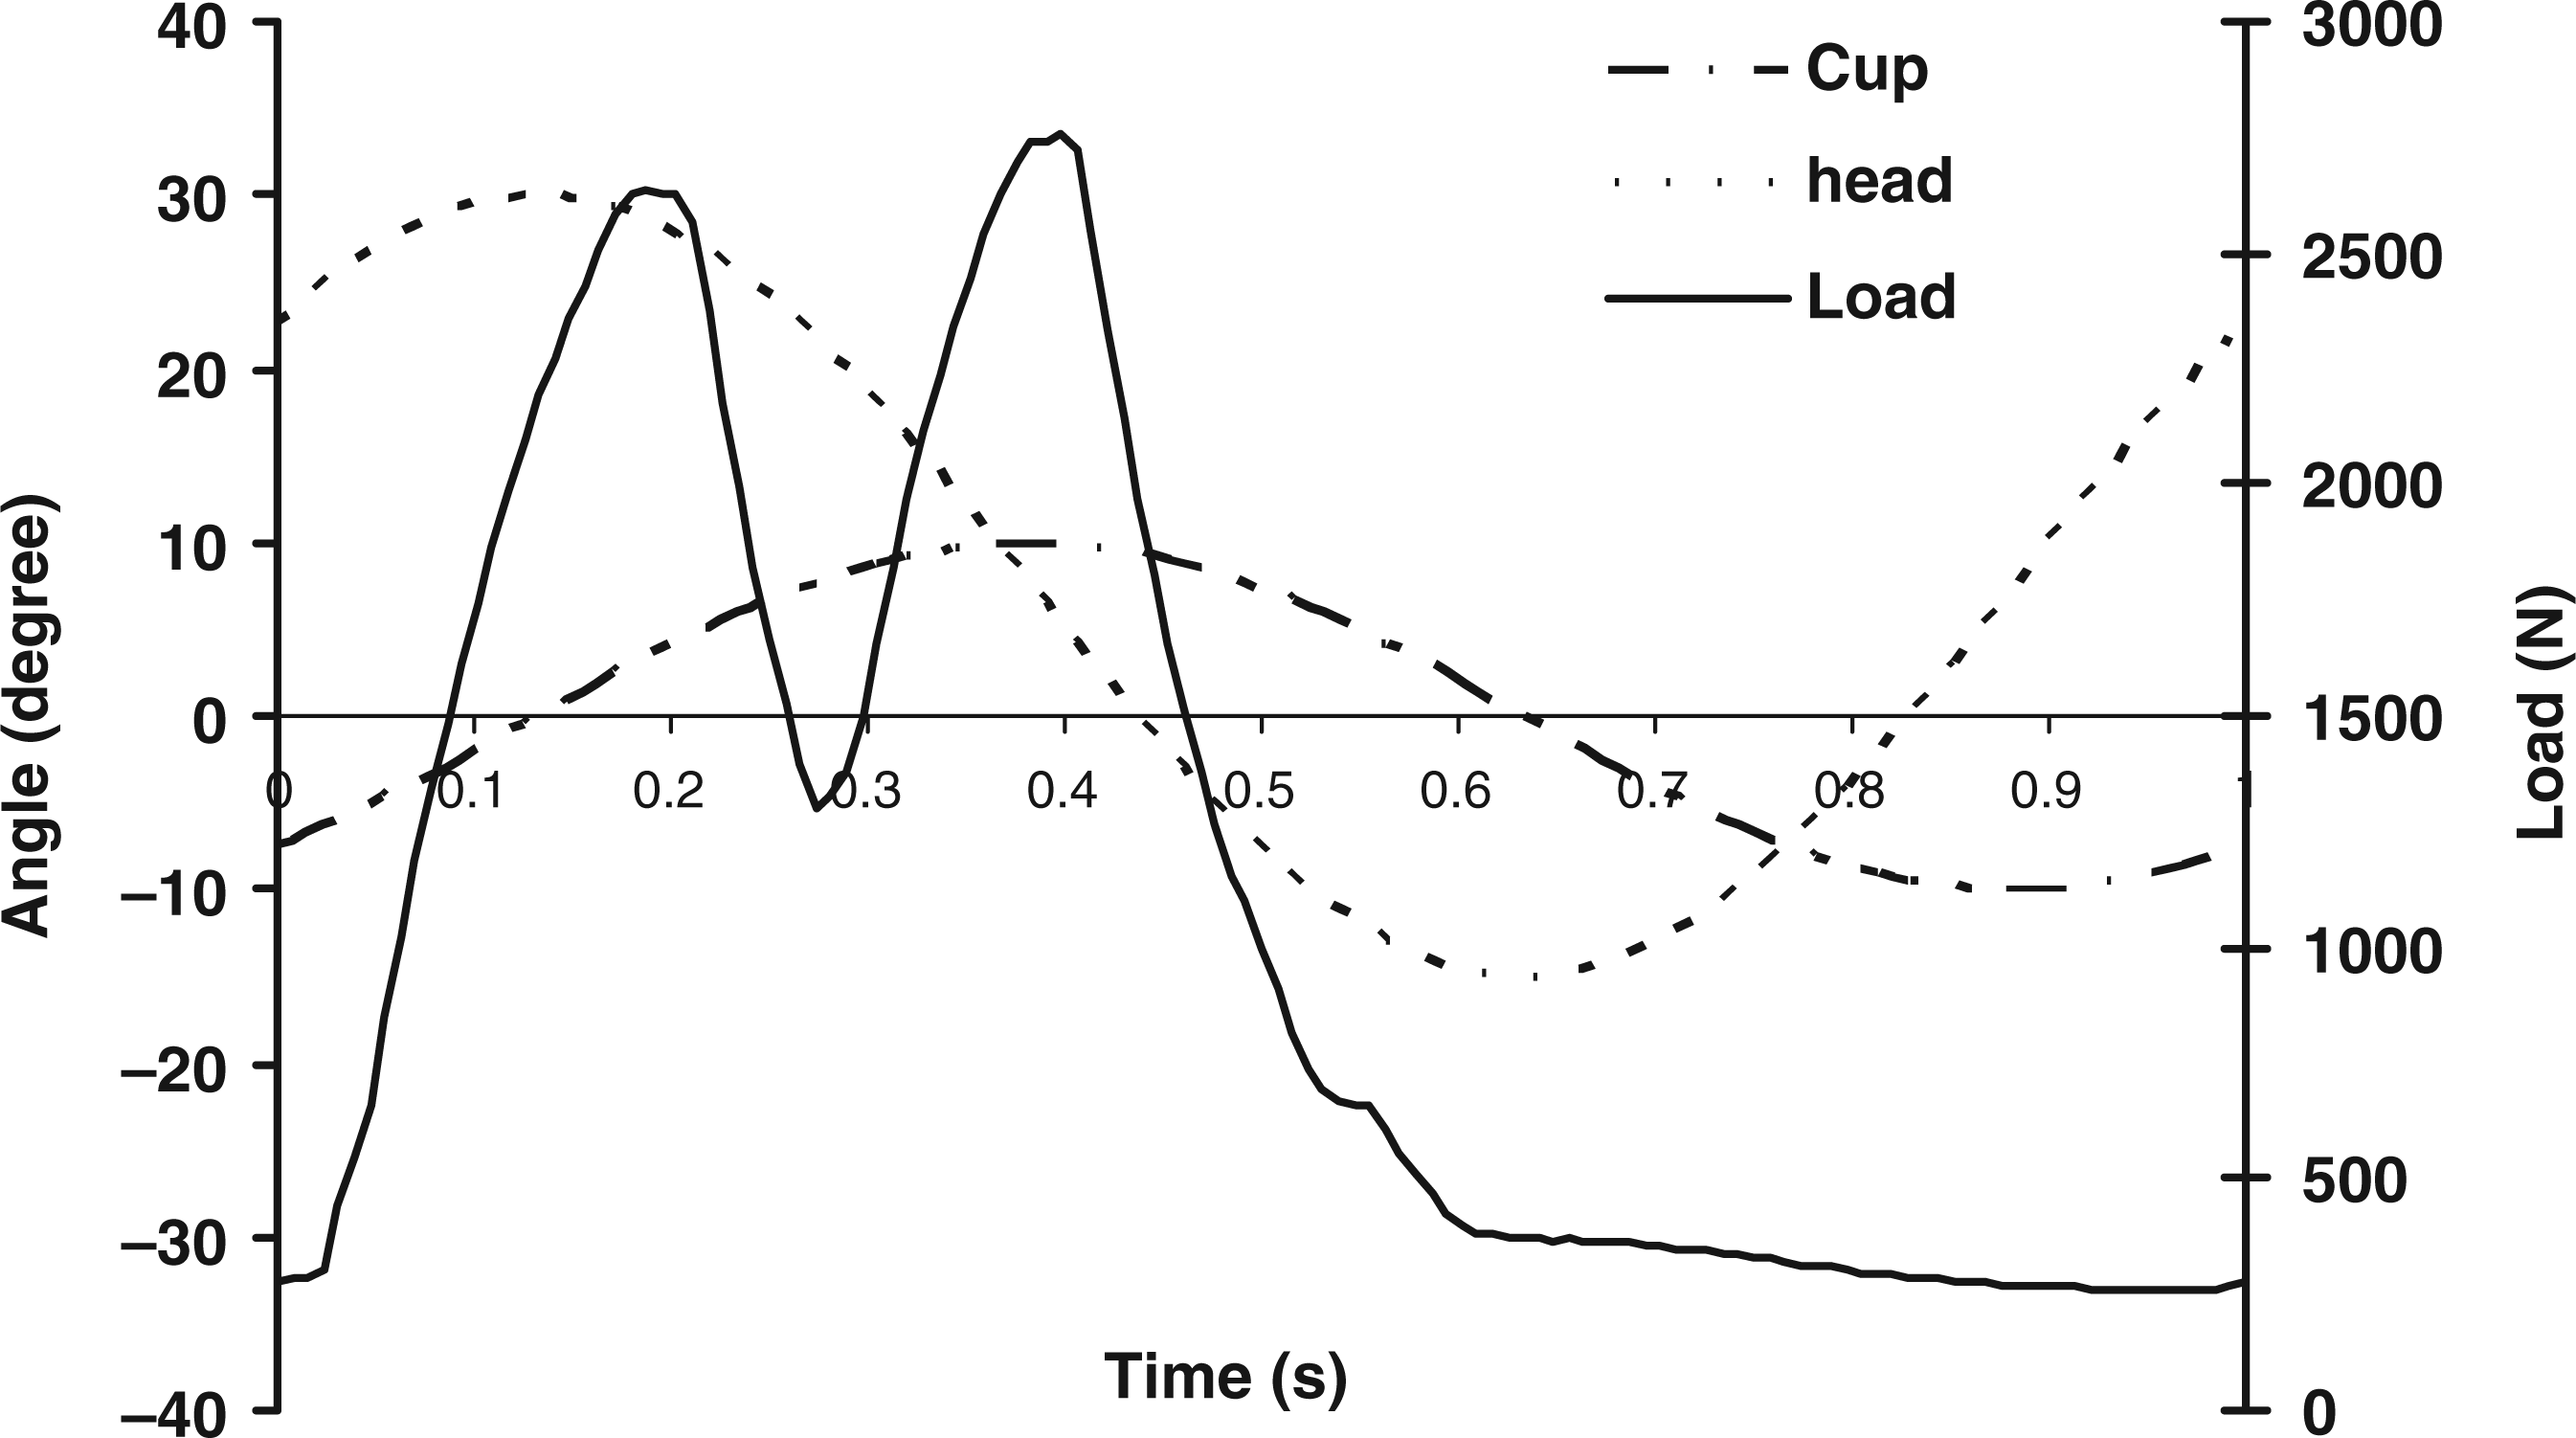
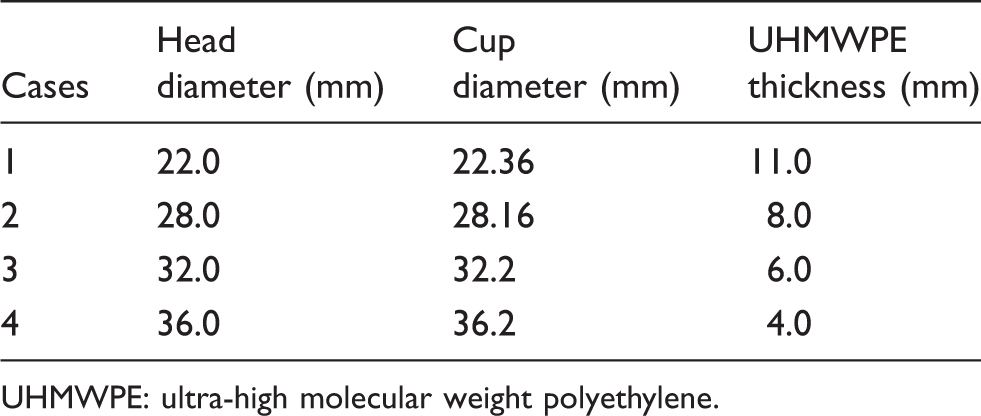
The two-axis motions were internal/external rotation (±10°) of the PE cup about the vertical axis (y) and flexion/extension rotation (−15° to 30°) of the head about the horizontal axis (x) in the sagittal plane (yoz); the load was applied at the centre of femoral head and directed to the pole of the hemispherical bearing surface (Figure 1(a)). The schematic cross section of the joint bearing and fixation is shown in Figure 1(b). The corresponding loading/motion profiles of a simulated walking cycle are shown in Figure 2. A range of joint bearings were investigated computationally, with head diameters 22, 28, 32 and 36 mm, and bearing clearances varying between 0.02 and 0.35 mm. The outside diameter of the PE cup was fixed at 44 mm and a metallic shell with a uniform wall thickness of 4.0 mm was chosen as cup backing, for all the joint sizes.
9
The geometric parameters of the bearing components are summarised in Table 1. For the simulator testing, a 25% (v/v) solution of new-born calf serum was used as lubricant, but it was diluted using 0.1% (v/v) sodium azide to retard bacterial growth. This corresponded to a serum protein concentration of 15.46 g/L which was selected to conform to the ISO 14242 standard.
20
Additionally, the calf serum lubricant diluted to a total protein concentration of 20 g/L was also considered as an average protein concentration of normal synovial joint fluid in a simulator test by Wang et al.,
10
in which the PE cup bearing with varied bearing clearances was investigated. During the simulator tests, approximately 450 mL of lubricant was generally used per test chamber and replaced at about every 300,000 cycles to minimise protein degradation and associated effects on wear.
10
The PE bearing volume changes can be determined geometrically, for example, using a three-dimensional coordinate measurement machine (CMM).
21
The average surface roughness (Ra) of the femoral heads was approximately at 0.01 µm. The tests were normally run for three to five million cycles.10,21
Schematic of: (a) the three-dimensional total hip joint model, with the load/motion illustrated, flexion/extension rotation of the head about x-axis, internal and external rotation of the cup about z-axis and the load applied on the head at the mutual centre (O) of the cup and head bearings and (b) the cross section of the total hip joint bearings. The PE bearing was fully bounded with a metal shell and fixed at the outside boundary with an inclination angle of 35°. Motion and load profiles of the simulated walking condition of the total hip joint based on the ProSim hip simulator testing condition. Geometries of the total hip joint bearings. UHMWPE: ultra-high molecular weight polyethylene.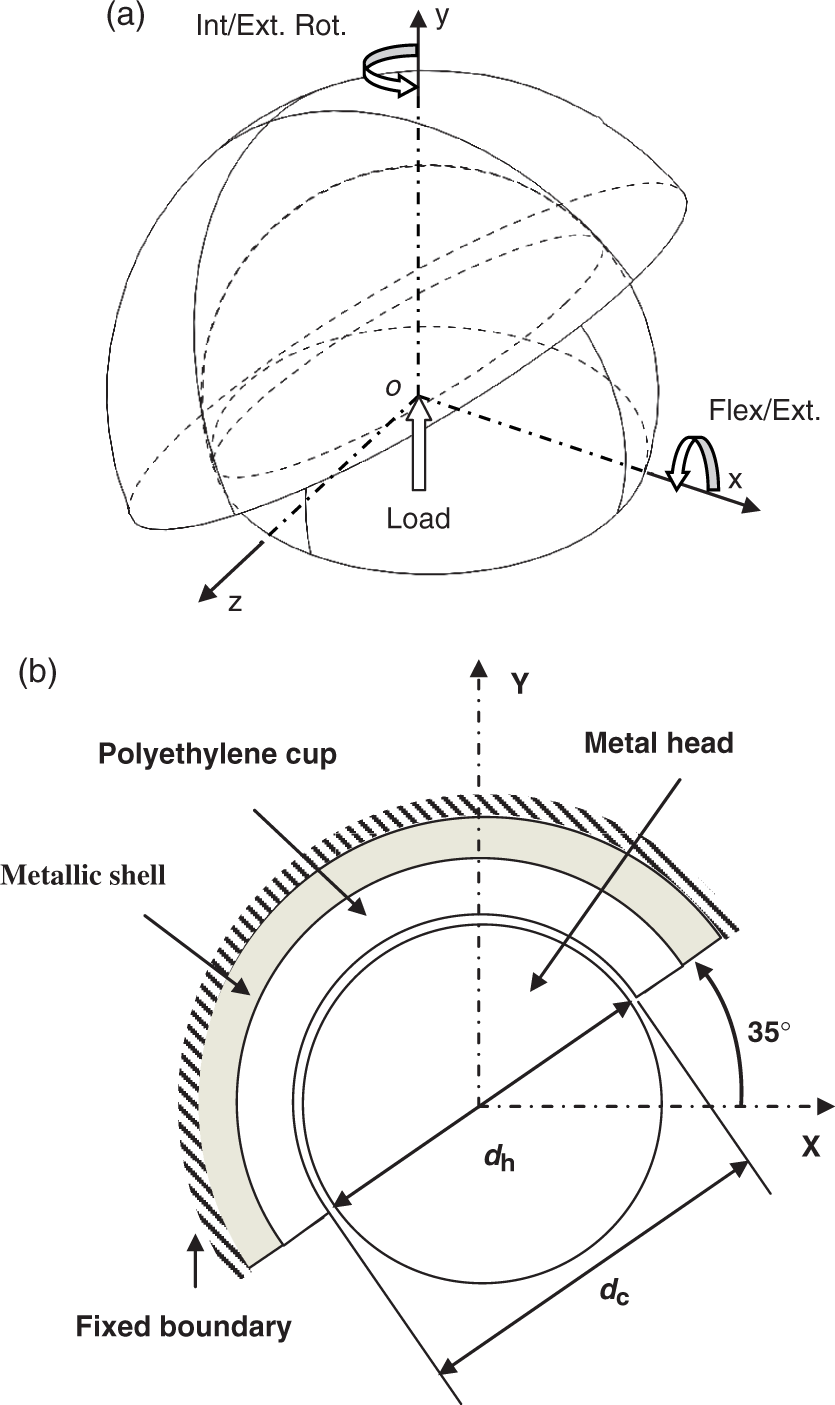
Wear model and wear coefficients
A contact area dependent wear equation previously developed based on the conventional UHMWPE (non-cross-linked, GUR 1050)
9
was applied in this study. The wear model was defined as

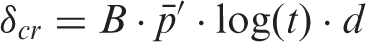
where V is the wear volume, A the contact area, L the sliding distance and C the wear coefficient. A corresponding linear wear depth (δ) equation was obtained by dividing the contact area (A) on both sides of equation (1), as

In previous studies,
22
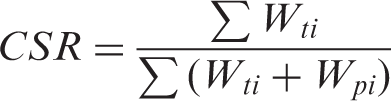
a multi-directional sliding motion experienced by hip joints, was found to generate two orders of magnitude higher wear than that of a unidirectional sliding motion that produces linear tracks. The multi-directional motion effect on wear has been numerically investigated and incorporated in computational modelling by determining the wear coefficient as a function of the multi-directional motions.23,24 The same numerical formulation was adopted in this study. The relative multi-directional sliding (cross-shear motion) at a point on the bearing surface was first quantified using a cross-shear ratio (CSR), given by
The wear coefficients (C), as a function of cross-shear ratio (CSR), were independently determined, based on a pin-on-plate wear test under conditions representative of the hip joint.
23
The PE pin was machined from ram-extruded non-cross-linked UHMWPE (0 MRad, GUR 1050), the average surface roughness (Ra) of the PE pin bearing surface was initially 1.0 µm, and the cobalt–chromium plate was polished to an average surface roughness (Ra) of approximately 0.01 µm. A 25% (v/v) solution of new-born calf serum was used in the pin-on-plate tests at normal laboratory room temperature (approximately 20°). Similar to the lubricant treatment used in simulators, the lubricant was also diluted to a serum protein concentration of 15.46 g/L using 0.1% (w/v) sodium azide to inhibit bacterial growth.
23
PE pins of diameters 5 and 10 mm were tested under compressive loads from 80 to 200 N, and contact pressure on the pin bearing surface ranged from 1 to 10 MPa, duplicating that of joint simulator testing based on the calculation of finite element (FE) contact model.9,24 The PE pin was flat-ended, and the apparent contact area of the pin bearing surface was considered and used as constant over wear tests. Both pin rotation and plate translation were in reciprocal motion with a common frequency of 1 Hz, the amplitude of pin rotation angle between 0° and 55° and the stroke length of the pin 10–38 mm; the combination of the PE pin rotation and metal plate translation was applied to achieve different degrees of cross-shear motions for various CSR values from 0 to 0.25.
23
For CSR values larger than 0.25, the wear coefficient was found to stay relatively constant.
28
The experimentally determined wear coefficients based on the pin-on-plate wear test under varied contact pressures and cross-shear motions were numerically fitted to obtain a wear coefficient (C) function as follows
28

Creep model
A previously developed creep formulation for the PE bearings of total hip joints, by Bevill et al.
17
and Matsoukas et al.,
18
was applied in this study. The creep model was based on a uniaxial creep test and developed by Lee and Pienkowski.
29
The creep data were obtained for extruded, unirradiated GUR 4150HP UHMWPE, compressed with constant pressures of 2, 4 and 8 MPa in a 37° bovine serum reservoir for 10,000 min.
29
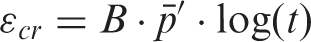
In this study, creep was modelled for five million cycles and creep recovery was not considered. The creep law was derived as a logarithmic function of time expressed by the creep strain (εcr) as follows
FE contact model
A FE contact model was used to obtain contact stress and determine contact area on the PE cup bearing surfaces during wear modelling. The PE cup was created using linear hexahedral elements, and the metallic femoral head was considered to be an analytical rigid body. The contact model was solved in ABAQUS™ (Version 6.8-1, SIMULIA, Rhode Island) using a small sliding contact mechanism based on static loading at each discretised time instant over a motion cycle, as developed in a previous study. 9 The total numbers of elements for the PE cups were approximately 2000 with a maximum element length of 0.5 mm on the contacting surfaces to ensure a converged contact stress solution. The PE was modelled as an elastic–plastic material with Young’s modulus 500 MPa, Poisson’s ratio 0.4 and initial von Mises yield stress 10.8 MPa. The material properties were originally tested using isotropic UHMWPE (GUR412, molecular weight 4 × 10⁶ g/mol) by the authors’ group and reported by Barbour et al. 30
Numerical creep and wear calculations
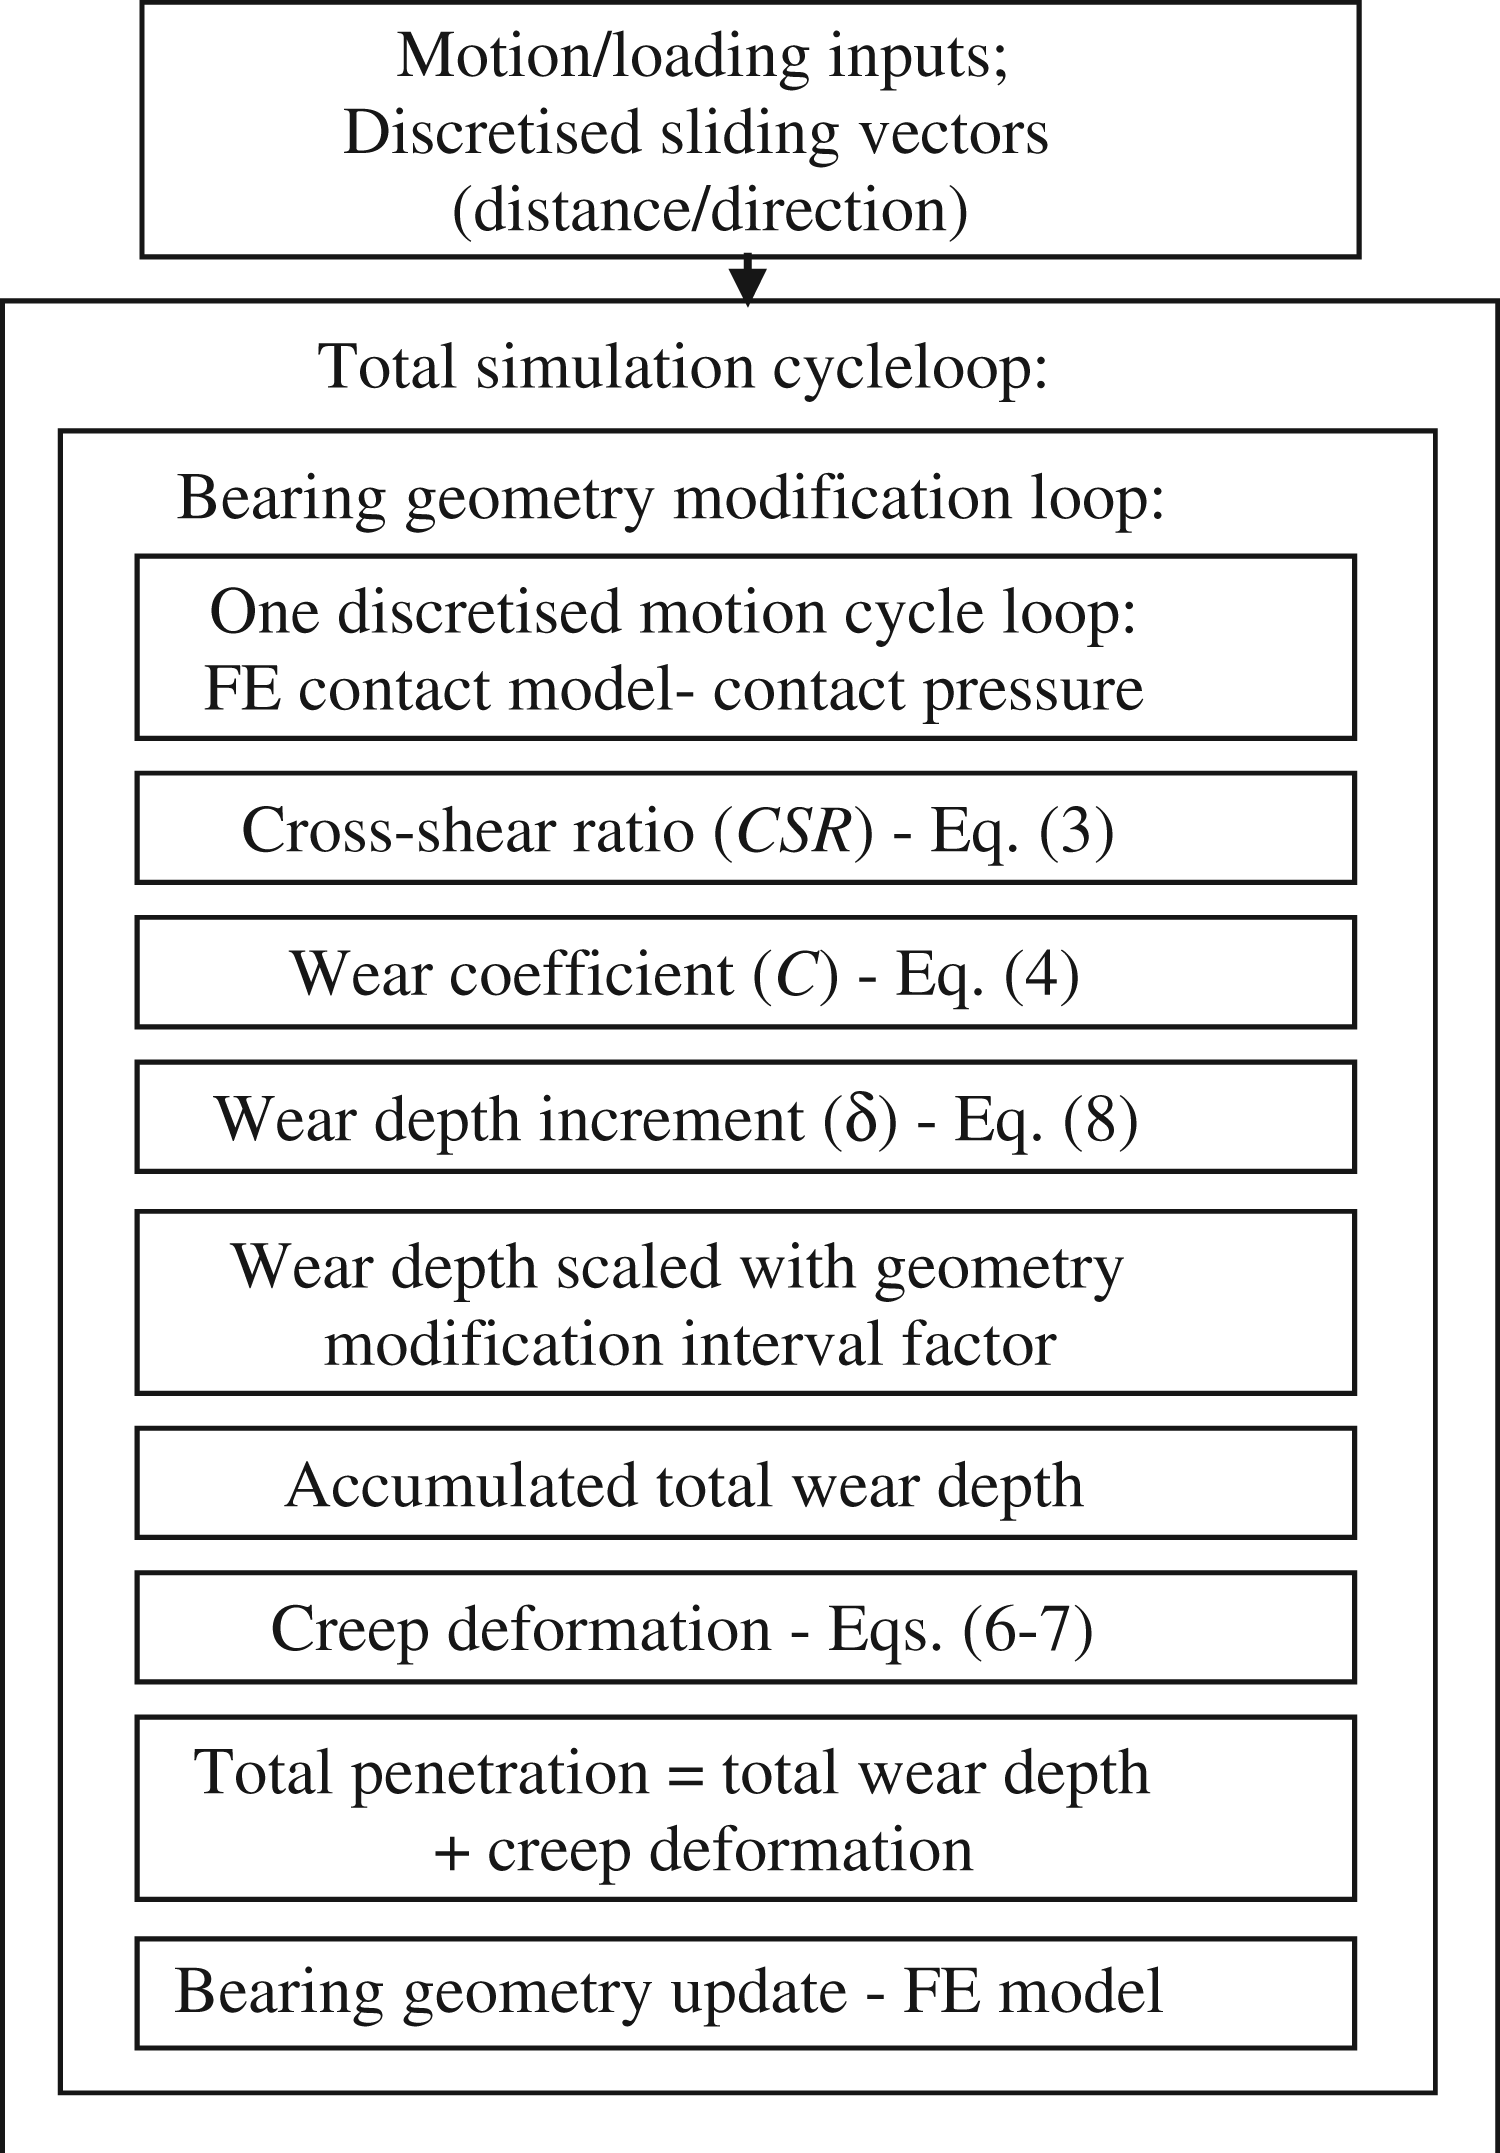
The total simulation cycles were temporarily divided into two phases. A short initial period of 2000 min, equivalent to the first 64,000 loading cycles, was especially chosen in order to capture the high initial creep strain rates. 17 According to Bevill et al., 17 10 time intervals were evenly selected in terms of logarithmic scale, resulting in the interval and discretised time instants, Δt′ = [log(2000)/10] and t′ = [log(2000)/10]·i, (i = 1,10), which are equivalent to real time in minutes, Δt = 10Δ t ′ and t = 10 t ′, respectively. After this initial stage, the interval factor was fixed at 250,000 (cycles) throughout the rest of the total simulation cycles.9,16
For a single loading/motion cycle, 16 equally distributed time points were selected over a time period of 1 s. The relative sliding vectors including sliding distance and direction were calculated for each nodal point on the PE contacting surface over the discretised intervals based on the original FE model geometry and kinematics conditions used. The bearing contact model was solved at the each time point to obtain contact pressures. The contact pressures and sliding vectors obtained were subsequently used to determine the PMO, cross-shear ratio (CSR) and wear coefficient (C) for the nodal points of the PE cup bearing, according to the methods described in the ‘Wear model and wear coefficients’ section.
For calculation of creep deformation, contact pressure obtained at each time point of a loading cycle was first averaged over the cycle as, 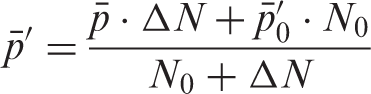
The discretised linear wear depth equation over a motion/loading cycle was also correspondingly calculated as
Flowchart of the numerical calculation of the wear and creep for total simulation cycles. FE: finite element.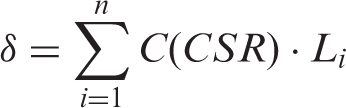
For comparison purposes, a specific wear rate as a function of a nominal contact area was considered for the PE cup bearings, for both the computational and experimental simulations. The specific wear rate was defined as volumetric wear (V) divided by the sliding distance (L) of the point corresponding to the resultant contact force acting on the cup bearing surface; the nominal contact area of the cup bearings was determined based on the original bearing geometry without considering creep and wear and calculated at each time instant using FE model, and averaged over the loading cycle.
Results
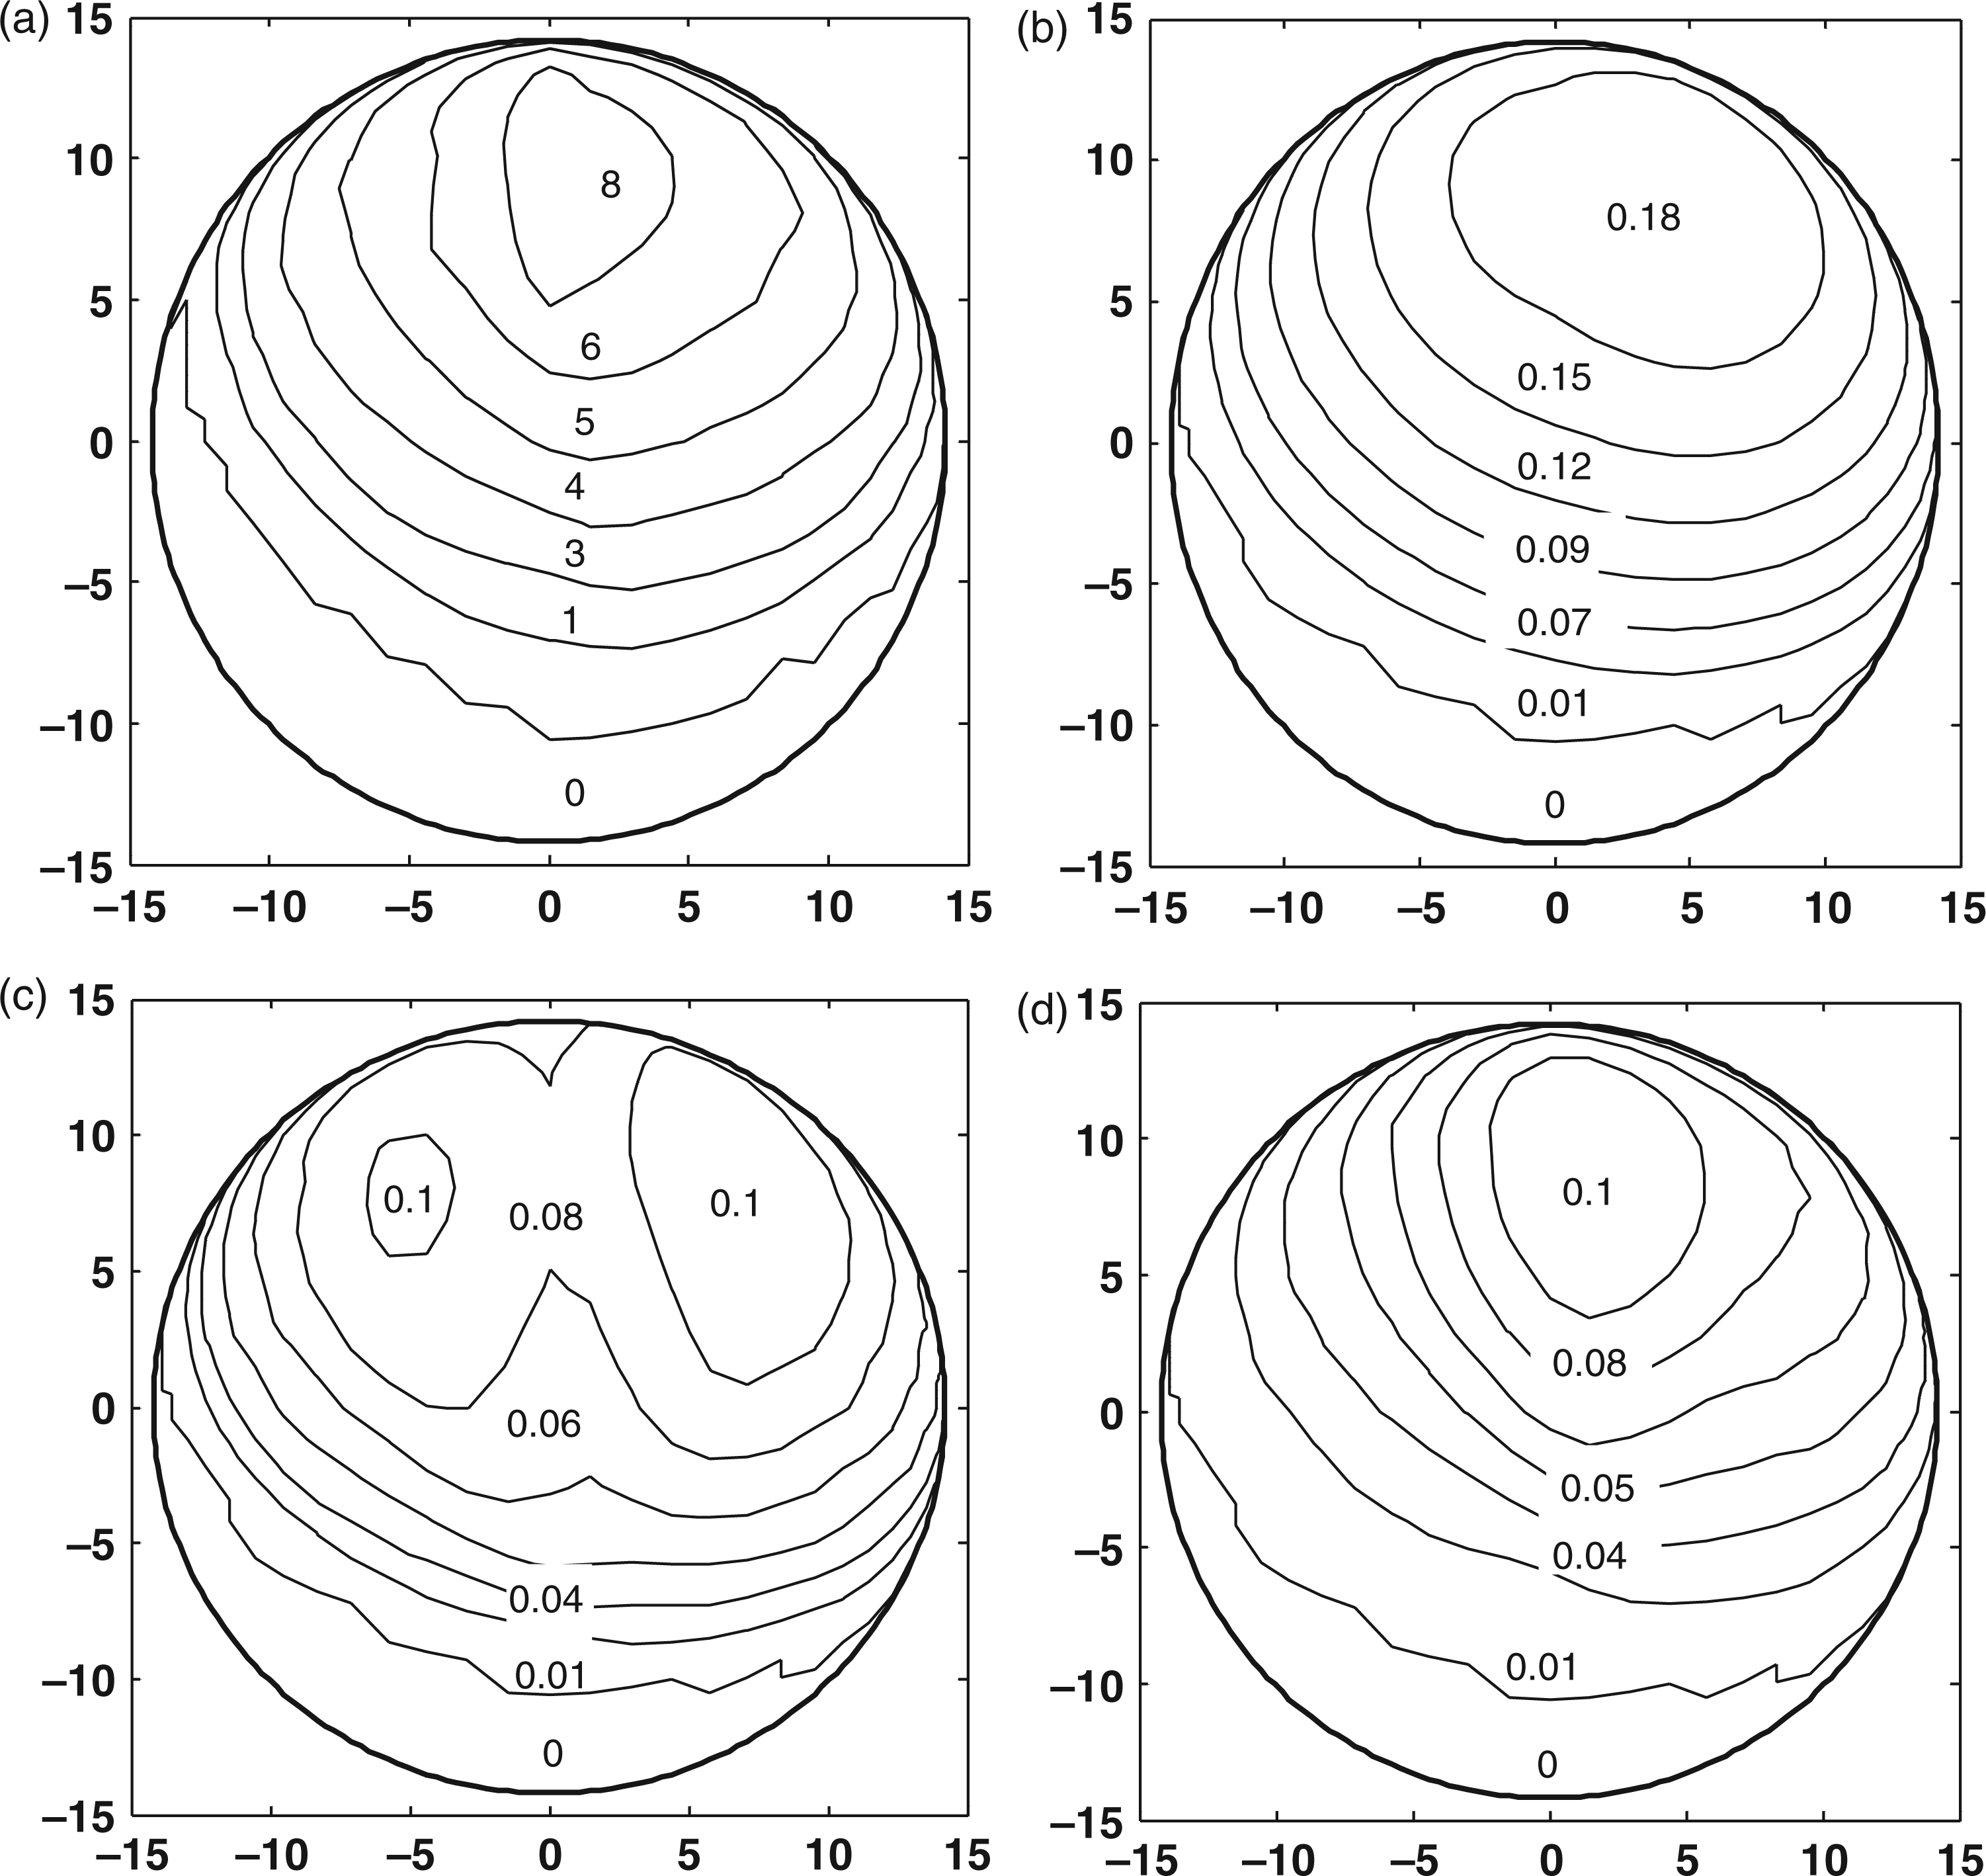
By considering the volume change and the maximum linear penetration of the cup bearings, the results obtained for a typical 28 mm diameter bearing with a radial clearance of 0.04 mm are taken as an example (Figure 4(a) and (b)). The total volume change was considered to consist of wear and creep. After the first million cycles, approximately 80% of the total volume change was due to creep (Figure 4(a)), with a similar proportion also for the maximum linear penetration (Figure 4(b)). For both the volume change and maximum linear penetration, the creep was stable after the first million cycles, but the wear increased as a function of the number of cycles. Figure 5(a) shows a representative contact pressure distribution on the PE cup bearing surface at the time instant of the first peak load of 2632 N after five million loading cycles. The distributions of total penetration, wear and creep on the bearing surface computationally simulated after five million cycles are also illustrated in Figure 5(b) to (d), respectively. The overall distributions of wear and creep generally followed that of contact pressure in terms of distribution size and location, as illustrated in Figure 5(a), except that the maximum wear depth of 0.1 mm was predicted at two locations (Figure 5(c)). The lower wear depths between the two maximum depth locations were due to the reduced cross-shear motions which led to reduced wear coefficients.
Computational predictions of the volume change of the PE bearing (a) and the maximum linear penetration (b) as function of the number of simulated cycles, for the 28 mm diameter PE cup bearing with a radial clearance of 0.04 mm. Computationally predicted distributions of contact pressure (MPa) (a) at the first peak load of 2632 N; total surface penetration (mm) (b); wear depths (mm) (c); and creep penetration (mm) (d), on the 28 mm diameter PE cup bearing surface after five million simulated cycles.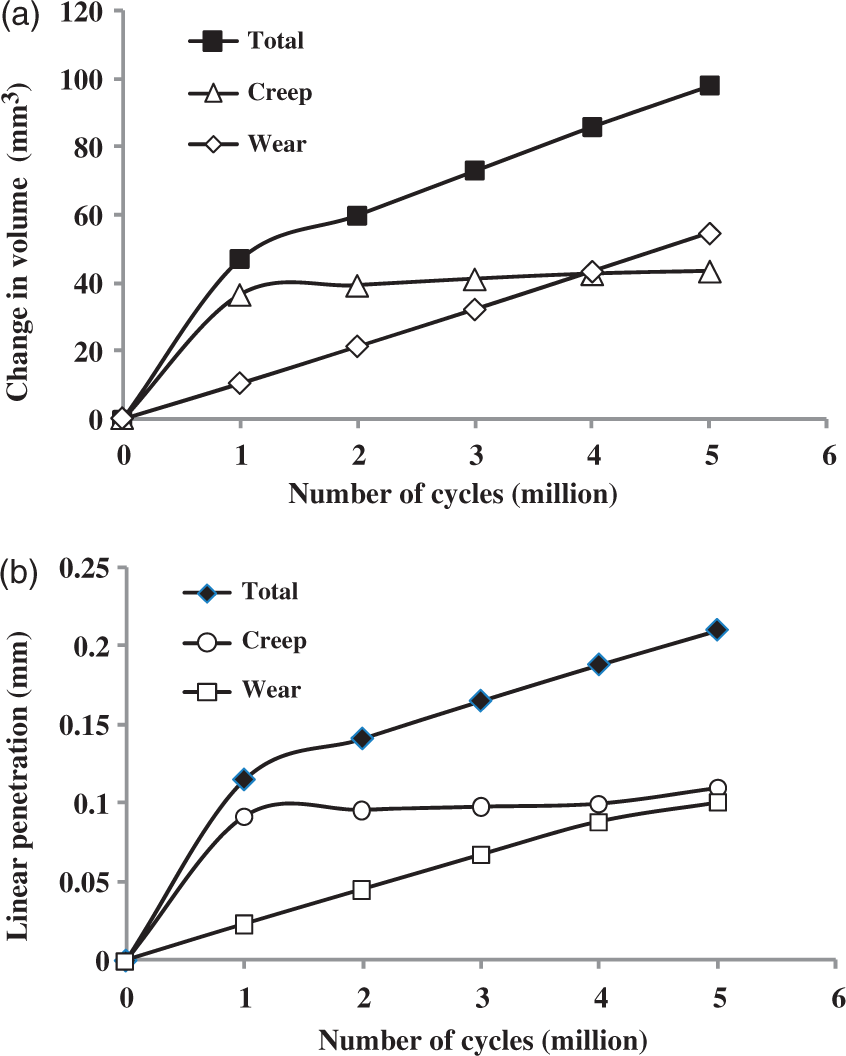
The computationally predicted effect of bearing clearances on wear is compared with the experimental measurement of a simulator test by Wang et al.
10
for a 32 mm diameter bearing with varied radial clearances, as shown in Figure 6. The larger contact area corresponds to smaller clearance since the contact area increases when the clearance decreases. A linear correlation was generally found between the wear rate and nominal contact area. It should be pointed out that the operational conditions used in the experiment were not exactly the same as those modelled by the present computational model. The loading and motion conditions are comparable in terms of the multi-directional motion of bearings and the double peak loading profiles according to the analysis by Calonius and Saikko.
31
The major difference in lubricants is that the total protein concentration of diluted serum lubricant used by Wang et al.
10
for simulator test was slightly higher, being 20 mg/mL, compared with 15.46 mg/mL used in the pin-on-plate wear test in obtaining wear coefficient for computational simulation. The lubricant with higher protein concentration would lead to an increased wear rate.
32
In Figure 6, the wear rates of simulator tests were larger and the overall trends of wear as a function of contact area were comparable between the computational prediction and experimental measurement.
Comparison of the wear rate, defined as the accumulated volumetric wear divided by the sliding distance corresponding to the resultant loading force acting on the cup bearing, as a function of the nominal contact area, calculated as the mean contact area of the cup bearing based on original bearing geometry, between the computational model and hip simulator testing for the 32 mm diameter cup bearing.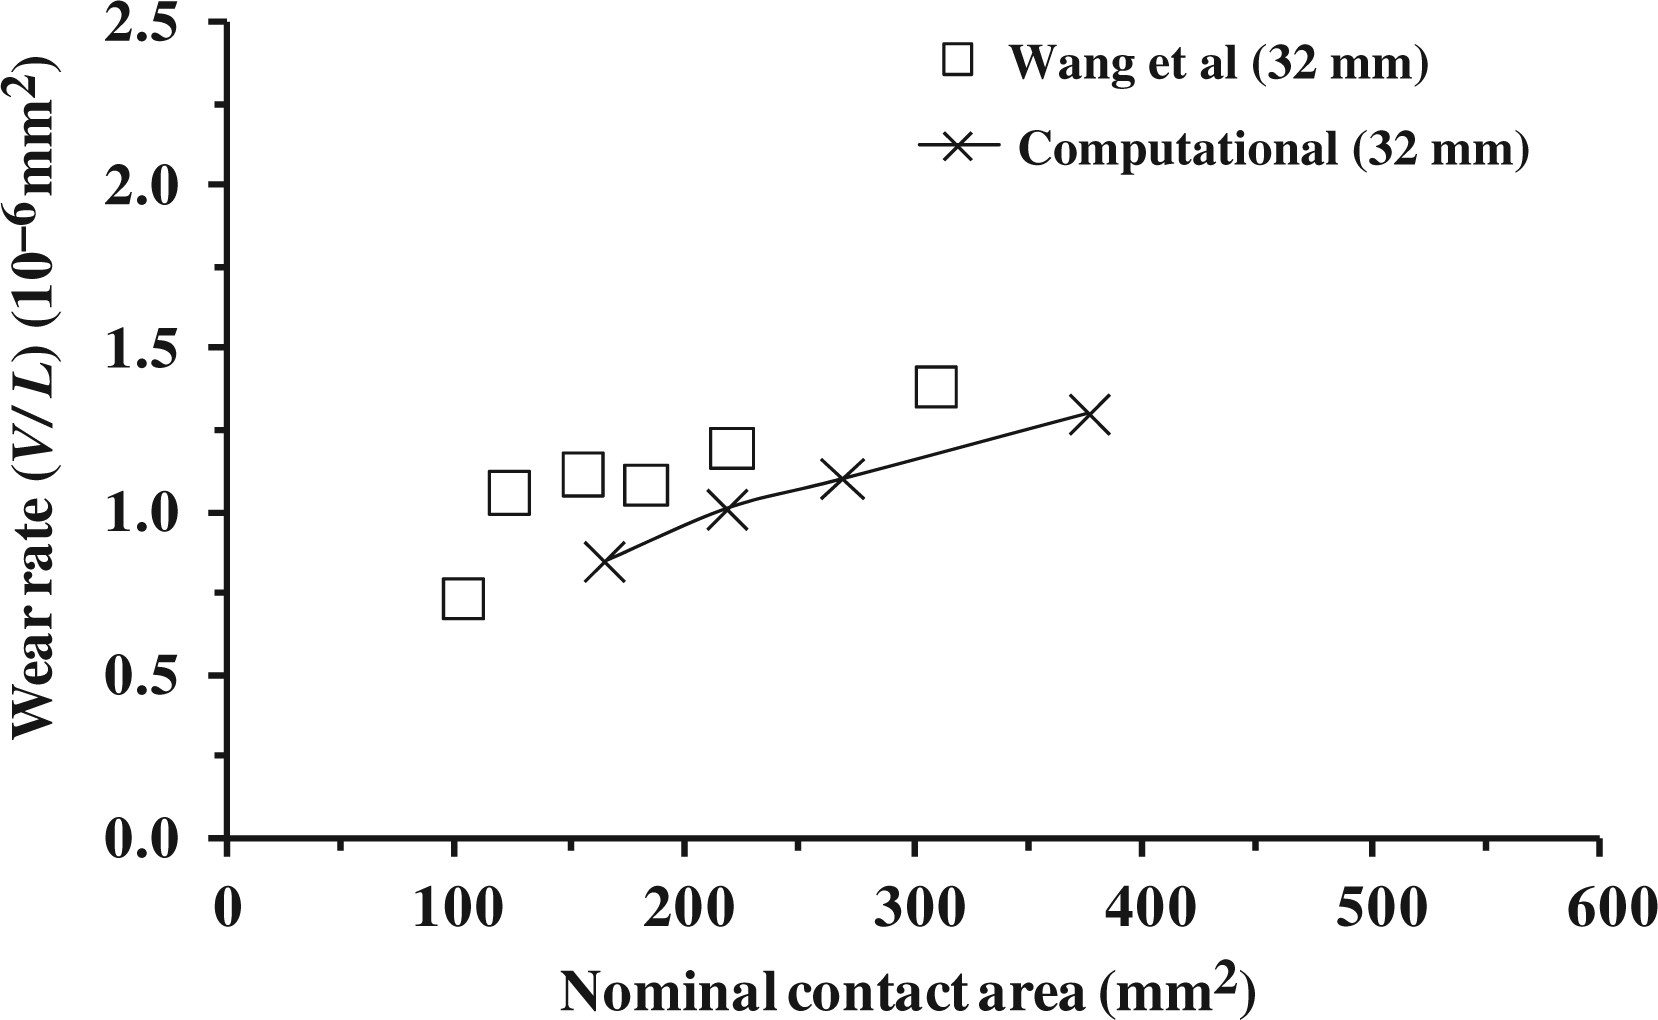
The accumulated volumetric wear is compared between the wear predictions with and without consideration of creep for the 28 mm bearing with radial clearance 0.04 mm as an example (Figure 7). The volumetric wear was increased, from 50 to 62 mm3 after five million cycles, approximately by 25% by considering creep in the wear modelling compared with the model without considering creep.
Comparison of the cumulative volumetric wear (mm3) computationally predicted for the 28 mm diameter PE cup bearing between the models with and without the creep deformation calculation.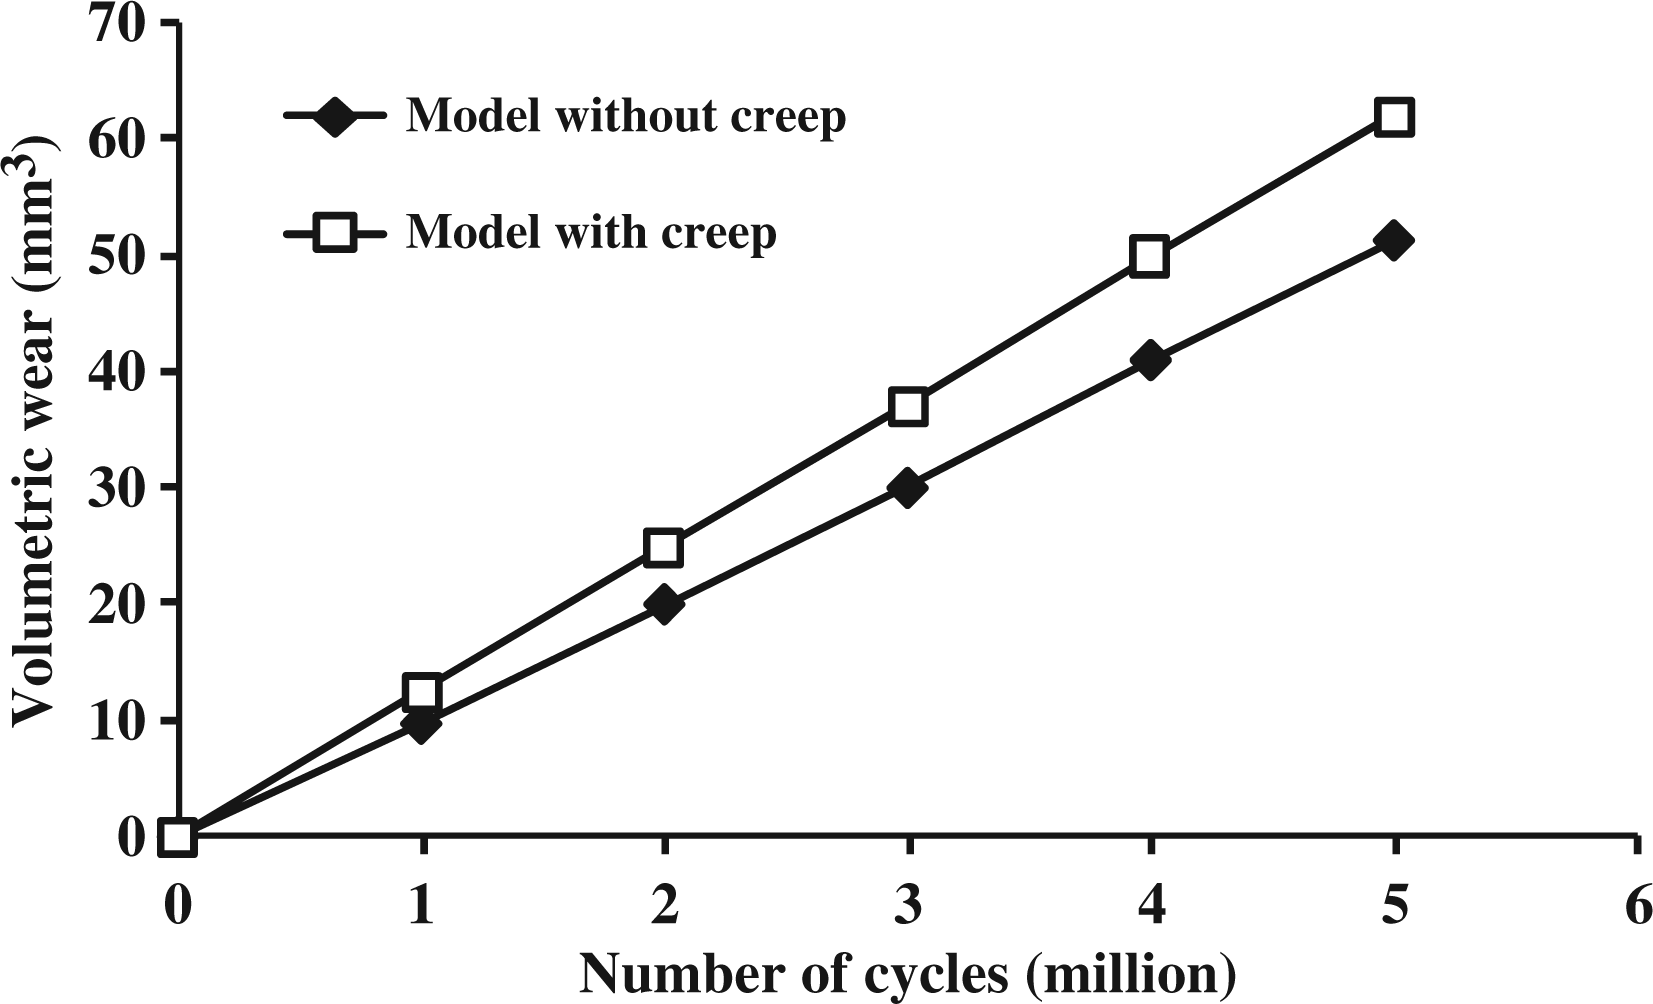
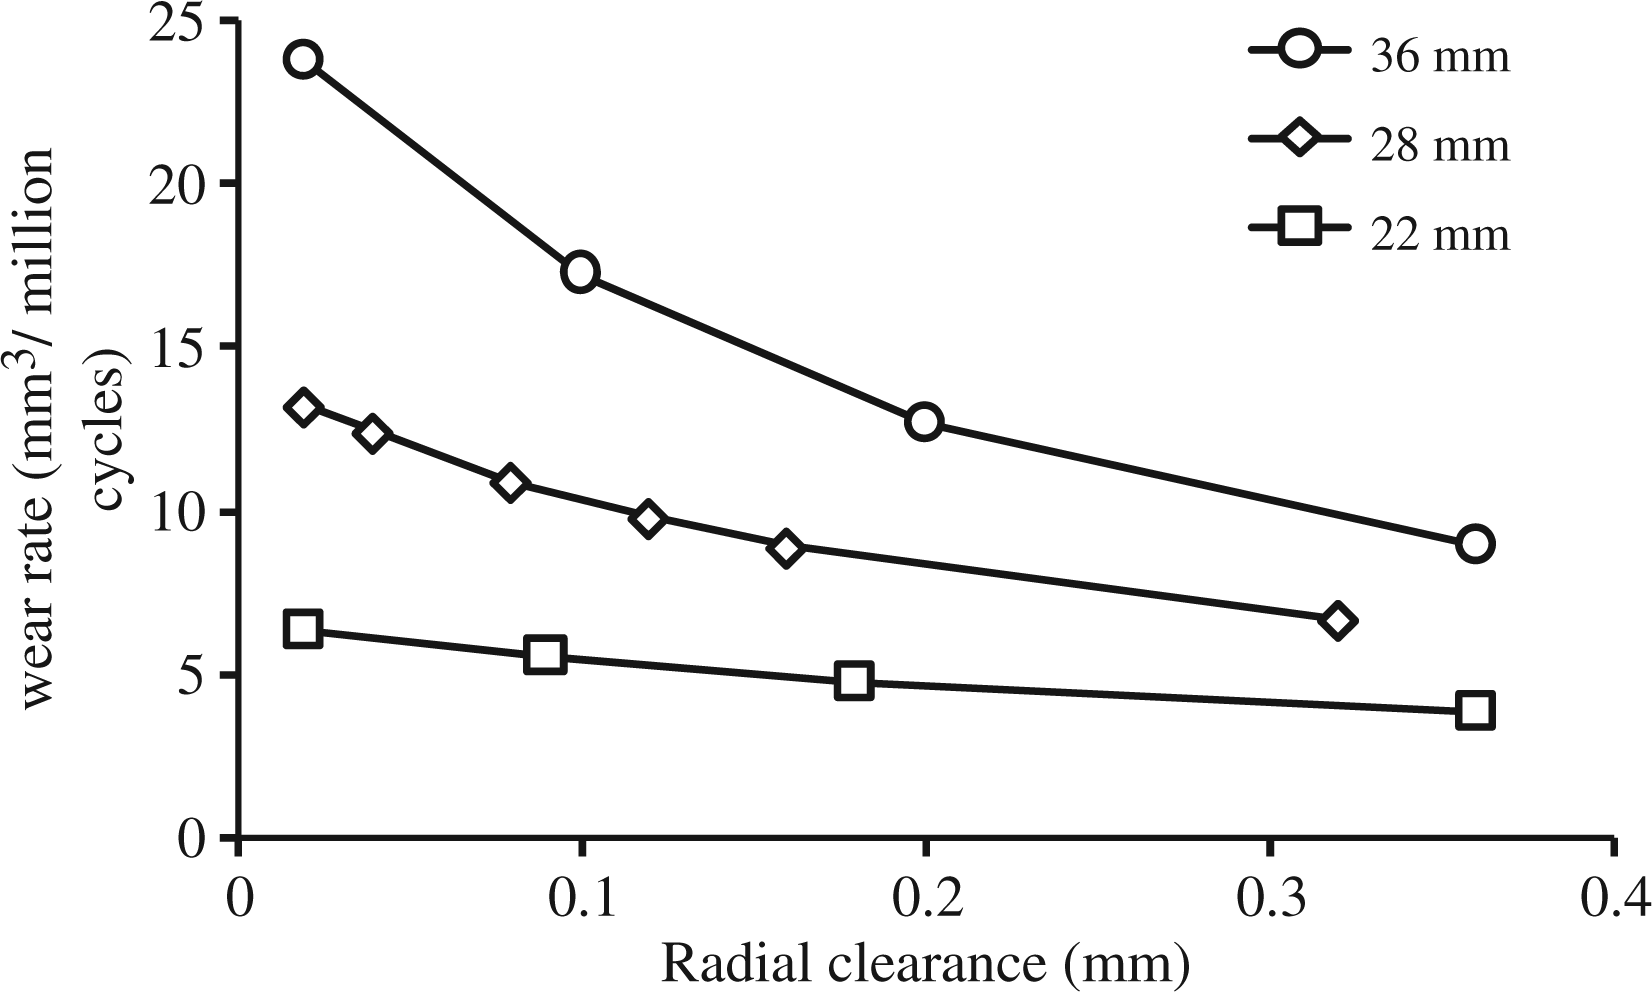
The accumulated volumetric wear as a function of bearing clearance was compared for a typical 28 mm diameter bearing with varied radial clearance values between 0.02 and 0.32 mm (Figure 8(a)). The accumulated wear increased with the number of loading cycles, and the increase in bearing clearances led to a decrease in wear for the 28 mm diameter bearings; the wear volume reduced by twofold when the radial clearance value increased from 0.02 to 0.32 mm. The volumetric wear rates, defined as volumetric wear per million cycles, were calculated for each million cycles and compared for the 28 mm diameter bearings with varied radial clearances in Figure 8(b). The wear rate increased from 6.0 to 7.2 mm3 for the bearing with a larger radial clearance of 0.32 mm and decreased from 13.7 to 12.8 mm3 for the bearing with a lower clearance of 0.02 mm, over the five million cycles simulated. The overall variation in wear rate was approximately 20% over five million cycles and 4% at each million cycles. The accumulated volumetric wear was generally linear in Figure 8(a), which is consistent with the results obtained from the simulator tests.21,33 The volumetric wear rate was further compared for all the bearing sizes, from 22 to 36 mm, with various radial clearances, from 0.02 to 0.35 mm (Figure 9). The volumetric wear rates were computationally predicted to range from 4 to 6, 6 to 14 and 10 to 24 mm3 per million cycles for the bearings with diameters 22, 28 and 36 mm (radial clearance varying from 0.02 to 0.35 mm), respectively. Generally, larger wear rates were associated with larger bearings, and the wear rate decreased when the clearance increased. Particularly, for the 36 mm bearing, the reduction in wear rate was approximately twofold, from 25 to 10 mm3 per million cycles, when the clearance increased from 0.02 to 0.35 mm. The similar trend was also found for the 28 mm bearing. For the 22 mm bearing, the wear rate was relatively constant as a function of the clearance.
Comparison of the accumulated volumetric wear (mm3) (a) and volumetric wear rate (mm3 per million cycles) computationally predicted over five million cycles (b) for the 28 mm diameter PE cup bearing with varied radial clearances from 0.02 to 0.32 mm. Comparison of the volumetric wear rate (mm3 per million cycles), defined as the volumetric wear divided by the number of simulated cycles, as function of the bearing radial clearance, for the PE cup bearing with varied diameter sizes 22, 28 and 36 mm.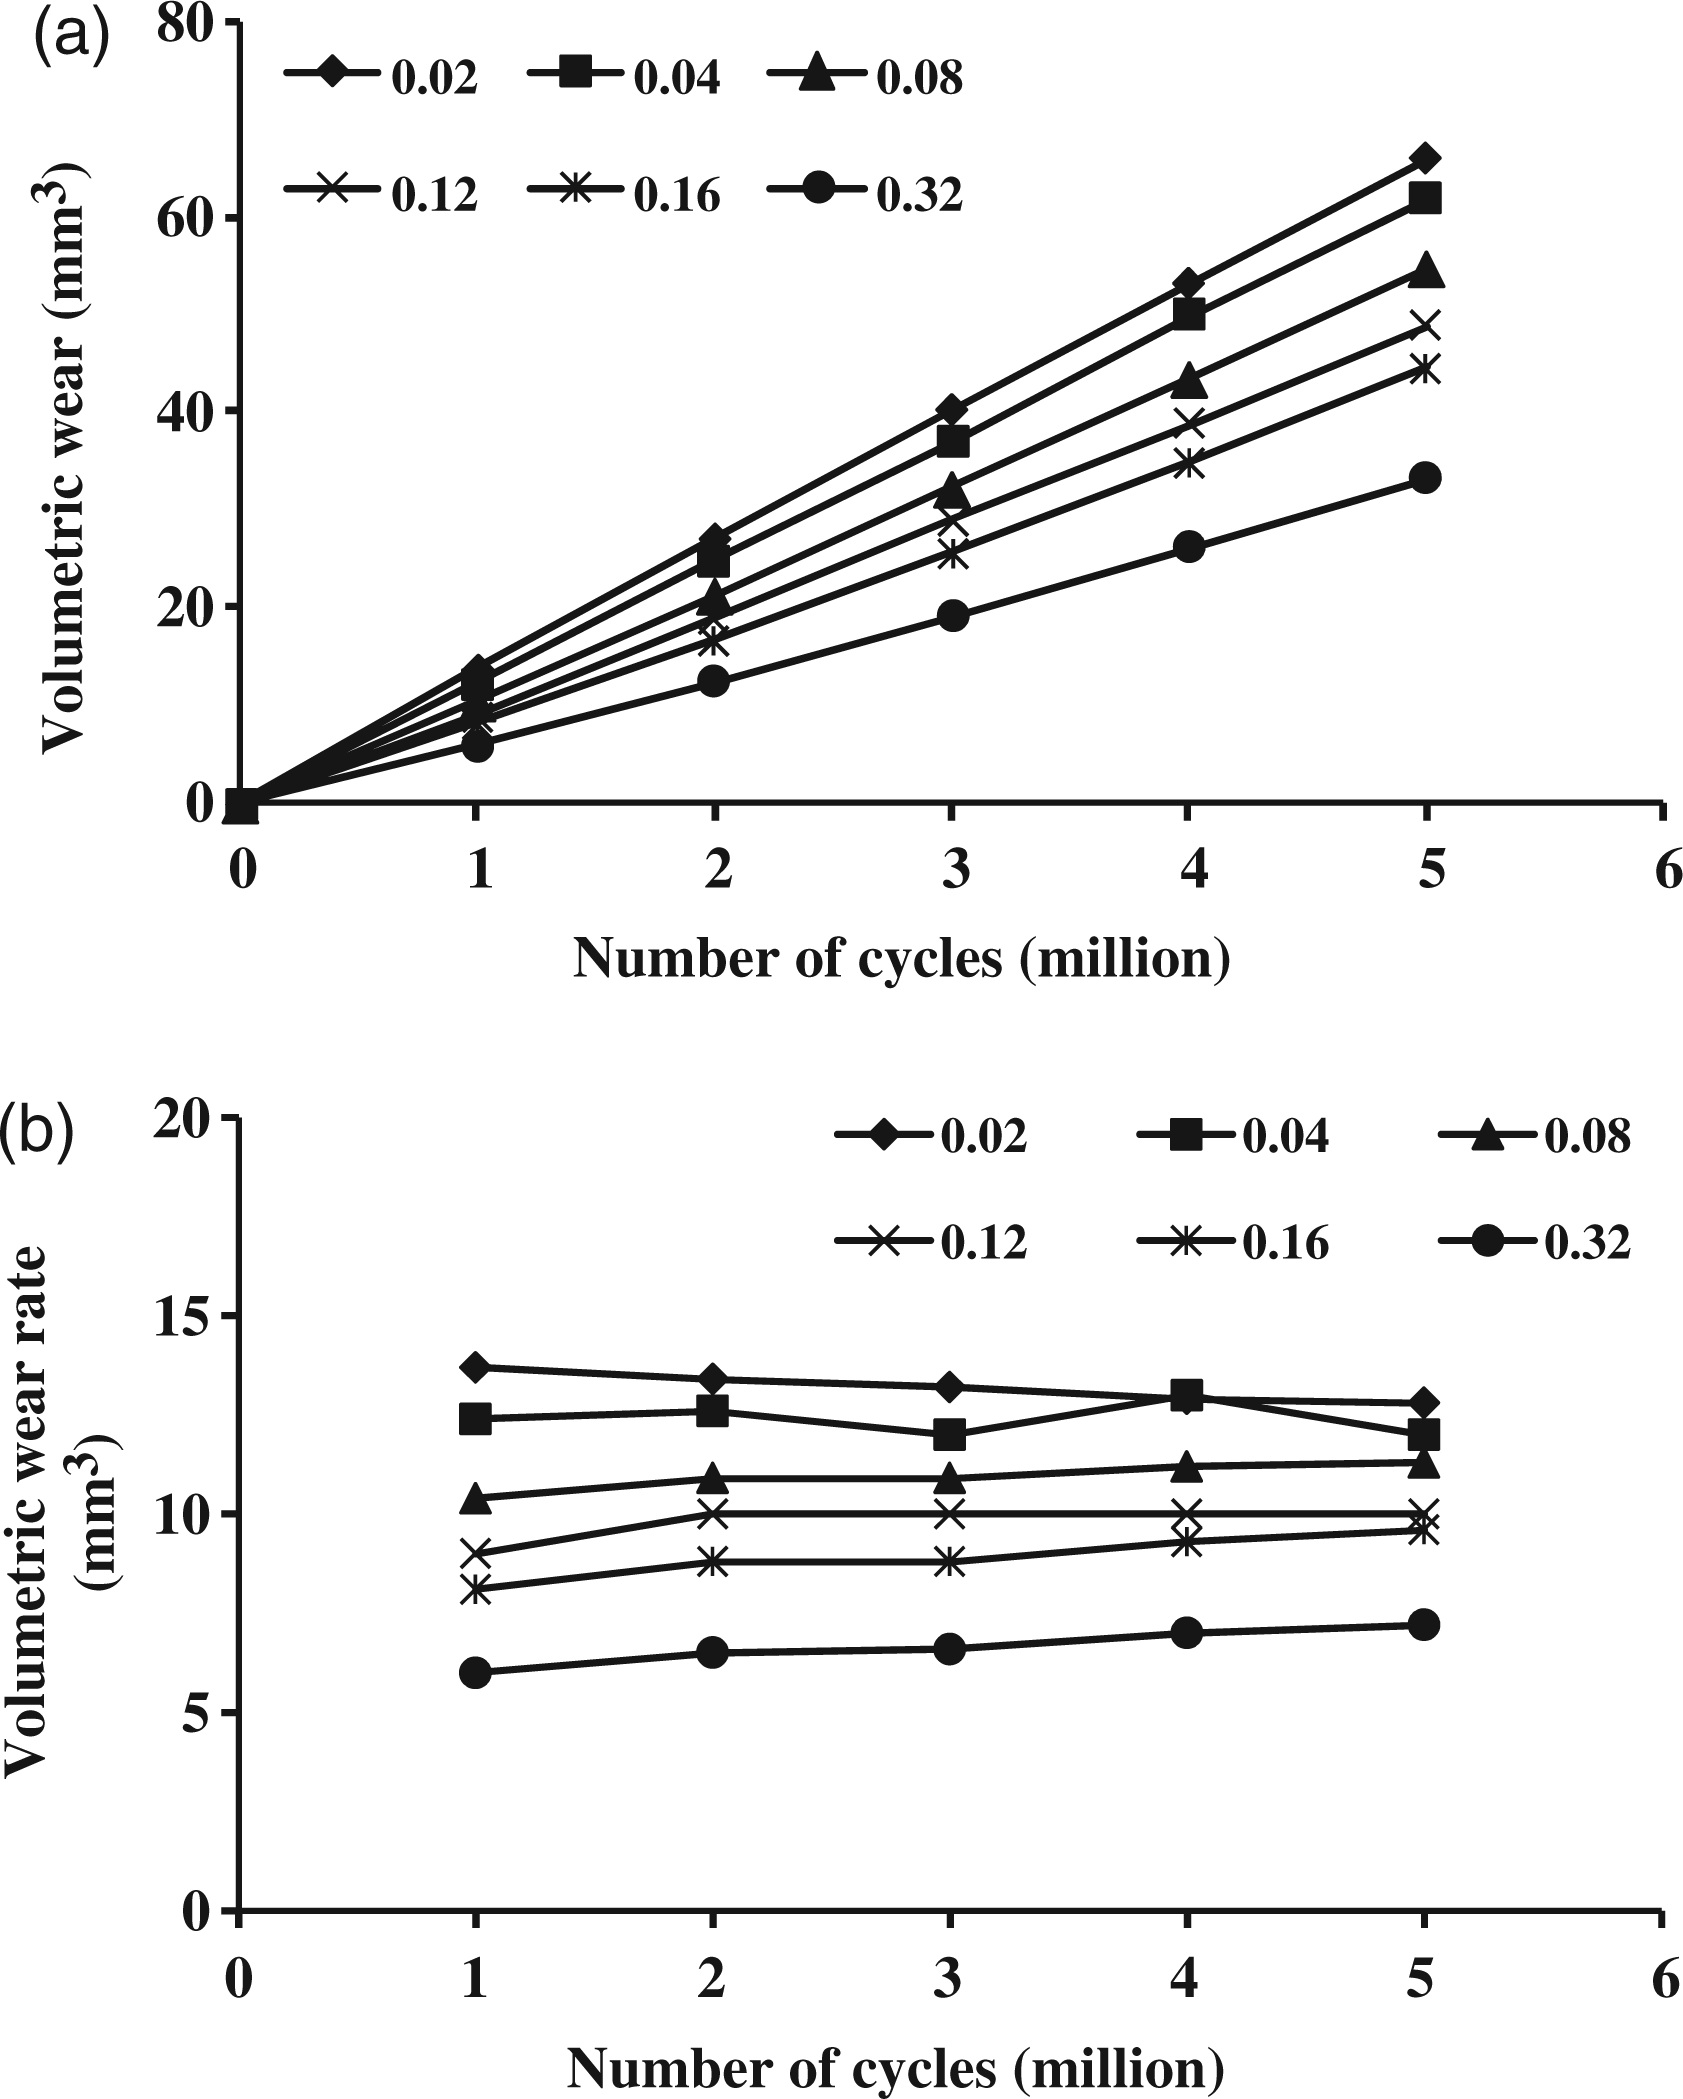
Discussion
Both clinical and experimental studies have shown that creep may account for a significantly large proportion of surface penetration on PE cup bearings, particularly during the first million cycles.21,33– 35 The synergistic effect of creep and wear on the bearing contact has been incorporated in the computational modelling. Both the total volume change and the maximum linear penetration obtained from the computational model showed a similar trend, an elevation at the first million cycles followed by a steady-state stage (Figure 4(a) and (b)), which was similar to that of simulator tests.21,33 The total volume change and total linear penetration during the first million cycles were largely attributed to creep, as observed in both experimental and clinical studies.21,33– 35 After the first million cycles, creep was relatively constant while volumetric wear steadily increased (Figure 4(a) and (b)), which was also consistent with experimental measurements. 21 The present computational creep prediction was larger than that of experimental measurements; for example, the volume change and the maximum linear penetration corresponding to creep were approximately 40 mm3 and 0.1 mm, respectively, for the 28 mm diameter cup bearing, compared with the simulator results of 25 mm3 and 0.05 mm, reported by Galvin et al. 21 The present creep formulation can be seen as a first approximation to incorporate creep. Further tests are needed to obtain the creep properties of UHMWPE by considering anisotropic and strain recovery characteristics as well as different testing conditions as pointed by Lee and Pienkowski. 29
The distributions of accumulative linear penetration, wear and creep on the PE cup bearing surface, as shown in Figure 5(b) to (d), respectively, closely followed the contact pressure distribution in terms of size and location, as illustrated in Figure 5(a). The linear penetration distribution, shown in Figure 5(b), was found to be similar to the experimental measurement reported by Kang et al. 25 The maximum linear penetration computationally predicted was 0.2 mm, which is in the range of experimental measurements, between 0.2 and 0.4 mm, obtained using a CMM from simulator tests, as reported by Galvin et al. 21 and Kang et al. 25 In Figure 5(c), the maximum wear depth averaged at 0.1 mm was computationally predicted at two separate locations on the bearing surface. This was because of a slightly lower wear coefficient owing to slightly reduced cross-shear motion that occurred between the two locations in question (Figure 5(c)). The effect of cross-shear motion on PE wear is important to model different patient activities in the design of artificial joints in future studies.
The use of larger diameter femoral heads has been found not only to increase the range of motion and stability of the hip joints but also to cause increased PE wear. 8 On the other hand, the wear of PE cup bearings can be significantly reduced when the bearing clearance increased, as demonstrated in a simulator test by Wang et al., 10 and as shown in Figure 6. But the simulator wear study was focused on the effect of contact stress on PE wear by considering wear factor as a function of contact pressure. The simulator study found that the wear factor was decreased when contact pressure increased, which is in agreement with the result from pin-on-plate tests. 36 However, the use of a varied wear factor as a function of contact pressure was difficult not only to implement in computational modelling but also understand the wear mechanism. The contact area dependent wear law for PE bearings has been developed based on pin-on-plate wear tests and validated for PE total hip joints in a previous computational study. 9 The computational prediction of wear rates in this study showed a comparable trend to experimental measurement, with the wear rate being an approximately linear function of contact area (Figure 6). The comparable trend of the wear rate as a function of contact area supported the use of the contact area dependent wear law for PE bearings. The use of the contact area dependent wear law leads to the wear coefficient being a constant over the contact pressure range experienced by PE hip joint bearings and the volumetric wear being proportional to contact area. Hence, the wear coefficient can be a function of cross-shear motion only. The effect of clearance on wear as demonstrated in the simulator test can, therefore, be theoretically interpreted as the significant variation in contact area resulting from varied bearing clearances. It has been recognised that reducing bearing clearances can improve fluid film thickness for artificial hip joint bearings. 37 The lubrication of UHMWPE-on-metal hip implants in this study was generally considered to function under boundary to mixed lubrication condition. 38 The minimum radial clearance of 0.025 mm was reported in the simulator study for wear by Wang et al. 10 which supports the boundary-mixed lubrication assumption. A full numerical mixed lubrication analysis is not available for the present PE joint bearings. The effect of lubrication on wear was generally incorporated in the wear coefficient using lubricant in pin-on-plate tests in determining wear coefficient.
Figure 7 shows that creep deformation led to an increase in wear generation, for example, by 25% in volumetric wear for the 28 mm diameter bearing, when compared with the calculation without considering the creep. The initial creep increased the contact area and consequently the wear. After the initial stage, creep stayed constant and the bearing geometry change was mainly due to wear. The accumulated volumetric wear predicted as a function of the number of simulated cycles was non-linear (Figure 8(a)), which can be considered by comparing the corresponding volumetric wear rates (wear volume per million cycles) for each million cycles, as shown in Figure 8(b). The variations in wear rates, approximately 20% over five million cycles, were a result of the bearing geometry change when wear progressed. For the bearing with larger bearing clearances (greater than 0.04 mm for the 28 mm diameter bearing), the wear could increase the bearing conformity and hence increased wear rates, while for the bearing with lower clearances (0.02–0.04 mm), the bearing conformity could be initially high and then decreased by wear over the total simulated cycles. However, the variation in wear rates due to geometry change caused by wear was small compared with the effect caused by varied bearing clearances, as shown in Figures 8(b) and 9. It should also be pointed out that the wear coefficient for the UHMWPE modelled in this study was constant over the range of contact pressures considered (1–10 MPa), 9 the contact pressure that occurred during creep and wear process was considered to fall within this pressure range, as indicated by the contact pressure prediction in Figure 5(a), and therefore, the wear rate variation discussed here was only a result of geometry change during creep and wear processes.
In Figure 9, the wear rate increased when the bearing diameter increased for a fixed bearing clearance. The effect of clearance on wear was also significant based on the results presented in Figure 9. In the current design of PE hip joints, the bearing clearance tends to be smaller; for example, the radial clearance is approximately 0.05 mm for 28 mm diameter bearing. The wear rate of a larger bearing can be reduced to the same level as that of a smaller bearing by increasing the clearance. For the 36 mm diameter bearing, the wear rate can be reduced by twofold, from approximately 25 to 10 mm3, by increasing the radial clearance from 0.02 to 0.35 mm (Figure 9). The computationally predicted reduction in wear resulting from the use of larger clearances for PE cup bearings is consistent with the simulator wear test, as reported by Wang et al., 10 in which a twofold wear reduction was found, quantified using the wear factors, 3.0 and 1.5 mm3/Nm × 106, respectively, for the 32 mm diameter bearing with radial clearances 0.05 and 0.4 mm. Bevill et al.’s 17 calculation using the conventional Archard wear law showed a reduction in wear by 15% for the clearance value ranging from 0.02 to 0.4 mm, which was significantly lower than the present prediction. This was due to the use of the Archard equation in predicting wear.
There are limitations in the present wear simulation. As explained in the previous study, 9 the wear coefficient obtained from the pin-on-plate wear test may be underestimated, which led to the computationally predicted wear rates being lower than those of simulator tests. The lower wear coefficients may be due to the static load used in the pin-on-plate test to represent dynamic loading as practically adopted by physical simulators. Some recent tests have shown that PE wear can be larger under dynamic loading. 39 There are many factors involved in the pin-on-plate test that can affect the wear coefficients such as loading and motion (velocity, magnitude and direction), bearing geometry (radius and contact area), surface roughness, temperature, lubrication and UHMWPE material properties. The present pin-on-plate test serves as a basis for further tests. Future study should be focused on pin-on-plate tests using a wide range of testing conditions to fully understand the effects of different conditions on wear coefficients.
Conclusions
Computational wear modelling was improved using the contact area dependent wear law and incorporating the creep deformation formulation in wear modelling. The wear rate of the PE bearing can be decreased by twofold by increasing the bearing clearance from 0.02 to 0.35 mm. A larger diameter bearing generally resulted in a higher wear rate. Creep deformation was found to increase wear generation by approximately 25% compared with modelling without the creep being considered. Larger bearing clearance should be considered in the design of PE total hip joint bearings, particularly with increasingly larger bearing diameters.
Footnotes
Funding
This study was partially funded through WELMEC, a Centre of Excellence in Medical Engineering funded by the Wellcome Trust and EPSRC, under grant no. WT 088908/Z/09/Z and additionally supported by the National Institute for Health Research (NIHR) as part of a collaboration with the Leeds Musculoskeletal Biomedical Research Unit. Prof. John Fisher is an NIHR senior investigator.