
Abstract
The home is a crucial site of young children's early encounters with digitally connected technologies. It is here that their emerging digital footprints are being formed and where digital data about them is being produced then collected, analysed and commodified in varying ways. While much is speculated about the rise of intelligent assistants, baby monitors, connected toys and goods, there is little quantitative information available about what sorts of devices households with children actually contain. This article reports on findings from an online survey of 504 Australian households with children aged 0–8 years. The survey was designed to capture a snapshot of internet connected devices and goods in households as a way of contextualising current discussions around the datafication of childhood. Results indicate that Australian households with young children are indeed highly connected, and this is primarily via devices already well domesticated into everyday family life such as TVs, computers and smartphones. We discuss several key points emerging from our findings, including: the safety and security of the household as a primary motivator for using smart home devices; the different rates of acceptance of the datafying objects in the home; and the Googlization of family life. We conclude the paper by outlining a research agenda that more accurately reflects the digital realities of Australian family life.
Background and context
Australian families increasingly rely on digital technologies to organise, communicate and document everyday life. In the home, digital data are generated from any connected device, gadget or toy, as well as a growing number of ‘smart’ appliances like fridges and security systems. The data that is generated through use can be collected and processed providing insights into the routines and rituals of the family and the individuals in it. This process is known as datafication. Datafication is the transformation of digital interactions into a record that can be collected, analysed and commodified (Mayer-Schnberger and Cukier, 2013). Children are no exception to datafication as digital data about them is being collected, analysed and commodified in varying ways (Barassi, 2021; Mascheroni and Siibak, 2021).
When it comes to children, anxieties around datafication are increased. Not only can datafication threaten children's digital rights and privacy (Livingstone and Third, 2017; Lupton and Williamson, 2017), but how practices like profiling, tracking and the commodification of personal data will impact children's social and educational futures is largely unknown (Barassi, 2021; Holloway, 2019; Mascheroni and Siibak, 2021). Children are entitled to special protections that provide them with the space to grow, play and experiment with who they are without coercion and intrusion by commercial entities (United Nations Convention on the Rights of the Child, 1989). Several high-profile data breaches have raised urgent questions about the use and misuse of children's personal data. For example, the US Federal Trade Commission found electronic toymaker Vtech had violated privacy laws by collecting the personal information of over 650,000 children when they downloaded an app to use with their educational toys (Pahl, 2018).
Despite these concerns, we know little about the processes of datafication in children's everyday lives, including how it takes place, and the practices of families to protect and manage data. Indeed, while there has been a lot of hype and concern about the ‘smart’ home (Sadowski, 2020), the use of home assistants (Strengers and Kennedy, 2020) and the rise of connected toys and parenting devices (Berriman and Mascheroni, 2019; Leaver, 2017; Smith and Shade, 2018), we do not really know how ‘smart’ and connected Australian family homes are. Digital research has tended to focus on specific devices, platforms and apps, rather than how households as a whole are connected. In addition, marketing tends to focus on smart home devices as highly personalised, overlooking the ongoing negotiations between household members of different ages and genders (Dahlgren et al., 2021). Investigating connections in the household, allows for a more nuanced picture of how individuals become data subjects via the range of connections they interact with as part of contemporary family life. While there is literature investigating datafication in educational contexts (Pangrazio and Sefton-Green, 2022), in the home the individual is socially situated within relationships, routines and practices that differ from formal education environments. Despite increases in opportunities for datafication in the home through the proliferation of connected devices, goods and toys (Sadowski, 2020), little is known about the actual prevalence of such technologies.
The datafication of childhood is an international phenomenon but, in this paper, we present findings from the Australian context. While Australia shares many cultural, social and economic similarities with other nations of the ‘Global North’, it is a unique case when it comes to digital technologies and datafication due to its geography and internet infrastructure (Kennedy et al., 2016). While the majority of Australians live in urban settings, four in 10 Australians live in rural and remote areas where the provision of digital infrastructures, like broadband networks, pose logistical challenges (Ewing et al., 2015). In addition to the geographic characteristics of Australian households, government initiatives aimed at increasing internet access have shaped the socio-political landscape of home internet in Australia (Wilken et al., 2013). The National Broadband Network (NBN) is a national, open-access data network that was designed to provide Australians with high-speed internet connection thus facilitating participation in the ‘networked economy’. It was rolled out and operated by the NBN Co, a Federal Government initiative that sells access to retail service providers. Across Australia, 8.5 million premises had active NBN connections in 2022, with the majority of these receiving a wholesale connection speed of 50 Mbps (Granwal, 2022). For these reasons, Australia has great variation in digital access and use, and this means that it enables a unique insight into the effects of social, cultural, economic, and geographic factors on the provision and use of digital technologies.
In this article, we present findings from a study that focused on the home as a site of datafication. This study is part of a larger project analysing how children and infants are datafied through everyday practices. We report on findings of a national survey of 504 Australian households with children aged 0–8 years which investigated the digital technologies families have in their homes. The knowledge generated through this study will be important to future theorisations of the smart home, connected parenting and family life, and the datafication of childhoods. We begin the article with an overview of what is known about the datafication of childhoods, households and parenting, before detailing the research methods and findings. We discuss these findings in terms of the motivations and drivers for the acquisition of smart home devices, the different rates of acceptance of data generating objects in the home and the proprietorial ecologies that are emerging. We conclude the paper by arguing for research attention on the datafying capabilities of both the novel and mundane devices that reflects the digital composition of Australian family homes.
The datafication of childhood
By the age of 13 years, it is estimated that advertisers will have collected over 72 million data points about a child (Hollonds, 2021). From birth, children's identities are ‘datafied’ through state-based platforms associated with health and education, as well as personal digital devices and practices. Commercial and state institutions responsible for data collection have an interest in children's personal information, as do data brokers, who sell this information to third parties (e.g. advertisers and insurance companies). The insights derived from personal data shape an individuals’ online engagements and experiences, as well as their future prospects. For children, this is a particularly complex process as not only are their digital rights mediated by adults, namely parents, carers and teachers, but they are routinely placed in situations where large amounts of personal data are generated and collected. This includes: the sharing of health and psychological data via government platforms; data collected by platforms and apps for learning and entertainment (Human Rights Watch, 2022); networked toys and games (Denham and Wood, 2022); and parent sharing or ‘sharenting’ of children's data on social media (Blum-Rose and Livingstone, 2017).
The datafication of parenting
Technologies involved in infant care are also increasingly available with ‘smart’ sensors and accompanying smartphone apps meaning that intimate care practices are now sources of data generation (Leaver, 2017). For example, products for tracking child development milestones (Prior and Coull, 2020), pregnancy (Lupton and Pedersen, 2016), infant sleep (e.g. Snoo Smart Bassinet) and feeding (Walsh, 2020) are now readily available. These connected apps and devices may collect information that can identify individuals, meaning children's toys and gadgets are now synonymous with dataveillance and commercialization that ‘trouble the privacy rights of the child and parent’ (Smith and Shade, 2018: 8).
Parental fear and anxiety are potent drivers of technology acquisition, with global trends suggesting devices and apps that are designed to monitor and control children and infant's behaviour are on the rise (Anderson, 2016). This begins early in a child's life with a range of monitors and wearables that enable what Leaver (2017) calls ‘intimate surveillance’. As Leaver (2017) explains, devices like the ‘Owlet’ – a wearable sock for babies which tracks heart rate and oxygen levels – normalises ‘the idea that digital surveillance of infants equates with care and good parenting’ (4). In a similar way, self-tracking pregnancy apps (Barassi, 2017) are discursively constructed as the solution to many of the fears and anxieties that individuals feel about pregnancy and childbirth despite research showing that many do not have adequate data protection measures in place (Bert et al., 2016).
As another example of technology that is marketed as giving parents ‘peace of mind’, ‘Parental control’ apps are apps that enable parents, to monitor, filter and restrict children's online interactions and engagements. However, Feal and colleagues (2020) conducted an exhaustive study of 46 of the most popular parental control apps in the Google Play Store, and found that over ‘72% of the apps share data with third parties … without mentioning their presence in their privacy policies’ (314). Similarly, in their ‘Privacy report card for parental controls’, Mannan et al. (2020) reported that the 165 most popular parental control apps have extensive security and privacy vulnerabilities.
The home as a site of datafication
While the home has always been thought of as ‘private’ space, the rise of internet connected devices, goods and systems have turned it ‘inside out’, so that it is no longer a self-contained node but has ‘multiple, commercial, cultural and technical networks, all of which interact, and all with local implications and global reach’ (Kennedy et al., 2020: 2; Humphry & Chesher, 2021). In this way, digital technologies in the home blur boundaries between public and private spheres so that the contemporary home is now a site of surveillance, communication, production and subjectivation. For example, through apps and software, toys become ‘smart toys’ that are connected to wider ‘digital material ecosystems’ (Berriman and Mascheroni, 2019: 797). While they may appear fairly safe and secure, apps targeted specifically at children and families, such as the YouTube Kids app and the Fisher Price Smart Toy, corral young children into controlled spaces – codified and marketed to within the constraints of the app (Burroughs, 2017; Smith and Shade, 2018).
Beyond analyses of apps and software, looking to the increasing range of internet enabled goods and devices available for domestic settings is crucial in creating a holistic account of the ways in which family homes, individuals and relationships within them, become datafied. For example, home assistant devices have received significant academic attention in relation to data privacy, including in the context of families with children (Barassi, 2021). Such devices have been found to provide users with small conveniences that help households to improve efficiency and productivity in relation to everyday household tasks (Strengers et al., 2018). Home assistants are used as part of everyday parenting tasks, for example to set household routines, and reminders, read books and play music to children (Garg and Sengupta, 2020). For the early adopters of smart home technologies studied by Strengers et al. (2018), such small conveniences across multiple devices and tasks added up to becoming ‘significant and normal parts of everyday life’ (22), despite existing alongside concerns about privacy and security.
Also important in the datafication of the home, is the impact of the COVID-19 pandemic. During lockdowns, the home became a site of work (Watson et al. 2021) and schooling (Morse et al., 2022) which, in many households, increased the acquisition of digital technologies, as well as internet and digital media use. Families were not only using digital technologies to work and learn, but also as a way of continuing social interactions, accessing services, entertainment, and leisure activities. This led to new kinds of digital negotiations in households, particularly between parents and children. In addition, digital technologies intensified context collapse as families were living, working, learning and socialising all under the same roof.
The extent to which Australian homes are subject to datafication can be further quantified by data sets that account for the number of internet-connected devices and services present in large, nationally representative samples of the general population. For example, the 2021 Telsyte Australian Digital Consumer Study of 1060 people aged 16 and over (Telsyte, 2021) found that Australian households have an average of 15.2 ‘Non-IoT’ devices (e.g. computers, smartphones, tablets, game consoles, smart TVs) and 4.9 ‘IoT’ devices (e.g. home assistants, smart appliances, lighting, security systems). However, these figures do not provide an adequate picture of the connected state of homes with young children. Given the potential implications of childhood datafication, there is a need to understand the various ways in which Australian households, specifically those with young children, are connected to the internet via goods and devices.
In sum, digital technologies in the family home have a range of implications that need investigation. First, is the capacity for data to transform the private practices and routines in the home into commodities within the digital economy. Second, are the implications of using these digital technologies and their encroachment on the digital rights of children and their families. This article emerges from a larger study that is guided by the following overarching question: how are digital technologies changing family life and the processes of growing up? This article, however, focuses on the following related research questions:
How do Australian families connect to the internet? What is the quality of their internet connection, and does it vary according to location or income? What data-generating objects are in Australian family homes? Does the frequency of these vary with location, income or education? What parenting and childcare related devices are in Australian homes and is this increasing?
Research design
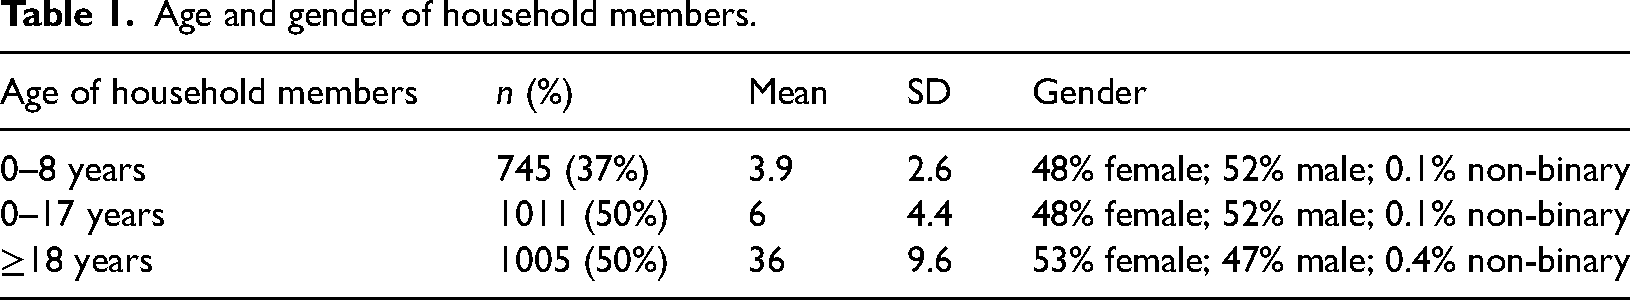
After receiving institutional ethics approval, we designed an online survey using Qualtrics. The survey was distributed by Qualtrics Research Services to eligible participants between June and July 2022. Individuals were eligible to participate if they were a parent or carer of at least one child aged between 0 and 8 years living in Australia. The final sample consists of 504 completed survey responses, representing 504 different households and a total of 2016 individuals living in those households (see Table 1).
Age and gender of household members.
We collected the following demographic information: household composition (number of household members, ages and genders); household location (metropolitan, rural, regional or remote); household income (by ABS income quintile groups); and the level of highest completed education. The survey then asked questions about the following information: type and quality of home internet connection, number and type of internet connected devices in the house, whether there were any non-Smart TVs in the house connected to the internet and how they were connected, and whether parents or carers used any software to manage/monitor children's time spent, or content engaged with, on devices and if so what kind. While we acknowledge that the states and territories in Australia had different lengths of lockdowns during the COVID-19 pandemic and this may be reflected in the survey results, an analysis of this kind is beyond the scope of this article.
In this paper, we present the results of descriptive statistical analyses including tests for the significance of differences between groups where relevant. All p-values and χ2-values reported are results of Pearson Chi-square test of independence. Differences were considered statistically significant if p-values were less than 0.05. Missing, ‘don’t know’ and ‘prefer not to say’ responses were not included in the analyses unless otherwise stated. Households in remote locations have not been included in tests for independence due to their low number (n = 6). Where proportions are reported, totals may not add up to 100% due to rounding to two decimal places or because respondents could select more than one option. Data analysis was performed using Microsoft Excel and SPSS software version 28 (IBM Corp, 2013).
Findings
In the following sections, we provide an overview of the sample before presenting findings regarding household connections to the internet, internet connected devices and goods present in Australian homes with young children, and then an analysis of devices particularly relevant to childcare.
Sample characteristics
Summaries of the sample's demographic composition are shown in Tables 1 and 2. In total, 504 survey responses were collected and these accounted for 2016 individuals (all members of the 504 households) including 1011 children aged 0–17 years and 1005 adults aged 18 years or older. Of household members aged 0–8 years, and also in the wider age group of 0–17 years, there were 48% female, 52% male and 0.15% non-binary gender. Of household members aged 18 years or over, there were 53% female, 47% male and 0.4% non-binary gender.
Household location, income and highest completed education level.
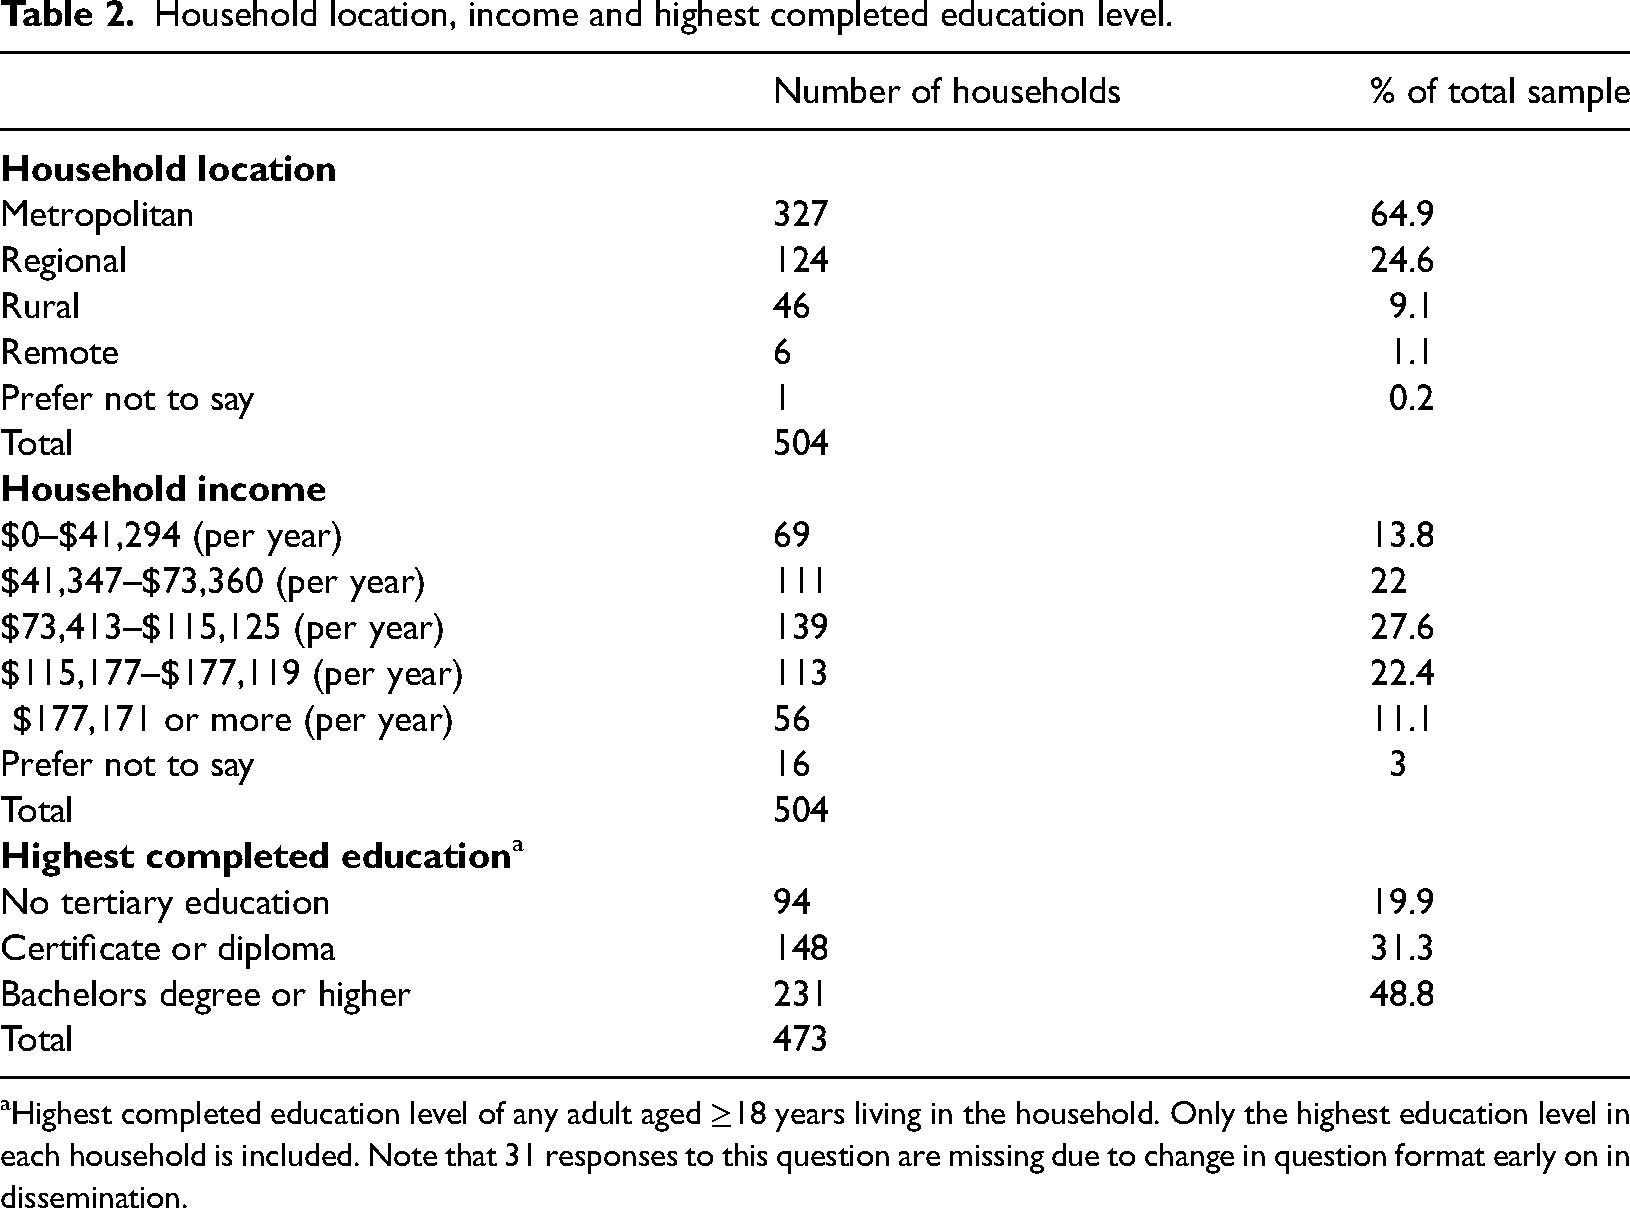
Highest completed education level of any adult aged ≥18 years living in the household. Only the highest education level in each household is included. Note that 31 responses to this question are missing due to change in question format early on in dissemination.
Household data infrastructure
The quality of internet connection is not only important to data flows, but also to the kinds of digital technologies families can connect and the skills and opportunities they can access and develop. The majority (n = 392, 79%) of households surveyed accessed the internet via the NBN. A smaller proportion of households accessed the internet via other means including 27 with ADSL, 17 households with fixed wireless, 11 satellite and 1 Starlink connection. The dominance of household NBN connections was present across metropolitan, regional and rural areas, and while regional and rural households were slightly less likely to be connected to the NBN this was not a statistically significant difference (χ2 = 5.219, p = 0.074). Across the sample there were 39 (7.7%) households with only a mobile data connection. These households were statistically significantly more likely to be in rural areas (χ2 = 13.529, p = 0.001) and to be in the lowest two income groups (χ2 = 10.489, p = 0.005). Within the home, 464 (92%) respondents said they connected to the internet via Wi-Fi, or a combination of Wi-Fi and mobile data (n = 231, 46%) or Wi-Fi and some form of cable connection (n = 54, 11%). Respondents generally rated the quality of their home internet connection as ‘very good’ or ‘excellent’ (n = 356, 71%) regardless of household location (χ2 = 4.625, p = 0.328). Households without an NBN connection were more likely to rate the quality of their connection as worse than those with NBN (χ2 = 6.146, p = 0.046).
Data-generating objects in family homes
To organise findings, we distinguish between electronic devices, including smart TVs, laptops, tablets, gaming consoles and iPads, and IoT devices, which include a growing array of domestic items that are connected to the internet, such as smart fridges, security systems and doorbells. By definition, all internet connected devices that are generating and using data are considered part of the Internet of Things (see ACMA, 2020). However, we follow Lupton et al.'s (2021) description of IoT devices as those which form ‘sophisticated systems’ and which incorporate ‘sensors that monitor motion, light and temperature and smart wiring that connect different devices and “learn” from inhabitants’ activities and preferences’ (p. 1148). This aligns with the Telsyte (2021) definition of IoT devices drawn upon earlier. As a subcategory in IoT devices, we acknowledge the growing number of devices used for parenting, such as baby monitors, breast pumps and bottle warmers.
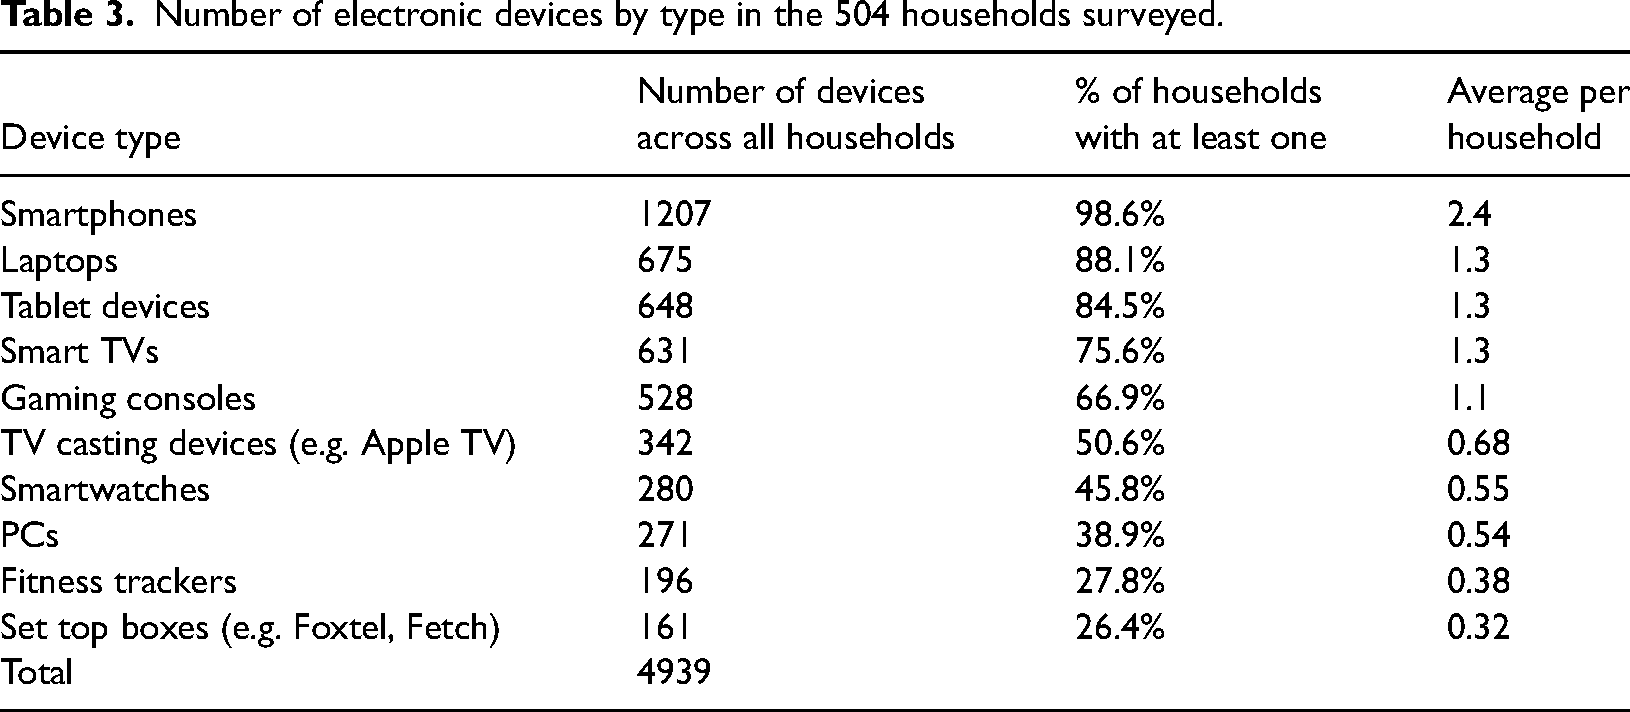
Across all 504 households and 2016 individuals in those households, there were a total of at least 5900 internet-connected objects. Since we only asked how many of each device households had for smartphones, tablets, laptops, PCs, gaming consoles, TVs, fitness trackers, smart watches and set-top boxes, and only whether they had or did not have any of the other types of devices listed, this figure is likely an underestimate of the total number of devices in households. The 5900 internet-connected objects were largely made up of electronic devices such as smartphones, laptops, tablets and smart TVs (see Table 3). Most (71%) of the 504 households had between 5 and 10 different types of internet-connected devices/goods; 16% had between 11 and 25 different types and 13% had between 1 and 4 different types. On average, households had 7.8 different types of internet-connected devices. Households in the highest income quintile were statistically significantly more likely than the middle- or lowest-income groups to have a larger number of unique internet-connected devices, that is, 11 or more (χ2 = 37.364, p = <0.001). Households in which at least one adult held an undergraduate degree or above were statistically significantly more likely to have a greater number (≥11) of internet-connected devices/goods (χ2 = 19.024, p = 0.015).
Number of electronic devices by type in the 504 households surveyed.
Electronic devices
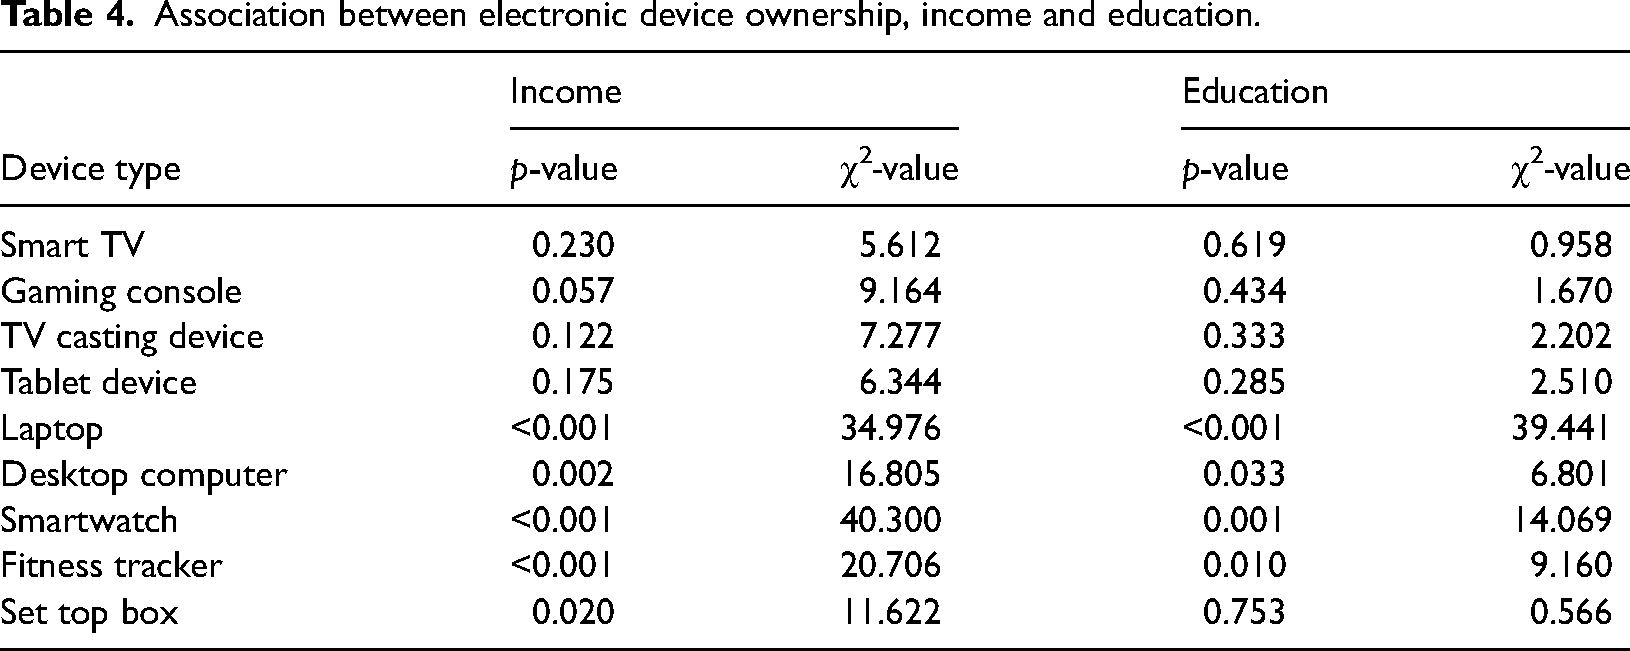
Smartphones, laptops, tablets and Smart TVs were present in most households surveyed (see Table 3). Devices used for entertainment were less determined by income and education level, whereas the prevalence of devices more likely used for work (laptops, PCs) and quantified self (smartwatch, fitness tracker) are more frequently found in households with higher income and education (see Table 4). There were some exceptions to this. The prevalence of tablets did not differ by income or education, which may be because children are often required to have them for school.
Association between electronic device ownership, income and education.
Smart and non-smart TVs
About 85% of the households we surveyed had at least one smart TV, 23% had two smart TVs and 7% had three or more smart TVs. The majority of these (56%) were purchased between 2019 and 2022, with 19% purchased in 2020 alone. Brands Samsung (n = 144), LG (n = 88), Sony (n = 56) and Hisense (n = 51) make up 73% of the smart TVs in households surveyed. Further, 142 (28%) households had at least one non-smart TV that was connected to some other device which in turn was connected to the internet, therefore allowing for the viewing of internet content. Devices used to make ‘dumb’ TVs ‘smart’ include casting devices (n = 72), gaming consoles (n = 71), computers (n = 26) and internet enabled set top boxes such as Fetch TV (n = 14). We note that, of the 342 casting devices across households (including households with smart TVs), 157 (46%) were Google Chromecast devices, whereas Apple TV boxes made up only 14% (47) of casting devices and the remainder were other brands.
In addition to these ubiquitous electronic devices, we also found that a wide range of newer IoT goods and devices are starting to make their way into Australian homes with young children. We now present findings regarding the range of these IoT devices in households before turning to detail findings specifically regarding IoT devices relevant to parenting and childhood and home assistants.
IoT devices
In this paper, we break down IoT devices into the following categories: home assistants (e.g. Google Nest, Amazon Echo Dot); Home security and safety (e.g. security systems with cameras or sensors, smart doorbells, smoke detectors); Domestic work and hygiene (e.g. Robot vacuum cleaners, washing machines, toothbrushes); Childcare (e.g. baby monitors, smart toys, baby bouncers); Home environment (e.g. smart lighting, air-conditioners, thermostats, speakers); Pet care (e.g. smart pet feeders, pet doors, pet toys); Medical or assistive devices (e.g. hearing aids, glucose monitors, blood pressure monitors); and General home automation (e.g. integrated home automation system, smart plugs, garage door).
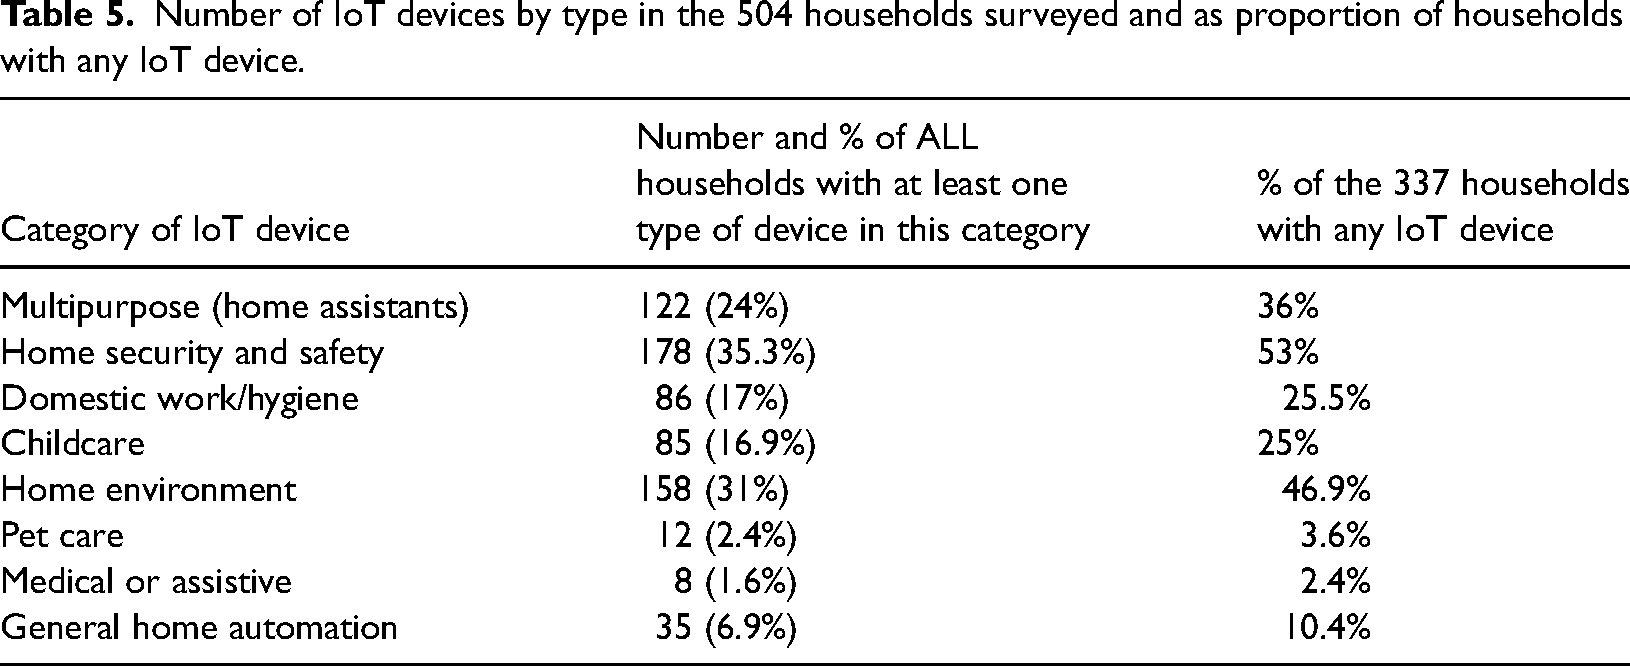
In our sample, 67% (n = 337) of the 504 households had at least one IoT device. About 130 (26%) had just one type of IoT device, 159 (31.5%) had between two and four different types of IoT devices, and 48 (9.5%) had more than four. The most prominent category of IoT devices in households surveyed were those related to household security and safety with 35.3% of all households having at least one of these types of devices. The most common security and safety device owned by our participants was a security system with cameras (n = 104; 21%). The next most prominent category was IoT devices related to managing and monitoring the home environment (n = 158; 31%), followed by home assistants (n = 122; 24%), domestic work/hygiene (n = 86; 17%), childcare (n = 85; 16.9%) and general home automation (n = 35; 6.9%). Very few households had IoT devices related to pet care or medical and assistive needs (see Table 5).
Number of IoT devices by type in the 504 households surveyed and as proportion of households with any IoT device.
Home assistants
Of the 504 households in this sample, 122 (24%) had at least one home assistant device. The majority of these (n = 81, 66%) were a Google branded device, followed by Amazon (n = 27, 22%), then Apple (n = 14; 11%). Household income and education level had a clear relationship with home assistant ownership. Those in the upper income quintiles (χ2 = 23.724, p = 0.001) and those with tertiary qualifications (χ2 = 11.579, p = 0.003) were statistically significantly more likely to own one. No such difference was observed for household location (χ2 = 4.640, p = 0.098).
Parenting/childcare related devices
Just 15 households (3%) in this sample indicated that they had any kind of internet connected or ‘smart’ toy. However, 14% (n = 69) of households across the entire sample had a smart baby monitor that connects to the internet and sends video/audio output to an app on a smartphone. In households with at least one child aged ≤1 this increased to 29% (44 of the 150 households with children aged ≤1). There were no statistically significant differences in likelihood of owning a smart baby monitor according to income (χ2 = 4.512, p = 0.341), education (χ2 = 1.343, p = 0.511) or location (χ2 = 3.101, p = .212). While Vtech brand was mentioned by 16 respondents, there were 17 brands mentioned only once or twice across the sample (e.g. Eufy, Babylove, Arlo and Mirabella). Other brands mentioned were Oricom (n = 7), Uniden (n = 7) and Owlet (n = 4). Thirteen respondents answered ‘Don’t know’ to the question asking for brand of baby monitor. Other internet connected IoT products used in parenting asked about in our survey were present in only low numbers across households. These included: bottle warmers (n = 3), breast pumps (n = 6), baby bouncers (n = 7) and bassinets (n = 2).
Parental controls
About 19% (n = 96) of respondents reported using screen time monitoring software to check their child(ren)s time spent on devices and 35% (n = 177) used some form of parental control software (e.g. app or game settings; browser based control software such as Qustodio). While income had no impact on likelihood of using screen time monitoring software (χ2 = 2.461, p = 0.652) or parental controls (χ2 = 1.970, p = 0.741), households with older children were statistically significantly more likely to do so. For example, households with only children aged 5 or under were less likely to use screen time monitoring software than households with any older children between 6 and 17 years (χ2 = 15.624, p = <0.001). Of those households that used some form of screen time monitoring software, 59 used Apple Screen Time and 43 used Google Family Link (the remainder used some other software). Using settings on Google owned YouTube or the YouTube Kids app was the most common form of parental content control software (52.5% of the households using one or more form of parental control settings).
Discussion
Our findings are indicative of how households and family life are changing in the age of datafication. Most households in our sample have good or very good internet connection via the NBN, with a minority from a lower income bracket using only a mobile data connection. The type and quality of internet connection did not vary significantly with location, suggesting that internet connectivity is relatively consistent for households in this sample. However, the Australian Digital Inclusion Index study which produces an index of digital inclusion based on Access, Affordability and Digital Skills, finds a persistent marked divide between metropolitan and regional areas in terms of overall digital inclusion (Thomas et al., 2021). Therefore, the consistency in type and quality of connection we found across geographical areas should be interpreted with caution and perhaps is reflective of the fact that this was an online study which likely produced a sample not representative of households with poor internet connectivity. However, Australia still ranks 54th in the world when it comes to internet speed (Jackson, 2022) and despite participants in this sample being generally satisfied with the quality of their connection, the ways that Australian family households connect to data infrastructures remains relevant to how they become part of data economies.
The vast majority of homes surveyed have over five internet connected devices, with those in the upper income brackets of our sample having many more than this and, in particular, more that are dedicated to the quantification of self (i.e. Fitbits, smart watches etc). Interestingly, devices for entertainment were equally prevalent across all demographics, however, households from a higher income were more likely to have desktop computers and laptops, presumably because these are items that are often required for professional work. While these points are perhaps not surprising, our findings overall do point to some interesting and unanticipated trends relevant to the datafication of family life. These can be summarised as: the safety and security of the household as a primary motivator for using smart home devices; the different rates of acceptance of some data generating objects in the home over others; and the Googlization of family life. We now turn to look at these points in detail.
Across our sample of 504 households, there were 5900 internet connected devices. A proportion of these are what we referred to as domestic IoT devices, that is, devices that in many cases have historically been common in family life but are now sources of digital data generation as they connect directly or via an app to the internet. Our framing of domestic IoT devices also includes IoT ‘native’ products such as home assistants. Research has focused intensely on the smart home and these devices have significant implications for the datafication of childhood, including understandings of self and others and the processes of learning and growing up.
While our findings suggest domestic IoT devices are on the rise, beyond home assistants and security cameras they are still relatively nascent in Australian families with young children. While 67% of the sample had at least one IoT device, this proportion was largely made up of security cameras and home assistants. We found a long ‘tail’ of very different datafied devices and goods in the home (i.e. robot vacuum cleaners, washing machines, smart outlets, home thermostats and garage doors). However, this is still a rather ‘thin tail’, made up of small, scattered numbers of IoT devices across the sample. It is noteworthy that security and monitoring is, according to our data, a facet of home life where smart technologies do seem to be forming a strong presence. Such devices collect sensitive image-based and in some cases audio data, often processed in cloud-based servers, and therefore pose potentially significant privacy risks (Emami-Naeini et al., 2019). Our findings regarding security cameras reflect insights from other research which has found that safety is a key motivator in increasing adoption of smart home devices (Chavda, 2022; George et al., 2021). This is also reflected in our findings on smart parenting devices.
With 745 children aged 0–8 years represented in the survey, it would be reasonable to assume that a significant portion of the domestic IoT devices in these families might be dedicated to parenting and children's play. However, our results indicate that devices specifically related to childcare or children's play only make up a relatively small proportion of the total number of internet-connected devices in family homes. Baby monitors were the most common connected item in this category, being present in 14% of all homes and 39% of homes with a child aged one or under. We note that smart baby monitors are marketed as superior in their delivery of safety, security and peace of mind compared to non-internet connected monitors (Baby Bunting, 2022; Farrell, 2022). Therefore, we see the pursuit of safety and security potentially impacting the rationalisation and adoption of smart devices to not only protect the house and its contents in general, but also to monitor and protect specific, vulnerable family members within intimate spaces of the home.
Smart toys have been a particular focus of domestic IoT research with attention given to the ways in which they commodify the private lives of children (Berriman and Mascheroni, 2019; Holloway, 2019; Smith and Shade, 2018). The identification of undisclosed vulnerabilities in smart toys that potentially violate children's digital rights is of particular concern (Chu et al., 2019). However, the findings of our survey suggest that these are far from being a mainstream item for Australian families. Indeed, some of the early publications (i.e. Smith and Shade, 2018) on the topic discussed smart toys as an emerging category of IoT, however, it appears several years later, that this is still the case. We speculate that possible reasons for the low adoption of smart toys include a general reluctance to add extra gadgets and ‘screens’ to children's lives, public awareness of high-profile security breaches (Walsh, 2017), and perhaps an increasing general awareness of privacy violations through data (Hong et al., 2020; Schomakers et al., 2021).
While our findings did not point to a saturation of IoT devices, they do capture a broader picture of an overwhelming number of more mundane, already domesticated electronic devices in family homes. Indeed, across the 504 households, respondents reported a total of 4939 electronic devices including smartphones, laptops, tablets, gaming consoles and smart TVs. Smart TVs, for example, collect a range of viewership data and pose a range of privacy concerns (Hung et al., 2018; Tileria and Blasco, 2022). Most households in our sample owned one, sometimes several, smart TVs. These have quickly become data generating mainstays of family life, however, they have received scant attention in children's datafication literature meaning that they have essentially slipped under the critical data studies radar.
Our findings regarding the brands of devices in Australian family homes demonstrate a clear dominance of Google products across several domains, suggesting an emerging Googlization of family life. Googlization refers to the growing ‘creep’ of the media company in ‘more and more Web applications and contexts’ (Rogers, 2009: 173). Home assistants and TV casting devices were heavily dominated by Google products in our sample and while slightly more parents reported using Apple's Screen Time to monitor children's online activities, Google's Family Link service was a close second. Just under a quarter of all households had at least one home assistant such as a Google Nest, Google Home or other variation on these models. Google Home Minis and Nests are often ‘given away’ with other purchases, such as Spotify subscriptions or upgrading to YouTube premium (Moreno, 2019). This is not surprising given that Google's business model has long been based around the commodification of personal data, not the sale of the hardware (Vaidhyanathan, 2011).
In particular, home assistants are quickly becoming a kind of ‘master controller’ as they have the capacity to control other smart devices in the home. Garg and Sengupta (2020) argue that home assistants may act as an entry point to additional smart home device purchases. Participants in that study reported initially purchasing a Google branded home assistant for, say, listening to music, then deciding to purchase other goods at least partially because they were integrated with the Google smart home ecosystem, controlled via the home assistant. Indeed, a quick glance at the marketing of smart washing machines and fridges, suggests interoperability with Google home assistants is a key selling point. Combined with growing use of Google Workplace for Education during the global pandemic and other Google products in the home (i.e. Google Family Link, Google search, YouTube, Gmail), Google is developing strong foothold into the datafication of family life.
Conclusion
Despite the research focus and theorisation of the smart home and datafied family life, our findings suggest the reality is quite different. Except for a few notable exceptions (i.e. home assistants, security cameras and to a lesser degree baby monitors), smart homes and connected parenting devices are still far from mainstream. It appears that research has anticipated the issues, rather than the realities of datafied family life. This suggests that now is an opportune time to map out a research agenda to ensure that protecting the digital rights of children and families is at the forefront of technological innovation in the home. With these findings and their context in mind we conclude with suggestions for further research on the datafication of family life:
Research needs to account for every day, mundane data-generating devices, such as smart TVs that have so far not featured as prominently in the critical data literature as their prevalence in family homes would suggest is necessary. While this does not negate the need for critical inquiry into newer, emerging goods and devices capable of generating data, it is imperative that research accounts for the everyday lives of families. Research should also address the role of privacy and datafication concerns in family purchasing decisions as a way of gauging where data literacies could be improved. Our findings also highlight the need for further investigation into the proprietorial nature of the ecologies within the smart home, not only to investigate how the data is collected and used and the potential to track and monitor family members, but also how they shape the practices of everyday family life. For example, do families with Apple products create an ecology of media products in the same way that those with Google products appear to do? And does family life within ‘Googlized’ households look and feel different to family life in homes with an ‘Appleified’ device ecosystem? Finally, there is a need to investigate how everyday life is shaped by data flows in the home as well as way to theorise these flows across software, hardware and varying practices of use in different families.
In this paper, we have provided a quantitative view of data-generating objects in a large, diverse sample of Australian households with young children. Combined with the further research tasks listed above, we hope this information will inform continued theorisation of how childhoods and family life are datafied and what the consequences of this are.
Footnotes
Declaration of conflicting interests
The author(s) declared no potential conflicts of interest with respect to the research, authorship, and/or publication of this article.
Funding
The author(s) disclosed receipt of the following financial support for the research, authorship, and/or publication of this article: This work was supported by the Australian Research Council Centre of Excellence for the Digital Child (grant number CE200100022).