
Abstract
In this study, reliability methods were demonstrated as a promising approach in medical engineering by identifying the most significant muscle forces affecting femoral stress. First, the finite element method (FEM) in Abaqus software was used to model the effects of 10 muscle and joint forces across various regions of the femur. Then, using the response surface methodology (RSM), and examining the effect coefficients of each joint and muscle force, the hip joint reaction force with an impact coefficient of 210.97 was identified as the most effective force on bone stress. After that, the gluteus minimus and gluteus medius muscle forces were ranked second and third in terms of stress effect with coefficients of 66.6 and 34.47. This study showed that the anterior femoral muscles have a significant effect on stress compared to the posterior femoral muscles. RSM enables faster and more precise identification of joint and muscle forces influencing femoral stresses compared to conventional methods. This innovative approach not only increased the understanding of biomechanical phenomena, but also provided a more efficient tool for investigating and optimizing such processes in biomedical engineering applications.
Introduction
The femur bone is highly prone to fractures and resorption due to weight-bearing activities, static and cyclic loading, and high-speed impacts. Surgical interventions like femur replacement or fixation are among the most common orthopedic surgeries globally. According to a 2017 World Health Organization (WHO) report, approximately 150 000 femur fractures occur each year, and this number is projected to double by 2050. 1 Given the femur’s crucial role in supporting the body and its susceptibility to stress, understanding muscle loading and developing effective treatment methods are of utmost priority. Over the years, numerous studies have explored the structure of the femur, the forces acting on it, and the optimal treatments for fractures. One key study by Duda et al 2 investigated the impact of muscle forces on the femur by analyzing 16 muscle forces during various phases of the gait cycle. Their findings showed that muscle activity can reduce internal femoral loads by up to 50%, depending on the phase of gait.
In a study, Viceconti et al 3 developed a femur model that incorporates muscle forces to improve the understanding of how muscles interact with the bone. They produced a model in which both the center of muscle force and muscle locations were clearly defined, providing valuable insights for biomechanical studies. Mathukumar et al 4 contributed by developing a femur model using tomography scans, aimed at aiding surgeons and advancing clinical studies. Their results showed that the femur experiences both tensile and compressive stresses, with the highest stress occurring in the femoral neck. Altai et al 5 followed up with a model to examine pressure levels in the femoral neck during normal gait, showing that muscle forces significantly affect femoral neck loading. Bitsakos et al 6 investigated the impact of different muscle force configurations on bone remodeling, with a focus on the proximal femur and femoral shaft. They found that muscle forces significantly influence bone tissue maintenance, especially in areas connected to muscles. Lutz et al 7 developed an algorithm to calculate muscle forces, aiming to prevent bone bending by accounting for bone structure. Heller et al 8 extended their analysis to implanted femurs, aiming to more accurately predict loading conditions by accounting for the interactions between muscular and joint forces.
Traditional design methods often rely on fixed values from experimental data to establish safety factors, which may not sufficiently account for the variability in influencing conditions. These fixed approaches can result in increased uncertainty as the number of variables grows, leading to suboptimal designs. Reliability methods, however, offer a solution by incorporating variable conditions and uncertainties directly into the design process. This allows for a more accurate prediction of system behavior under various conditions. Given the time and cost associated with experimental methods, alternatives such as numerical simulations using the finite element method (FEM) are advantageous. El-Gizawy et al 9 developed a reliability-based approach for implant systems with external stabilizing plates, using the Taguchi method to minimize failure probability. Their analysis showed that material selection had the greatest influence on performance, while screw type and bone density had lesser effects.
Zakeri et al 10 optimized a hollow stem prosthesis to reduce micromovements and maintain uniform stress distribution, using FEM combined with probabilistic RSM. Their results identified stem implant length as the key factor in optimization. Similarly, other studies have shown that geometric parameters, such as cortical bone thickness and the presence of cement, are crucial for prosthesis integrity. 11 Dopico-González et al 12 applied probabilistic methods in analyzing the behavior of implanted structures, using Monte Carlo simulations along with FEM. They emphasized that the number of simulations and precise parameter selection are crucial for obtaining reliable results. Uddin 13 used the Taguchi method to study surface roughness and concluded that feed rate was the most influential factor in achieving smooth surfaces.
Various microbial products have been effectively optimized and modeled using response surface methodology (RSM). This approach combines mathematical and statistical techniques to build a model, evaluate the impact of multiple independent variables, and getting optimum values of variables. 14 In another study, Response Surface Methodology (RSM) can be used to optimize various aspects of the 3D printing process, aiming to achieve the highest percentage of printing time efficiency. 15 Additionally, Response Surface Methodology (RSM) can be applied to composites for optimization.16,17 Chemical processes are optimized by Response Surface Methodology (RSM), which reduces experimental time, improves process efficiency, and efficiently analyzes parameter interactions. 18
Despite the progress made in understanding femoral behavior under various conditions, many studies face 2 key limitations. First, the high cost of these methods has made it difficult to analyze multiple factors simultaneously, often leading to studies that focus on a limited set of variables. Second, as the number of variables increases, solution times and result interpretation become more complex, deviating from optimal conditions. Therefore, a fast and reliable method for managing multiple factors is essential. The main focus of this article was on solving the existing problems and providing an optimized solution.
Materials and Methods
Modeling and analyzing the femur bone inherently involves uncertainties due to the numerous factors affecting its behavior, such as geometric variations, material properties, and loading conditions. To address these uncertainties, reliability methods and uncertainty theories can be employed to enhance accuracy while minimizing inefficiencies, heterogeneities, and errors. Estimating the reliability of structures is critical because many of these variables remain unidentified or difficult to measure precisely. While several methods have been proposed to assess structural stability, mechanical phenomena are often oversimplified in these approaches. Techniques like Monte Carlo simulations and first-order reliability methods are commonly used for stability analysis, but they have notable disadvantages, including high computational cost and complexity, which limit their practical application.
Given these challenges, there is an increasing need for efficient methods to assess system stability. The Response Surface Methodology provides a promising alternative. RSM offers a practical approach for estimating system reliability, behavior, and failure probability by combining mathematical and simulation techniques. It simplifies system behavior into a second-order polynomial, incorporating random variables to model uncertainties. Unlike exhaustive simulation methods, RSM requires significantly fewer computations while delivering results that closely reflect real-world conditions. This efficiency and accuracy have made RSM an attractive option for researchers and engineers across various fields.
Response Surface Method—Fundamental Concept and Assumptions
In structural systems, numerous variables influence the system’s behavior. It is generally assumed that the response variable Y depends on the input variables X1,X2,. . .,Xn. Experiments are conducted using the design variables X1 to Xn with a sufficient number of trials to accurately determine the response surface. Each experiment is represented by a point with coordinates X1j,X2j,. . .,Xnj in an n-dimensional space, where the response value Yi corresponds to each set of X coordinates. Thus, the response value Y is a function of the input data related to the random variables affecting the system.
The core of RSM lies in estimating the function g(X) (the governing equation) using a polynomial of degree n, denoted as n (g ̂(X)), with unknown coefficients. Structural analysis at different points xi is performed to compute these unknown coefficients, ensuring that (g ̂(X)), minimizes the approximation error within the region of interest. 19
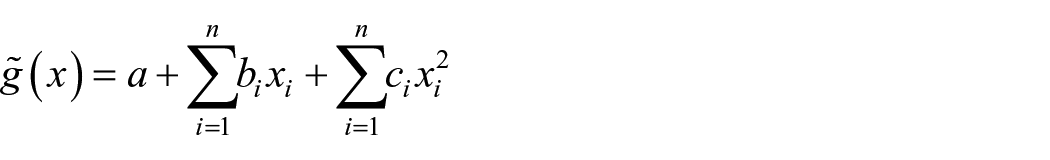
In the present work, using the properties of the response surface method and the mentioned relationship, a mathematical model is achieved which determines the intensity of the effect of each of the muscle and joint forces (independent variables) on the stress applied to the bone (dependent variable).
Identifying and Selecting Articular and Muscular Forces
The femur bone is associated with many muscles, with even the most minimal classification including at least 17 muscles. However, selecting the most critical muscles for analysis is essential due to several factors. These include the non-optimal nature of the test with too many variables and the reduced precision caused by a large number of inputs, which complicates the analysis.
To ensure both the validity of the results and maintain a manageable number of variables, it was decided to select 10 muscle forces for analysis. The selection of these muscles was based on 3 key criteria:
Muscles must be selected from the proximal, medial, and distal regions of the femur, including the front, back, and side compartments.
The selected muscles must exert significant forces.
The impact area of each muscle’s force must be either considerably large or small, ensuring relevance to the overall analysis.
After applying these criteria, the muscle forces were chosen, and software analysis commenced. The research conducted by Taylor et al 20 references 17 muscle forces utilized in the study by Duda et al 2 , which also provides the force values for each muscle. From these, 10 representative muscles were selected for detailed discussion. The characteristics of these muscles are drawn from Taylor et al.’s work, and the locations where the forces are applied were obtained from the research by Viceconti et al, 3 as shown in Figure 1. The modeling system was created based on this information and the selected muscles and their respective force values are listed in Table 1.

Loads on the femur bone.
Muscular Forces on the Femur and Its Standard Deviation.
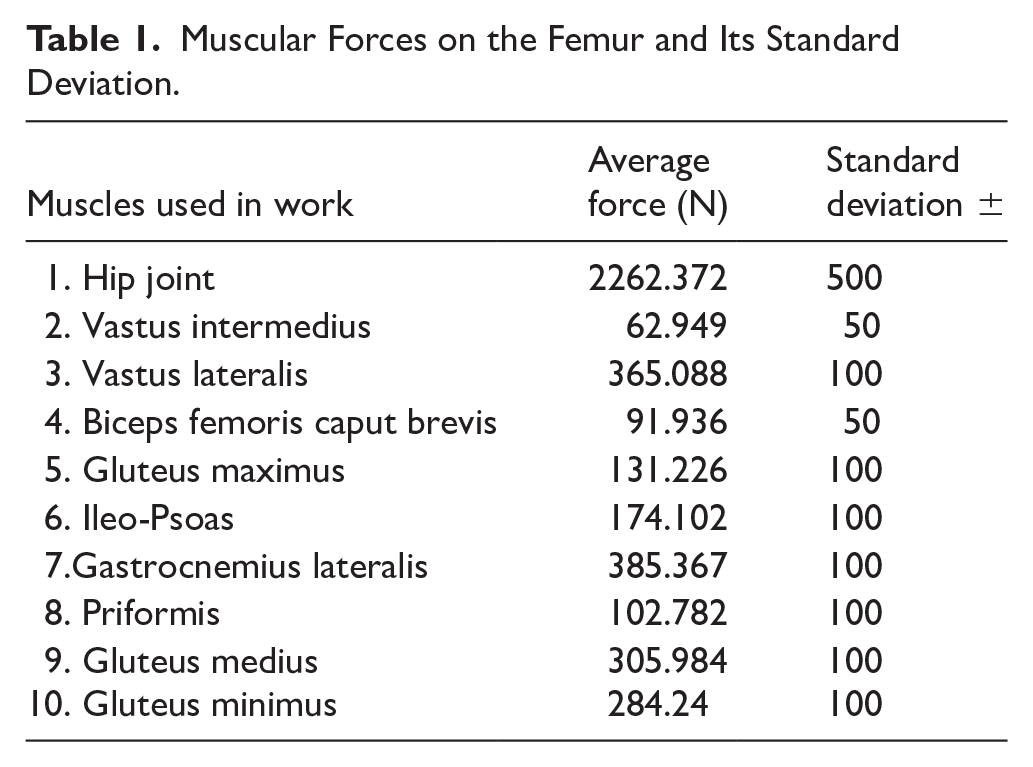
Generating the data required for the response surface method requires the generation of a set of responses based on various constraints and variables. This process requires the generation of random data for use in the subsequent stages of software modeling. Therefore, the values in Table 1 were taken as data for the response surfaces. Specifically, 160 random values and analysis for each of the 10 muscle forces are required, in accordance with the requirements of the response surface method. These random values are generated from a normal distribution, with means given by Taylor et al. The standard deviations were chosen based on the magnitude of the forces with the options of ±50, ±100, and ±500 N. Then, using these 160 random variables, finite element software modeling was performed 160 times to obtain stress levels.
Finite Element Analysis of Femur Bone
Computational analysis was performed using the finite element analysis software package ABAQUS 2022. The initial step in software modeling involved creating a suitable geometry. The femur bone model was completed then analysis was conducted on this model. This bone model had a total height of 40 cm and a total diameter of 4 cm. 21 Following the preparation of the model, material properties were assigned to the bone. Although the bone exhibits complex behavior, research has shown that modeling of femur bones as isotropic materials has been deemed acceptable 9 so in this study it was treated as a homogeneous and isotropic material. The parameters used, derived from the study by Hu et al, 22 included a Young’s modulus of 13.7 GPa and a Poisson’s ratio of 0.3, which were applied to the outer hard layer of the bone.
To enhance the accuracy of the model, all muscle force surfaces were initially constrained to a single point through coupling. This approach ensured that the applied Newtonian forces were distributed across the entire force application area, thus preventing stress concentration. Subsequently, the randomly generated data from previous steps were used to apply forces to each impact point. Additionally, the knee area was fixed in all directions during this phase (Figure 1). The analysis was conducted statically, employing solid and tetrahedral elements with 1 node at each corner (C3D4) that is shown in Figure 2. After conducting a mesh independence study, meshes with a size of 9 mm were identified as optimal for analysis. In this configuration, the total number of nodes was 11 963, and the total number of elements was 56 389. Following the analysis and processing of results using the software, stress outcomes were recorded for subsequent steps.

A view of the meshing of the bone structure.
After conducting 160 software simulations for response surfaces and recording the results within the software, the findings revealed that despite minor variations due to changes in variables, the overall shape of stress and displacement contours remained similar across all analyses. In all simulations, the distal region of the femur bone was identified as the area experiencing the highest stress. In this region, stress values ranged from a maximum of 785 MPa to a minimum of 202 MPa. The distal part of the femur, which corresponds to the knee joint, acted like a cantilever beam due to being constrained in all directions, leading to high stress concentrations near the support area—specifically in the distal part of the bone (Figure 3). The femoral neck, due to its smaller cross-sectional area, generally endured stresses ranging from 10 to 60 MPa. Overall, for displacement values, the largest magnitude of displacement was recorded in the proximal region of the femur bone. In this area, displacement magnitudes varied between 32 mm at maximum and 14.5 mm at minimum. In addition, the deformation contour can be seen in Figure 4 and the Strain contour in Figure 5. Each of the contours is shown for 3 different loading condition of hip joint force (HJ), gluteus minimus muscle force (Gmi), and gluteus medius muscle force (Gme).

Stress contours of the femoral bone for 3 different loading conditions: (a) HJ: 790 N, Gme: 311 N, Gmi: 260 N, (b) HJ: 2247 N, Gme: 180 N, Gmi: 365 N, and (c) HJ: 2811 N, Gme: 468 N, Gmi: 374 N.

Deformation contours of the femoral bone for 3 different loading conditions: (a) HJ: 790 N, Gme: 311 N, Gmi: 260 N, (b) HJ: 2247 N, Gme: 180 N, Gmi: 365 N, and (c) HJ: 2811 N, Gme: 468 N, Gmi: 374 N.

Strain countours of the femoral bone for 3 different loading conditions: (a) HJ: 790 N, Gme: 311 N, Gmi: 260 N, (b) HJ: 2247 N, Gme: 180 N, Gmi: 365 N, and (c) HJ: 2811 N, Gme: 468 N, Gmi: 374 N.
Utilization of the Response Surface Method and Results
To complete the analysis, RSM was employed to identify the influencing factors and optimize the results for each variable. For accuracy and proper execution of the calculations, the analytical and statistical software Minitab 7 was utilized, which supports a range of statistical methods, including RSM.
The experimental design for the RSM was based on data obtained from the numerical analysis. The primary goal of RSM is to optimize and establish relationships by fitting data into a predetermined matrix equation. Two approaches are commonly used in RSM: Central Composite Design (CCD) and Box-Behnken Design. In this study, CCD was chosen due to its high reliability. A 95% confidence interval was applied, meaning that only data with a p-value less than 0.05 were considered significant. The impact factor coefficients were calculated to assess the level of influence. With these steps completed, the results were then observed and interpreted.
Method Validation
To verify the accuracy and validity of the results, the performance of the method was compared with another study. The study by Dopico-González et al 12 was used for validation, as it conducted a probabilistic analysis using the Monte Carlo method on a bone structure with an implant. Dopico-González et al examined similar factors, such as the load applied to the bone head, the angle of force application, and the stiffness of the implant and bone components. Their findings highlighted that force and bone stiffness were the most significant factors affecting strain.
By replicating this analysis with RSM, the current method achieved similar results in a shorter time frame. This confirms the reliability of the Response Surface Methodology for future analyses. The results obtained in the work of Gonzalez et al. and the present method are shown in the Figure 6 below.

(a) Result of Reference 12 and (b) result of present work.
Results
Analysis of Factors Affecting Bone Stress
The modeling and software analysis have identified key factors influencing stress on the femur bone by evaluating P-values and effect coefficients for various muscle forces. The Biceps Femoris and Vastus Intermedius muscles were found to have minimal impact on bone stress, as indicated by their P-values exceeding .05. This lack of significant effect is likely due to their lower force application and relatively larger effect areas. Despite its extensive area of force application, the Vastus Medialis muscle’s impact on stress was reduced. In contrast, all other muscle forces displayed P-values well below .05, highlighting their substantial influence on bone stress.
The most significant factor identified was the Femoral Head force, where the femur meets the hip joint, with an effectiveness coefficient of 210.97. This high impact is expected given the substantial force exerted by the hip joint, which is notably greater than the forces applied by other muscles. The Gluteus Minimus muscle, with an effectiveness coefficient of 66.6, was the second most influential. Located laterally and superiorly on the femur, it generates considerable bending moments and stress despite its moderate force magnitude.
Following this, the Gluteus Medius and Gluteus Maximus muscles force ranked third and sixth in effectiveness, with coefficients of 47.34 and 14.77, respectively. Their positions and force applications contribute to their significant impact on stress. The Piriformis and Sartorius muscles force also demonstrated notable effects, with coefficients of 31.68 and 20.61, respectively. Their high force applications combined with their small cross-sectional areas increased their effectiveness.
In contrast, the Vastus Lateralis and Gastrocnemius muscles force had intermediate impacts, with coefficients of 64.8 and 57.5. The Gastrocnemius, despite its significant force application near the support area, did not have a major effect on stress due to its small bending moment. On the other hand, the Vastus Lateralis muscle’s force large cross-sectional area and strategic positioning contributed to a reduced stress impact on the bone.
Figures 7, 8 and 9 provides a detailed summary of the stress contributions from various muscle forces as determined by the RSM analysis.

The results obtained from the analysis of the response level for muscle forces and the intensity of each effect.

The effectiveness of each muscle force in the Pareto diagram.
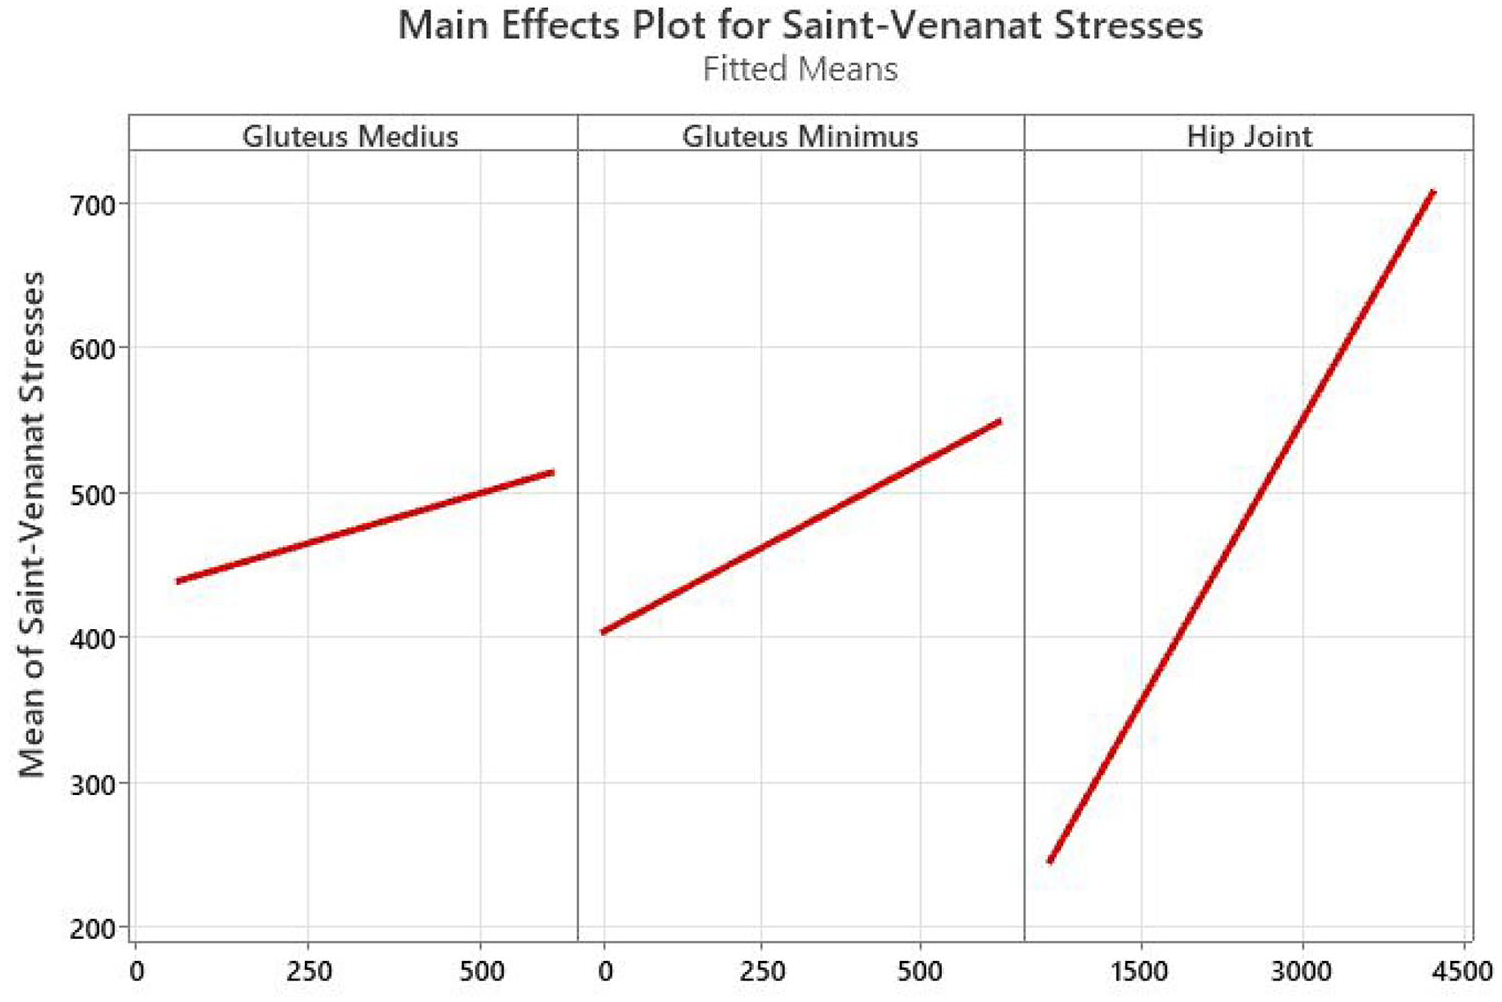
The effect of the 3 factors with the greatest effect on the stress on the bone.
Discussion
The purpose of this work was to examine the effects of muscle forces on femoral stress and identify their key factors. Previous research faced limitations such as analyzing isolated variables and high computational costs. This study addressed these challenges using the response surface method (RSM) and reliability concepts to provide a fast, accurate, and cost-effective solution for identifying primary muscle forces influencing femoral stress.
Findings revealed that, based on joint and muscle forces applied to the bone, internal stress could reach up to 785 MPa. The hip joint reaction force, directly related to body weight, was identified as the most significant stress-inducing factor on the femur, with an impact coefficient of 210.97—approximately 4 times higher than the second factor, the gluteus minimus muscle force (impact coefficient of 66.6). This highlighted the importance of weight management in reducing bone stress, as lowering hip joint forces could reduce stress to as low as 202 MPa. This underscores the significance of weight control for individuals at risk of osteoporosis and bone injuries.
Regarding displacement, the largest magnitude was recorded at 32 mm in the proximal femur, emphasizing the role of proximal muscle forces. In addition to the gluteus minimus and hip joint forces (both originating from the proximal femur), 2 other proximal muscle forces—gluteus medius and piriformis—ranked third and fourth in impact coefficients at 34 and 31, respectively. Of 6 major muscle forces analyzed, 4 were located in the anterior femur (gluteus minimus, gluteus medius, gluteus maximus, and piriformis), with one long muscle positioned at the upper rear of the femur. Significant stresses generated by these muscles were primarily due to higher bending moments caused by their distance from the knee support area. This highlights the greater influence of muscles near the hip joint compared to those closer to the mid or lower femur.
Muscles with smaller effective cross-sections, such as piriformis, produced higher localized stresses due to concentrated loads on reduced areas. Notably, changes in any impactful factor directly altered bone stress proportionally, validating this method’s functionality. Adjusting hip joint forces within a range of 1600 to 2700 N could vary stresses from 250 to 785 MPa. Similarly, gluteus minimus muscle forces ranging from 184 to 284 N could alter stresses between 400 and 550 MPa (Figure 9).
A remarkable achievement of this work was significantly reducing computational time while maintaining accuracy. Traditional methods like Monte Carlo simulations demanded extensive resources and time; in contrast, RSM enabled rapid analysis with a reliability rate of 95%, completing tasks within minutes compared to 3 days required by Monte Carlo methods. This advancement demonstrates RSM’s potential as an efficient tool for complex medical and engineering problems.
Despite these insights, several limitations of the study should be acknowledged. Although we aimed to select a diverse range of muscle forces from various anatomical regions and with different magnitudes, only 10 were ultimately included due to the significant computational demands of the simulations. Incorporating a more comprehensive set of forces—including those from smaller and less dominant muscles—could provide deeper biomechanical insights in future analyses. Additionally, while the femur consists of multiple structural layers, this study focused exclusively on the cortical bone, as it bears the majority of mechanical loads. The cancellous bone and bone marrow were excluded because of their relatively minor contribution to load-bearing. However, modeling these internal structures in future studies could enhance the physiological accuracy of the simulations.
Key Findings
The main results-based findings of this study are as follows:
The maximum internal stress observed in the femur was 785 MPa.
The hip joint reaction force had the greatest impact on femoral stress (impact coefficient: 210.97), approximately 4 times higher than the next most significant factor.
The gluteus minimus muscle force ranked second (impact coefficient: 66.6), followed by the gluteus medius (34) and piriformis (31).
The maximum displacement recorded was 32 mm, located in the proximal femur region.
Adjusting hip joint forces within the range of 1600 to 2700 N resulted in stress variations from 250 to 785 MPa.
Varying the gluteus minimus muscle force between 184 and 284 N altered stress from 400 to 550 MPa.
The response surface method (RSM) achieved 95% reliability and completed simulations within minutes, compared to the 3 days required by traditional Monte Carlo methods.
Conclusion
This study successfully demonstrated that femoral stress is significantly affected by both joint and muscle forces, particularly those originating from the proximal and anterior regions of the femur. Among the examined variables, the hip joint force had the strongest influence on stress distribution, underlining the clinical importance of weight management for individuals at risk of bone degeneration or fracture.
Additionally, the piriformis muscle was highlighted for its notable role in localized stress generation due to its small cross-sectional area. The use of RSM not only allowed for a precise understanding of multi-factorial influences on bone stress but also significantly reduced analysis time, suggesting its strong potential for future biomedical applications.
Ultimately, this approach provides a practical and reliable framework for evaluating biomechanical factors affecting bone health, paving the way for more comprehensive and physiologically accurate studies in the future.
Footnotes
Consent for Publication
All authors permit the publisher to publish the work.
Author Contributions
Habibi contributed to data analysis, modeling, and manuscript writing. Nazari Shalkouhi contributed to simulation and manuscript writing. Keyhani Dehnavi contributed to data analysis and manuscript writing. Sharbatdar acted as co-director of the project, assisted in evaluating the results, and edited the manuscript. Rassoli supervised the project, including protocol development and manuscript editing. All authors read and approved the final manuscript.
Funding
The author(s) received no financial support for the research, authorship, and/or publication of this article.
Declaration of Conflicting Interests
The author(s) declared no potential conflicts of interest with respect to the research, authorship, and/or publication of this article.
Data Availability Statement
The authors confirm that the data supporting the findings of this study are available within the article [and/or] its supplementary materials.