
Abstract
Background:
The cancellous tissue forming the inner layer of long bones is highly porous at the center, with porosity decreasing toward the outer layer, leading to gradual variations in mechanical properties. Hence, cancellous tissue can be regarded as a functionally graded material (FGM). This study investigates the mechanical properties of graded cancellous bone.
Methods:
CT scan images combined with image processing techniques were used to extract gradients in mechanical properties of the femoral neck in bovine samples. Several unit cells were employed to model the microstructure of cancellous bone. The graded properties were validated through both numerical and experimental approaches. Cylindrical models are used for finite element analysis and complementary experimental tests were carried out on the femoral neck region.
Results:
Analytical relationships for mechanical properties of femur spongy bone have been presented. The Cubic and BCC unit cell structures, with
Conclusions:
The tesseract unit cell showed the most similarity with the cancellous bone properties, with only 0.11% difference in flexural stiffness, whereas the cubic unit cell, with an 8.48% difference, was the least suitable for modeling spongy bone.
Introduction
Compact and spongy bones, the 2 main types of bone tissues, are different in terms of geometry, structure, and density. The difference in their structures enables them to perform different functions. The hardness, stiffness, and density of compact bone are higher than those of spongy bone.1 -3 Spongy tissue forms a network of bone rods and plates, and the space between them allows for the passage of nerves and blood vessels.4,5 This type of geometry results in light weight of the spongy bone and gives it a surface-to-volume ratio that is as large as 10 times higher than that of compact bone. The geometry of porous spongy bone is highly dependent on the magnitude and direction of the loading applied to it.6,7
The bone structure consists of mineral and organic materials. Inorganic components are responsible for compressive strength, while organic components provide tensile properties that vary by disease and age. 8 Aging causes a decrease in bone minerals and as a result, decreases the strength and fracture toughness of the bone. 9 Researchers have shown that the probability of bone crack growth increases with age. 10 Also, age-related changes in the microstructure of trabecular bone, such as a decrease in the number and thickness of trabeculae, lead to a decrease in mechanical properties such as Young’s modulus and strength. 11 Reducing physical activities is another factor that causes the reduction of minerals in bones. The higher the amount of loading and its rate on the bone, the more it stimulates bone-forming cells and increases bone density. 12 Also, recent advancements in biomaterial research highlight the potential of porous hydrogel structures containing bioactive elements to enhance bone repair and regeneration by optimizing mechanical properties and cellular interactions. 13
Many studies have been conducted on the mechanical properties of spongy and compact tissues of the femur bone. Different methods such as nanoindentation, ultrasonic methods, and micromechanical testing have been proposed to determine the Young’s modulus and flexural strength of spongy tissue.14 -17 In these studies, the Young’s modulus of bovine femoral neck determined by bending test has been reported as 2 ± 1 GPa for spongy tissue and the average Young’s modulus of cortical bone sample investigated by ultrasonic methods has been reported as 20.7 ± 1.9 GPa. 18 Also, for human femoral proximal samples, the Young’s modulus determined by compression test is about 3.47 ± 0.47 GPa. 19 The voxel-based FE approach is a specific method for predicting the linear elastic properties of cancellous tissue and the results obtained with this method are higher than those obtained by experimental tests.20 -22
Studies present the dependence of the elasticity and strength of cancellous bone on apparent density using analytical approaches.6,23,24 Geometrical properties such as pore size and trabecular thickness, can be controlled to achieve an optimal distribution of porosity and mechanical properties within the structure.25,26 One method of identifying bone tissue is the use of medical images, especially CT scan images. Using these images, researchers can identify tissue geometry and diseases related to the skeletal system in their more advanced stages using complex algorithms. Researchers have employed various methods for digital image processing and noise removal. The use of optics in micro-scan systems and grayscale adjustment using adaptive strips for noise removal are among the methods utilized in previous studies.27,28
Recent advances in finite element methods (FEM) have enabled accurate modeling of functionally graded and porous materials, which are highly relevant for trabecular bone and bone-mimicking scaffolds. These numerical methods have been used to design and optimize the unit cell micro-architecture in porous structures.29 -33 Also, FEM has been applied to predict the dynamic and stability responses of functionally graded beams and plates, demonstrating its ability to capture complex mechanical behavior due to material gradients and microstructural reinforcement.34 -38 Additionally, simplified homogenization techniques have been employed in nonlinear FEM analyses, such as for in-plane problems, highlighting the method’s capability to handle nonlinearities and complex material behavior.39 -41 These studies collectively underline the versatility of FEM in simulating graded, porous, and nonlinear structures.
The graded structure can also be used in fabricating orthopedic implants. 42 By implementing variable porosity, implants can better mimic the porous characteristics of natural bone. 43 It has also been found that the graded mesh structure has better energy absorption capability and mechanical properties compared to uniform mesh structures, which makes it superior for applications of protective and medical devices. 44 Complex algorithms have been developed to design graded structures with appropriate porosity for bone replacement applications using numerical software. Geometric properties such as pore size and rod thickness can be controlled to provide optimal porosity distribution and mechanical properties of the lattice structure. 25
The spongy tissue that forms the inner layer of long bones has more pores in its central region. In the femoral neck region, by moving from the central axis of the bone shaft to its outermost layer radially, the level of porosity decreases, which causes a gradual change in the mechanical properties of the spongy tissue.45 -47 In recent research works, cellular materials composed of repeating unit cells have gained significant interest as potential biomimetic structures for bone tissue. These studies have primarily focused on identifying the most suitable lattice configurations that closely replicate the compressive mechanical behavior of natural bone. Various unit cell geometries have been examined to model trabecular bone, and their effective mechanical properties have been evaluated against actual bone tissue. Moreover, different unit cell dimensions have been analyzed to assess how cell morphology influences mechanical performance, and the optimal strut diameter for each unit cell design has been determined.48 -51
As a result, the spongy bone can be considered as a functionally graded material (FGM), or more relevant to this study, a functionally graded lattice (FGL). Therefore, investigating FGL structures for modeling spongy tissue can be of significant importance. Different unit cell geometries can lead to different gradient microstructural characteristics raising the question of which unit cell type can better mimic the actual mechanical response of spongy tissue. To the best of our knowledge, no study has been dedicated on providing functionally grading properties such as relative density and elastic modulus relationships for the femoral bone neck region. Also, there has been no study comparing unit cells in terms of bone flexural stiffness using a combined analytical, numerical and subsequently experimental validation approach.
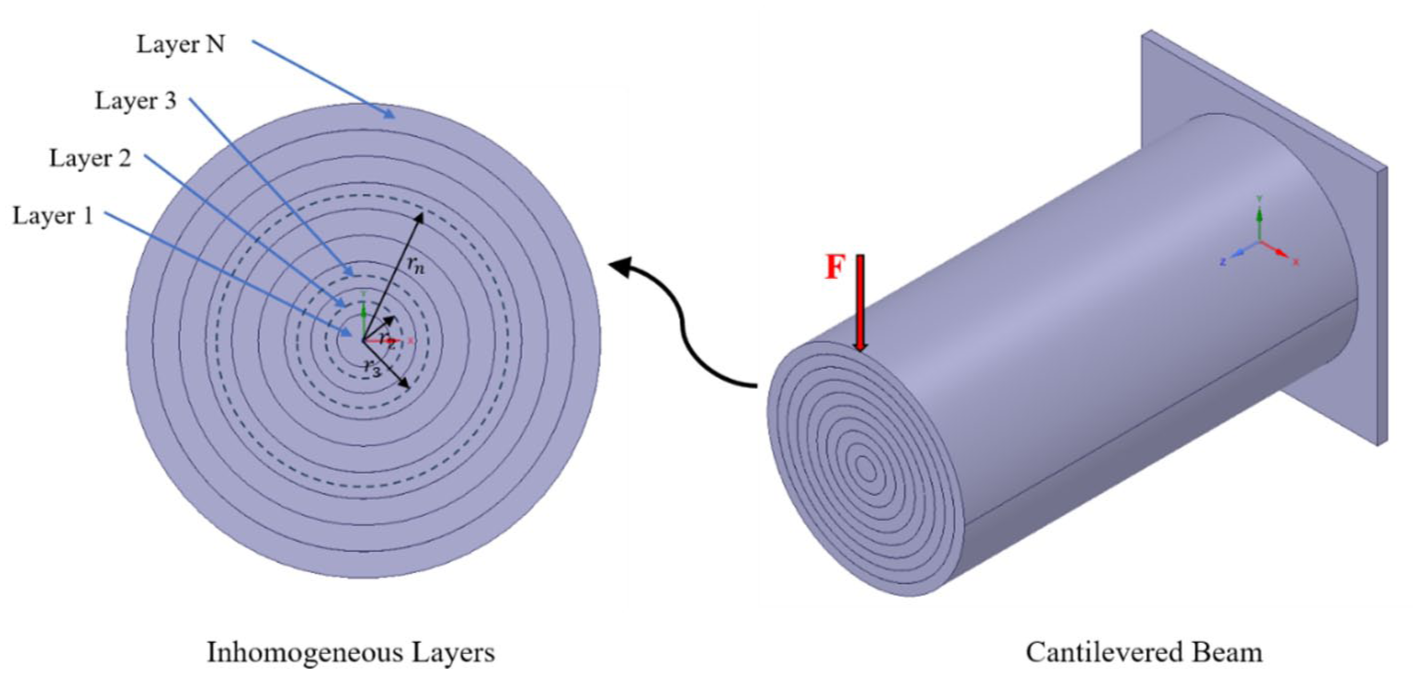
In this research, the mechanical properties of graded cancellous bone have been studied. First, by using CT scan images and performing image processing techniques, changes in bone density are extracted relative to the radial distance in bone cross-sections. Several unit cells are considered for the microstructure of the cancellous bone porous model, and then, by using the homogenized mechanical properties, relationships for Young’s modulus in terms of the radial distance are extracted in the bone section. Extracted graded properties are validated using numerical analysis and experimental tests. The neck region of the femur bone is one of the most critical regions in skeletal fractures. The main focus of this research is modeling the cylindrical part of the femur neck region using the homogenization technique described above. The inner layer of the bone in this region is formed by a spongy tissue, which is considered as a functionally graded material in the model (Figure 1). Bovine bone is used for the experimental tests and its neck region is loaded under inclined compressive load.
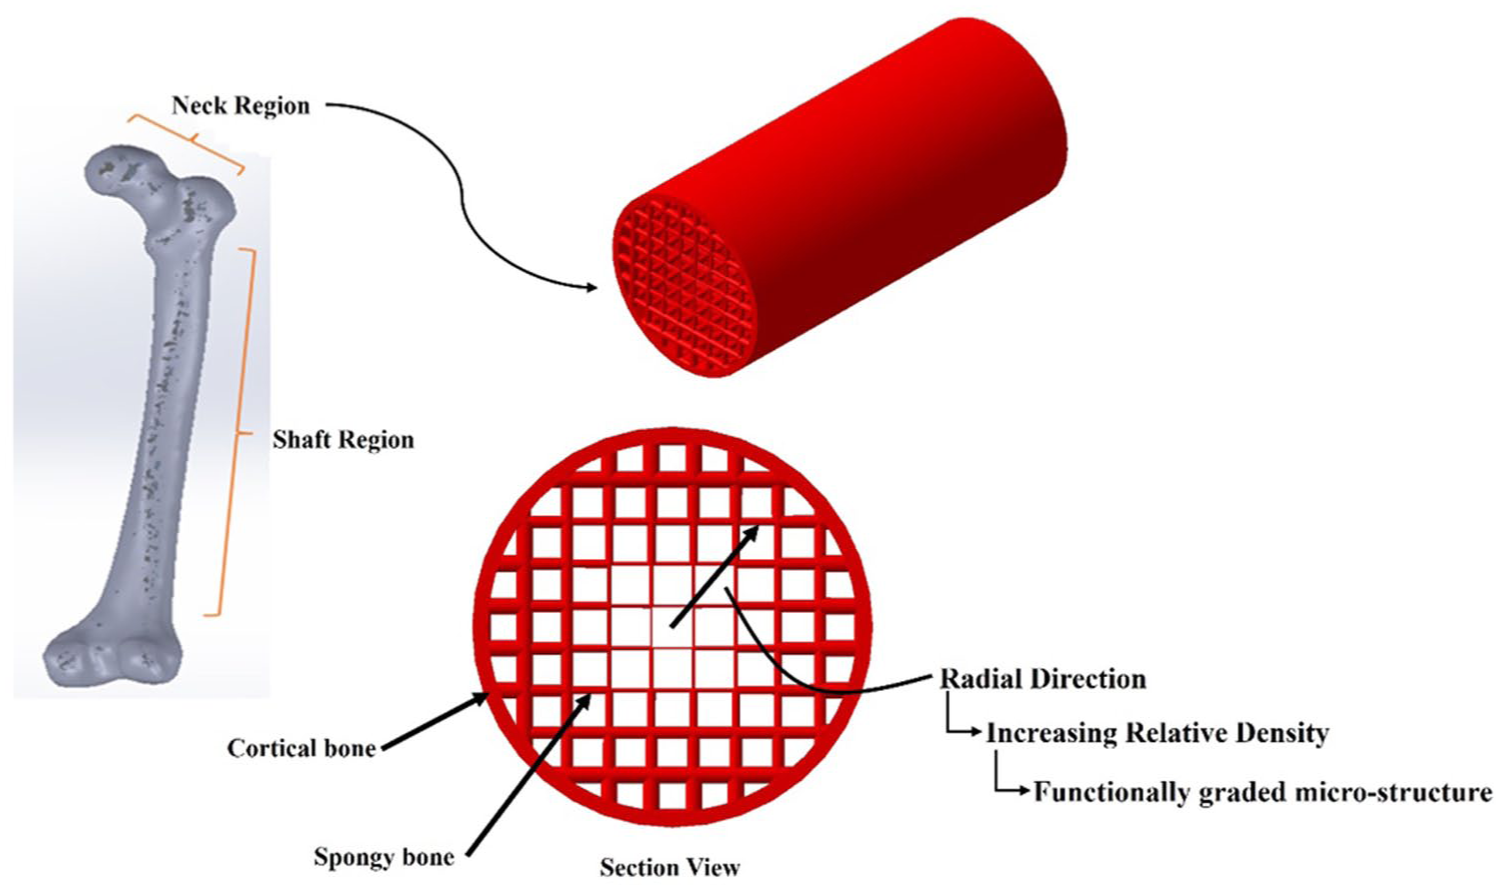
Modeling the cross-sectional geometry of the feomoral neck bone using FGL.
Materials and Methods
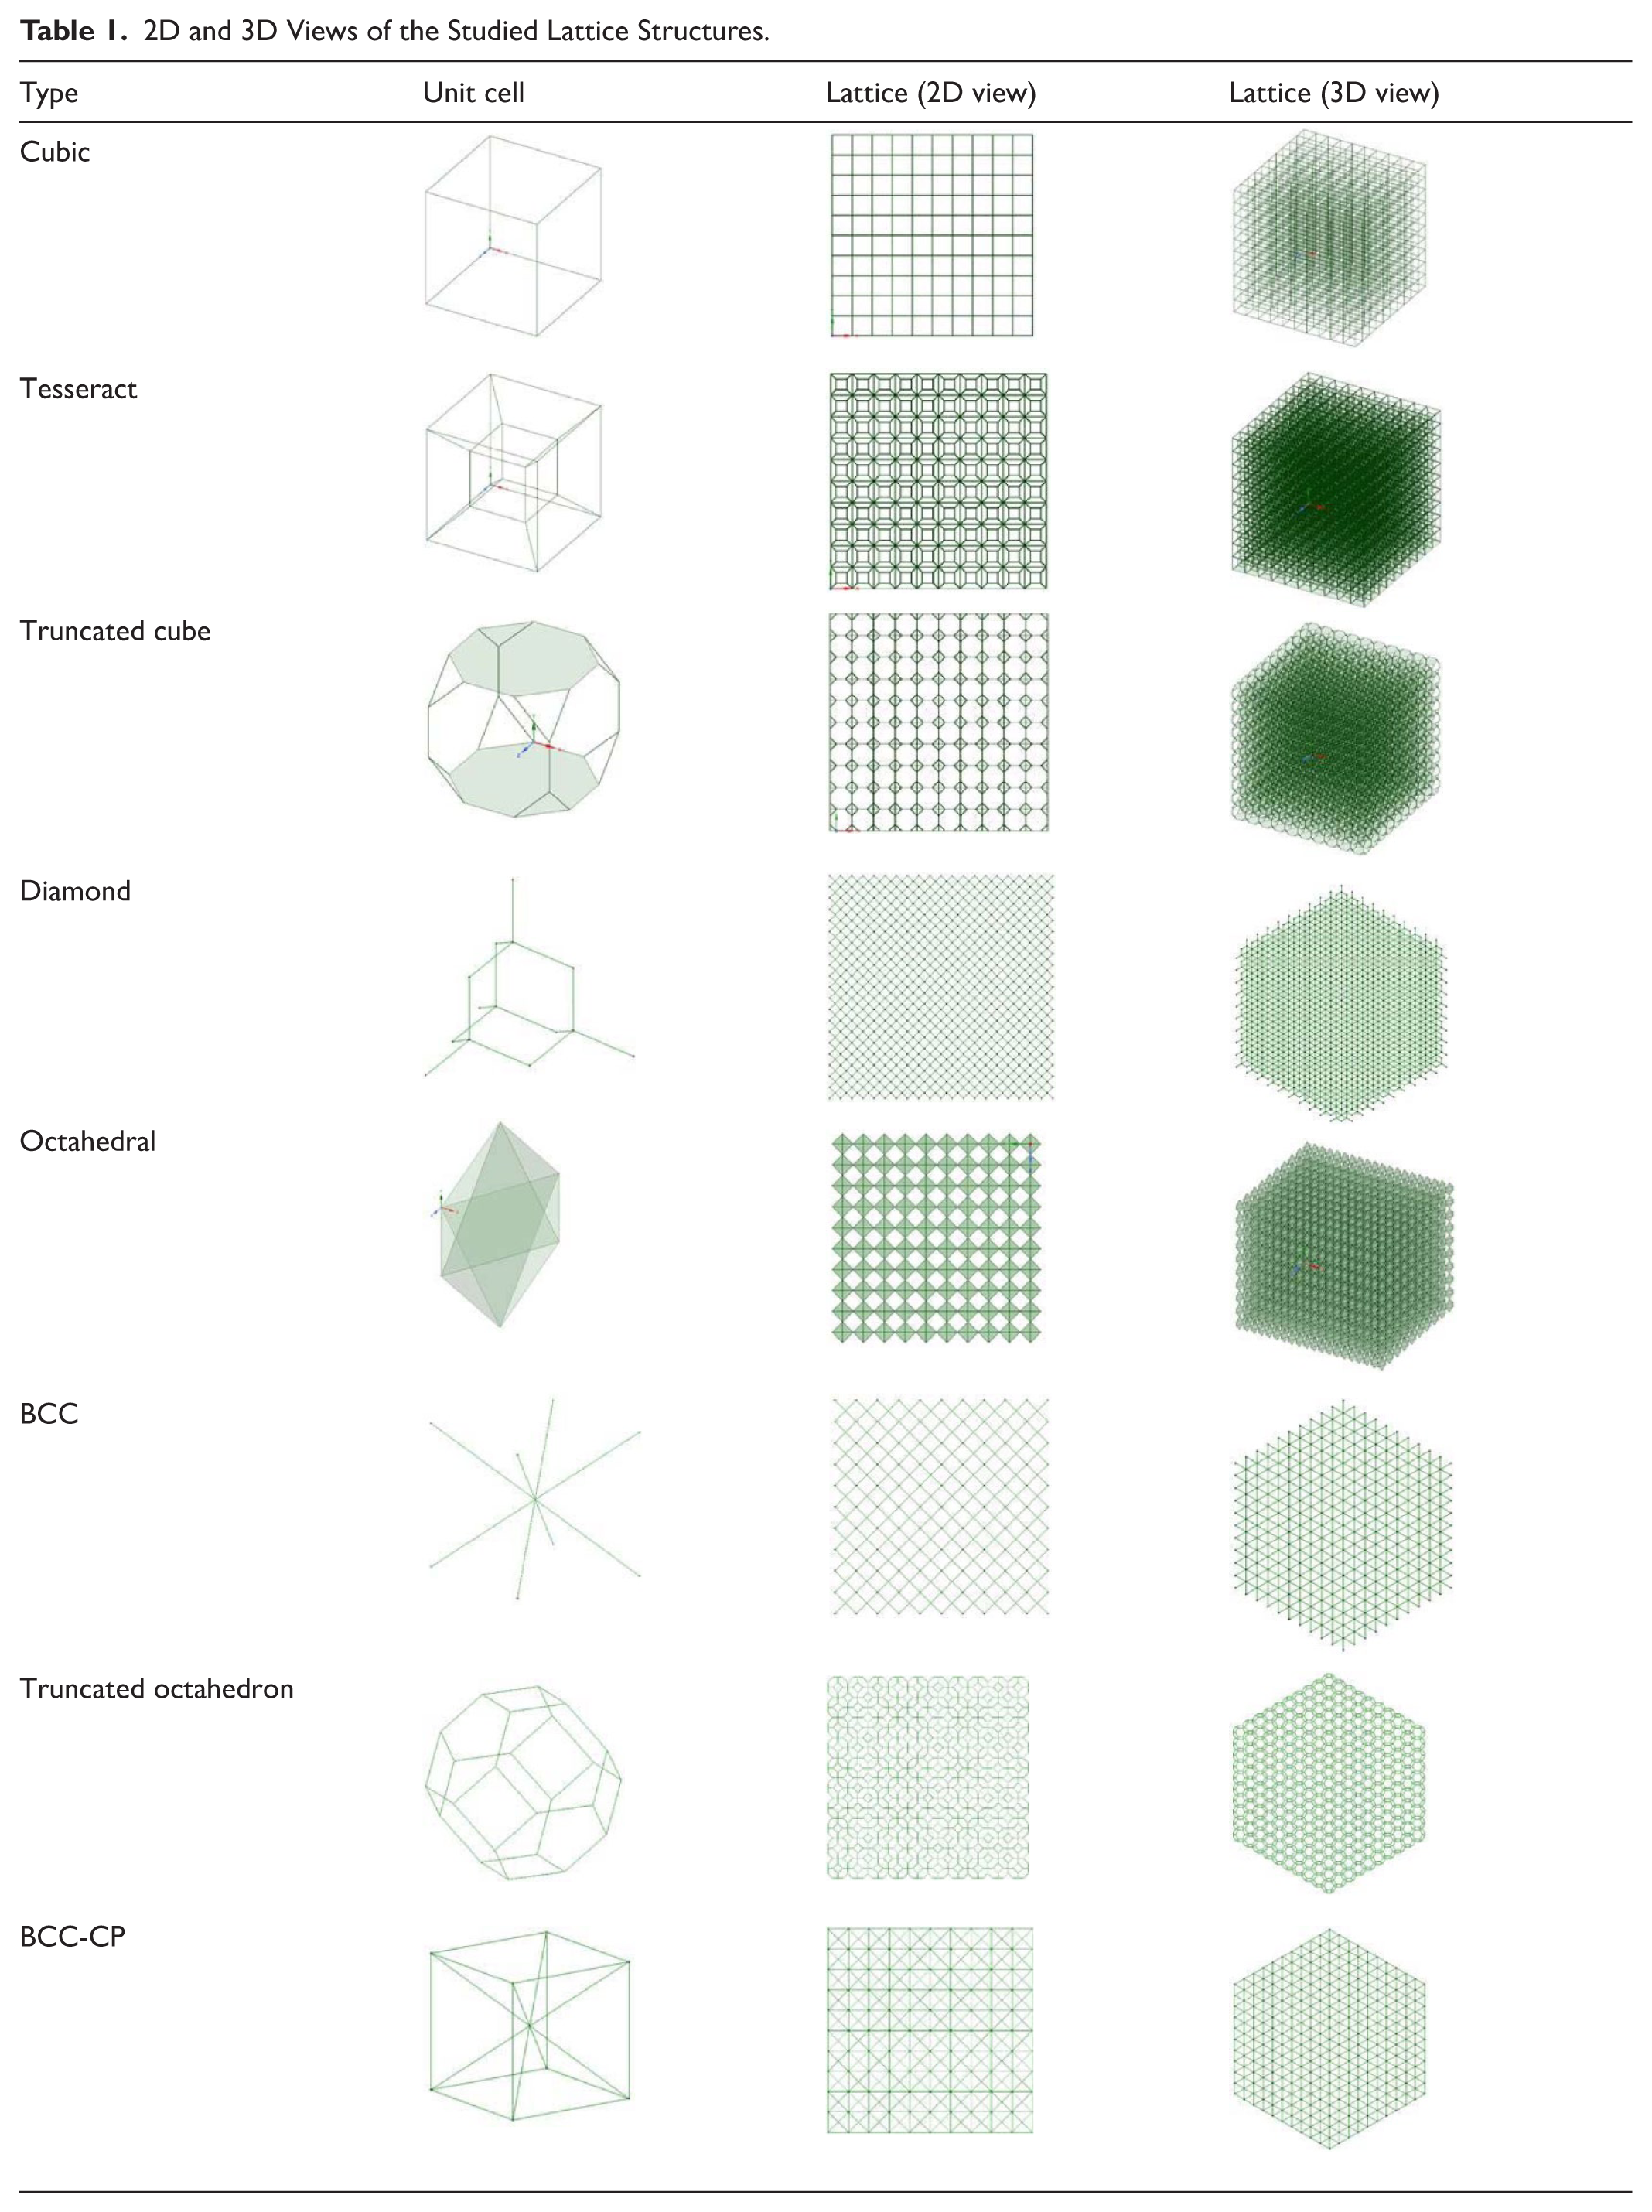
In this study, inhomogeneous mechanical properties of the cancellous porous tissue are determined in the neck region of the femur bone. In the skeletal structure of the body, the density of spongy tissue changes locally, therefore, an implicit relationship for the analysis of density gradients is derived. Moreover, deriving elastic modulus relationships as a function of radial distance from the femur shaft axis is another goal of this research (Figure 1). For studying the cancellous bone tissue, 8 different unit cells are considered: Cubic, Tesseract, Truncated Cube, Octahedral, Diamond, BCC, Truncated Octahedron, and BCC-CP (Body Centered Cubic combined with Cubic Primitive) which have been shown to have the closest behaviors to spongy bone (Table 1). 52 For each unit cell, a characteristic ratio of strut diameter to length d / l was defined (Figure 2). The mechanical properties of the unit cells have been determined using d / l ratio in the recent studies (Table 2). Also, the density gradient of real bone has been used for modeling the spongy tissue as FGL material. Subsequently, the density gradient of spongy tissue can be taken into account by changing the d / l ratio. To introduce gradients into the lattice structure, there are 2 primary approaches: varying the strut diameter (d) or varying the strut length (l). Either method, or a combination of both, can be used to create a lattice that effectively mimics the mechanical and geometric gradients of natural cancellous bone. In this study, the exclusive variation of d was considered for changing the relative density.
2D and 3D Views of the Studied Lattice Structures.
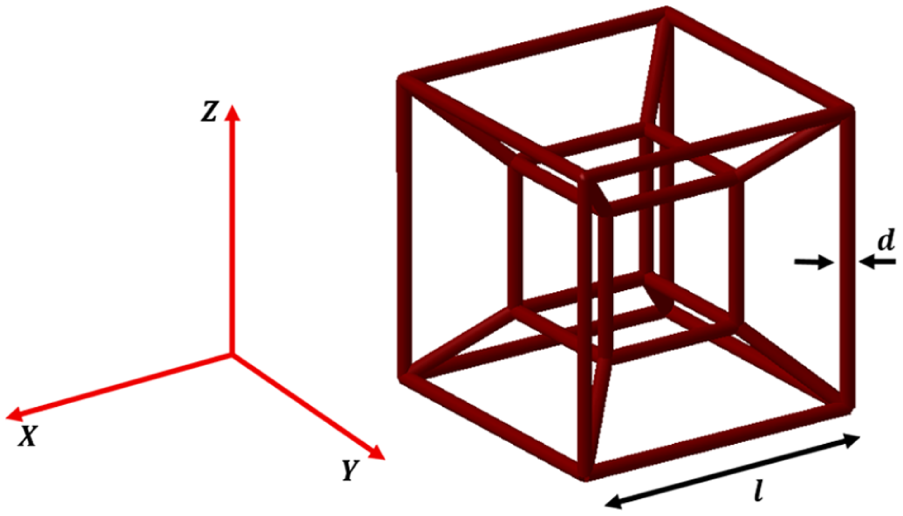
d / l ratio in tesseract unit cell.
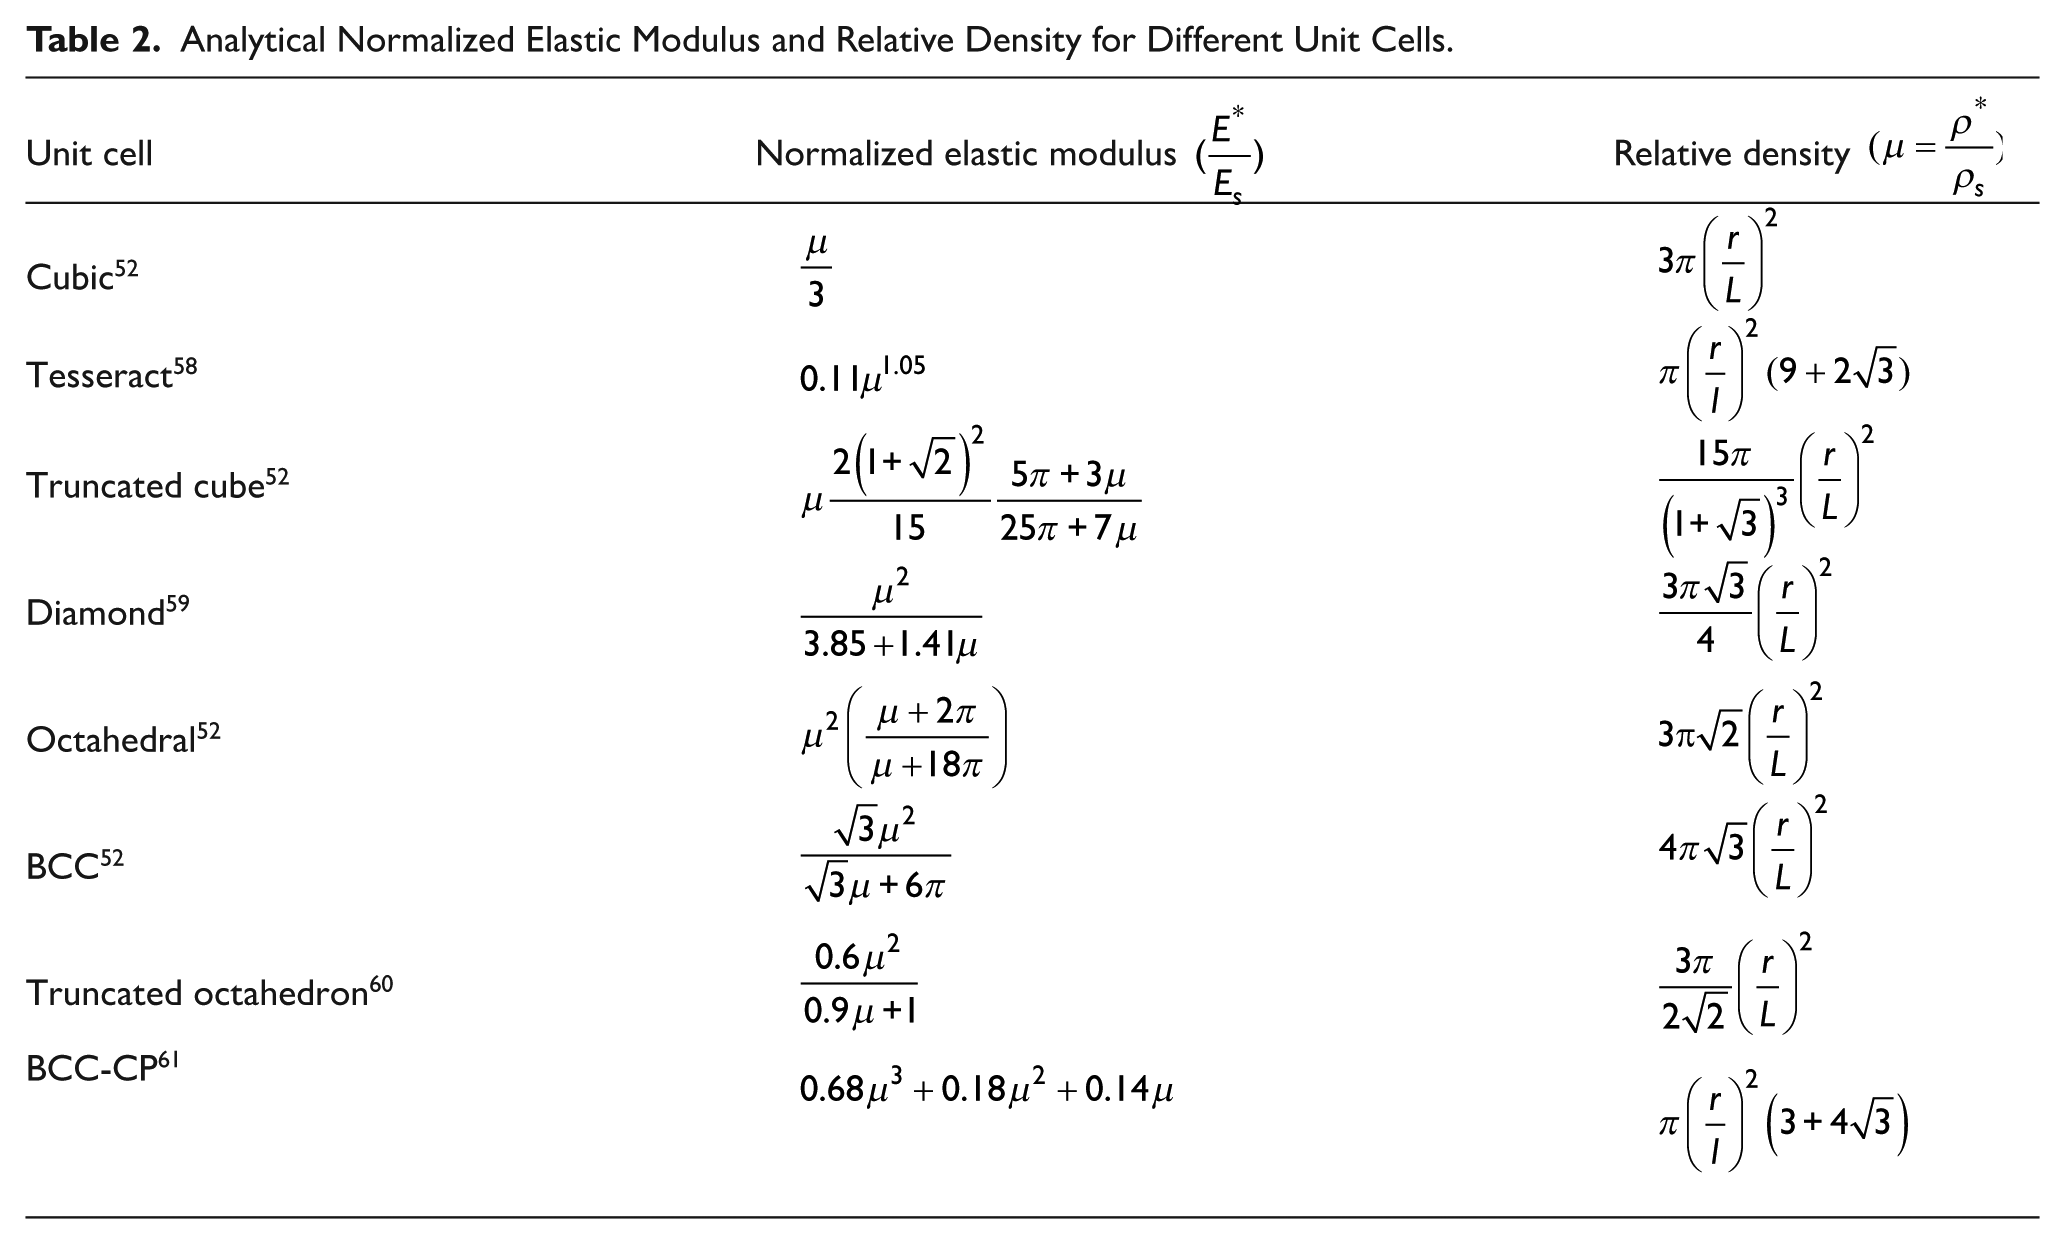
Analytical Normalized Elastic Modulus and Relative Density for Different Unit Cells.
The three following subsections consist of the derivation of the analytical relationships, the FE models used for validation, and the description of the experimental tests. First, CT scan images were obtained from the proximal region of the femur. The intensity of the grayscale was measured in each pixel using image processing techniques and numerical software (MATLAB R2018b) and the subsequently, the relative density and Young’s modulus gradient relationships in the cancellous bone section were obtained. Afterward, a layered cylindrical model was prepared using simulation software ANSYS R2019 and transverse load was applied on 3D model statically. Finally, the average flexural stiffness of cancellous bone section was extracted and compared with the results obtained by analytical approach. Due to the inaccessibility of human samples, bovine femur specimens were used for experimental testing, and load-displacement curves were obtained. The procedure used for preparing the samples and obtaining CT-Scan images of the femur bone is shown in Supplemental Material Figure S1.
Analytical Solution
The spongy tissue will be modeled as a functionally graded lattice material. Figure 3a shows gray intensity level in the bone cross-section from neck of the femur. According to the Figure 3a and b gray level of the bone increases with increasing radial distance. Therefore, changes in the mechanical parameters as a function of the radial distance from the center of bone section determine the degree of property gradient of spongy bone tissue.
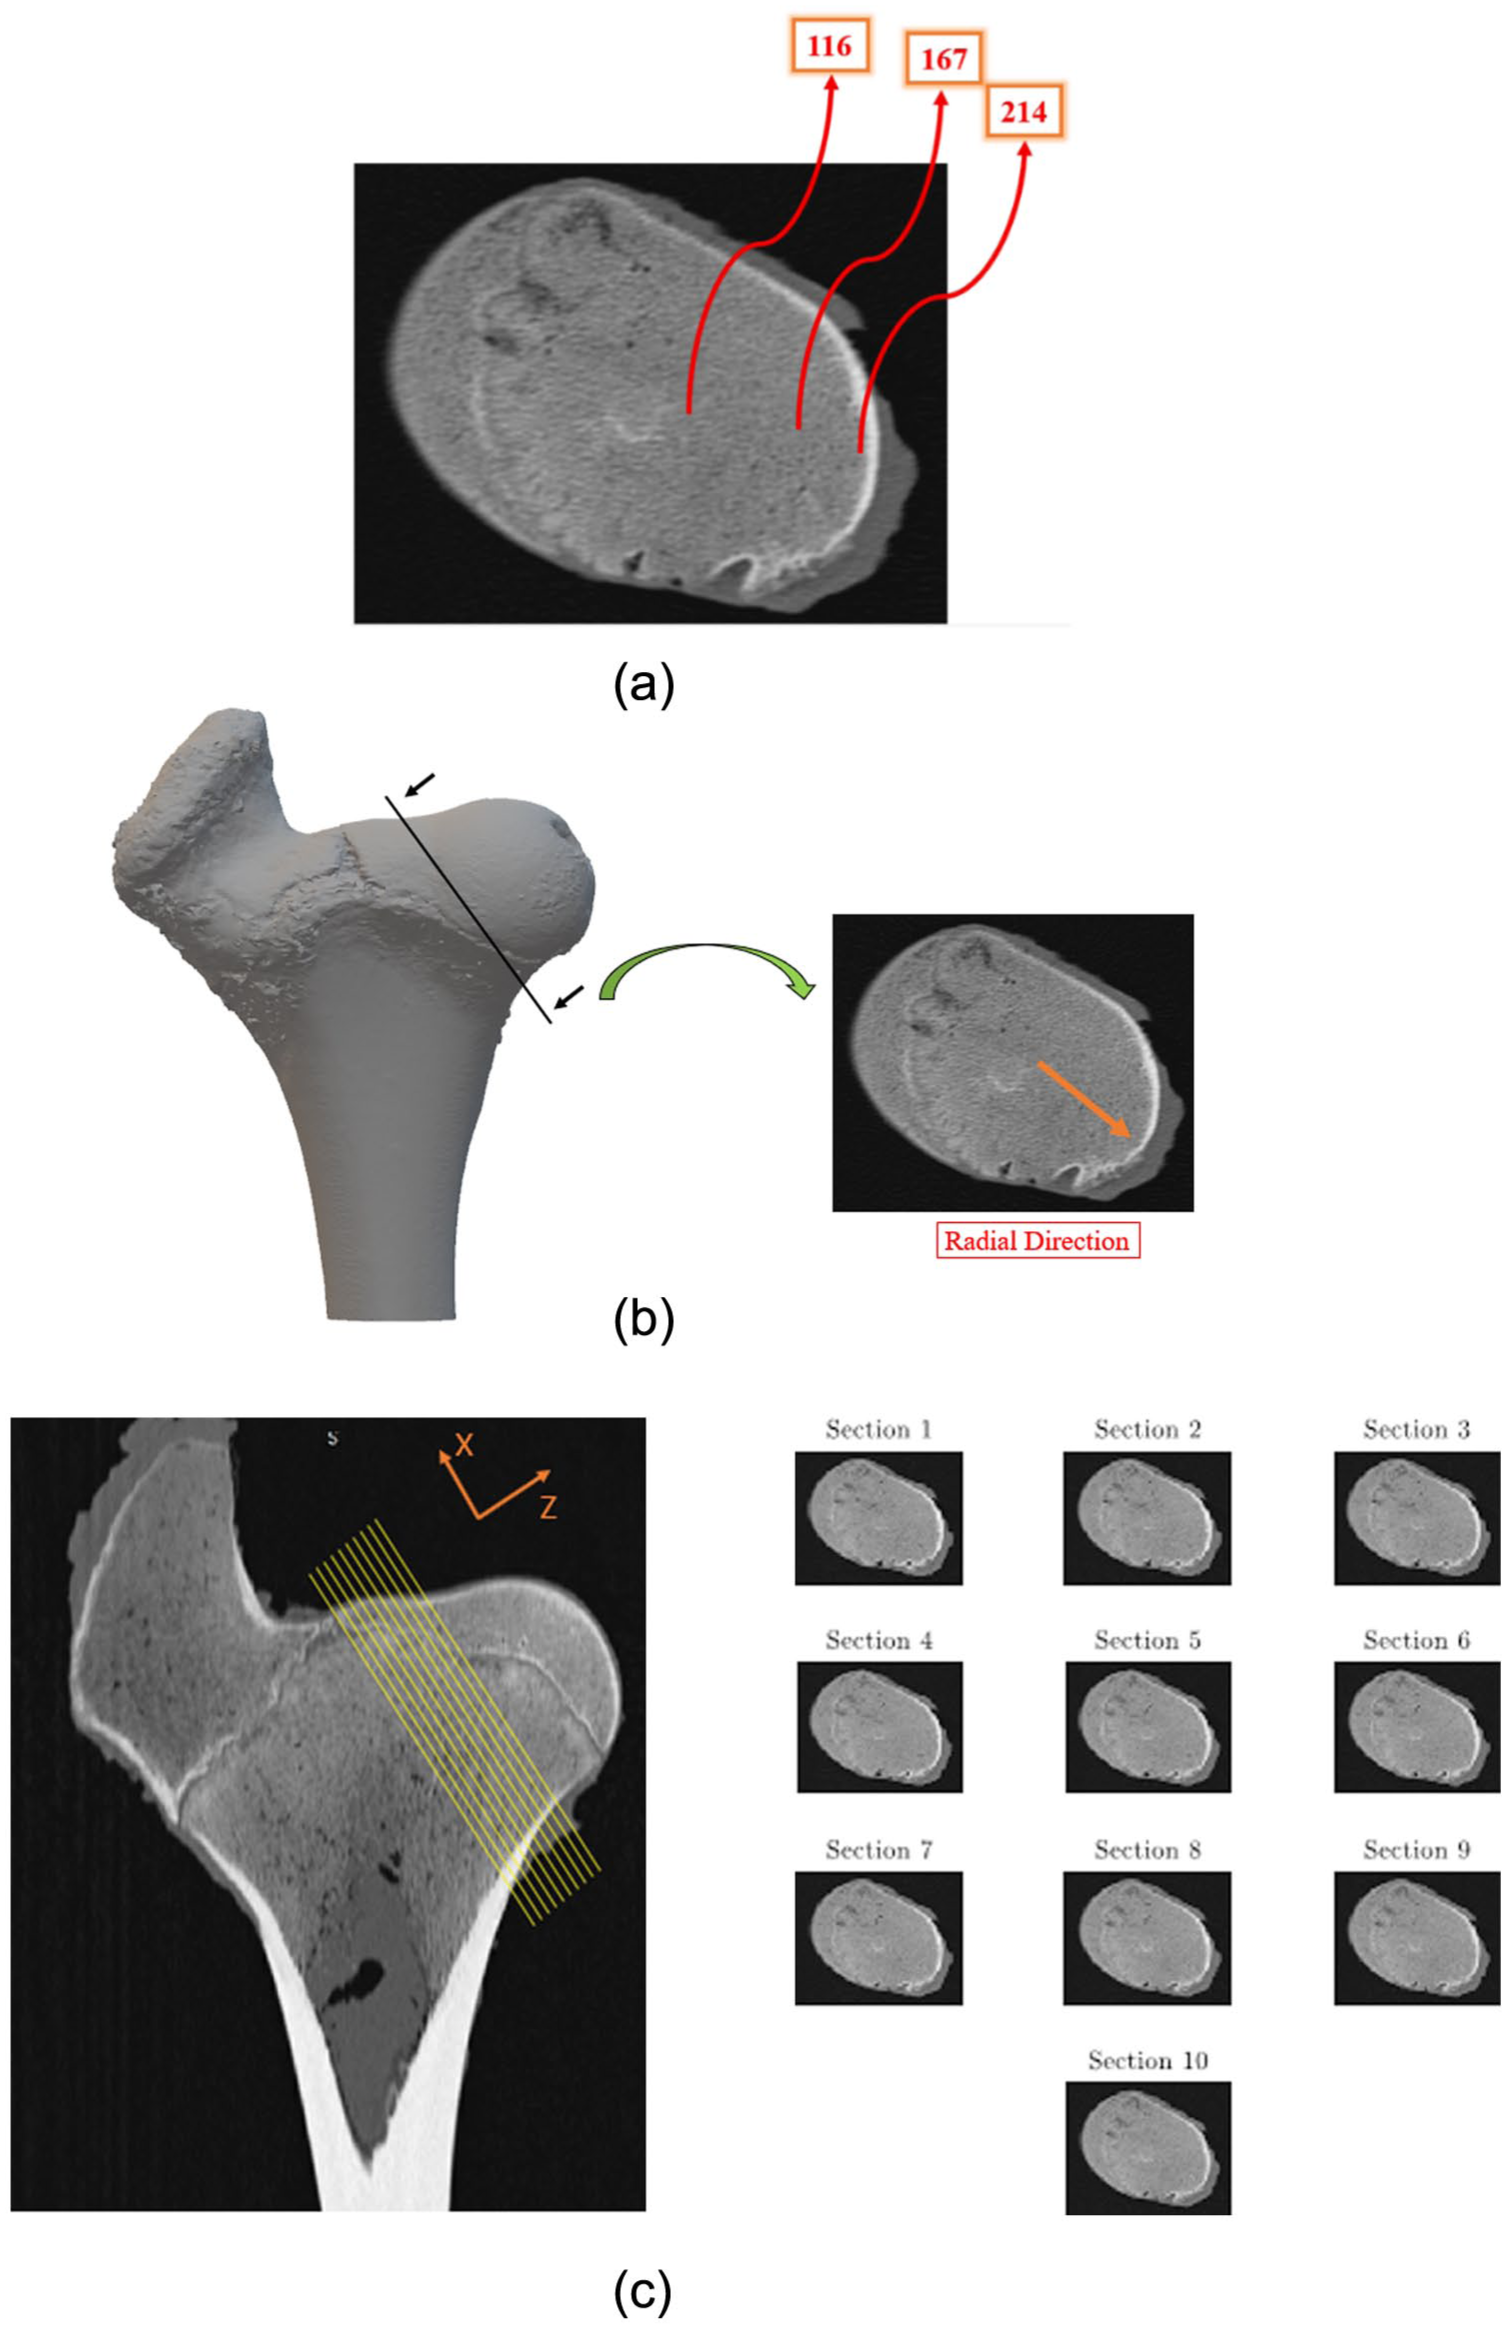
An example of sectional view of femur bone neck: (a) brightness value of cortical bone, (b) radial direction of bone cross section, and (c) 10 consecutive sections of the femur neck.
To study the spongy tissue’s property gradient degree, CT scan images with a resolution of 1600 × 800 and with a slicing thickness of 1 mm were used. The images were collected from the neck region of the bone at 10 different sections (Figure 3c) and were analyzed using image processing techniques. The desired cross-sections were taken in the direction perpendicular to the femur neck axis (ie, z axis in Figure 3c). By considering the brightness changes (gray level) of the spongy tissue, the changes in the density of tissue as well as the Young’s modulus in the radial direction were determined. In each section, the apparent bone density was determined at the center of trabecular bone cross-section using previous studies53 -57 and the corresponding gray value (pixel intensity) from the CT images was then recorded. By comparing the derived density value with the gray values at reference location, a calibration ratio was obtained. This ratio was subsequently applied to all other pixels within the CT images to compute their apparent densities. After that, a continuous density gradient was constructed across the femoral trabecular region using curve fitting approach. Furthermore, the obtained density distribution was compared against published experimental data for bovine femoral trabecular bone, 55 showing good agreement and confirming that the extracted gradient is physiologically meaningful.
To ensure the accuracy and physiological relevance of the extracted density field, the results were validated against experimental studies that have reported trabecular bone density at different anatomical locations within the femoral neck. 55 The good agreement between the CT-derived density distribution and these experimental datasets confirmed that the proposed calibration approach yields values within the expected physiological range. This step not only enhances the credibility of the methodology but also demonstrates that the extracted density gradients can serve as reliable input for subsequent mechanical modeling.
In the cross-section images of the femur bone (an example of which can be in Figure 3a), a brightness level between 0 and 255 is allocated to each pixel, and it represents the gray level and subsequently density of the bone tissue. According to the recent studies, the relative density of spongy bone in the center of bone cross-section is about 0.27 in bovine femoral neck samples and it increases moving outwards in the radial direction. Based on the noted principle, the bone density variations in its cross-sections were considered.53,54,57
As mentioned in the previous sections, eight different types of unit cells were implemented to create the porous structure of spongy tissue. The relative density relationships in terms of geometric parameters have been derived for each unit cell in previous studies.52,58 -61 In this research, the inhomogeneous density of spongy tissue is determined using MATLAB software and bone cross-section images. Finally, local Young’s modulus can be determined for each unit cell as a representative of spongy tissue. Using local Young’s modulus, it is possible to determine the gradient of mechanical properties of spongy tissue in the cross-section of the femur bone in the neck region.
The cross-section of the femur bone in the neck zone was considered to be circular. Therefore, the relative density and normalized Young’s modulus are presented as a function of normalized radial distance. The radial distance was normalized to the radius of the outermost layer of the femur bone neck section. The average Young’s modulus was calculated to determine the flexural stiffness of the bone section. The mechanical properties varied continuously in the radial direction of the femur bone section and it is possible to integrate the elastic properties relationships using the cantilevered beams theories (Figure 4) according to equations (1) to (7) 62 to determine the average Young’s modulus of the spongy tissue. Finally, normalized averaged Young’s modulus relationships were then calculated for the unit cells that represent the spongy bone. Also, the bending stiffness of the bone tissue has been evaluated and due to the complexity of modeling the bone behavior in tensile and compressive regimes of flexure, it was assumed that the bone has the same tensile and compressive behavior. Moreover, it has been shown that the difference in the compression and tensile moduli of spongy bone is less than 0.4%.63 -65
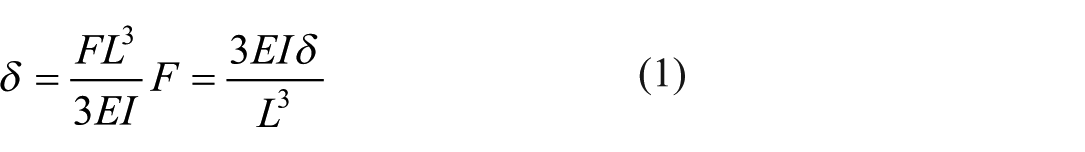


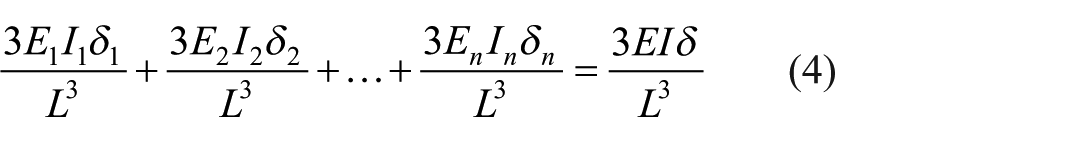

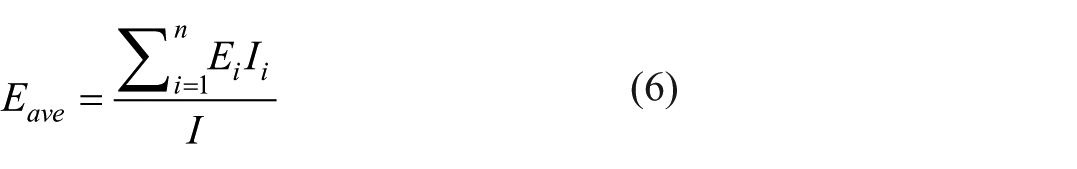
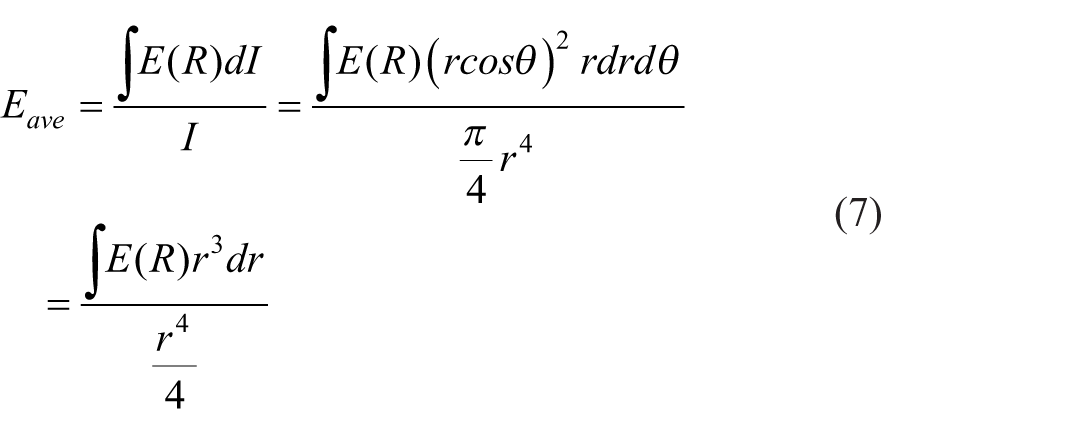
where δ is the beam deflection, F is the transverse force, I is second moment of area, E(R)is the normalized local Young’s modulus, and Eave is the averaged Young’s modulus in bone cross-section. Also, normalized averaged Young’s modulus is defined as ratio of averaged Young’s modulus to Young’s modulus of solid material (Eave / Es) and flexural stiffness
Inhomogeneous cross-section of cantilevered beam.
Finite Element Model
In this section, the average flexural Young’s modulus of the bone cross-section will be evaluated. The femoral bone neck region was considered as a layered cylindrical geometry as shown in Supplemental Material Figure S2. The cross-section of the bone was assumed to be circular, and its geometric dimensions were assigned based on the CT images measurement.
ANSYS R2019 package was used for finite element (FE) modeling. According to the flowchart shown in Supplemental Material Figure S3, a multi-layered cantilevered beam was considered for linear analysis. The layers were bonded to each other, and the load was applied transversely to the bone section. For the 8 different types of unit cells, separate models were prepared and the average Young’s modulus for the bone cross-section was investigated numerically. The cylindrical models were discretized using 3D hex element type and they were finally subjected to concentrated quasi-static loading. The deflection of the beam was extracted, and the average Young’s modulus for each unit cell was calculated using equation (1). To check the effect of the number of layers in the cylindrical geometry, models having 2, 5, 10, 15, and 20 layers were prepared and a convergence criterion was considered.
Experimental Tests
In this section, Young’s modulus of the spongy tissue in the neck area of the femur bone was evaluated by performing laboratory tests. According to recent studies, cow and sheep femur bone samples have the most similarities to human ones. Moreover, the cow and sheep bone samples are the most available ones.
Four fresh-frozen bovine femora were obtained and stored at −4 to −6°C in the freezer. All soft tissues were removed from the femur of the bovine without harming the bone specimen. All femur bone specimens were thawed to the environmental condition at room temperature 27–30°C before conducting the tests. The distal portion of each specimen was fixed using resin cement. The quasi-static bending load was applied with a loading rate of 5 mm/min until the fracture initiates on the femoral neck area.
The experimental test setup consisted of a rotating movable part and a fix part as shown in Figure 5a. The movable part was able to be rotated every 15°, allowing for performing the experiments at different angles. In this research, the load was applied vertically on the femur hemispherical end (Figure 5b) and displacement along bone shaft axis was measured.
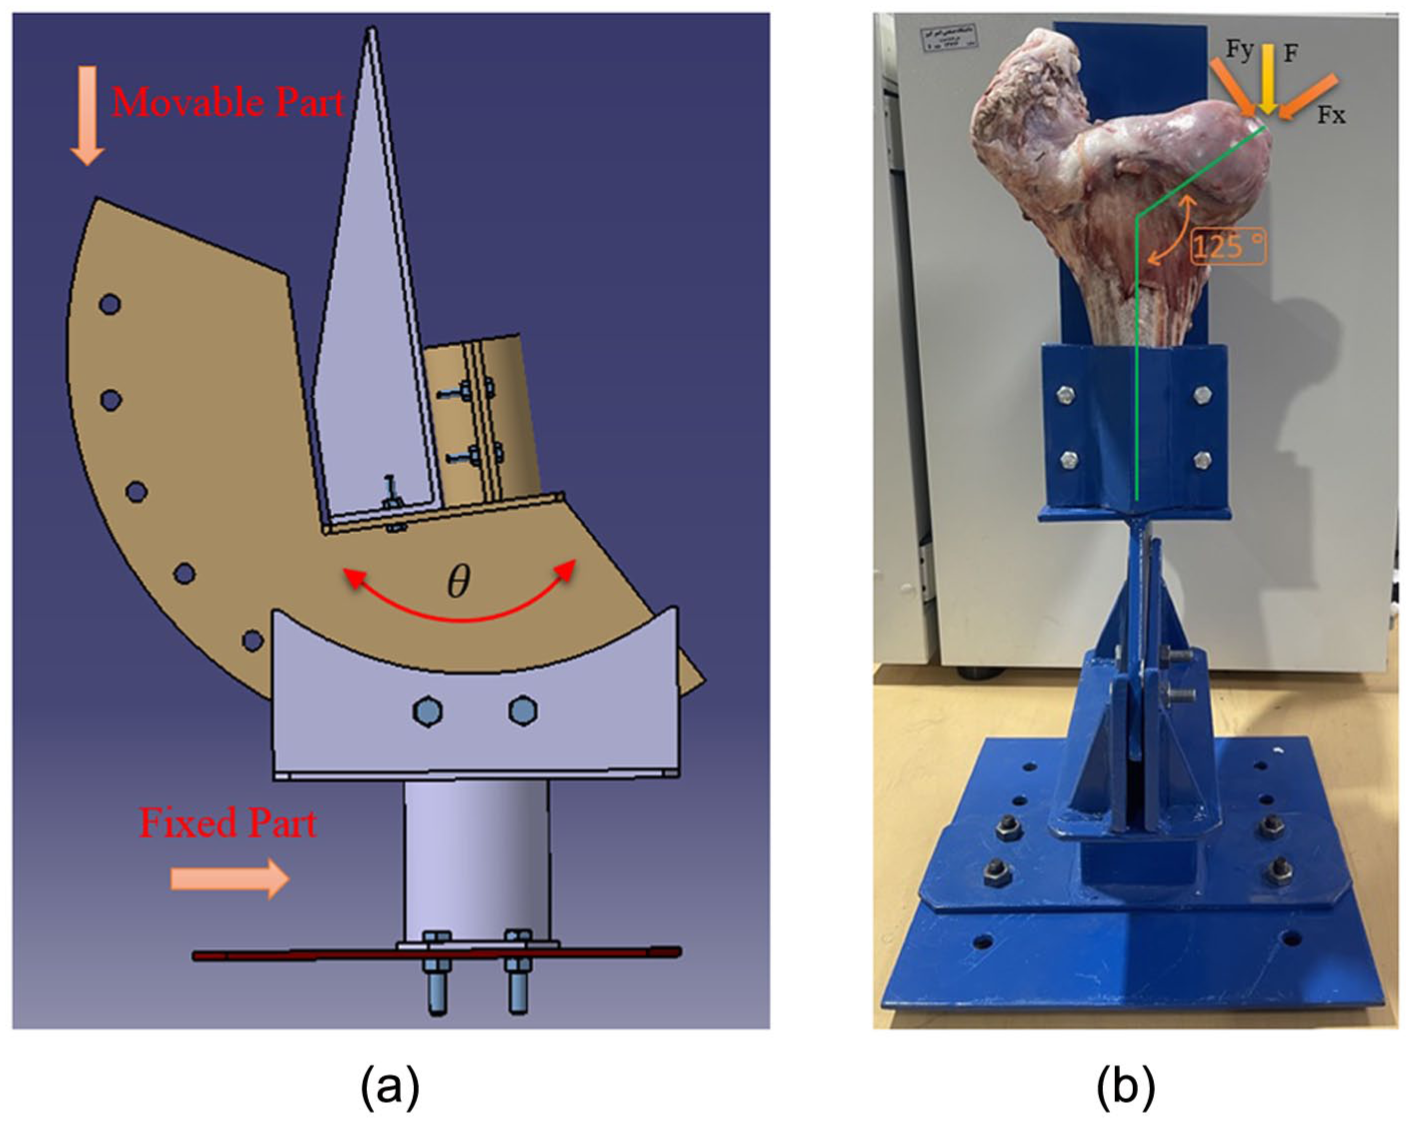
(a) Experimental test fixture and (b) femur neck in the test setup and loading directions.
Results
The relative density of spongy bone (compared to the density of compact bone with a density of 1900 kg/m3) is shown in Figure 6. The variation of spongy tissue relative density in the radial direction for 10 different sections is shown in Figure 6a that illustrates the variation of grayscale intensity obtained from CT-scan images as a function of the radial distance from the center of the femoral cross-section. By mapping these grayscale values against their respective radial positions, the plotted curves in Figure 6a reflect the gradual density distribution within the cancellous bone. The average relative density versus the normalized radial distance was obtained by averaging the results of the 10 selected sections (Figure 6b). This representation is particularly important since relative density is directly linked to the mechanical properties of the lattice model through the d/l ratio of the unit cell (as introduced in Table 2). The observed trend confirms that density and stiffness increase with increasing radial distance from the center.
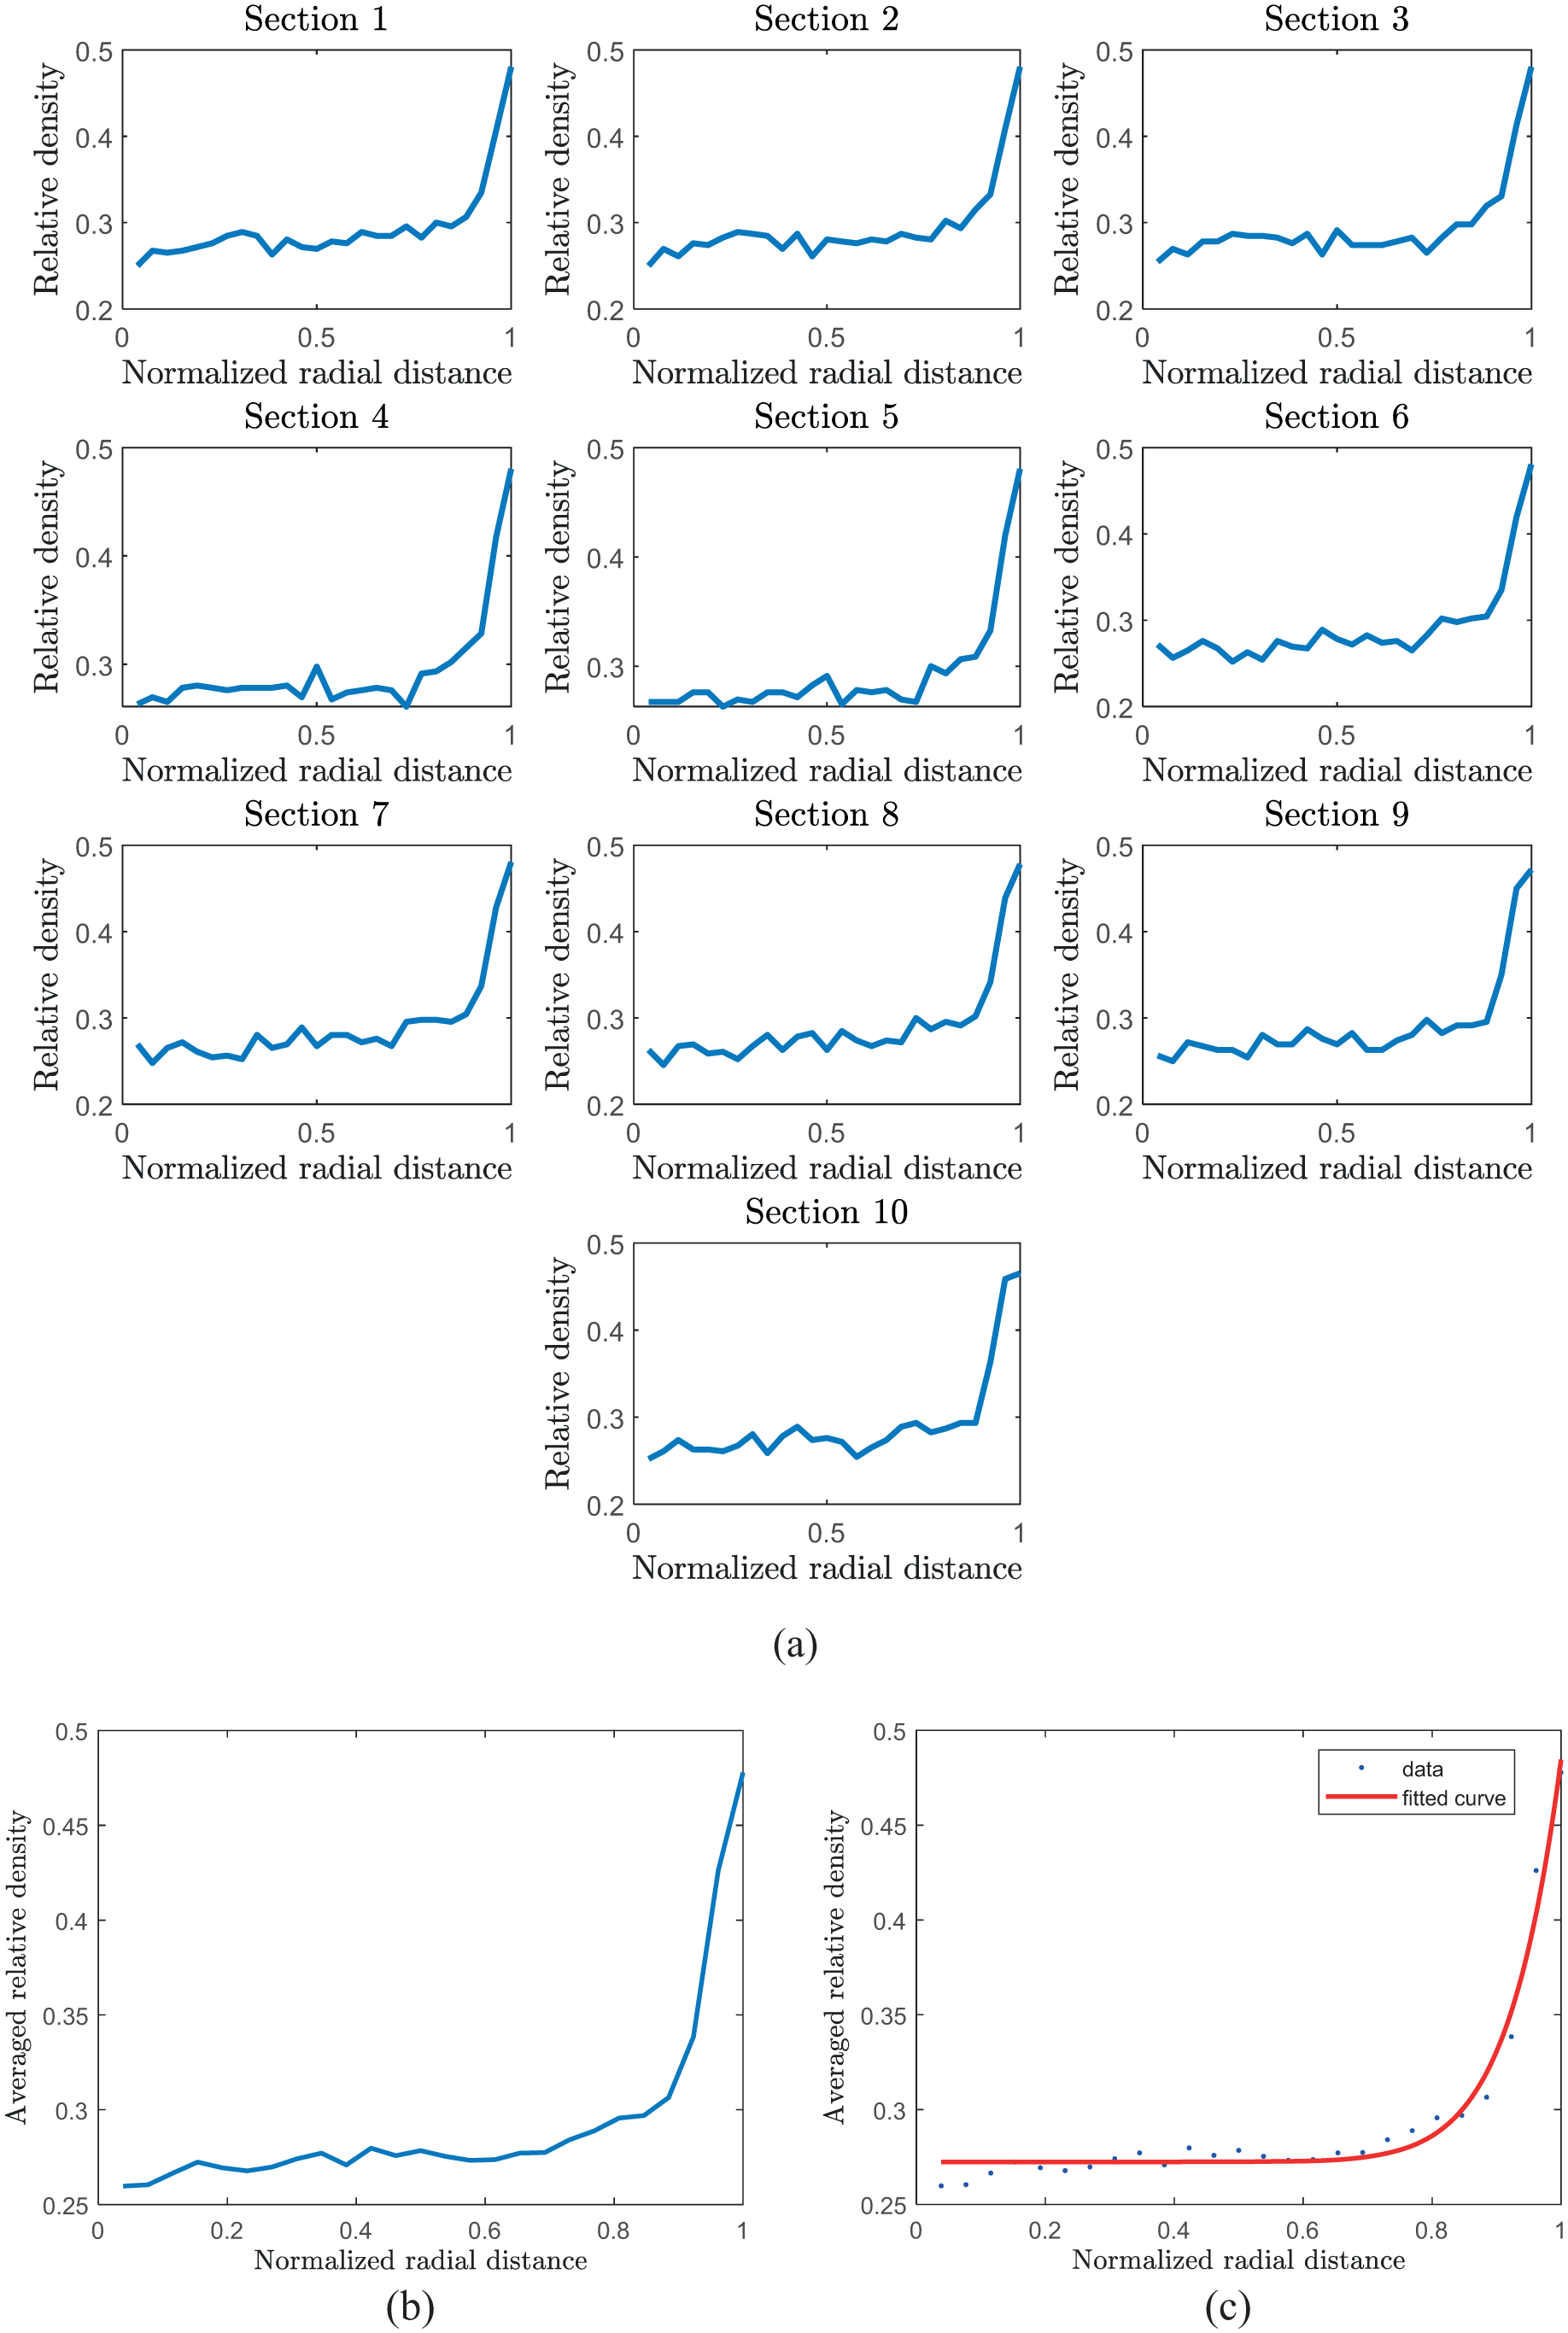
(a) The relative density changes versus normalized radial distance for 10 different considered sections, (b) the average density changes for all the spongy bone sections, and (c) power law curve fitting for average density versus normalized radial distance.
In the femoral neck area, the relative density of spongy tissue changed from about 0.27 at the center of the bone section to about 0.48 in the most outer layer of the bone section. In the central part of the neck area of the femur bone, there is no medullary channel, resulting in continuous changes in the spongy tissue density in the cross-section of the bone. The average relative density of spongy bone was about 0.272 and 0.330 for r = 0.1 and 0.9 respectively. According to Figure 6, the changes of density in the central area of the femur bone section were slow, but its variation increases as it approaches the outermost layer of the bone.
The best fitting curve type for density changes is power form (Figure 6c), which after doing so, gives the following relationship:


where μ is averaged relative density and R is the normalized radial distance from center of bone section.
The analytical normalized elastic modulus (E* is effective elastic modulus in specific direction of unit cell and Es is elastic modulus of solid material) and relative density relations for different unit cell types are presented in Table 2. Relative density is a function of geometrical parameters
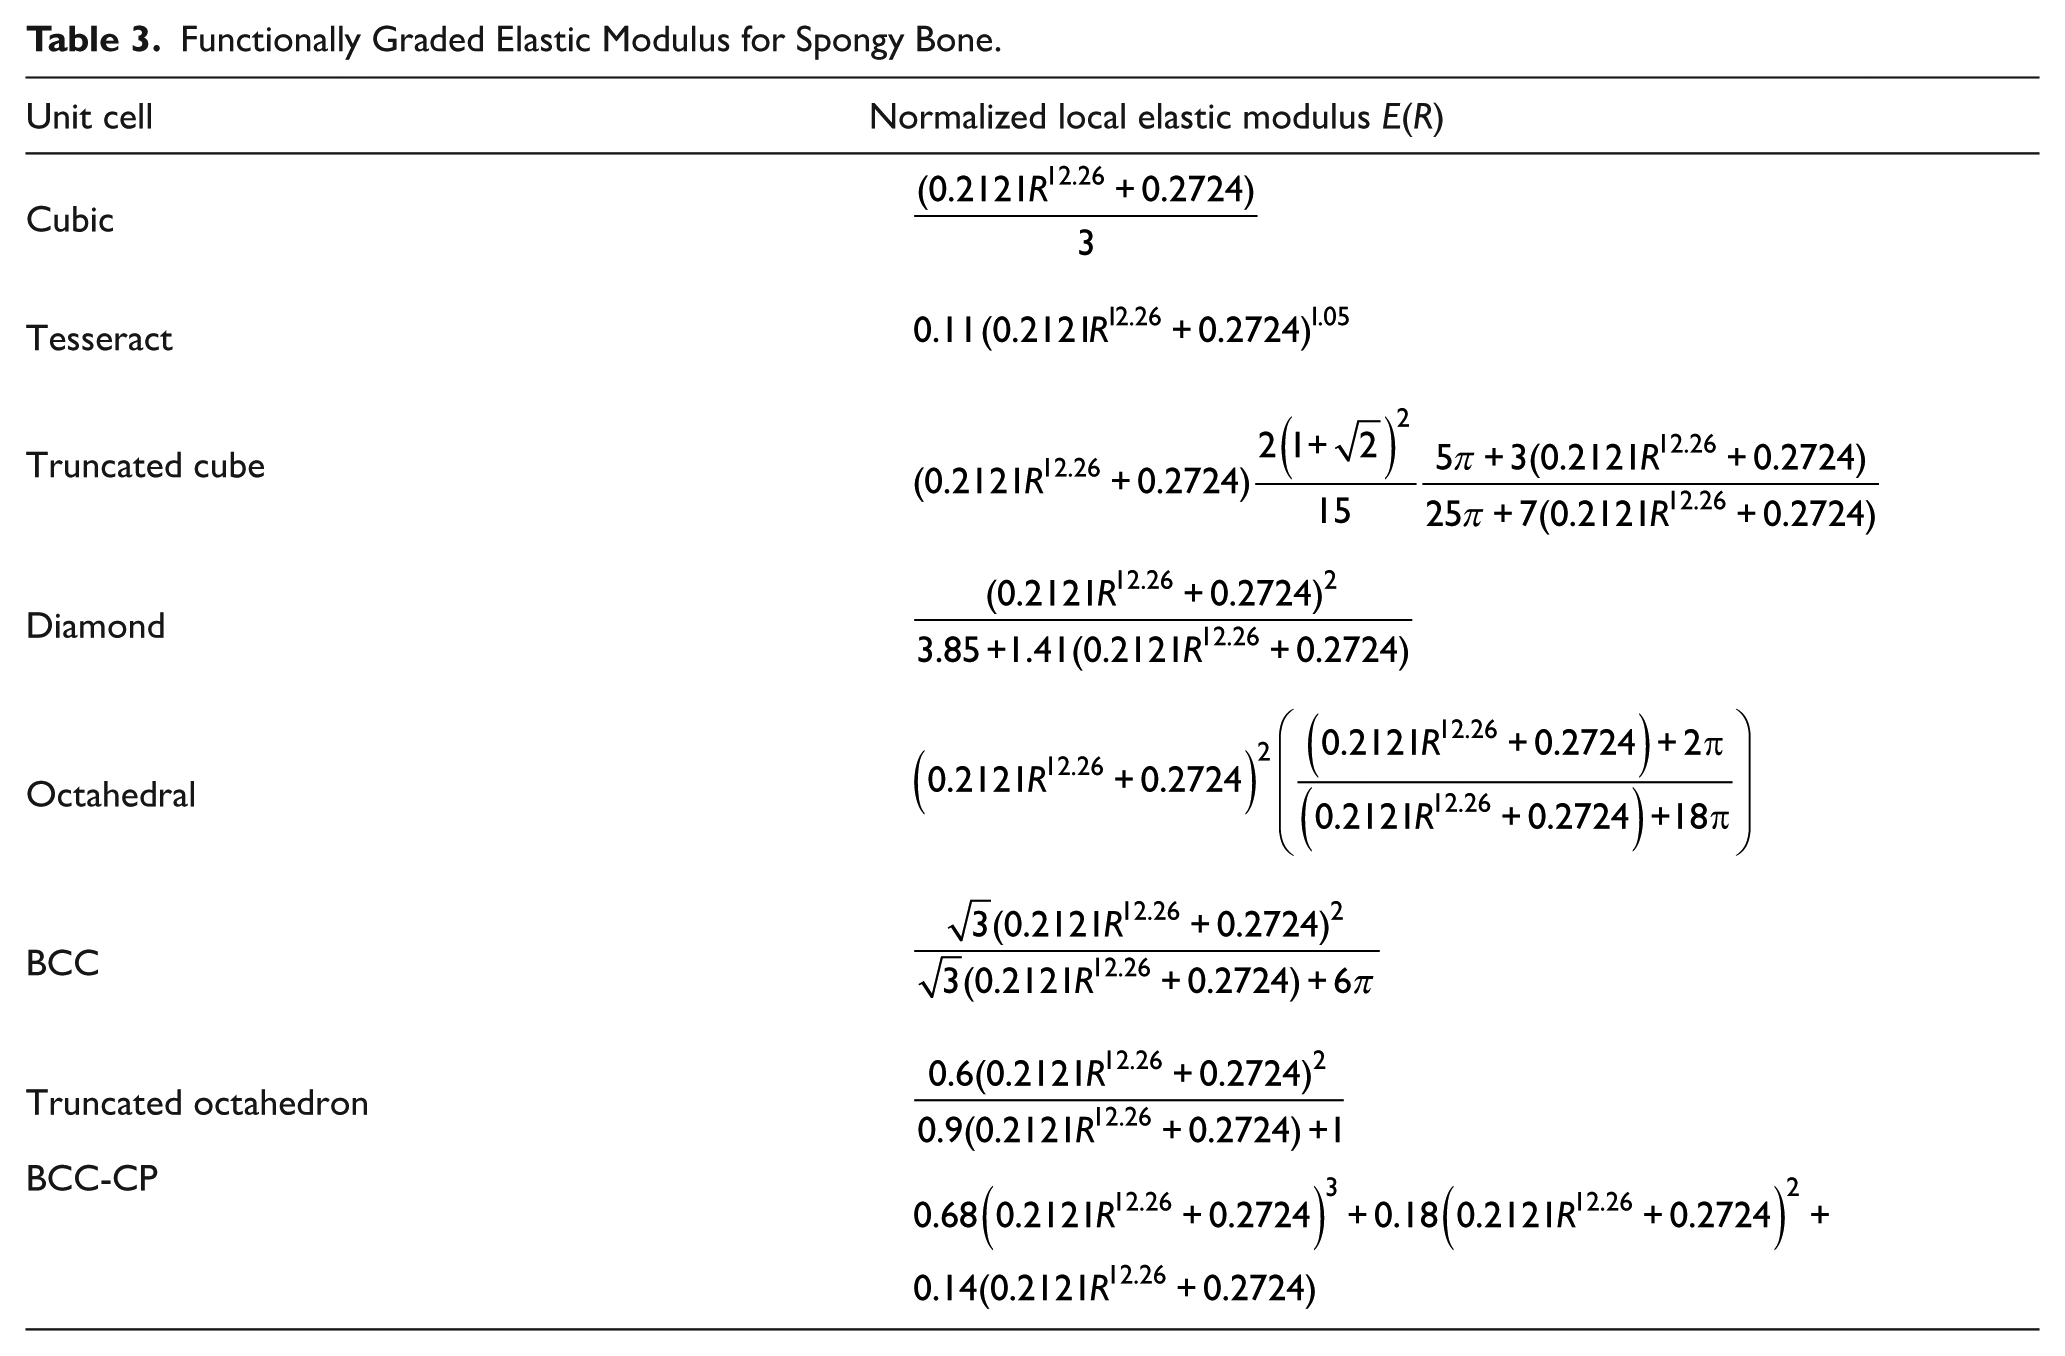
By considering spongy bone as an inhomogeneous material, and by using equation (8), Normalized local elastic modulus relationships as a function of normalized radial distance for spongy bone cross-section can be obtained and are listed in Table 3. For all unit cells, with increasing the radial distance, the density as Young’s modulus increases. For instance, Tesseract unit cell at R = 0.1 and R = 0.9, have the normalized local Young’s moduli
Functionally Graded Elastic Modulus for Spongy Bone.
As discussed in the previous section, for evaluating the averaged elastic modulus of spongy bone, 2 approaches were used: analytical solution and finite element simulation. For structure based on tesseract unit cell, an example of displacement contour obtained from the FE model is shown in Supplemental Material Figure S4. Also, in the FE method, a 10-layered cylindrical model was used for simulation, in which the value of Young’s modulus in each layer was implemented according to the analytical relationships (Table 3). Also, for the geometrical convergence study, the number of layers varied from 2 to 20 layers, and the results were compared. As is shown in Supplemental Material Figure S5, the results converge for models having at least 10 layers for the trabecular bone region. Also, for considering the element size convergency, the mesh sensitivity analysis has been carried out (Supplemental Material Figure S6). Analytical values of averaged elastic modulus were calculated by considering the spongy bone as an inhomogeneous material and using equation (7) in combination with relationships presented in Table 3.
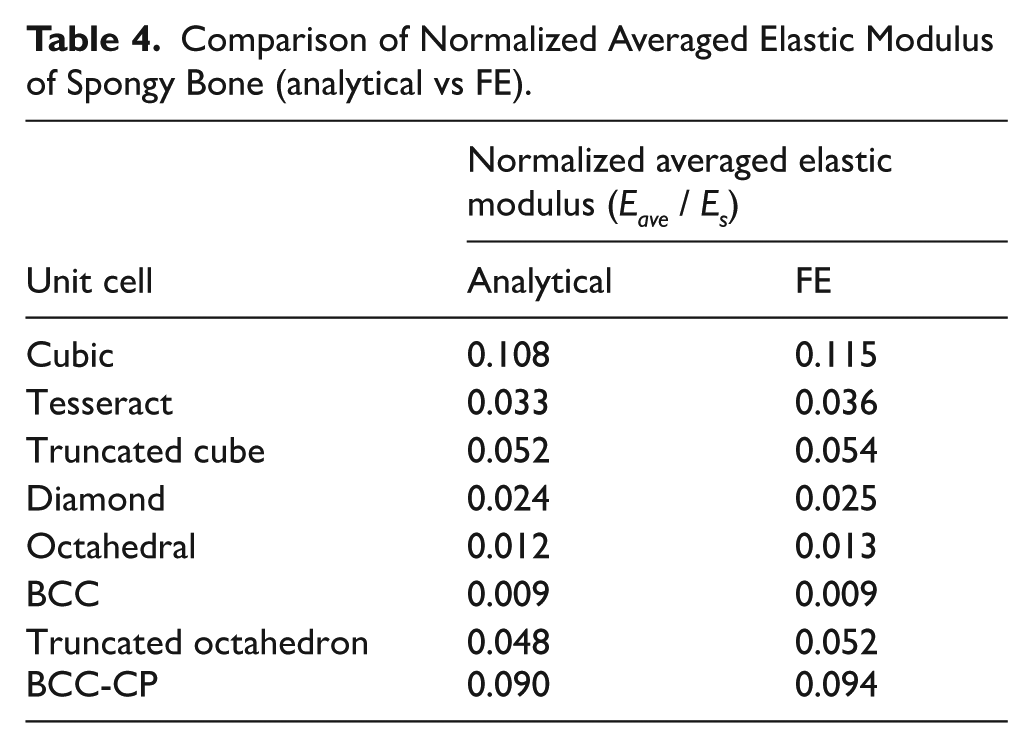
Table 4 compares the averaged elastic modulus obtained from analytical and finite element methods. In both approaches, the Cubic and BCC structures represent the maximum and minimum elastic modulus for spongy bone, respectively. According to Table 4, analytical approach in general gives lower values of elastic modulus compared to FE models.
Comparison of Normalized Averaged Elastic Modulus of Spongy Bone (analytical vs FE).
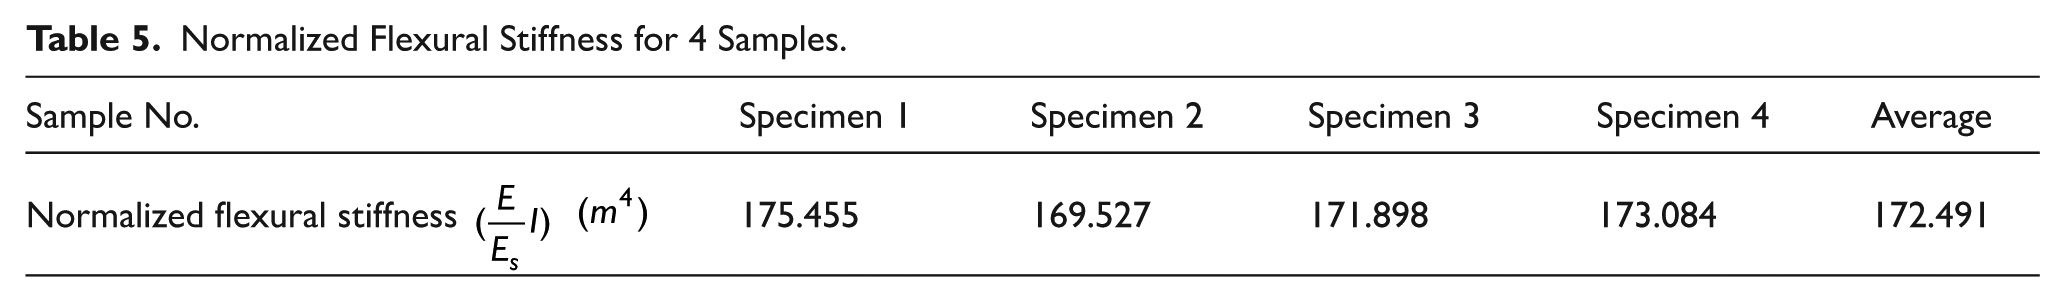
The bone samples were subjected to static loading and force versus displacement curves in the transverse (Y) and longitudinal (X) directions were extracted (Figures 5b and 7). The longitudinal loading curve (Figure 7b) mainly represents the axial compressive behavior of the bone, which, while useful for understanding general load-bearing capacity, is not directly relevant to flexural stiffness analysis. In contrast, the transverse loading curve (Figure 7a) reflects the bending response of the femoral neck region. Since bending resistance and flexural performance are desired for the femoral neck, the transverse force–displacement curves were employed for calculating the normalized flexural stiffness. Accordingly, the results reported in Table 5 were derived from the transverse response, providing a representative measure of the stiffness in physiologically relevant loading conditions. According to Figure 7a and b, at the initial stage, all samples display a nearly linear increase in force with displacement, representing the elastic response of bone tissue. With increasing displacement, the slope of the curves gradually decreases, reflecting the combined contribution of cancellous bone deformation and the onset of nonlinear behavior. The maximum recorded force ranges from approximately 5500 to 6200 N, with failure occurring at displacements between 2.3 and 2.6 mm. Although slight variations exist among the 4 curves, their overall trends are consistent, demonstrating reproducibility in the mechanical response of the femoral neck. These differences can be attributed to natural variations in the microstructure, particularly cortical thickness and cancellous density distribution, as confirmed by CT scan images. The averaged normalized stiffness obtained from the 4 specimens was 172.49 m⁴ (Table 5), which provides a representative value for the bending performance of the femoral neck.
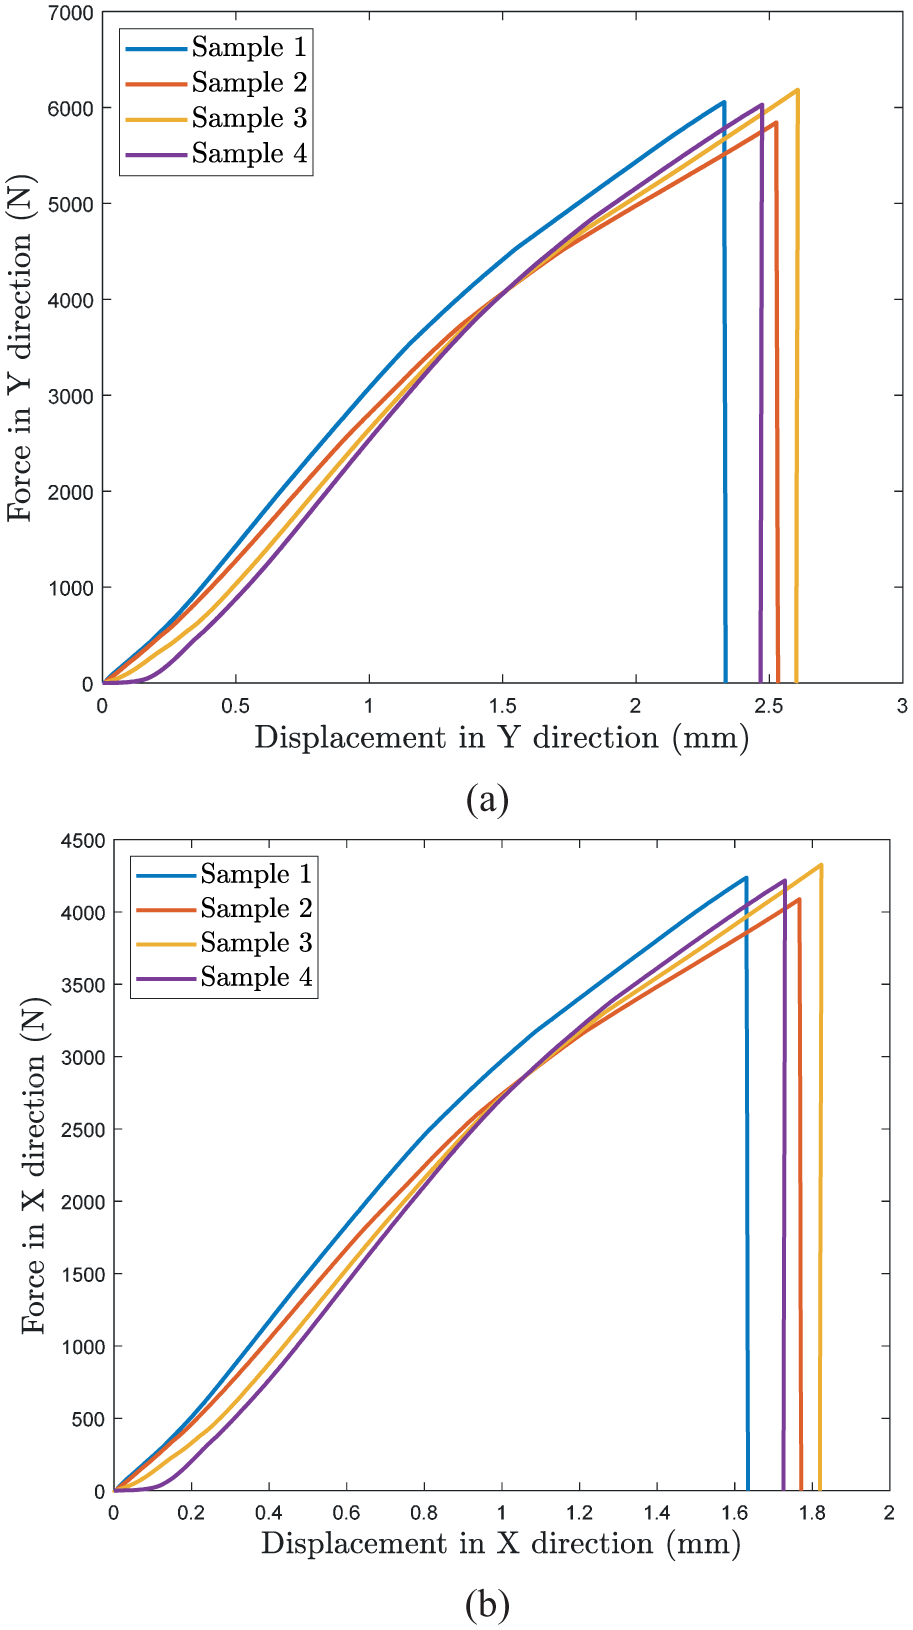
Femur neck bone force versus displacement curve for 4 samples in: (a) Y direction and (b) X direction.
Normalized Flexural Stiffness for 4 Samples.
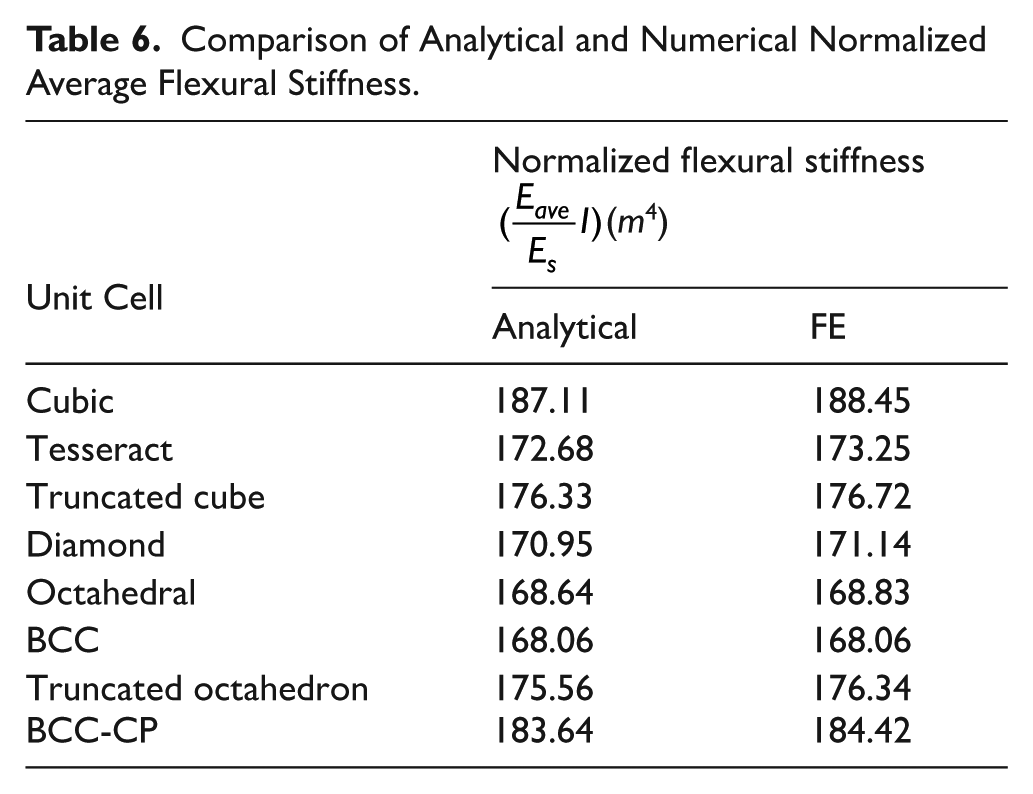
Analytical and numerical normalized average flexural stiffness values for different unit cells are presented and compared in Table 6. Cubic and BCC with
Comparison of Analytical and Numerical Normalized Average Flexural Stiffness.
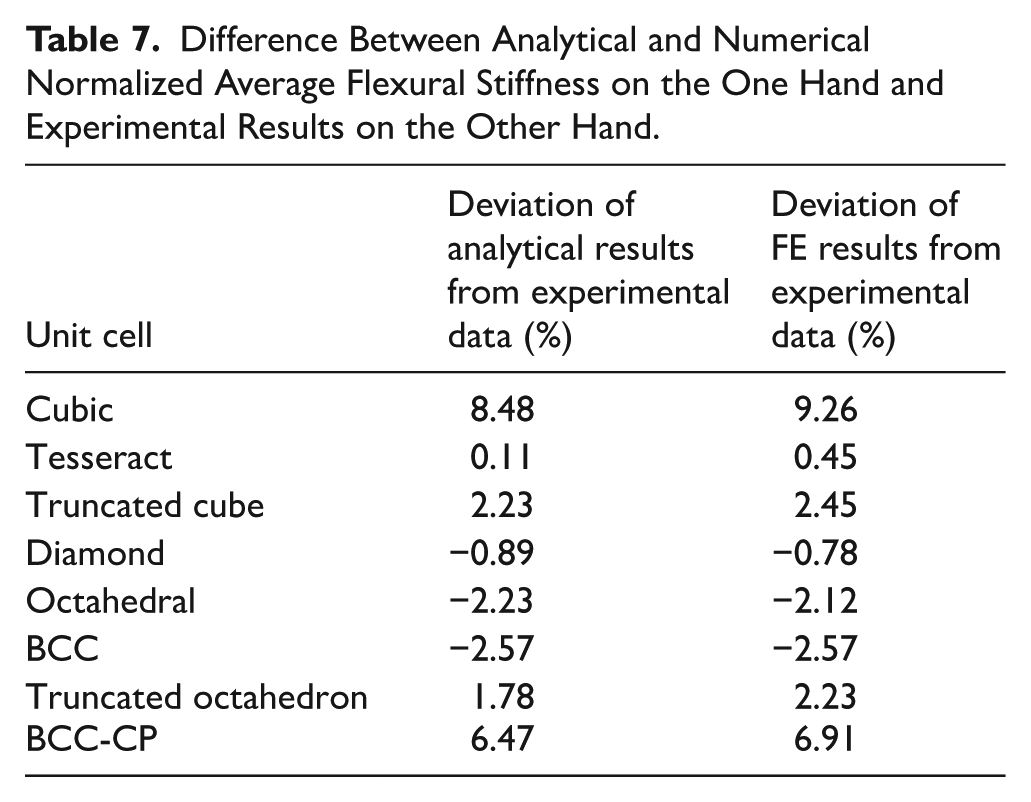
Deviation of analytical and FE results from experimental data have been calculated using results presented in Tables 5 and 6. Discrepancy between experimental on the one hand and analytical and numerical results on the other hand are presented in Table 7 (Negative values represent that the analytical/FE results have lower values than the experimental results). The Tesseract unit cell with a deviation of 0.11%, and the cubic unit cell with a deviation of 8.48% have the closest and furthest proximity to the experimental results, respectively.
Difference Between Analytical and Numerical Normalized Average Flexural Stiffness on the One Hand and Experimental Results on the Other Hand.
Discussion
In this study, the mechanical properties of spongy tissue have been investigated. The density of trabecular tissue is not homogenous in the neck region of the femur bone. Therefore, to predict the behavior of the porous structure, the bone is modeled as a functionally graded lattice (FGL). Eight different types of unit cells have been used to model the porous structure of spongy tissue. A power-law relationship for the density gradient in bone cross-section has been extracted using CT scan images, then by using the relations provided for unit cells, the normalized Young’s modulus and finally the flexural modulus have been obtained. The results have been validated using numerical simulation and by conducting an experimental test, a cell whose mechanical behavior is the most similar to the real tissue is suggested for accurate trabecular bone scaffolds.
Regular Lattice Microstructures and Similarities with Spongy Bone
Spongy bone is a network of interconnected rods that are irregularly placed together. Regular lattice structures are one of the most promising candidates for modeling porous tissues such as spongy bone due to their simplicity, ease of interpretation, and ease of investigation of the effect of varying different geometrical and material properties on the mechanical response. Many unit cell types have been known to date, which can be used to make porous structures of bone tissue. Nonetheless, it should be noted that a rationally designed porous structure, in addition to the geometric constraints, must also be mechanically compatible with the bone tissue to avoid unwanted phenomena such as stress shielding. In the present study, 8 different unit cell geometries (Table 1) were selected because they have been widely reported in the literature as suitable representations for modeling trabecular and porous structures.49,52,58,59 The choice of these specific cells allowed us to systematically compare their performance within the functionally graded lattice framework while maintaining consistency with previous biomechanical modeling approaches.
Although there are more complex lattice geometries, such as gyroid or Voronoi-based structures, which may provide a closer resemblance to the microstructure of trabecular bone, incorporating such models would require additional computational resources and advanced image-based reconstruction techniques. These aspects, while highly valuable, are beyond the scope of this study, which was focused on establishing a robust methodology for gradient-based mechanical property prediction. The gradient of microstructure for porous tissue was evaluated to have more favorable mechanical and biological properties. By considering the structural geometry (Table 1), it can be seen that tesseract is created from 2 nested cubic unit cells that are connected with inclined rods and have lower porosity with higher strength relative to other presented cells. The results (Tables 6 and 7) showed the tesseract unit cell type can be the best choice for the femur neck region in terms of density and flexural stiffness. In other regions of the body and bone types, performing a similar study seems crucial. According to Table 7, by ignoring the slight deviation of analytical/experiment results (differ by less than 5%) for unit cells (Except Cubic and BCC-CP unit cells), they can also be a good candidate for representing spongy tissue based on tissue strength.
The averaged flexural stiffness of bone section is summation of flexural stiffness of cortical tissue and spongy tissue separately. Normalized averaged elastic modulus of spongy bone and flexural stiffness of bone section (cortical and spongy stiffness) have been presented in Tables 4 and 6 respectively. Subsequently, to properly select the topology for the microstructure of the femoral neck region, the bending behavior of its entire cross-section must be evaluated, and solely evaluating the similarity of unit cell with the spongy tissue cannot be a proper criterion for selecting the right unit cell.
Comparison of Spongy Bone and Lattice Structures Relative Density
The spongy bone has a gradient within its structure geometrically so that the diameter of the rods increases especially in a radial direction and the porosity space decreases as is shown in Figure 3. Therefore, a kind of density gradient can be identified in tissue. The relative density has a direct relationship with the radial distance from the center of the bone shaft, and as radial distance increases, the relative density increases. According to the CT scan images of the bone section and the extracted curves, the porosity of the spongy tissue is the highest at the center of the bone cross-section, and as the radius increases, the porosity decreases and the cellular structure becomes a network of strong rods geometrically. According to Figure 8, among the introduced cells with the same d / l ratio, the Tesseract and the Truncated cube have the highest and lowest relative density values, respectively.
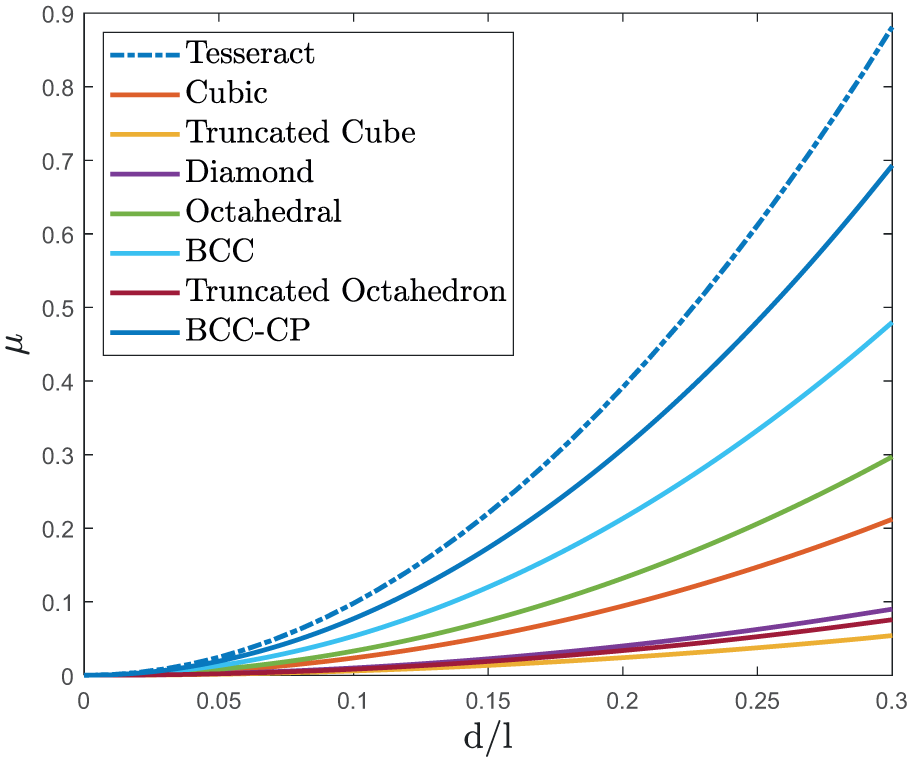
Comparison of relative density for different unit cell types.
The relative density of cancellous bone varies between 0.07 and 0.75. However, in regions where the density of bone is high (eg, at the femur neck with an apparent density close to about 0.48), the Tesseract is the best representative for spongy tissue due to its high relative density compared to other unit cells.
Deviation of Analytical and Numerical Approach with Experimental Results
The analytical relationships derived for Tesseract and Diamond unit cells give the closest flexural stiffness values to the experimental ones, and the deviations are less than 1% (Table 7). In FE method, a limited number of layers have been considered which can lead to some errors in the results. Also, in the analytical model (equations (1)-(7)), Euler-Bernoulli theory is used that can lead to differences in the results compared to the experimental results. Euler-Bernoulli theory leads to an overestimation of the Young’s modulus of bone. Since this theory does not consider the shear behavior of the beam, there is a possibility of error in the obtained results.
Physical Explanation of the Observed Results
In general, trabecular bone is evaluated from 2 perspectives: density and mechanical stiffness. Injuries to the femur bone are most often a result of fracture in the neck region due to various loading types such as impact. 66 Femoral neck is more prone to damages due to the specific geometry of femur bone in proximal section.66,67 The trabecular bone in the femoral neck region has a higher tissue density compared to other areas of the skeletal system. Additionally, the proximal femur forms the hip joint with the pelvis and is subjected to complex and varying loads. According to Wolff’s law, bone remodels itself in response to mechanical loading; therefore, this region of the femur must exhibit greater and specific mechanical strength compared to other bones in the body. Based on these findings, identifying a unit cell that closely resembles trabecular bone in terms of both density and mechanical stiffness is of great significance. Since the density of trabecular bone in the femoral neck typically ranges between 0.27 and 0.48, the tesseract unit cell, as shown in Figure 8, exhibits the highest density among the intended unit cells and can be considered a potential bone tissue substitute at an appropriate d / l ratio. Moreover, the mechanical compatibility of the unit cell with living tissue must be taken into account, as excessive stiffness may lead to stress shielding, negatively impacting the skeletal system. Conversely, insufficient strength can result in severe structural damage to the implant. According to Table 7, the tesseract unit cell demonstrates the highest analytical-experimental agreement, with a deviation of less than 0.11% from real bone properties. Ultimately, based on the observations, the tesseract unit cell is proposed as the optimal candidate for implant fabrication and bone scaffold development. Furthermore, the mathematical relationships derived from this study can be utilized in clinical research and tissue engineering applications.
Application and Future Direction
Analytical relationships for mechanical properties of regular porous structures for spongy bone have been presented in recent studies.68 -71 These relationships can be used for fabricating bone scaffolds as equivalent structures for trabecular tissue in the neck region of the femur bone. Also, additive manufacturing techniques can be used for fabricating regular lattice structures.72 -74 Recently, artificial intelligence (AI) algorithms have been implemented to enhance the design process of bone-substituting scaffolds. Analytical relationships presented in this study can be used to improve the data required for such algorithms.
In this study, the analytical modeling of the trabecular bone structure was performed under the assumption of linear elastic behavior. As detailed in Section 2.1 (Analytical solution), the primary aim was to establish position-dependent gradients in the mechanical properties of cancellous bone, particularly focusing on flexural stiffness. Nonlinear effects or damage evolution mechanisms, although highly relevant to bone failure, were not incorporated here, since their inclusion would require additional constitutive formulations and complex boundary conditions that go beyond the scope of the current framework. Nevertheless, the presented methodology provides a robust foundation for mapping density gradients into elastic property distributions, and it can be extended in future studies by integrating nonlinear constitutive models and damage evolution laws to capture the post-yield and failure responses of trabecular bone with greater accuracy.
The practical significance of the present study lies in demonstrating how functionally graded lattice structures can be employed to mimic cancellous bone tissue in the femoral neck. By identifying unit cells with mechanical responses closest to that of natural bone, the findings provide a rational basis for designing porous implants with improved biomechanical compatibility. In particular, the equivalent properties extracted from the homogenization process can serve as input for implant design strategies aimed at minimizing stress shielding and promoting favorable load transfer between implant and host bone. Specifically, this approach can be used in designing bioinspired and patient-specific implants with graded mechanical properties to reduce stress shielding, improving the predictive accuracy of finite element models for femoral fracture risk assessment, and supporting pre-clinical planning tools to assess implant performance under patient-specific loading scenarios. Beyond the biomedical field, the methodology also offers broader potential in the design of bioinspired lightweight lattice structures for aerospace, automotive, and mechanical engineering applications, where graded stiffness and energy absorption are desirable features. Overall, the outcomes of this research can provide a solid foundation for future studies focused on the optimization of lattice-based biomaterials and their translation into clinical and engineering applications.
Conclusion
This study developed a functionally graded cylindrical model of the femoral neck trabecular bone based on CT scan images, where density gradients were derived directly from image analysis. Eight unit cell types, including Cubic, Tesseract, Truncated Cube, Octahedral, Diamond, BCC, Truncated Octahedron, and BCC-CP, were evaluated to replicate the geometry and mechanical properties of trabecular bone. Among them, the Tesseract cell, owing to its nested geometry and higher number of struts, exhibited greater relative density and demonstrated the closest mechanical behavior to real trabecular tissue, with a deviation of less than 0.11%. Image analysis confirmed that the femoral neck region consists of compacted thin struts, a feature that was well reflected in the Tesseract structure at low d/l ratios. In contrast, the Cubic unit cell showed the least similarity to trabecular tissue, indicating its unsuitability for modeling dense cancellous bone. Overall, the results suggest that functionally graded lattice structures can serve as promising candidates for bone scaffold and implant design using synthetic materials such as polymers and metals, offering improved biomimicry compared to conventional models.
Supplemental Material
sj-docx-1-bec-10.1177_11795972251405128 – Supplemental material for Functionally Graded Lattice (FGL) Models for Predicting the Mechanical Properties of Femur Spongy Bone
Supplemental material, sj-docx-1-bec-10.1177_11795972251405128 for Functionally Graded Lattice (FGL) Models for Predicting the Mechanical Properties of Femur Spongy Bone by Alireza Mohammadi, Mojtaba Sadighi and Reza Hedayati in Biomedical Engineering and Computational Biology
Footnotes
Ethical Considerations
This study did not involve human participants, human data, or human tissue. The bovine femoral bone samples were used in this work. No live animals were used or sacrificed specifically for the purposes of this research. Therefore, ethical approval was not required.
Author Contributions
All authors contributed to the study conception and design. Material preparation, data collection and analysis were performed by Alireza Mohammadi, Mojtaba Sadighi and Reza Hedayati. The first draft of the manuscript was written by Alireza Mohammadi and all authors commented on previous versions of the manuscript. All authors read and approved the final manuscript.
Funding
The authors received no financial support for the research, authorship, and/or publication of this article.
Declaration of Conflicting Interests
The authors declared no potential conflicts of interest with respect to the research, authorship, and/or publication of this article.
Supplemental Material
Supplemental material for this article is available online.
References
Supplementary Material
Please find the following supplemental material available below.
For Open Access articles published under a Creative Commons License, all supplemental material carries the same license as the article it is associated with.
For non-Open Access articles published, all supplemental material carries a non-exclusive license, and permission requests for re-use of supplemental material or any part of supplemental material shall be sent directly to the copyright owner as specified in the copyright notice associated with the article.