
Abstract
Objective
We measured cerebral venous oxygenation after aneurysmal subarachnoid hemorrhage (aSAH) using quantitative susceptibility mapping (QSM) to explore its relationship with cognitive function.
Methods
Twenty participants, including 10 patients with aSAH and 10 healthy volunteers as the control group, were included. Patients with aSAH were evaluated at 2 days, 3 weeks, and 6 months after aSAH. Each participant underwent magnetic resonance imaging and completed the Montreal Cognitive Assessment (MoCA) at baseline, midpoint, and endpoint. QSM was used to determine the magnetic susceptibility of the cerebral veins. Furthermore, the relationship between MoCA and oxygen saturation in the cerebral veins was examined.
Results
The first scans of the cerebral veins and straight sinus susceptibility were considerably more significant in the aSAH group than in the healthy control group. At the 6-month follow-up, the mean oxygen saturation steadily increased in the aSAH group. Cerebral venous oxygen saturation was moderately correlated with MoCA (r = 0.5319, P = .0025).
Conclusion
QSM can be used to measure changes in cerebral venous oxygenation levels in patients with aSAH. During the acute phase of aSAH, there is a reduction in the oxygen saturation in the cerebral veins, and the shift in oxygen saturation levels may correlate with cognitive outcomes in patients with aSAH.
Introduction
Aneurysmal subarachnoid hemorrhage (aSAH) is associated with high morbidity and fatality rates. 1 According to population-based studies, 50% of patients survive. However, cognitive impairments are common sequelae of aSAH, even among patients with good-grade aSAH. 2 The mechanism remains unclear. Many patients are relatively young and have meaningful responsibilities for their families. 3 Cognitive impairments, including deficits in memory, executive function, and language, significantly affect the quality of life and become major obstacles for patients to return to society after recovery. 4 However, functional problems are often undetectable using conventional imaging. Therefore, novel approaches are required to demonstrate physiological alterations in the brain of patients with aSAH to provide information that might correlate with cognitive outcome.
Increased oxygenation of the brain is a reliable indicator of healthy cognitive processes. Therefore, a rise in oxygen demand in brain tissues or a decrease in cerebral blood flow can be indicated by a decrease in cerebral venous oxygen saturation (SvO2). Increases in oxygen saturation have been reported to improve outcomes, whereas reductions in oxygen saturation worsen outcomes in patients with acute ischemic stroke. 5 Delay in the onset of cerebral ischemia and worse functional outcomes 3 months following aSAH have also been linked to lower regional cerebral oxygen saturation. 6 Thus, monitoring the patient’s cerebral SvO2 variations may help doctors better understand the underlying pathology. Near-infrared spectroscopy to measure brain oxygen levels has expanded to many pathologies. Because of the restricted scope of spectrophotometric techniques, they have poor resolution and shallow penetration and are unreliable. 7
High-resolution three-dimensional phase-enhanced gradient echo imaging is known as susceptibility-weighted imaging (SWI). 8 Blood in the veins, bleeding, and iron overload can be detected using SWI. To estimate the quantitative oxygen saturation of cortical veins, Haacke et al developed the quantitative susceptibility matching (QSM) approach based on SWI. 9 Quantitative measurement of cerebral oxygen using QSM is still widely and effectively used in trials.10-13 Multiple disorders, including mild traumatic brain injury and acute ischemic stroke, have been studied by examining variations in regional cerebral SvO2 using QSM,14,15 as well as in intracerebral hemorrhage.16,17 The main objectives of this research were to employ QSM to compare the cerebral vein susceptibilities of patients with mild aSAH to those of age- and sex-matched healthy controls, to identify the temporal dynamics of cerebral SvO2 in these patients, and to investigate the associations between cerebral venous susceptibility and cognitive outcomes in patients with mild aSAH.
Patients and Methods
Subjects
This study was approved by the Institutional Review Board of our hospital. All participants provided written informed consent before undergoing magnetic resonance imaging (MRI). Between December 2017 and May 2018, 15 patients with aSAH were screened. The inclusion criteria were as follows: patients who were treated with clipping or coiling within 48 h of hospital admission; those who were included within 72 h of the beginning of aSAH; those who had a World Federation of Neurological Surgeons (WFNS) grade 1 or 2 18 ; and those who were cooperative throughout the Montreal Cognitive Assessment (MoCA) examination. 19 The exclusion criteria were as follows: patients with WFNS grades 3-5 or anyone who could not cooperate with the cognition assessment; digital subtraction angiography revealed no aneurysm; complications occurred, such as rebleeding, delayed cerebral ischemia, and hydrocephalus; the computed tomography scan indicated a modified Fisher scale value of >1 or the image quality was inadequate for observation or analysis because of motion artifact; those who did not meet the inclusion and exclusion criteria. Finally, 10 patients with aSAH were recruited (six men and four women), with a mean age of 53 ± 12 years, and 10 volunteers from our hospital’s outpatient department (six men and four women), with a mean age of 56 ± 8 years, served as the healthy control group.
The patients’ performance on the MoCA was evaluated. Each patient underwent MRI and MoCA measurements at the following timepoints: within the first 2 days after aSAH; 3 weeks after aSAH; and 6 months after aSAH.
MRI
On a 3.0-T MRI scanner (Siemens 3.0T) with an eight-channel head coil, all MR images were obtained. After collecting conventional axial T1WI and T2WI images to rule out any possible aberrant individuals, a high-resolution 3D flow-compensated SWI sequence was used to rebuild magnitude and phase images. The T1WI specifications were as follows: TR/TE = 250/2.46 ms; number of slices = 21; voxel resolution = 0.9 × 0.8 × 5 mm3; field of view = 240 × 100 mm; receiver bandwidth = 330 Hz/pixel; total acquisition time = 66 s; flip angle = 70°; 1 acquisition. The T2WI specifications were as follows: voxel resolution = 0.7 × 0.7 × 4 mm3; TR/TE = 6000/93 ms; number of slices = 25; field of view = 220 × 100 mm; flip angle = 120°; receiver bandwidth = 220 Hz/pixel; 1 acquisition; and total acquisition time = 68 s. SWI had the following specifications: voxel resolution of 0.5 × 0.5 × 2 mm3; TR/TE = 27/20 ms; 56 slices; field of view of 230 × 200 mm; receiver bandwidth of 120 Hz/pixel; flip angle of 15°; 1 acquisition; and total acquisition time of 179 s.
Data Analysis
Susceptibility Mapping and Phase Artifacts Removal Toolbox (Detroit, Michigan, USA) was used to recreate the QSM data. We mostly replicated Xia’s processing procedures. 15 The phase images acquired using the SWI sequence had previously been treated using a 96 × 96 homodyne high-pass filter. Therefore, no further filtering was required to minimize the background phase (because this investigation was retrospective, the raw unfiltered phase images were not accessible). 20 A high-resolution QSM depicting the cerebral venous architecture was produced because of these postprocessing procedures. 9 Because of these postprocessing procedures, a high-resolution QSM is produced, which displays the cerebral venous architecture.
The QSM data were analyzed using signal processing in nuclear magnetic resonance (SPIN) (Detroit, Michigan, USA). From the QSM data, the vulnerability of the cerebral veins following aSAH in both hemispheres could be directly computed. Maximum intensity projection (MIP) pictures were used to calculate susceptibility values. To ensure that most cerebral veins were captured without the skull or sinus cavities (and hence without air/tissue interface aberrations), all images from the midbrain level to the highest level of the brain were included. Cortical, thalamic, basal, internal cerebral, septal, and straight sinus regions of interest (ROIs) were delineated in all images of patients with aSAH and healthy controls. The entire cerebral hemisphere was included in the ROIs created for the cortical veins. As shown in Figure 1, the zones of interest for additional cerebral veins were drawn to be as contiguous to the veins as possible and to include the full distributional range of the veins. The subarachnoid space was kept clear while sketching the main veins. The QSM data were properly thresholded (90 ppb) to bring out the cerebral veins while eliminating the bulk of the surrounding tissue. The average and standard deviation of vulnerability in the cerebral veins were determined. Illustration of vein selection in a patient using QSM. (A) Displays the volume of cortical (red lines), septal (orange lines), thalamostriate (yellow lines), and internal cerebral veins (green lines) that were of interest for the assessment of susceptibility value in MIP QSM images. (B) Shows the volume of the basal veins (green lines) and straight sinus (cyan lines).
SWI-filtered phase pictures depict regional oxygen saturation and may be used to directly measure susceptibility from the vasculature.
5
Using the QSM data, we found that the bulk susceptibility difference, Δχ, across tissues may be used to calculate oxygen saturation (Y) in the veins. Saturation levels in the blood are associated with the susceptibility difference, which is expressed as follows:

Y indicates oxygen saturation. It has been reported that the average oxygen saturation level Y is 0.55 [5]. Therefore, the difference in oxygen saturation values between the control Yc and aSAH Ya is defined as ΔYac = Yc − Ya. Using these equations, we derived the following simplified equation:


The values of χc and χa were taken as the mean values of bilateral hemispheres in every section of the QSM data in controls and patients with aSAH.
Statistical Analysis
Statistical Package for the Social Sciences, version 22.0, was used for all statistical analyses (IBM Corp., Armonk, NY, USA). Data distribution normality was investigated for patients with aSAH and healthy controls using the Kolmogorov–Smirnov test. Furthermore, we examined the disparity in age and sex between patients with aSAH and healthy controls using the independent samples t-test and chi-square test, assuming that the data followed a normal distribution. SvO2 and vulnerability were tested for significance between patients with aSAH and healthy controls using the independent sample t-test. Pearson’s correlation was used to examine whether the variation in SvO2 of cortical veins was related to the variation in MoCA. P-values of <.05 were used to denote statistical significance.
Results
Demographical and clinical data of patients with aSAH and healthy controls. Values are mean ± standard deviation or number of patients.
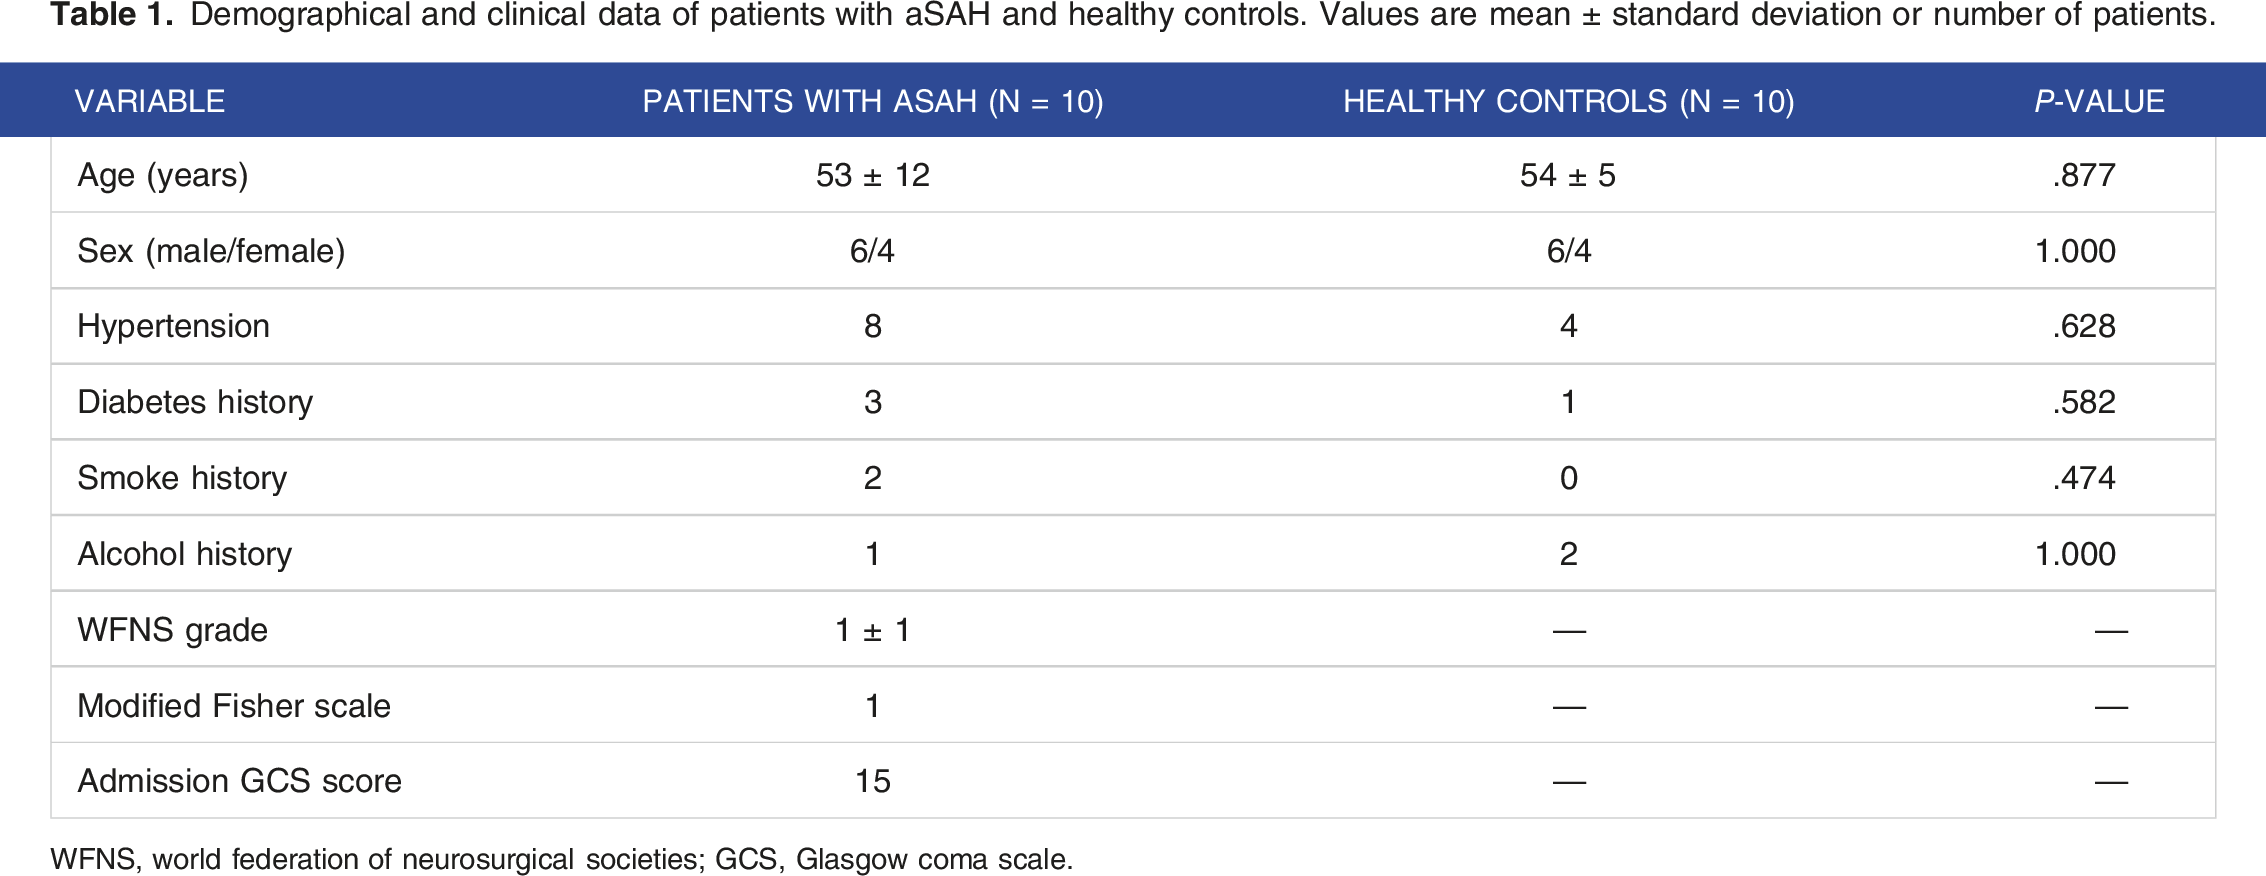
WFNS, world federation of neurosurgical societies; GCS, Glasgow coma scale.
The difference in susceptibility (ppb) of each cerebral vein among patients with aSAH and healthy controls.
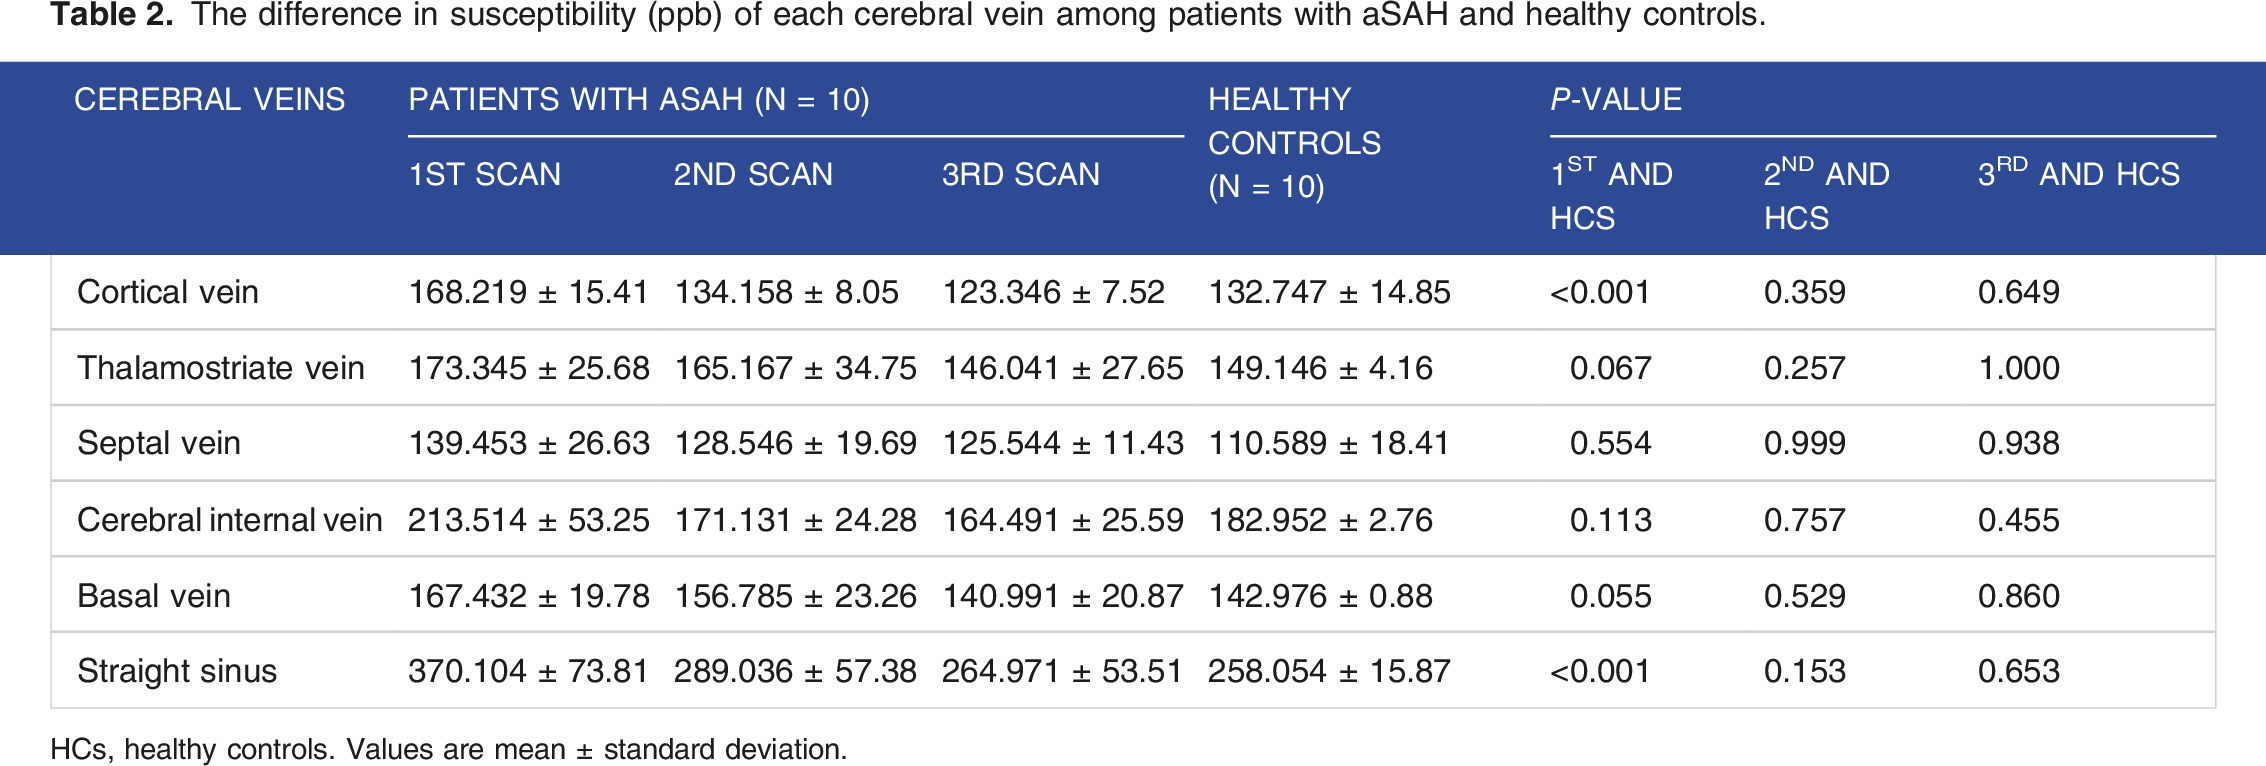
HCs, healthy controls. Values are mean ± standard deviation.
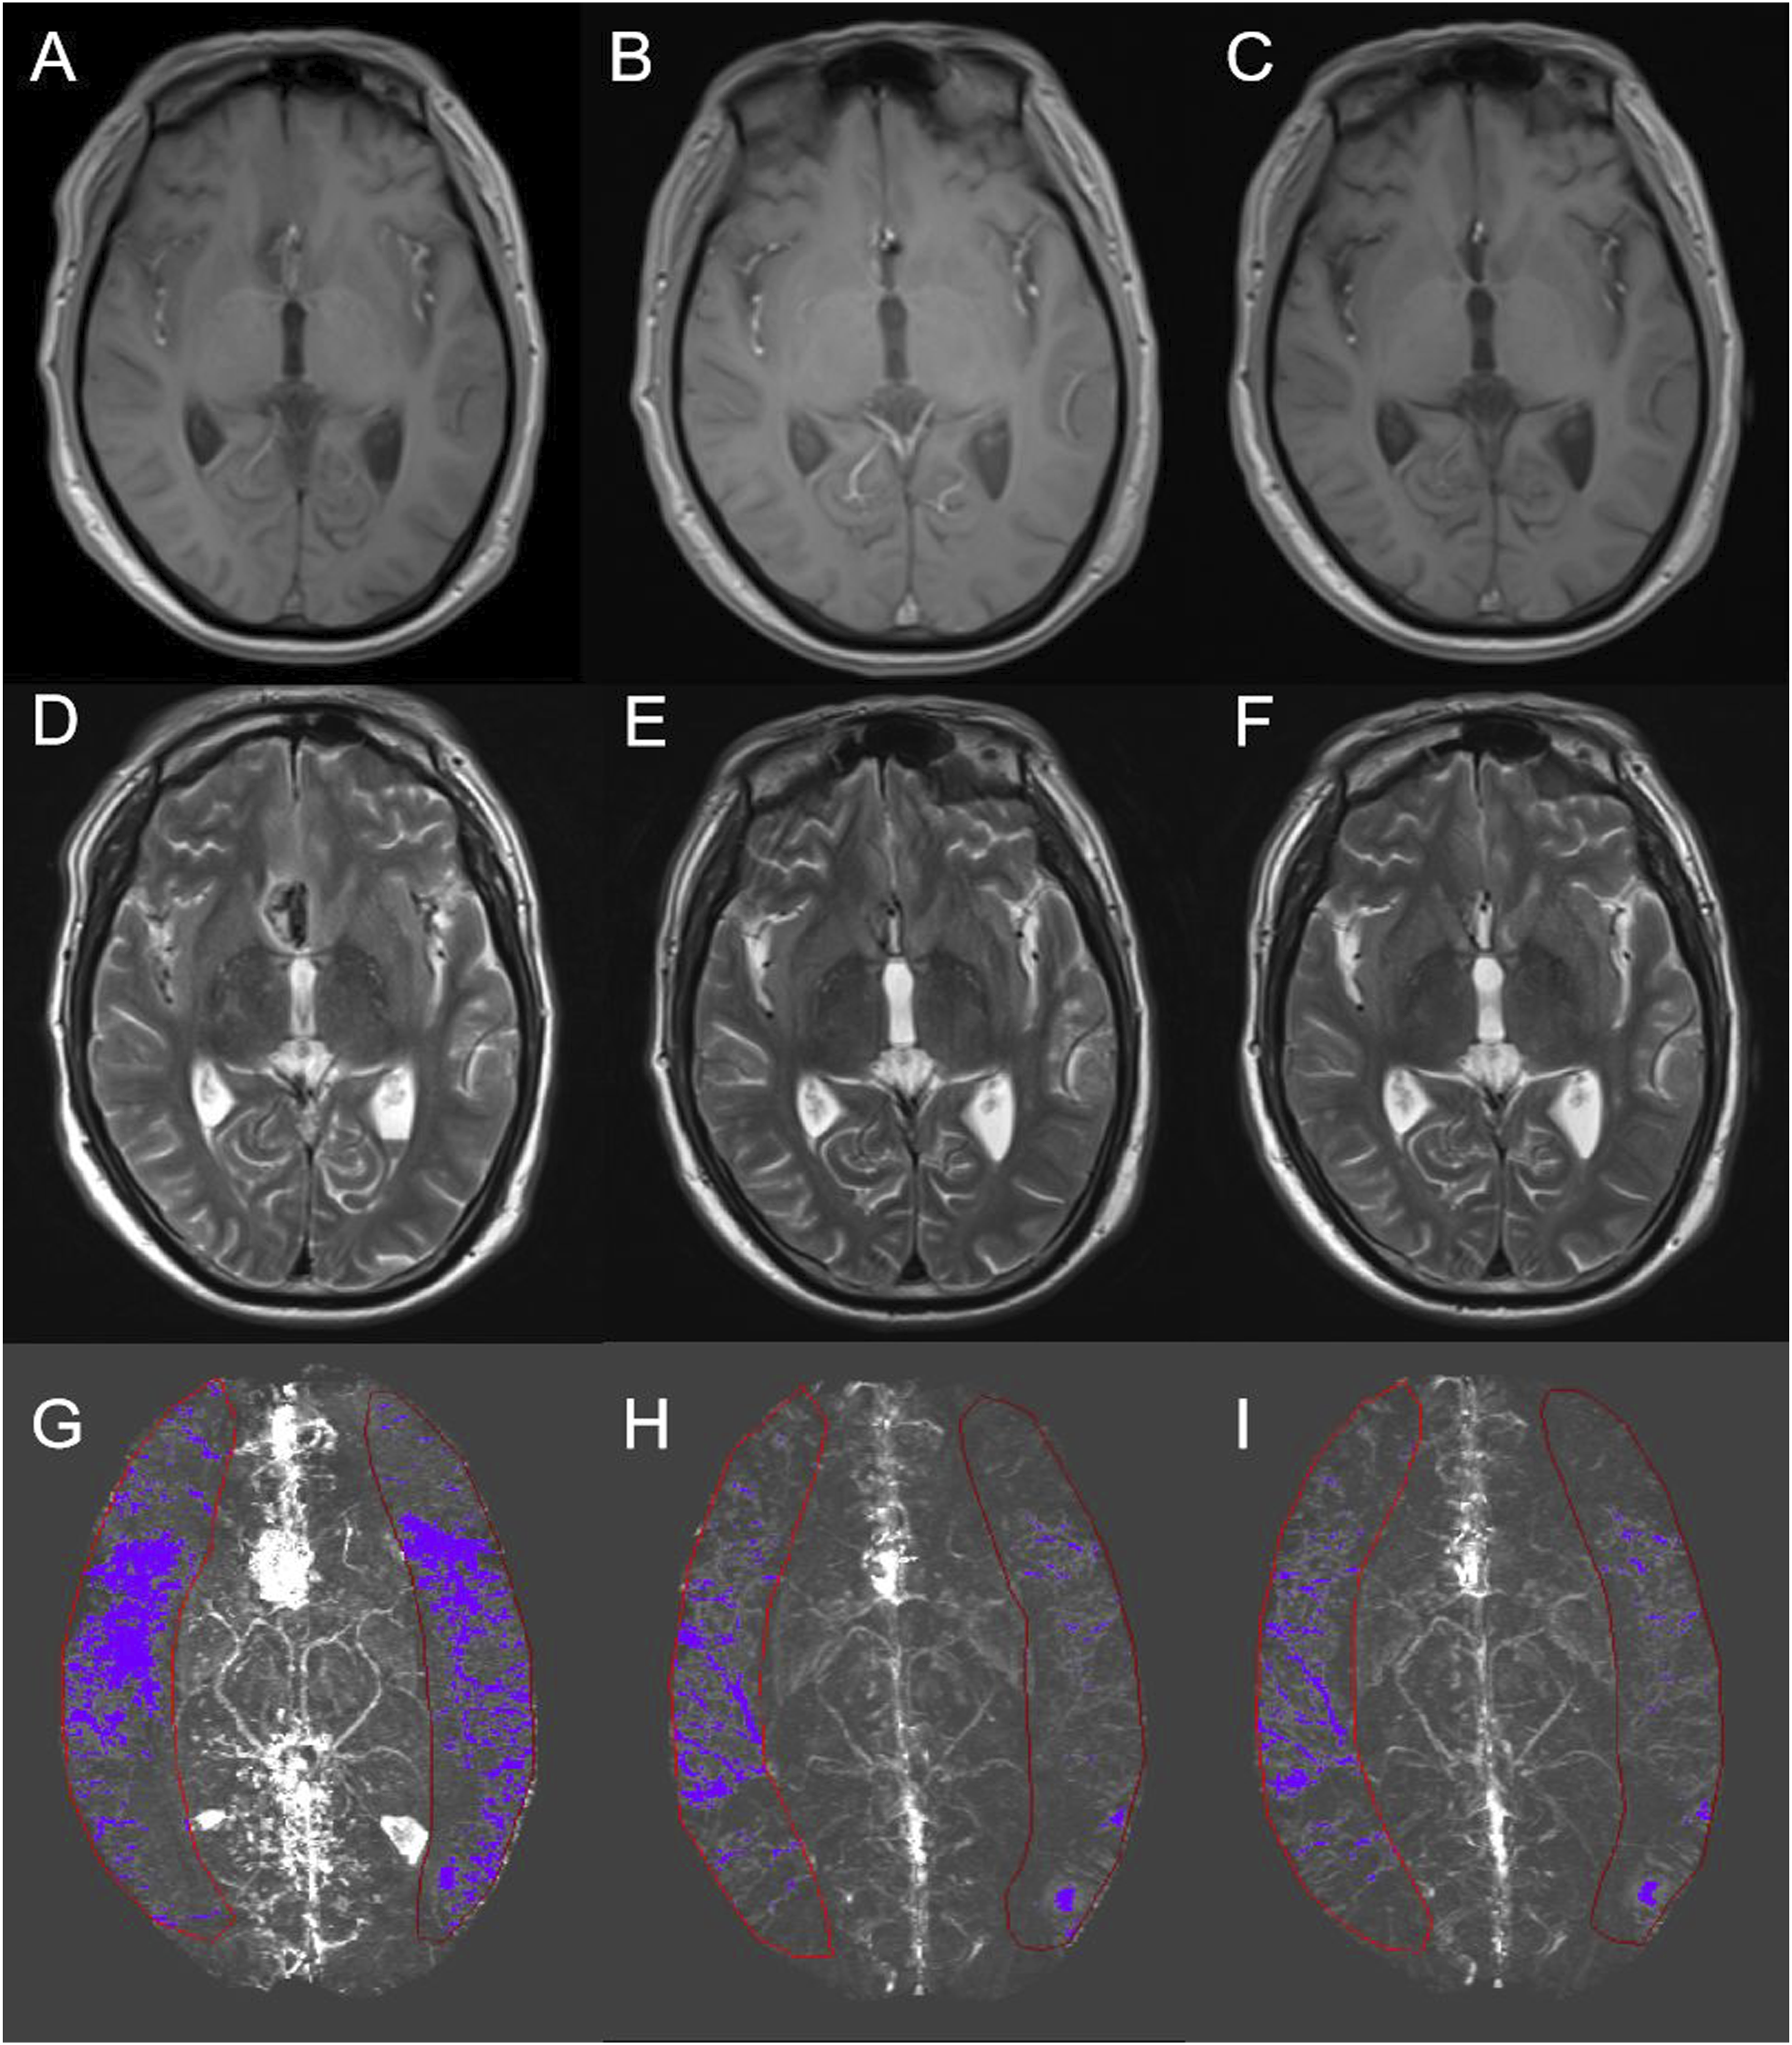
The change in MRI at the three timepoints for a patient with aSAH (Case No. 9). (A, D, G) show the T1, T2, and MIP QSM images at the first timepoint, (B, E, H) are the second timepoint, and (C, F, I) are the third timepoint. Red line regions display the cortical veins selected after the threshold was set.
List of the ten patient’s MoCA and oxygen saturation at three MRI scans.


Correlation of cortical vein oxygenation and MoCA for patients with aSAH. The correlation of SvO2 and MoCA using Pearson’s correlation analysis (r = 0.5319, P = .0025).
Discussion
This study used QSM to quantitatively assess SvO2 in patients with aSAH. Our investigation yielded three significant results. First, for the first 2 days after aSAH, the SvO2 of the cortical veins and straight sinus in patients with aSAH was dramatically decreased compared with that in healthy controls. Second, the SvO2 of patients with aSAH seemed to increase according to imaging at the three timepoints. Third, the results indicate a moderately positive correlation between the SvO2 and MoCA scores in patients with aSAH.
It has been shown in the literature that SWI, a noninvasive MRI method, can image shifts in oxygen saturation in different diseases.8,24 The diameter and visibility of the cerebral veins appeared to increase when SWI was performed on individuals with aSAH. Elevated deoxyhemoglobin levels in the veins explain this phenomenon. 25 There is a strong relationship between oxygen saturation and oxygen extraction percentage in the brain and the quantity of deoxyhemoglobin, a marker of cerebral vein oxygen saturation. 26 Reducing cerebral blood flow while maintaining the oxygen extraction fraction has been observed in the acute stage of aSAH. 27 SWI delivers better-resolution images and estimations of oxygenation changes than other perfusion technologies, such as positron emission tomography or dynamic-susceptibility contrast-enhanced MRI. 28 Therefore, the use of QSM on SWI provides a noninvasive and sensitive measurement of oxygen saturation changes in patients with aSAH.
Regarding the susceptibility of the cortical veins and straight sinus in the first scan, we only identified a significant difference between the aSAH group and healthy controls. Possible causes include the facts that the diffuse blood in the subarachnoid space during the acute phase contributes to vasospasm of the cortical vasculature and that the reduction in oxygenation of cortical veins results from brain ischemia. 29 Thus, the septal veins, thalamostriate veins, internal cerebral veins, and basal veins of the deep cerebral venous system flow mainly into the straight sinus. Furthermore, because of its relative size compared with the other deep cerebral veins, the straight sinus may have been more visibly affected by the shift in susceptibility.
In this study, the results indicate that the impact of oxygen saturation decrease mainly occurs in the acute phase, less than 2 days after the onset of aSAH, according to the normal value of 70% in healthy controls, during the first scan. This value continued to increase during follow-up, indicating a gradual improvement in oxygenation during aSAH. Decreased oxygen supply leads to cerebral anoxia and disturbance of cerebral metabolism. 30 Consequently, brain dysfunction causes cognitive impairment. 31 The trend of cerebral venous oxygen saturation improvement was in agreement with the improvement in MoCA scores among these patients. However, this improvement process takes months. Most cognitive deficits occur during the first 3 months following an aSAH 32 ; however, research has shown that some problems may last for up to 75 months or longer. 33 Based on other published studies, improving brain oxygenation throughout the disease via interventions, such as erythropoietin therapy and hyperbaric oxygen therapy, may contribute to improving cognition.34,35 Additionally, susceptibility of venous blood is highly individual-dependent. Instead, the oxygen saturation of patients could be calculated directly from the measured susceptibly of the individual described by Sawan. 36
This study has several limitations. First, the number of cases was limited as this is a pilot study, and the patients included in our study were all patients with low-grade aSAH who were undergoing cognition assessment, which may have resulted in selection bias. Second, the bias caused by deoxyhemoglobin in the subarachnoid space surrounding the cortical veins could not be eliminated thoroughly, which may affect the accuracy of the data. Finally, it is well established that our high-pass filtering approach underestimates structural susceptibilities. Future research might benefit from using more sophisticated algorithms to eliminate background fields. To determine whether these adjustments to cerebral oxygen delivery enhance patient outcomes, we intend to expand our research to include a larger sample size and establish comparison cohorts in the future.
Conclusions
In conclusion, we discovered a decrease in the oxygen saturation of the cortical veins and straight sinus in patients with mild aSAH in the acute phase using QSM. However, the SvO2 of patients with aSAH continued to recover during the 6-month follow-up. Therefore, changes in oxygen saturation levels may be related to cognitive outcomes in patients with mild aSAH.
Footnotes
Author Contributions
Declaration of Conflicting Interests
The author(s) declared no potential conflicts of interest with respect to the research, authorship, and/or publication of this article.
Funding
The author(s) disclosed receipt of the following financial support for the research, authorship, and/or publication of this article: This study was supported by the National Science Foundation of China (81541120), the Foundation to Promote the Capital Characteristic Clinical Application Research and Results (Z151100004015095), and Beijing Municipal 215 High-Level Health Professional Personnel Academic Talent Project (2015-3-062). The funders had no role in the study design, data collection, analysis, publication decision, or manuscript preparation.
Ethical Statement
Data Availability Statement
Data will be provided upon request by the authors.