
Abstract
Background
Parkinson’s Disease (PD) varies widely among individuals, and Artificial Intelligence (AI) has recently helped to identify three disease progression subtypes. While their clinical features are already known, their gene expression profiles remain unexplored.
Objectives
The objectives of this study were (1) to describe the transcriptomics characteristics of three PD progression subtypes identified by AI, and (2) to evaluate if gene expression data can be used to predict disease subtype at baseline.
Design
This is a retrospective longitudinal cohort study utilizing the Parkinson’s Progression Markers Initiative (PPMI) database.
Methods
Whole blood RNA-Sequencing data underwent differential gene expression analysis, followed by multiple pathway analyses. A Machine Learning (ML) classifier, namely XGBoost, was trained using data from multiple modalities, including gene expression values.
Results
Our study identified differentially expressed genes (DEGs) that were uniquely associated with Parkinson’s disease (PD) progression subtypes. Importantly, these DEGs had not been previously linked to PD. Gene-pathway analysis revealed both distinct and shared characteristics between the subtypes. Notably, two subtypes displayed opposite expression patterns for pathways involved in immune response alterations. In contrast, the third subtype exhibited a more unique profile characterized by increased expression of genes related to detoxification processes. All three subtypes showed a significant modulation of pathways related to the regulation of gene expression, metabolism, and cell signaling. ML revealed that the progression subtype with the worst prognosis can be predicted at baseline with 0.877 AUROC, yet the contribution of gene expression was marginal for the prediction of the subtypes.
Conclusion
This study provides novel information regarding the transcriptomics profiles of PD progression subtypes, which may foster precision medicine with relevant indications for a finer-grained diagnosis and prognosis.
Introduction
Parkinson’s Disease (PD), the prevailing neurodegenerative movement disorder, is experiencing a faster rise in prevalence than other neurological disorders over the last years.1,2 The primary pathological feature is the accumulation of misfolded, aggregated α-synuclein in the substantia nigra and other brain regions, which contributes to movement disorders like bradykinesia in combination with either rest tremor, rigidity, or both.3,4
PD is a heterogeneous condition, with variations in clinical features, symptoms, and rate of progression. 5 This variability has prompted a number of studies investigating the existence of PD subtypes. To this extent, PD is a well-suited model for precision medicine which, taking individual variability into account, emphasizes fine-grained diagnostics to enhance treatment effectivenes. 6 One of the challenges in PD research is to assign each affected individual to a specific disease cluster, in order to find phenotypic subgroups that may have a particularly good response to specific treatments. 3
While the majority of research concerning data-driven clustering in PD has centred on disease subtyping using baseline cross-sectional data, mounting evidence suggests that PD has a highly heterogeneous progression.7,8 Therefore, any static subtype defined at the baseline may not well account for disease progression patterns. Accordingly, PD subtypes instability is particularly pronounced in the early stages of the disease9,10 and advanced PD patients exhibit many clinical similarities despite early-stage heterogeneity.11,12 The hypothesis of heterogeneous progression in PD found further support in a 2021 study, where a predictive model found that patients show non-sequential, overlapping disease progression trajectories over eight distinct disease states, finally suggesting that static subtype assignment might be ineffective at capturing the full spectrum of PD progression. 8
Recently, α-synuclein Seed Amplification Assays (SAA) was identified as a promising biomarker for the biochemical diagnosis of PD, 13 yet this necessitates a cerebrospinal fluid (CSF) sample to be detected, which might not always be readily available. Conversely, peripheral blood is a more accessible sample type and can be subjected to molecular-level analysis, which could provide further details on biomarkers for a finer-grained diagnosis. The identification of disease subtypes in such a complex disease is pivotal to advance therapeutics, 14 and RNA-Seq allows for a broad scope view of the biochemical landscape of a specific phenotype. 15
Research on PD blood transcriptomics is consistently highlighting the association of inflammatory pathways, oxidative stress, and mitochondrial processes with the disease,15,16 also demonstrating that immune cell subtypes play a role in its transcriptomic changes. 17 Nonetheless, it was noted that RNA-Seq data is often ignored in Machine Learning (ML) studies of PD, 18 meaning that the potential of this data source remains to be fully exploited.
Efforts in PD progression subtyping research focus on detecting distinct classes of patients based on unique progression patterns, emphasizing the importance of incorporating time as a dimension. Artificial Intelligence (AI) algorithms play a crucial role in managing the complexity of time series data, enhancing result reliability, and enabling hypothesis-free experiments.
A pivotal study for PD subtyping employed clustering analysis at baseline and performed a longitudinal evaluation, but it was based on cross-sectional data analysis, thus overlooking the temporal dimension. 5 The most recent attempt in 2022 introduced an intriguing approach, combining NMF-reduced PD representations with Gaussian Mixture Model clustering; however, it lacked a clear temporal framework, resulting in non-overlapping clusters for patients at the latest time point. 19 Contrastingly, a 2019 study by Zhang et al harnessed a Long Short Term Memory (LSTM) model to identify three PD progression subtypes. 20 LSTM is an AI architecture specifically designed to handle sequential data, such as time series. 21 The analysis of comprehensive clinical and biological data resulted in the identification of three distinct subtypes: in brief, subtype I (S1) starts with mild motor and non-motor symptoms, and motor impairment increases with a moderate rate over time; subtype II (S2) has moderate motor and non-motor symptoms at baseline, with a slow progression rate; subtype III (S3) has significant motor and non-motor symptoms at baseline, and its impairment progresses rapidly over time, thus accounting for a worse prognosis. 20 An improved iteration of this approach, using an LSTM coupled with a Deep Progression Embedding (DPE) model, was shared as a preprint in 2021, aligning with earlier findings but awaiting peer-review. 22 Other authors developed their own algorithm for the identification of progression subtypes, 23 but the heterogeneity in the results dependent on the features selected for analysis, and unavailability of clustered subject IDs, made us prone to focusing on PD progression subtypes identified in 20 .
The transcriptional profiles of PD subtypes with distinct progression (rapid vs slow) profiles were compared using classical statistical techniques and microarray technology, and more than 200 differentially expressed genes were found. 24 More recently, multivariate data analysis with AI techniques is allowing for the identification of data-driven subtypes of PD, 20 and although PD subtypes with distinctive progression phenotypes have been identified, their transcriptomics profiles remain unexplored. In fact, to the best of our knowledge, the transcriptomics characteristics of PD progression subtypes have never been taken into account in a multivariate analysis of longitudinal data using AI methods.
The present study has two main objectives: (1) to describe the transcriptomics profile of PD progression subtypes, and (2) to subsequently evaluate the usefulness of gene expression data in predicting disease subtype at baseline. The present paper aims to reveal the biological characteristics of disease progression subtypes. We expect to find partially distinct characteristics of gene expression, which should account for the separate identity of the disease subtypes. The identification of unique transcriptomic traits associated with the subtypes may foster precision medicine in PD, with relevant indications for a finer-grained diagnosis and prognosis. Finally, we make available comprehensive results tables and code scripts, fostering the formulation of hypotheses for further experiments on PD subtypes.
Methods
Workflow overview
Data from the PPMI database were used for both of the objectives of this study: (1) to identify the transcriptomics characteristics of the disease progression subtypes, and (2) to train the ML model aimed at evaluating the usefulness of gene expression data in predicting disease subtypes at baseline. First, data were gathered and the cohort of study was defined, as described in subsection 2.2. RNA-Seq data were preprocessed (subsection 2.3) and then a differential expression analysis was performed as described in subsection 2.4 The resulting DEGs were further analyzed through pathway analyses, as described in subsection 2.5 Following cohort definition, the ML classifier was trained to predict the cluster at baseline, as described in subsection 2.6, then its behaviour was investigated using XAI methods (subsection 2.7). The research workflow is schematized in Figure 1. The R code used to perform data analysis can be found on GitHub (https://github.com/217c/parkinson_subtypes_rnaseq). Schematic diagram outlining the analysis workflow.
Data
Data used in this study were obtained from the Parkinson Progression Marker Initiative (PPMI). 44 PPMI is one of the most important ongoing studies of PD progression markers, collecting data from multiple international sources and focusing on a diverse range of potential markers for tracking the progression of PD, including demographics, clinical variables, imaging data, cerebrospinal fluid, blood, DNA and, importantly to this study, RNA measures. The data were downloaded from the LONI Image and Data Archive (IDA) in April 2022. The cohort of study was defined using the PPMI Consensus Committee Analytic Dataset (RD: 2021-10-28). PPMI inclusion criteria for PD subjects include: age ≥30, Parkinson’s disease diagnosis within the last 2 years, baseline Hoehn and Yahr Stage I–II, and no anticipated need for symptomatic treatment within 6 months of baseline. 25 Healthy controls (HC) inclusion criteria will include individuals without clinical signs suggestive of parkinsonism, no evidence of cognitive impairment, and no first-degree relative diagnosed with PD. To be included in this study cohort, subjects must have had a diagnosis of sporadic PD and available RNA-Seq data for multiple timepoints, as found in the LongRNA Transcriptome Sequencing of PPMI Samples (B38) study (RD: 2021-0402). The PPMI RNA Sequencing Project has generated overview transcriptomics data from raw sequencing reads of PPMI whole blood samples. The data were pre-analyzed and quality controlled from the PPMI group. 26
The definition of the sample for this study follows that described in 20. Subjects that underwent disease progression subtyping were included, along with all available HC subjects. In brief, S1 starts with mild motor and non-motor symptoms, and motor impairment increases with a moderate rate over time; S2 has moderate motor and non-motor symptoms at baseline, with a slow progression rate; S3 has significant motor and non-motor deficits at baseline, and its impairment progresses rapidly over time, thus accounting for a worse prognosis. The IDs of the subjects assigned to disease progression subtypes were retrieved from. 20 To summarize, data analysis was performed on those subjects that had RNA-Seq data available and that were clustered into one PD subtype. This study cohort included a total number of 2085 RNA-Seq records for 4 years of longitudinal measures (starting from baseline, with constant time interval measures at 12 months) from 600 subjects (PD = 407, HC = 193) (S1 = 199; S2 = 52; S3 = 156), ready for the data preparation steps including outliers check and sex incompatibility check.
RNA-seq data preparation
To assess outliers, a Principal Component Analysis (PCA) was computed on variance stabilized and transformed (namely, vst from DESeq2) expression data of the top 20000 genes, and data points lying beyond the edges of the Highest Density Interval of the first principal component were deemed as outliers. The threshold was set to 0.99, thus considering as outliers all observations outside the 99% Confidence Interval (CI). 27 A sex incompatibility check was performed to assess contamination due to abnormal transcription using t-SNE and DBSCAN on gene expression data from the following sex chromosome genes: USP9Y, XIST, RPS4Y1, RPS4Y2, KDM5D, DDX3Y. Subjects whose samples had inconsistent clustering between sex in metadata and sex from expression data were removed from the analysis (Supplemental Figure 1).
Differential expression analysis
Differentially expressed genes (DEGs) were identified using
Gene names and descriptions were retrieved using
Pathway analysis
To further investigate the differences in gene expression we performed a pathway analysis using
Machine learning model for subtype prediction at baseline
Data collected at the time of diagnosis (baseline) was used to predict the cluster, using a hierarchical machine learning approach. In this approach, we train multiple classifiers in a hierarchical structure, where each classifier is responsible for a specific task. This approach is useful here because the classification task can be broken down into simpler sub-tasks. As cluster 3 showed to be the most severe, the first step was to predict if the newly diagnosed PD subject belonged to S3. If not, the second step aimed to predict whether the subject was from S1 or S2 (Figure 2). The node near the root holded a classifier that was designed to discriminate between the most severe (S3) and the least severe (S1/2) phenotypes. The node at the leaf was then designed to distinguish between the least severe phenotypes (S1 vs S2). Schematic representation of the flow of the Hierarchical ML approach.
The hierarchical structure graph reported in Figure 2 represents the ideal workflow to follow in potential clinical use, and it is not intended to represent dependence between the models. The models were trained separately and tested independently, in order to use all of the available data and aiming to evaluate the usefulness of gene expression data in discriminating between the most and least severe phenotypes (S3 vs S1/2), and then in discriminating between the two least severe phenotypes (S1 vs S2). Ideally, a subject is evaluated by the first model in the hierarchy, which aims to identify subjects from S3. If a subject would be classified as S3, the pipeline would end. Otherwise, the subject would be evaluated by the second model, which aims to discriminate between S2 and S1.
Number of observations in train and test splits.

Full list of variables used for machine learning.

Variable importance and XAI
The importance of variables in contributing to the Machine Learning prediction of subtype at baseline was investigated using SHAP (SHapley Additive exPlanations) values.
36
As an XAI method,
37
SHAP values highlight the contribution of each feature to the final prediction, thus providing a measure to rank features importance. To calculate SHAP values and produce informative plots,
Results
The data preparation process focused on determining which subjects included in the present study (thus meeting the inclusion criterion of having available RNA data) had been clustered into a disease progression subtypes by. 20 Out of the initial 466 PD subjects with assigned subtypes (S1 = 201; S2 = 107; S3 = 158), a total of 407 PD subjects had RNA-Seq data available (S1 = 199; S2 = 52; S3 = 156), and were included in downstream analyses. Outliers’ detection identified 19 records as outliers, and nine subjects showed sex inconsistencies (Supplemental Figure 1). After their removal, the final dataset comprised 2057 samples from 598 participants.
Finally, 58,780 genes were available for the analysis.
Differentially expressed genes (DEGs)
Differential expression analysis was conducted to assess changes in gene expression attributable to the progression of the disease over a span of 4 years, thereby incorporating longitudinal measurements for a time course experiment analysis. In particular, each one of the three subtypes was compared to the HC group.
60 DEGs were found for S1 (41 up, 19 down), 34 for S2 (15 up, 19 down), and 32 for S3 (27 up, 5 down). The most part of these DEGs were distinctive of the subtypes, with just six of these DEGs found as shared between two or more subtypes (Figure 3). A list of DEGs with gene names and descriptions, along with the complete results tables from the differential expression analysis, can be found in Supplemental Table 1. Venn diagram of DEGs for each subtype.
Over representation analysis (ORA)
In order to understand the biological pathways associated with the DEGs, ORA was performed on Gene Ontology (GO), Kyoto Encyclopedia of Genes and Genomes (KEGG), and WikiPathways databases.
Almost all of the resulting pathway terms were distinctive of the subtypes, with very few terms in common among them (Figure 4). Venn diagram of GO (A), KEGG (B), and WikiPathways (C) terms for each subtype from the ORA.
Overall, significant pathways for S1 concurrently indicated a modulation of cellular energy metabolism, pointing to mitochondrial dysfunction, along with gene expression regulation, and stress response pathways. Moreover, the presence of pathways like Parkinson’s disease (hsa05012, q-value: 1.85 × 10⁻⁵) and Alzheimer disease (hsa05010, q-value: 2.83 × 10⁻³) highlighted a significant involvement of S1 DEGs in neurological diseases and neurodegeneration.
The significantly enriched pathways for S2 mainly pointed to regulation of gene expression and modulation of metabolic processes, including several terms associated with RNA metabolism and processing.
The ORA analysis for S3 primarily identified pathways related to oxidative stress response and detoxification, along with response to reactive oxygen species and hydrogen peroxide metabolism. Another main theme in S3 pathways from ORA was the modulation of cellular signaling and metabolism, including apoptosis.
For an extensive presentation of these results see Supplementary Results. The full list of pathways from the ORA can be found in Supplemental Table 2.
Gene Set Enrichment Analysis (GSEA)
The examination of the overall gene expression pattern was carried out through GSEA. This analysis is not limited to the set of DEGs, and it takes into account the variations in gene expression across all genes.
This analysis indicated the enrichment of thousands of pathways for GO, and tens of pathways for KEGG and WikiPathways. Most GO pathways were shared between S1 and S2, while far less were shared with S3 (Figure 5A). KEGG and WikiPathways terms were instead mostly distinctive of the subtypes, with few shared pathways between them (Figure 5A, and B). Venn diagram of GO (A), KEGG (B), and WikiPathways (C) terms for each subtype from the GSEA.
The enriched pathways from GSEA on all databases for S1 highlighted key themes related to organismal processes like protein synthesis and energy metabolism, along with neuronal signaling and nervous system development. The results emphasized the modulation of homeostatic processes and metabolic dysregulation, likely related to the involvement of oxidative phosphorylation in energy production. Moreover, few disease pathways were found significant and, accordingly, pathways related to the immune system were also present. Additionally, pathways associated with processes related to addiction were identified in S1.
Pathways from the GSEA for S2 revealed biological pathways associated with organismal processes and cellular signaling, along with structures development such as cell development and connectivity. Other terms revealed the modulation of the immune response and the involvement of disease processes which, among many others, included pathways associated with genetic disorders and syndromes. In the results for S2, pathways related to addiction processes were identified, similar to those found in S1.
GO pathways for S1 and S2 were mostly shared and related to morphological changes (nervous system development, anatomical structure development, anatomical structure morphogenesis, tissue development). Interestingly, all pathways from S1 and S2 showed opposite enrichment scores, indicating that these two groups were characterized by an opposite expression pattern despite sharing most of their enriched pathways (Figure 6). Visual representation of six distinct pathways from the enrichment analysis, each labelled with its respective name as a section title. Within each section, there are two sets of plots: S1 on the left and S2 on the right. The upper plots illustrate the positions of gene set members on a rank-ordered list, with the x-axis indicating position and the y-axis representing the ranked list metric. The lower plots display the enrichment scores, with a dashed line indicating the maximum rank of the enrichment score. It is clear to see that all of the represented pathways show opposite enrichment profiles between S1 and S2.
GO pathways from the GSEA on S3 data revealed only unique pathways, with none shared with other subtypes. Key themes included sensory perception, signal transduction, cell signaling, and regulation of gene expression. Significant pathways involved the positive regulation of olfactory transduction, neuroactive ligand-receptor interaction, and protein export. Additionally, the Interactome of polycomb repressive complex 2 (PRC2) pathway highlighted modulation in gene expression and chromatin organization.
For an extensive presentation of these results see Supplementary Results. The complete results tables can be found in Supplemental Table 2.
Baseline prediction of disease progression subtype
A Machine Learning hierarchical classification approach was implemented to develop a prediction system aimed at identifying the disease subtypes of a newly-diagnosed PD patient, at the baseline. Data from multiple modalities were used, including demographics, motor, nonmotor, biospecimen, imaging (Table 2). The first model in the hierarchy aimed to predict whether the subject was from S3, which has the most distinctive phenotype and is also the most severe. The model achieved a fair performance with 0.814 sensitivity, and 0.757 specificity, yielding an F-Score of 0.828 and a total AUROC of 0.877 (Figure 7). ROC curve and confusion matrix from the first model of the hierarchy.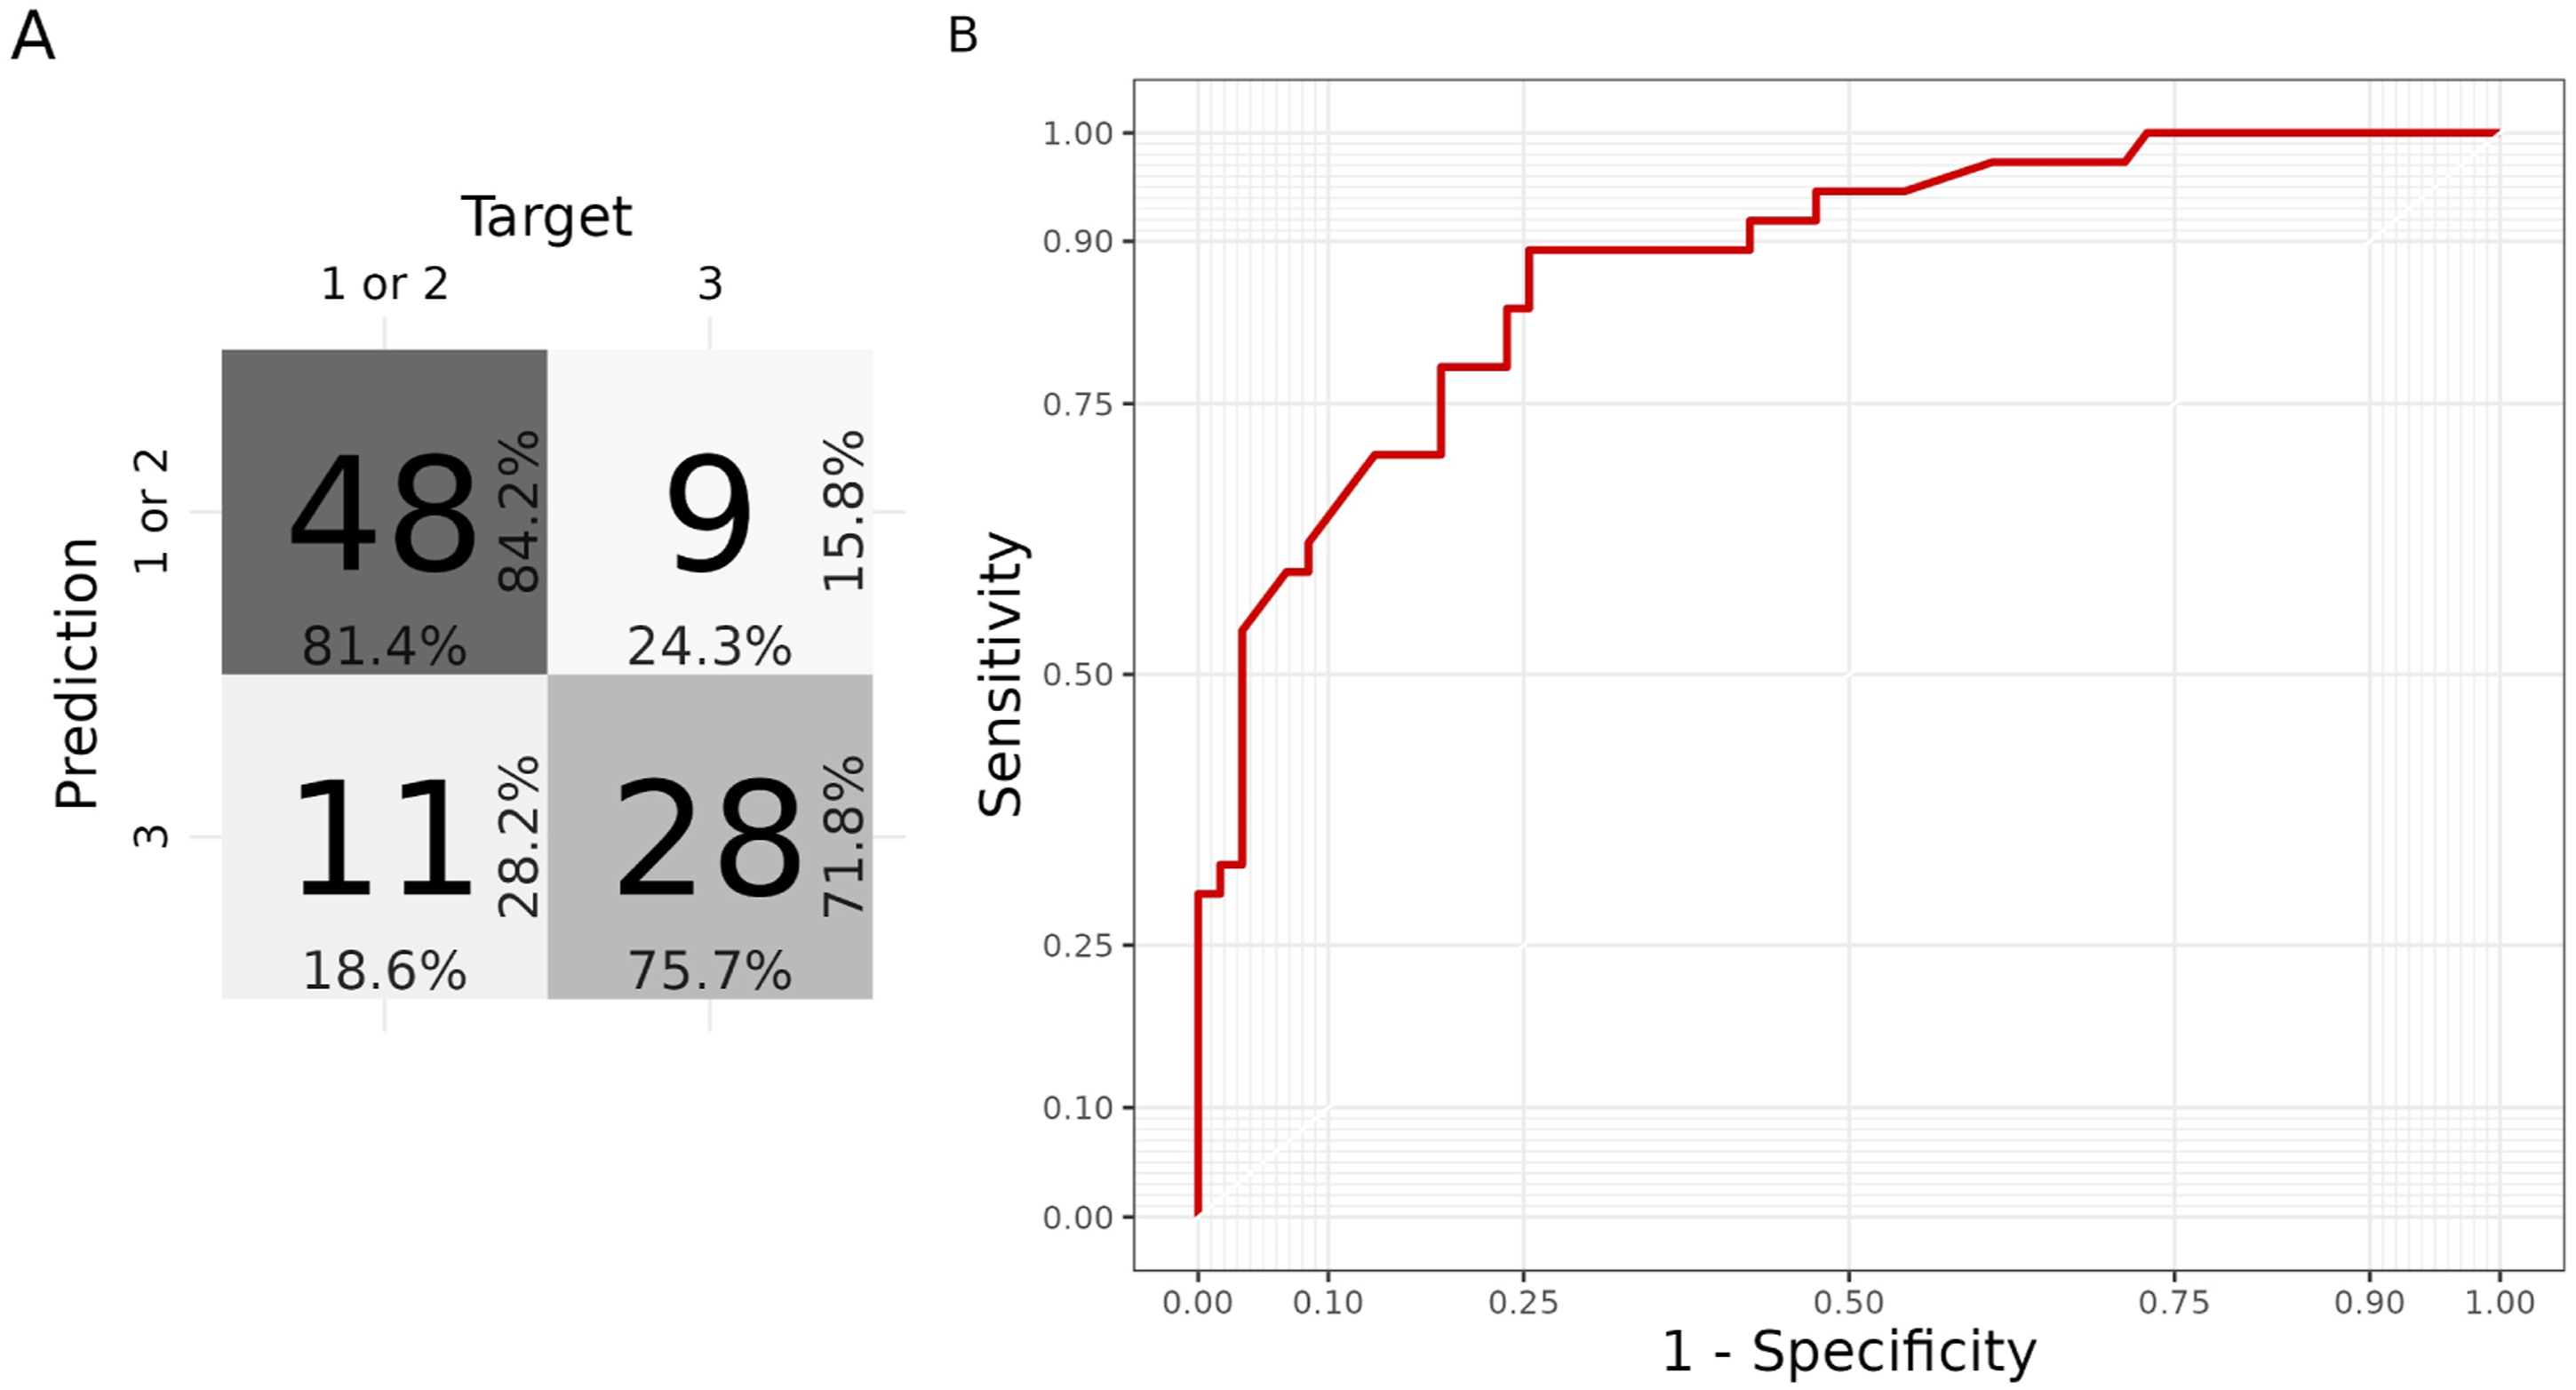
Variable importance was investigated with the application of an explainable Artificial Intelligence (XAI) method, namely SHAP values. These highlighted the score to MDS-UPDRS Part II (disability evaluation) as the most important factor contributing to S3 identification. Among the most important variables there are other clinical measures, along with a neuroimaging measure (DaTScan Caudate R). Gene expression only had a marginal importance, with low absolute SHAP values, giving little contribution to the final prediction (Figure 8). SHAP summary plot representing the contribution of each variable to the prediction of the model.
The second level of the hierarchy held a model aiming to predict whether the subject was from S1 or S2. It achieved a poor performance, with 0.745 sensitivity, 0.25 specificity, yielding a F-Score of 0.77 and a total AUROC of 0.576 (Figure 9). ROC curve and confusion matrix from the second model of the hierarchy.
SHAP values indicated that expression values of U8, HSBP1, TRBV6-4, and SCL4A10, along with Benton Judgement of Line Orientation test score, were the most important factors to discriminate between S1 and S2 (Figure 10). SHAP summary plot representing the contribution of each variable to the prediction of the model.
Discussion
The identification of progression subtypes is of extreme importance in order to attempt settling the heterogeneity of PD. Recent research has shown that people with PD can exhibit a variety of progression patterns from diagnosis onwards.5,8,19,20,22,39 The identification of disease modifying treatments can be fostered by finer-grained diagnoses and biomarkers identification, pursuing a precision medicine approach. Targeting specific biological processes is currentlyunfeasible due to the lack of validated nonclinical biomarkers of PD progression, 40 thus the importance of describing the biological profiles of progression subtypes is a paramount objective.
In this study we investigated the transcriptomic profile of three disease progression subtypes, which were identified in 20 with an AI algorithm that reliably takes into account time as a dimension. Briefly, S1 had mild motor and non-motor symptoms at baseline, with a moderate rate of motor impairment increase and relatively stable cognitive abilities; S2 had moderate motor and non-motor symptoms at baseline, with a slow progression rate; and S3 started with significant motor and non-motor symptoms, showing a rapid progression of impairment, and thus reporting the worse prognosis among the three. 20
The DEGs identified in this study are unique to these progression subtypes, as none of the genes that are commonly found as differentially expressed in PD studies are present in our results. As a specific example, common transcriptomic markers such as SYN1, ANKRD22, and SLC14A1 16 are absent from all our DEGs lists. This result is not surprising to us, as our experiment had two main differences with other PD RNA studies. First, although based on transcriptomics of PD subjects, we investigated progression subtypes as diagnostic classes, thus differences with a classical PD group were expected. Second, our differential expression analysis was performed as a time course experiment, in order to identify those genes that varied for expression values as a result of the disease over time. This profoundly differs with previous PD transcriptomics studies, which performed a cross-sectional analysis of gene expression, thus not taking time into account. As a further note, there is general poor consensus between previous studies on resulting DEGs from PD studies. 15
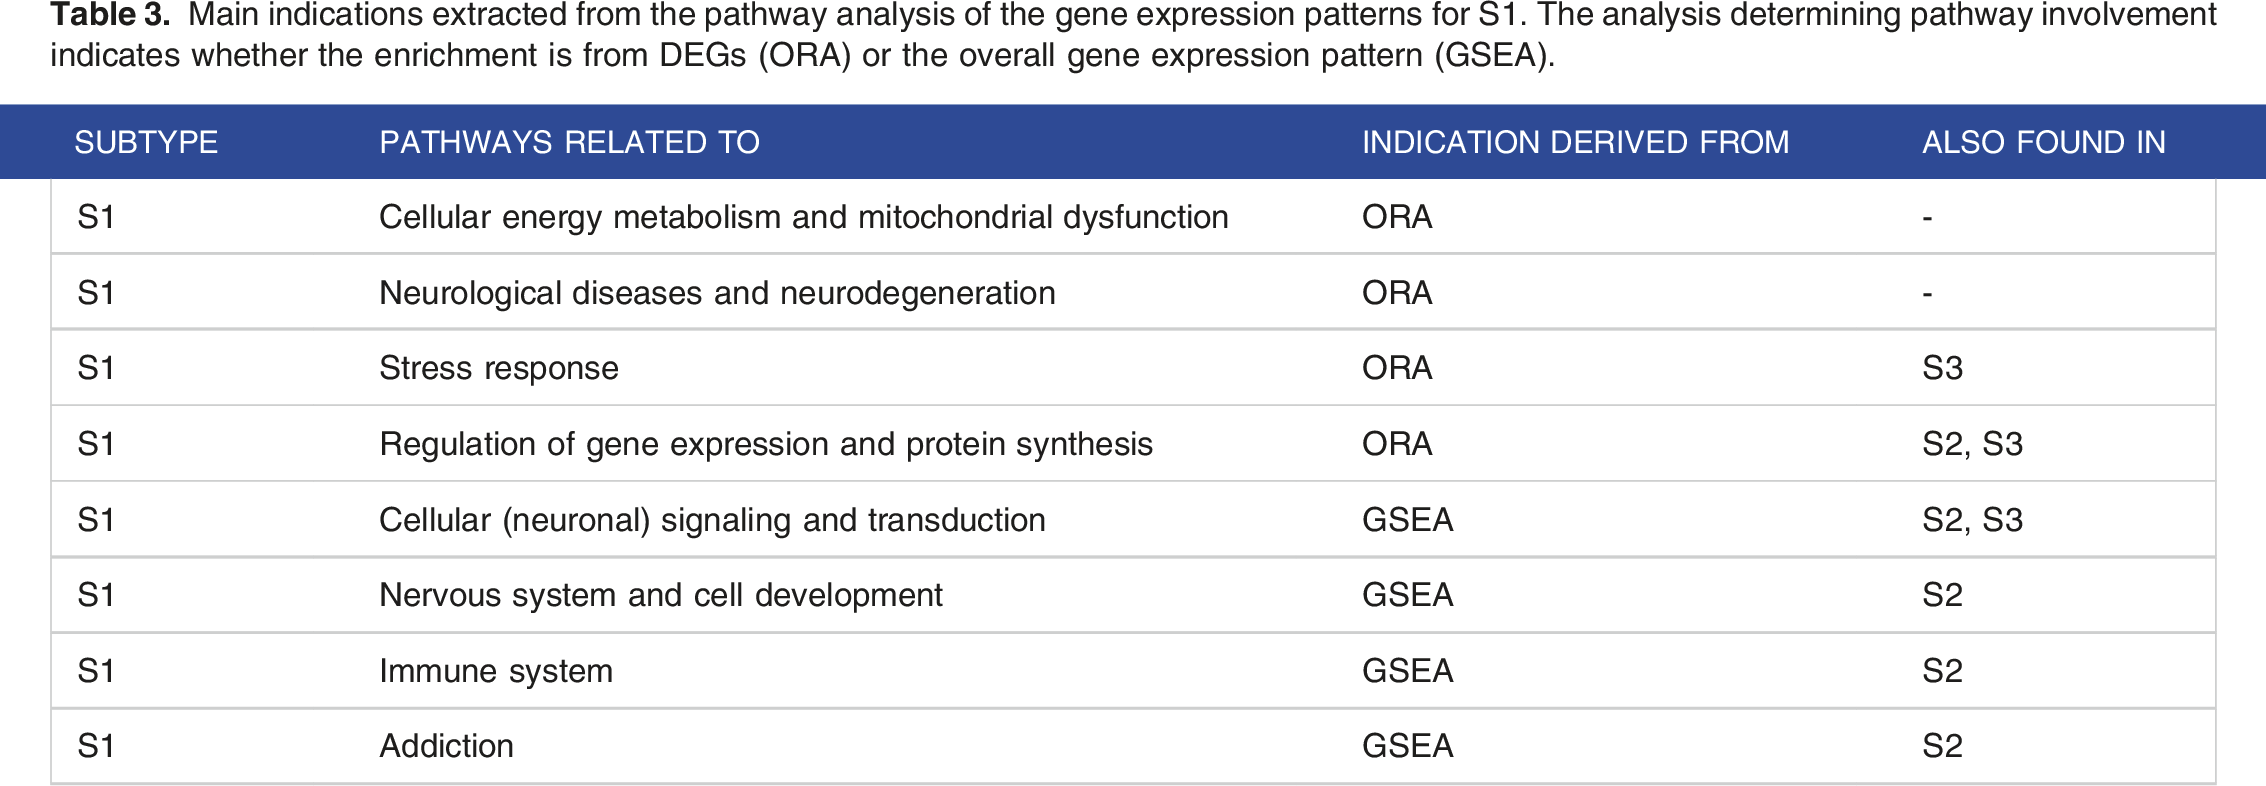
Main indications extracted from the pathway analysis of the gene expression patterns for S1. The analysis determining pathway involvement indicates whether the enrichment is from DEGs (ORA) or the overall gene expression pattern (GSEA).
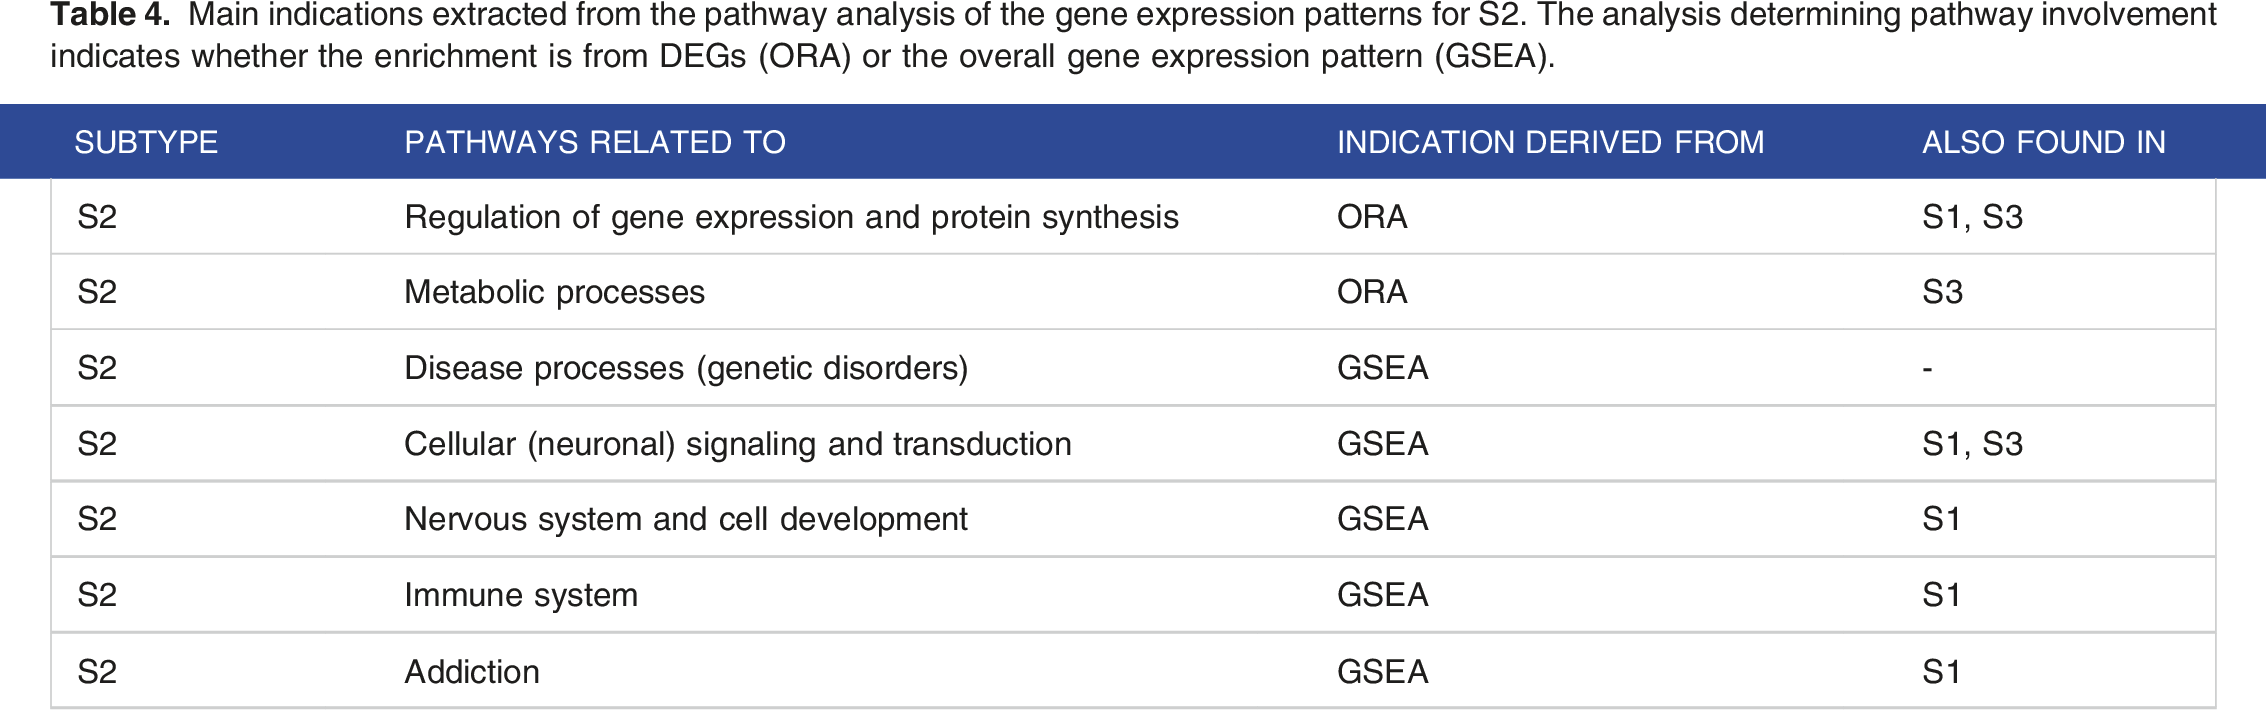
Main indications extracted from the pathway analysis of the gene expression patterns for S2. The analysis determining pathway involvement indicates whether the enrichment is from DEGs (ORA) or the overall gene expression pattern (GSEA).
Main indications extracted from the pathway analysis of the gene expression patterns for S3. The analysis determining pathway involvement indicates whether the enrichment is from DEGs (ORA) or the overall gene expression pattern (GSEA).

S1 transcriptomics profile
The transcriptomic profile of S1 was characterized by a significant modulation of cellular energy metabolism. In particular, we identified alterations in oxidative phosphorylation, aerobic respiration, and cellular respiration pathways. Moreover, pathways related to ATP synthesis, mitochondrial dysfunction, and nucleotide metabolism were commonly enriched across the ORA and GSEA over GO, KEGG and WikiPathways databases. The modulation of energy metabolism is well known in PD, and it has already been found from transcriptomics analyses both in blood and brain sample tissues.41–43 Similarly, cellular response to stress pathways, including oxidant detoxification and response to reactive oxygen species, were also consistently identified. These results confirm that metabolic alterations are a common background in neurological diseases and neurodegeneration, with our DEGs significantly enriching pathways associated with Parkinson’s disease, Alzheimer’s disease, Huntington disease, prion disease, and amyotrophic lateral sclerosis.
While all pathway analyses of S1 data similarities revealed common key themes, ORA and GSEA also identified unique pathways specific to each of the three databases. For instance, one analysis emphasized the significance of pathways related to ribosomal proteins in protein synthesis, while another highlighted the importance of neuronal signaling pathways and immune system dysregulation. Disease-related pathways such as nonalcoholic fatty liver disease and hepatitis B infection were specifically enriched in one analysis. The involvement of immune system response and processes related to oxidative stress are known in PD transcriptomics,15,17 and the observation of disease pathways enrichment is related to their modulation.
The biological profile of S1 shares similarities with that of PD patients with LRRK2 mutation, which is involved in multiple biological functions, including mitochondrial activity and oxidative pathways. 44 It is interesting to note that none of the patients included in this study had a mutation in one of the risk loci known for PD, as this study was solely focused on idiopathic PD. Nonetheless, it has already been observed that the patients with idiopathic PD or LRRK2 genetic PD show mostly overlapping phenotypes, and they are clinically difficult to distinguish. 45
Cellular signaling pathways were also found enriched in the GSEA, confirming that signaling mechanisms, often found among transcriptomics alterations from PD post mortem brain tissues, 46 can also emerge from the analysis of peripheral tissues, such as blood.47,48
A summarizing overview of S1 characteristics derived from the pathway analyses can be found in Table 3.
S2 transcriptomics profile
Pathway analyses consistently identified modulation of gene expression regulation and metabolic processes. Specifically, pathways associated with RNA metabolism and processing emerged among the most significant terms across all analyses. The implication of RNA metabolic processes has been considered in the pathogenesis and disease course of PD, advancing that these may be related to energy conservation, aggregated proteins modulation, and response to cellular stress. 49
One notable characteristic of S2 pathway analyses results lies in the number of pathways identified in each analysis, as some analyses revealed a limited number of pathways. As an example, there were only two significant pathways in the ORA on WikiPathways: Endoderm differentiation (WP2853) and Mesodermal commitment pathway (WP2857). These were enriched by a single gene, NCAPG2. This gene encodes for a regulatory subunit of the condensin II complex which, along with the condensin I complex, plays a role in chromosome assembly and segregation during mitosis. 50 Alterations of this gene have been associated with cancer and neurodevelopmental defects,51,52 and although its presence has already been observed in PD blood transcriptomics,53,54 its role in the disease is still unclear.
Cell-cell communication was found modulated in the GSEA results on all databases. Relatedly, various pathways related to stimulus response emerged as modulated, indicating their involvement in this phenotype.
In GSEA results on the KEGG database, S2 exhibited pathways associated with addiction processes, sharing this characteristic with S1. Pathways related to morphine addiction also emerged in a recent evaluation of PD proteome from dopaminergic neurons in the substantia nigra (SN), suggesting an involvement of potentially compromised GABA-related pathways. 55
A summarizing overview of S2 characteristics derived from the pathway analyses can be found in Table 4.
S3 transcriptomics profile
This subtype had significantly fewer shared terms with the other two, which in turn showed a much higher level of similarity. Pathways resulting from the ORA on DEGs indicate the involvement of response to oxidative stress and detoxification processes, aligning with findings in S1. Additionally, ORA on the KEGG database highlighted pathways related to diseases such as African trypanosomiasis and Malaria, implying a possible modulation of detoxification processes within this phenotype. Overall, these resulting pathways indicate a modulation of the processes associated with cellular adaptation and defense against oxidative stress and toxic substances. Cellular signaling was also found modulated in many of the results sets, and this is a shared alteration for all three subtypes. Accordingly, S3 results included sensory perception and signal transduction as prominent themes, with pathways related to the detection of chemical stimuli and smell perception. Also, the enrichment of pathways related to olfactory transduction, neuroactive ligand-receptor interaction, and protein export was observed. Furthermore, pathways associated with gene expression regulation and cellular response to misfolded proteins were significant, as also found in the other subtypes.
Metabolic pathways such as Vitamin B12 metabolism, Folate metabolism, and Selenium micronutrient network, were also found altered in this subtype. Recent studies have shown that B12 deficiency is common in patients with neuropathies, and PD has B12 levels decline over the course of the disease. 56
A summarizing overview of S3 characteristics derived from the pathway analyses can be found in Table 5.
Comparison of the transcriptomics profiles among subtypes
The results of our transcriptomics analysis revealed a number of similarities between the three PD subtypes (S1, S2, and S3). All three subtypes showed a significant modulation of pathways related to the regulation of gene expression, metabolism, and cell signaling. Pathways associated with nervous system dysregulation were consistently found in all three subtypes. Although expected when analyzing brain cells, we believe that when resulting in blood it’s a confirmatory result of appropriate transcriptomics findings, and this is also in line with previous works on peripheral tissues.15,57 We may consider this as a general alteration due to the disease state, as these were also found in other PD transcriptomics experiments, 16 and not distinctive of any of the subtypes.
S1 and S2 had a few shared themes, including addiction pathways, structure development, immune response alterations and disease processes. In fact, among the distinctive characteristics for S1 we find neurological and neurodegenerative disease pathways. Moreover, S1 was unique in its alteration of energy production and mitochondrial functions. Interestingly, all of the shared pathways between S1 and S2 had opposite enrichment patterns in the GSEA (Figure 7). This demonstrates that S1 and S2 are distinct progression forms of the same disease. Despite sharing a few transcriptomic characteristics, these appear to be modulated in opposing ways, and thus may be at the foundation of their different progression courses. S2 showed an alteration in olfactory transduction, as also observed in S3. S3 was unique in its increased expression of genes involved in detoxification processes, and pathways related to cellular stress response were altered in both S1 and S3. Interestingly, this was the only subtype characterized by enrichment of response to misfolded proteins. Despite the diverse methodologies employed in PD subtyping research, our findings align with those of other authors who have compared transcriptomics profiles of PD subtypes. Specifically, nucleic acids metabolic processes, immune response, mitochondria, and cell metabolism emerged as the most significantly modulated pathways. 24 Additionally, a robust correlation was identified between gene expression changes in PD patients and cell models. 24 This observation suggests that peripheral tissues may serve as valuable indicators of critical disease-related mechanisms occurring in the brain, despite the inherent limitations associated with dissociated cell models.
Subtype prediction at baseline
The machine learning classifier provided a reliable tool to predict disease progression subtypes using baseline data. This tool could easily be implemented into a user-friendly software, to finally build a reliable Computer-Aided Diagnosis (CAD) tool to identify subjects with the most severe prognosis. As resulting from the variable importance analysis, the contribution of gene expression was marginal for the prediction of S3, not allowing for substantial discrimination between disease subtypes in neither of the steps of the hierarchical ML approach. Clinical variables instead demonstrated high importance to identify S3 subjects, with perceived disability (MDS-UPDRS Part II) being the most important predictor for a more severe prognosis. In fact, S3 subjects were characterized by a faster progression and worse symptomatology, sharing some similarities with the classical Posture Instability/Gait Difficulty (PIGD) subtype. Interestingly, most of the S3 subjects were PIGD patients, and those that were Tremor Dominant (TD) instead were likely to shift to PIGD over 6 years. 20 Although expression values resulted as the most important factors to discriminate between S1 and S2, the model at the second level of the hierarchy had a poor test performance. This made it unreliable and, as a consequence, the evaluation of its behavior is meaningless. Considering that this hierarchical classification model has 0.877 AUROC to detect the most severe subtype, this would give useful indication for prognosis. As such, this ML model may foster precision medicine for PD, providing support for a finer-grained diagnosis by applying the results of subtyping research. As all PD subjects included in this study were newly diagnosed, and the classifier was trained and tested on baseline data, it could be applied in clinical practice when evaluating a new PD patient. Additionally, we would like to highlight that the model was trained on baseline data to predict a class defined by disease progression, which involves the passage of time. Notably, it has a greater ability to predict a subject’s future compared to traditional PIGD/TD subtyping. This prediction holds particular relevance for individuals whose phenotype aligns with the S3 subtype, where this classification is more prone to change over time.
In the replication study of the PD progression subtype identification, it has been found that the most severe subtype (S3) had distinctive clinical features when compared to the two less severe subtypes (S1 and S2). Moreover, it was observed that there was limited signal in baseline variables to discriminate between the less severe subtypes. 22 These observations are in line with our results, as the performance of our classifier is poor in discriminating between S1 and S2 (0.576 AUROC). Additionally, our analysis revealed that not even transcriptomics assessment was useful to discriminate between S1 and S2 at baseline.
The classifier trained in this study aimed to assess the usefulness of gene expression data to subtype prediction. It has shown that it may be best to use as few variables as possible to predict the subtype, and appropriate ML evaluation on these data would provide indications about the best-suited variables for this purpose. Nonetheless, this study was solely aimed at testing the usefulness of RNA-Seq data. Further research may aim at finding the minimum set of clinical variables that maximize prediction reliability.
As previously acknowledged, there is currently no standardized method for distinguishing PD progression subtypes. However, identifying peripheral indicators of disease progression could greatly benefit PD clinicians. Despite the prior identification of DEGs between two PD progression subtypes, there has been a notable absence of attempts to leverage this data for classification using ML techniques. 24 Our research supports the idea that peripheral predictors for PD progression subtypes are not to be found in blood transcriptomics. Instead, we propose that baseline clinical data can be effectively utilized to enhance prognosis.
Providing a tool for progression subtype prediction at baseline is pivotal to improve the application of subtyping research results into PD clinical practice. Not only this study provides a biological characterization of progression subtypes, but it also demonstrates that a hierarchical ML approach is suitable to detect the most severe subtype, with a potentially relevant impact on prognosis.
Strengths and limitations
This study provides a characterization of the transcriptomics profile for three PD subtypes identified in a data-driven manner, namely using AI to analyze the disease progression. A datadriven approach to disease subtyping is free from the biases due to the experimenter and is more precise, as no a priori choices based on medical expertise are made. PPMI has one of the largest PD cohorts to date, offering a consistently large group to identify disease subtypes with AI methods. As the identification of disease progression subtypes was performed using an LSTM, 20 the present study is hypothesis-free and aims to characterize the most reliable PD progression subtypes available in the literature.
This study utilized whole blood RNA-Sequencing data for transcriptomic analysis. While this approach has its advantages in terms of accessibility and potential clinical relevance, it’s essential to note that blood transcriptomics may not fully capture the complexities of gene expression alterations specific to the brain, which is primarily affected in PD. Further studies on brain cells transcriptomics are needed to fully unravel the characteristics of PD progression subtypes.
Moreover, albeit PPMI is a multi-site data collection, this study is limited by the analysis of a single cohort. The extrapolation of these findings to clinical practice would need robust validation supported by further replication studies on multiple independent cohorts, eventually strengthened by the integration of other clinical and biological markers.
The vastness of the results tables from the pathway analyses hindered results manageability. As a group of researchers, we did our best to read the results table and report noteworthy results, yet it is to be disclosed that a complete and accurate report was unfeasible. As a comment to this, we would like to speculate that future technological development may help with the interpretation of High Throughput Sequencing data analysis results: Large Language Models (LLM), such as ChatGPT, 58 are showing increasingly better ability to handle textual data, and may one day be well-suited to summarize and expose these kinds of results. Potential future analysis of our results by means of such methods is encouraged, and full results tables can be found in Supplemental Tables 1-2.
Supplemental material
Supplemental material - Transcriptomics profiling of Parkinson’s disease progression subtypes reveals distinctive patterns of gene expression
Supplemental material for Transcriptomics profiling of Parkinson’s disease progression subtypes reveals distinctive patterns of gene expression by Carlo Fabrizio, Andrea Termine, and Carlo Caltagirone in Journal of Central Nervous System Disease.
Footnotes
Acknowledgements
PPMI – a public-private partnership – is funded by the Michael J. Fox Foundation for Parkinson’s Research and funding partners, including 4D Pharma, Abbvie, AcureX, Allergan, Amathus Therapeutics, Aligning Science Across Parkinson’s, AskBio, Avid Radiopharmaceuticals, BIAL, Biogen, Biohaven, BioLegend, BlueRock Therapeutics, Bristol-Myers Squibb, Calico Labs, Celgene, Cerevel Therapeutics, Coave Therapeutics, DaCapo Brainscience, Denali, Edmond J. Safra Foundation, Eli Lilly, Gain Therapeutics, GE HealthCare, Genentech, GSK, Golub Capital, Handl Therapeutics, Insitro, Janssen Neuroscience, Lundbeck, Merck, Meso Scale Discovery, Mission Therapeutics, Neurocrine Biosciences, Pfizer, Piramal, Prevail Therapeutics, Roche, Sanofi, Servier, Sun Pharma Advanced Research Company, Takeda, Teva, UCB, Vanqua Bio, Verily, Voyager Therapeutics, the Weston Family Foundation and Yumanity Therapeutics. For up-to-date information on the study, visit.
Author contributions
See CRediT data.
Declaration of conflicting interests:
The author(s) declared no potential conflicts of interest with respect to the research, authorship, and/or publication of this article.
Funding:
The author(s) disclosed receipt of the following financial support for the research, authorship, and/or publication of this article: Ricerca Corrente grants (Italian Ministry of Health) from the Santa Lucia Foundation IRCCS Linea di Ricerca 1 ‐ Neuroscienze Cliniche e Neuroriabilitazione.
Ethical Statement
Supplemental Material
Supplemental material for this article is available online.
References
Supplementary Material
Please find the following supplemental material available below.
For Open Access articles published under a Creative Commons License, all supplemental material carries the same license as the article it is associated with.
For non-Open Access articles published, all supplemental material carries a non-exclusive license, and permission requests for re-use of supplemental material or any part of supplemental material shall be sent directly to the copyright owner as specified in the copyright notice associated with the article.