
Abstract
BACKGROUND
Brain age model, including estimated brain age and brain-predicted age difference (brain-PAD), has shown great potentials for serving as imaging markers for monitoring normal ageing, as well as for identifying the individuals in the pre-diagnostic phase of neurodegenerative diseases.
PURPOSE
This study aimed to investigate the brain age models in normal ageing and mild cognitive impairments (MCI) converters and their values in classifying MCI conversion.
METHODS
Pre-trained brain age model was constructed using the structural magnetic resonance imaging (MRI) data from the Cambridge Centre for Ageing and Neuroscience (Cam-CAN) project (N = 609). The tested brain age model was built using the baseline, 1-year and 3-year follow-up MRI data from normal ageing (NA) adults (n = 32) and MCI converters (n = 22) drew from the Open Access Series of Imaging Studies (OASIS-2). The quantitative measures of morphometry included total intracranial volume (TIV), gray matter volume (GMV) and cortical thickness. Brain age models were calculated based on the individual’s morphometric features using the support vector machine (SVM) algorithm.
RESULTS
With comparable chronological age, MCI converters showed significant increased TIV-based (Baseline: P = 0.021; 1-year follow-up: P = 0.037; 3-year follow-up: P = 0.001) and left GMV-based brain age than NA adults at all time points. Higher brain-PAD scores were associated with worse global cognition. Acceptable classification performance of TIV-based (AUC = 0.698) and left GMV-based brain age (AUC = 0.703) was found, which could differentiate the MCI converters from NA adults at the baseline.
CONCLUSIONS
This is the first demonstration that MRI-informed brain age models exhibit feature-specific patterns. The greater GMV-based brain age observed in MCI converters may provide new evidence for identifying the individuals at the early stage of neurodegeneration. Our findings added value to existing quantitative imaging markers and might help to improve disease monitoring and accelerate personalized treatments in clinical practice.
Plain Language Summary
Based on individual’s MRI scans, brain age model has shown great potentials for serving as imaging markers for monitoring normal ageing (NA), as well as for identifying the ones in the pre-diagnostic phase of age-related neurodegenerative diseases. In this study, we investigated the brain age models in normal ageing and mild cognitive impairments (MCI) converters and their values in classifying MCI conversion. Pre-trained brain age model was constructed using the quantitative measures of morphometry included total intracranial volume (TIV), gray matter volume (GMV) and cortical thickness. With comparable chronological age, MCI converters showed significant increased brain age than NA adults at all time points. Higher brain age were associated with worse global cognition. This is the first demonstration that MRI-informed brain age models exhibit feature-specific patterns. The greater GMV-based brain age observed in MCI converters may provide new evidence for identifying the individuals at the early stage of neurodegeneration. Our findings added value to existing quantitative imaging markers and might help to improve disease monitoring and accelerate personalized treatments in clinical practice.
Keywords
Introduction
Ageing is a dynamic, nonlinear and complex process that leads to reductions in brain structures, including cortical atrophy ranging from hemisphere to whole brain. 1 Using magnetic resonance imaging (MRI) scans to predict subsequent cognitive decline and identify early-stage dementia is of major interest in the studies of age-related neurodegenerative diseases. Over the last decades, MRI-based biomarkers have garnered substantial attention due to their great potential in guiding accurate diagnosis and brain-based interventions in clinical routine.2-4 While the diagnostic performance of MRI biomarkers is well-studied in individuals with already present cognitive impairment, their clinical significance in identifying and predicting conversion from normal ageing adults to early-stage dementia remains controversial. 5 In the same line, given the dynamic relationships between ageing, neurodegeneration and brain morphometry may lead to further enhancements in the diagnostic, therapeutic and prognostic modelling of neurodegenerative diseases in real-world clinical practice.
As a family of quantitative approaches, the concept of brain age model has been developed for thoroughly estimating an individual’s chronological age from neuroimaging data.6-10 The past decades have witnessed tremendous advances in quantifying brain features and predicting brain age, as well as in modeling techniques relate to brain age prediction. With the advances in analytical methods, computational models of brain age have become popular in quantifying the effect of ageing on the brain. Algorithmically, brain age prediction can take many forms in ageing populations. Based on T1-weighted MRI data, both regression machine learning models and deep learning (i.e., convolutional neural network) models have been applied in brain age estimation framework. 11 At present, the main output of brain age models included estimated brain age and brain-predicted age difference (brain-PAD). The score of brain-PAD is computed by deducting the brain age from the individual’s chronological age.12-14 The score of brain-PAD has threefold explanations: (1) a negative score of brain-PAD representing decelerated brain ageing (i.e., brain age < chronological age); (2) a positive score of brain-PAD representing accelerated brain ageing (i.e., brain age > chronological age); (3) brain-PAD score equal to zero, representing normal brain ageing (i.e., brain age = chronological age). Of note, beside of algorithms, accurately inferring brain age from neuroimaging data requires computational models that capture and quantify the underlying age-related brain changes. Although the gray matter-based brain age models have been well developed in last decade, the accurate and dynamic estimation of brain age is highly dependent on the changes of brain features during normal and pathological ageing. For example, using a pre-trained brain age model derived from gray matter volume, accelerated ageing (i.e., increased brain age) was observed in Alzheimer’s disease (AD) patients and mild cognitive impairment (MCI).15-17 Later, Lv et al found that the individuals with greater brain age were accompanied with worse cognitive function and MRI-based brain age can differentiate the AD diagnostic groups. 8
From a longitudinal perspective, Franke and Gaser found that the cases with accelerated brain ageing converted to clinical dementia within 3 years. 18 It should be noted that there is a linear pattern between advanced age and gray matter volume loss during ageing,19,20 while another measure of gray matter, cortical thickness, showed a curvilinear relationship with advanced age.21,22 When it comes to brain age model, volume-based and thickness-based brain-PAD showed distinct patterns in clinical populations. 23 These results indicate that neurodegeneration may differentially affects different brain features during ageing. Importantly, the brain age models constructed based on gray matter volume and cortical thickness may reflect the disease-specific changes in the dimensions of brain structures. In this context, several factors appeared to drive the trend towards an increase in the surface-based mapping of gray matter that contain both volume and thickness measure. Considering currently emerging analytic methods, the morphometric features of gray matter may be a critical factor contributing to the discrepancy in brain age models, which may confound clinical and biomarker interpretation in patients with age-related neurodegenerative diseases.
Taken together, the limited evidence of MRI-informed feature-based brain age prediction has brought about inconsistent investigations of estimated brain age at individual level, particularly for patients with very early stage of neurodegenerative diseases. With respect to the complex and non-linear structural changes during ageing, a rigorous quantitative approach is required to better characterize the brain features and feature-based brain age models in the context of cortical atrophy. Hence, we proposed to examine the ageing effects on the morphometric feature-based brain age and brain-PAD in normal ageing adults and MCI converters, as well as to test their predictive values in identifying the MCI converters.
Materials and methods
Study participants
Baseline demographics, cognition and global morphometry in NA adults and MCI converters.

Note. Data are raw scores and presented as mean ± SD.
Abbreviations: NA = Normal ageing; MCI = Mild cognitive impairment; MMSE = Mini Mental State Examination; TIV = Total Intracranial Volume; CSF = Cerebrospinal fluid; GMV = Gray matter volume; CT = Cortical thickness.
The demographic features and the scores of MMSE were directly retrieved from OASIS-2 dataset, which were collected by Washington University Alzheimer Disease Research Center. The recruitment of the participants in OASIS-2 was in accordance with the guidelines of Washington University Human Studies Committee. Approval for public sharing of the anonymized data was also specifically obtained at the study site.
Structural MRI acquisition
Details about the OASIS-2 MRI data acquisition protocol can be seen on the official webpage of OASIS (https://www.oasis-brains.org/). The structural MRI data of OASIS-2 was acquired on a 1.5 T Vision scanner (Siemens, Erlangen, Germany) with a thermo-plastic face mask to minimize head movements. 24 The T1-weighted magnetization prepared rapid gradient echo (MPRAGE) sequence was empirically optimized for the gray-white contrast, with repetition time (TR) = 9.7 ms, echo time (TE) = 4.0 ms, resolution = 256 × 256 matrix, orientation = sagittal, inversion time = 20 ms, delay time = 200 ms, flip angle = 10°, slices = 128 and thickness = 1.25 mm.
Quantifications of brain features
The brain features, including total intracranial volume (TIV) (i.e., brain parenchyma), gray matter volume (GMV) and cortical thickness (CT), were extracted and quantified by BrainSuite 21a at individual level (https://brainsuite.org/) (Figure 1). BrainSuite is an automatic brain surface identification integrated computational platform with the updated version of cortical surface extraction, which is suitable for adults with cortical atrophy.28,29 To calculate the region-specific cortical features, we followed the standard pipeline with default settings.
30
Through uploading each subject’s structural MRI data to BrainSuite, the image processing methods include a series of steps: (1) head motion correction; (2) image intensity normalization; (3) removal of the non-brain voxels; (4) segmentation of gray matter (GM), white matter (WM) and cerebrospinal fluid (CSF); (5) tessellation of GM/WM boundary, and topology correction. Framework of the quantitative analysis of morphometric features. Individual’s structural MRI scans were checked and imported to BrainSuite for surface-based morphometry (SBM) analysis (A). The brain features include brain parenchyma or total intracranial volume (TIV), gray matter volume (GMV) and cortical thickness (CT) (B).
Based on the tissue segmentation results from BrainSuite, cortical surface of each hemisphere for each participant were reconstructed by a deformable surface method. 31 TIV, as the total volume of brain parenchymal, was calculated as the sum of total GM volume and total WM volume. The inner cortical surface (GM/WM interface) was reconstructed by correcting the topological defects in the WM, and then deformed toward the reconstruction of the outer cortical surface (i.e., pial surface). The inner cortical surface had vertex-to-vertex correspondence with the outer cortical surface. The reconstructed inner and outer cortical surface was used for calculating the regional morphometric features. Cortical thickness is calculated as an average of the distance from the WM surface to the closest point on the pial surface and from that point back to the closest point to the WM surface. 32
Brain age models
In estimation stage, pre-trained brain age model contextualized the whole brain features of the training set derived from the Cambridge Centre for Ageing and Neuroscience (Cam-CAN) project (N = 609, age range: 18-90 years) (https://www.cam-can.org) were firstly constructed to generate a machine learning-based pre-trained model. 33 The brain age model, including estimated brain age and brain-PAD, were predicted using the support vector machine (SVM) algorithm implemented in MATLAB (i.e., “fitrsvm” function, kernel: linear). Using ten-fold cross-validation, the model of brain age prediction was applied to the MRI scans to estimate a brain age score for the entire samples (N = 609). The dependent variable was chronological age. The independent variables encompassed the GMV of 34 cortical regions in the left hemisphere, 34 cortical regions in the right hemisphere, CT of 33 cortical regions in the left hemisphere, and 33 cortical regions in the right hemisphere. The total dimensionality of the independent variables was 134, and the specific details of the brain regions were outlined in the Supplemental Table 1.
Using principal component analysis (PCA), the top principal components capturing 80% of the variances in gray matter volumes were retained. 34 The details of brain age models can be found at Github (https://github.com/hannabrainscience/Brain-age-prediction). The participants from the OASIS-2 with three-wave structural MRI scans were used as testing set (N = 162) for calculating and validating the brain age models. Considering the participants in OASIS-2 aged 66 to 87 years (i.e., late adulthood), age-bias correction was applied in the estimation of brain age. 35 The score of brain-PAD was calculated by subtracting chronological age from predicted brain age (Figure 3(A)), indicating a state of accelerated brain ageing (positive value) or brain resilience (negative value).6-10,12-14
Results
Demographics, cognition and morphometric features
Demographic information, global cognition, and global brain morphometry in terms of TIV, GMV and mean CT were comparable between the 2 groups at baseline (Table 1). The MCI converters had lower scores of MMSE than NA adults at the 1-year follow up (t = 2.91, P = 0.009) and 3-year follow up (t = 4.23, P < 0.001).
Brain age models in NA and MCI converters
Model performance, including bivariate correlation between estimated brain age and chronological age (r) and mean absolute error (MAE) for training set was N = 609, r = 0.73, MAE = 3.58 years, which had comparable generalizability with published brain age models 36,37 and the testing dataset (i.e., OASIS-2). The chronological age was positively correlated with estimated brain age in training samples (i.e., Cam-CAN) (r = 0.807, P < 0.001). At baseline, chronological age was positively correlated with TIV-based brain age and CT-based brain age in NA adults (Figure 2(A)) and MCI converters (Figure 2(B)). Correlation matrix for chronological age and morphometric feature-based brain age in normal ageing adults (A) and mild cognitive impairment (MCI) converters (B). * Presents P < 0.05. Abbreviations: TIV = Total intracranial volume; BA = Brain age; GMV = Gray matter volume; CT = Cortical thickness.
TIV-based brain age models in NA adults and MCI converters.
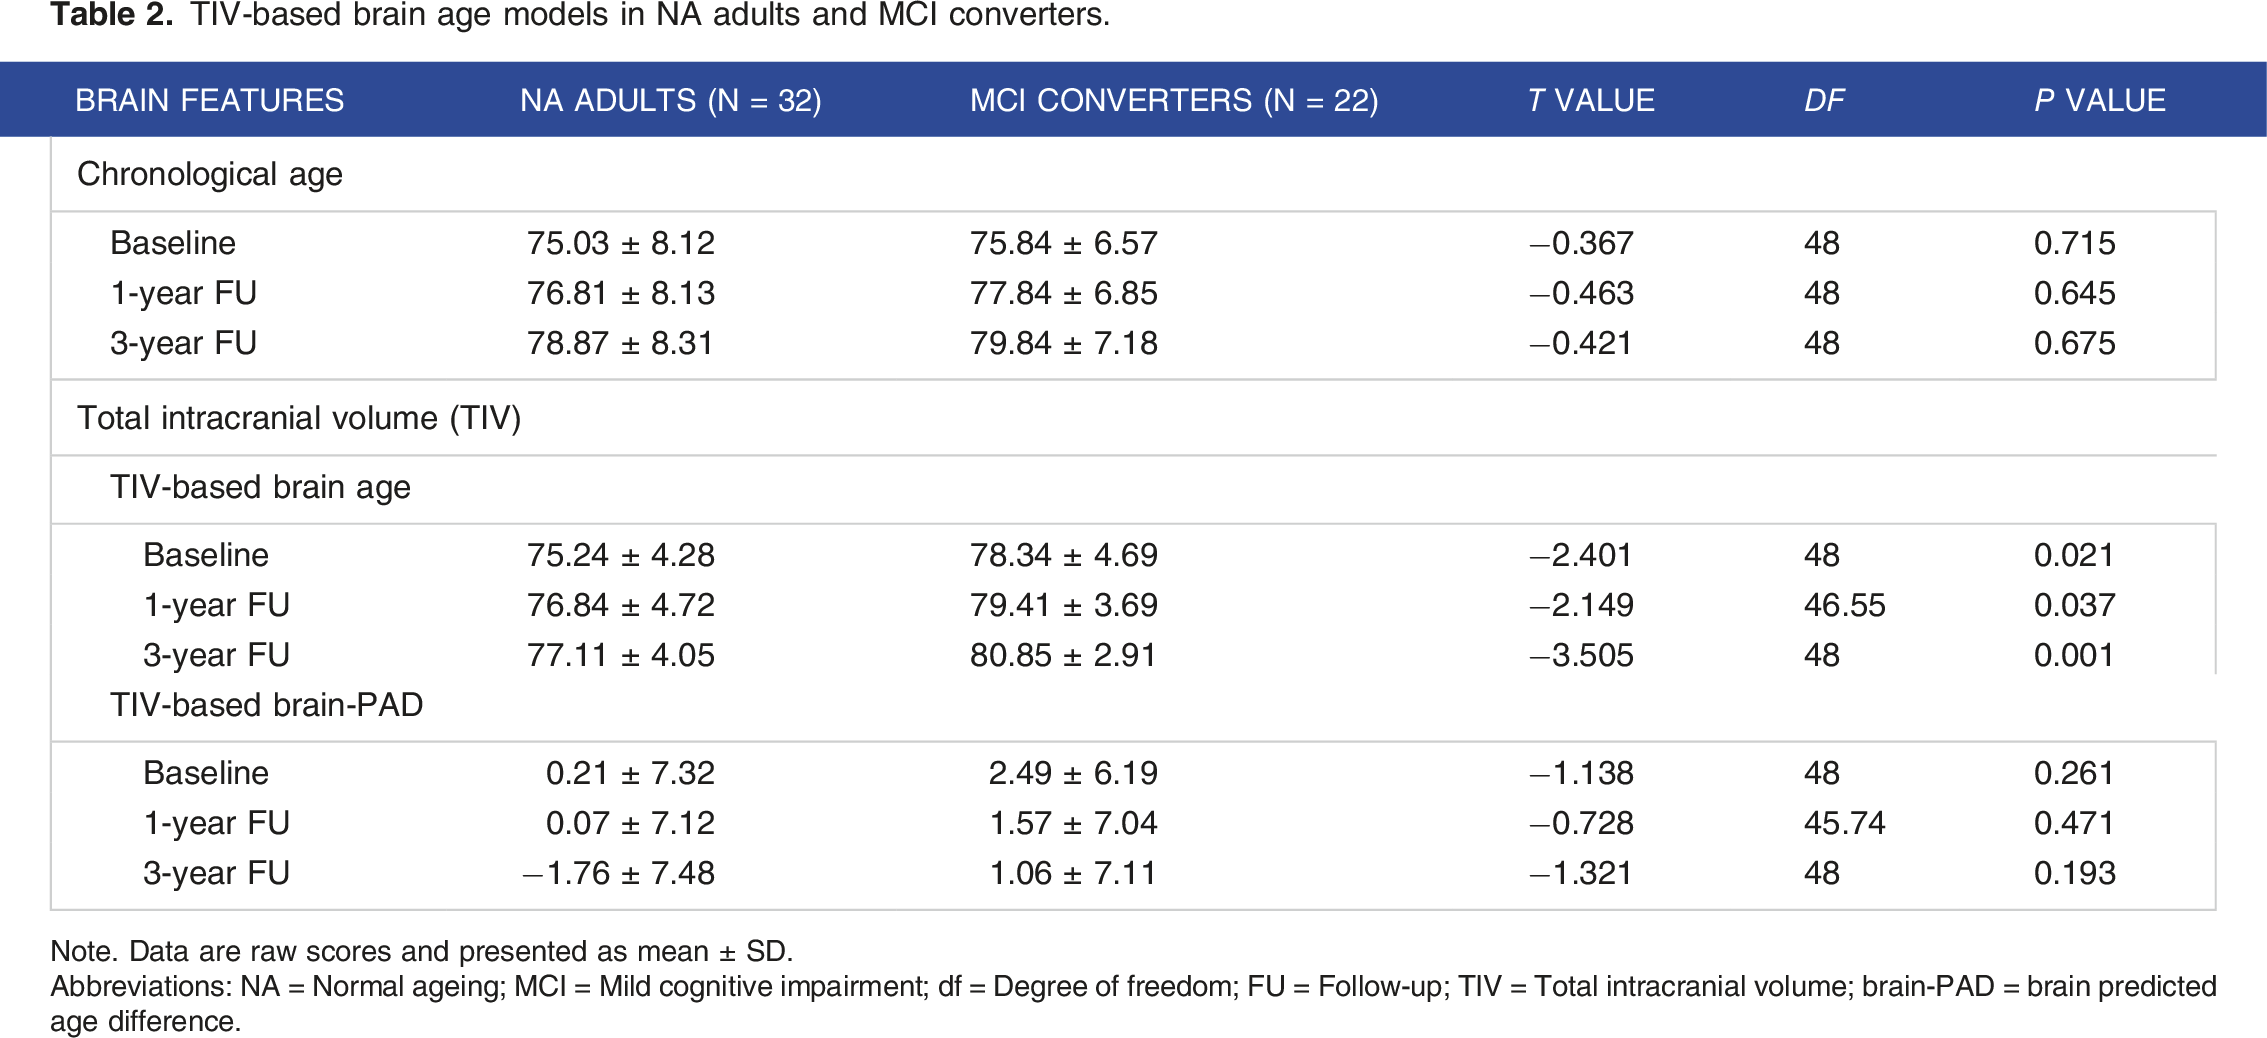
Note. Data are raw scores and presented as mean ± SD.
Abbreviations: NA = Normal ageing; MCI = Mild cognitive impairment; df = Degree of freedom; FU = Follow-up; TIV = Total intracranial volume; brain-PAD = brain predicted age difference.

Comparisons of chronological age (CA) and estimated brain age (BA) in normal ageing (NA) adults and mild cognitive impairment (MCI) converters at baseline, 1-year and 3-year follow-ups. At individual level, each person has 2 measures of age: CA calculated based on participant’s calendar and birth date; BA calculated based on morphometric features (A). MCI converters had comparable CA, but older BA than NA at baseline, 1-year and 3-year follow-ups (B).
Lateralization of brain age models
As shown in Figure 4, leftward asymmetries were observed on the GMV-based brain age in MCI converters at baseline, 1-year and 3-year follow-up, contrasting with the right lateralization found in CT-based brain age in MRI converters at 3-year follow-up (Table 3). In NA adults, no statistical differences were found between the brain age models calculated based on the hemispheric brain features. In MCI converters, significant differences of CT-based brain age (left: 76.34 ± 5.06 years, right: 78.34 ± 5.29 years, t = −2.181, P = 0.041) and CT-based brain-PAD (left: 0.51 ± 5.38, right: 2.51 ± 4.27, t = −2.177, P = 0.043) were detected at baseline. Comparisons of hemispheric morphometric feature-based brain age in normal ageing (NA) adults and mild cognitive impairment (MCI) converters at baseline, 1-year and 3-year follow-up (FU), including left gray matter volume (GMV)-based brain age (A), right GMV-based brain age (B), left cortical thickness-based brain age (C) and right cortical thickness-based brain age (D). MRI-informed morphometric feature-based brain age models in NA adults and MCI converters. Note. Data are raw scores and presented as mean ± SD. Abbreviations: NA = Normal ageing; MCI = Mild cognitive impairment; df = Degree of freedom; FU = Follow-up; brain-PAD = brain predicted age difference.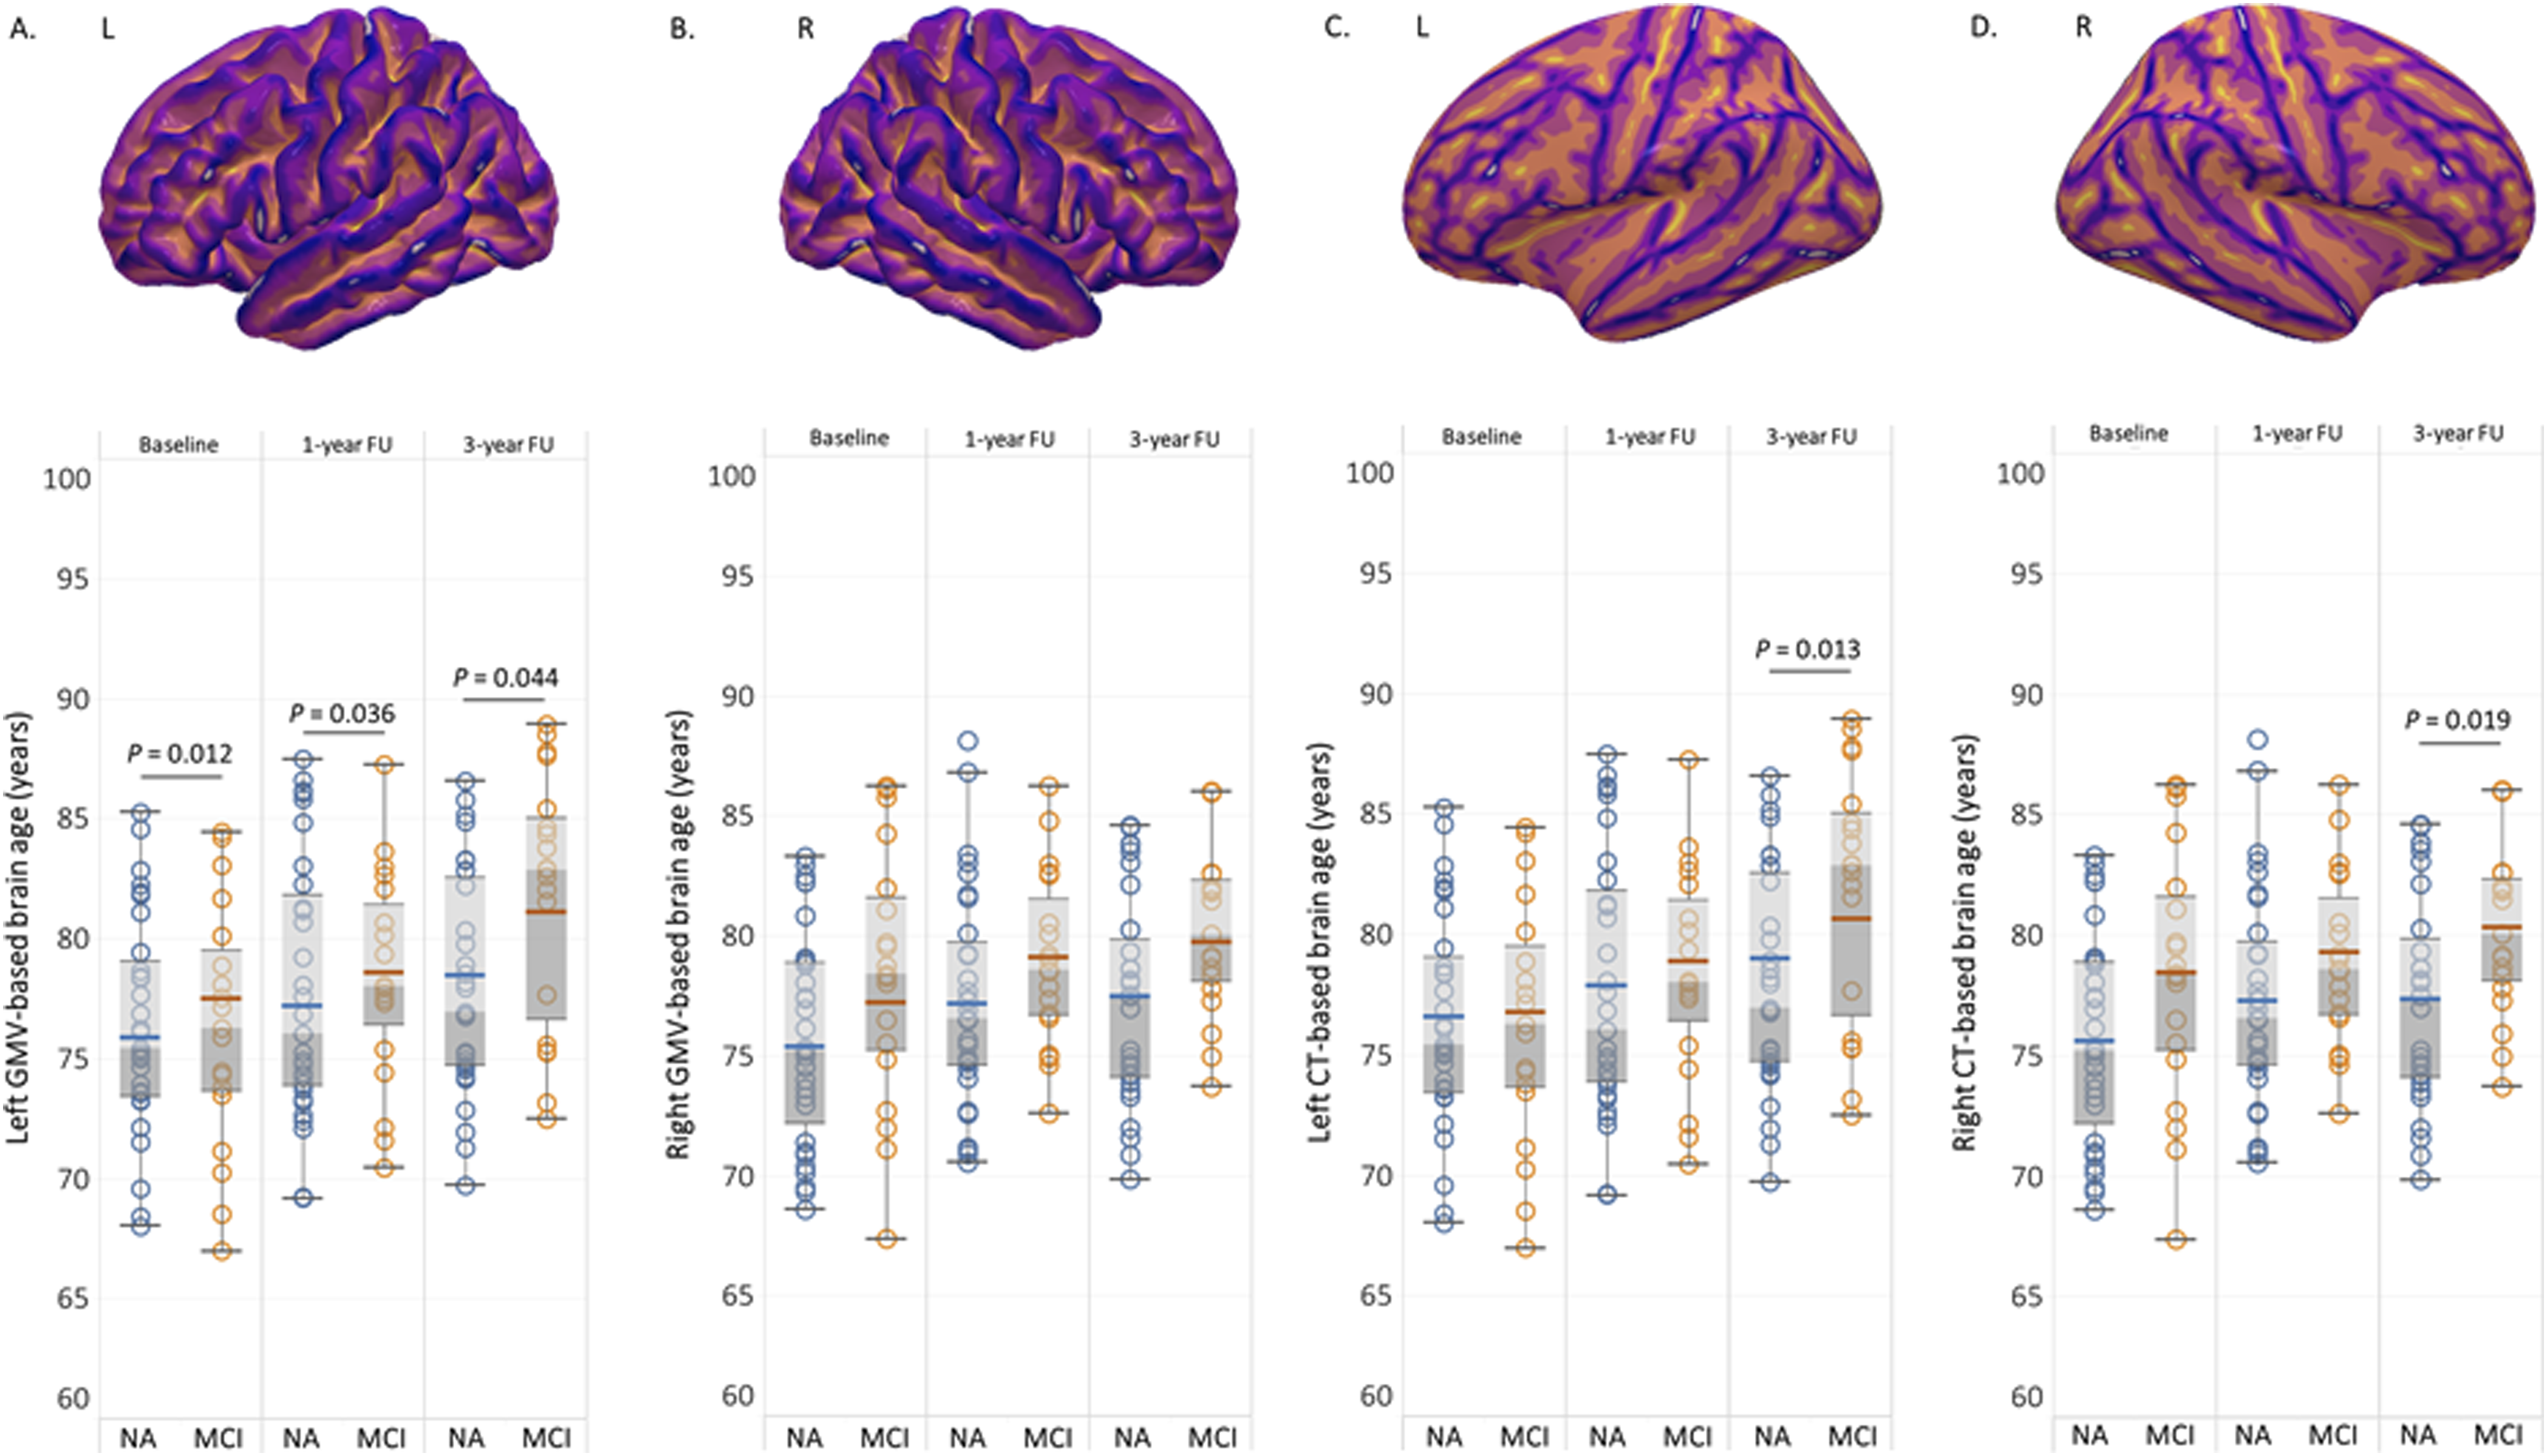

Associations between brain age model and cognition
In NA adults, right GMV-based brain age was significantly associated with the total score of MMSE at 3-year follow-up (r = −0.468, P = 0.008). No significant association was detected between CT-based brain age or brain-PAD and the total score of MMSE total. In MCI converters, the total score of MMSE at 1-year follow-up was significantly correlated with the left GMV-based brain-PAD at all time points (Baseline: r = −0.477, P = 0.039; 1-year follow-up: r = −0.618, P = 0.005; 3-year follow-up: r = −0.604, P = 0.006).
The classification model of MCI converters
To classify NA adults and MCI converters at baseline, the values of the area under the ROC curve (AUC) were applied to test the discriminative power of the MRI-informed brain age models. At baseline, the MCI converters had significant greater brain age than NA adults when chronological age and sex were adjusted as covariates (TIV-based brain age: P = 0.02, left GMV-based brain age: P = 0.017) (Figure 5(A)). Based on these findings, we constructed the classification models of MCI conversion showed an acceptable performance (TIV-based brain age: AUC = 0.698, sensitivity = 0.737, specificity = 0.742; left GMV-based brain age: AUC = 0.703, sensitivity = 0.789, specificity = 0.548). The score of brain-PAD could not distinguish MCI converters from NA adults at baseline (Figure 5(B)). Receiver-operator characteristic (ROC) curves for the morphometric feature-based brain age and brain-PAD. The TIV-based and left GMV-based brain age (A), rather than brain-PAD (B), could differentiate the MCI converters from normal ageing adults at baseline.
Discussion
To the best of our knowledge, this study is first to investigate the MRI-informed morphometric feature-based brain age models and their values to predict the conversion from normal ageing to MCI in a well-characterized cohort. Our findings demonstrated a robust brain age prediction (r = 0.81, MAE = 3.58) of normal ageing adults. In the context of comparable chronological age, MCI converters had an older estimated brain age than normal ageing adults at baseline, 1-year and 3-year follow-ups. The brain age models calculated based on the hemispheric morphometric features showed different patterns in MCI converters. Furthermore, only the TIV-based and left GMV-based brain age resulted in the robust performance of the classification models between normal ageing adults and MCI converters at baseline.
The ageing effects on an individual’s brain is characterized by a dynamic non-linear pattern of morphometric changes that are detectable with structural MRI. The past decades have witnessed the magnificent advances in quantifying brain structures (i.e., method), as well as in explaining the structural changes in an integrated framework (i.e., concept). For better interpreting the clinical significance of brain age models in ageing populations, we should firstly understand the concept of brain reserve. Brain reserve is a neuroanatomic resource that reflects the structural substrate of the brain that afford a surplus capacity to maintain cognitive function and allows the individuals to be resilient to the effects of ageing or neuropathological factors.38-41 Briefly, it is accepted that the individual with sufficient structural substrate (i.e., brain parenchyma) tends to be capable of preserving normal cognition despite the presence of neuropathological factors, such as amyloid-beta peptide (Aβ).38,41 Similar to brain age prediction, the most commonly used brain features used to quantify brain reserve was the volume of brain parenchyma (i.e., TIV),42,43 and recently have extended to the surface-based features of cortex, including both volume and cortical thickness. 44 Thus, the morphometric feature-based brain age models may also reflect the diverse organization of brain reserve.
In our results, normal ageing adults and MCI converters had comparable chronological age and brain parenchyma volume (i.e., TIV), but MCI converters had significantly older TIV-based brain age than normal ageing adults at baseline, 1-year and 3-year follow-up. In addition, TIV-based brain age, rather than TIV and global cognition (i.e., MMSE), demonstrated acceptable classification performance, which can differentiate the MCI converters from normal ageing adults at baseline. These results indicate that although the MCI converters had comparable chronological age and brain reserve (i.e., TIV) at the stage of normal ageing (i.e., MMSE >28), their brain age had already increased at least 1 years prior to their MCI diagnosis.
Compared to total brain parenchyma (i.e., TIV), GMV and CT are brain features with diverse neuroimaging measures and clinical significance. For instance, similar to TIV, GMV, as another volumetric proxy of brain reserve, reflects the maximum attained cortical gray matter, which has been found to change as a function of normal ageing or emergence of neurodegenerative diseases, such as MCI and AD.15-17,45,46 In our results, we found that the MCI converters had a significantly older GMV-based brain age than normal ageing adults at baseline, 1-year and 3-year follow-up, but had older CT-based brain age at 3-year follow-up (see Table 3). The results imply that the individual differences in estimated brain age may not be captured by single brain feature. Moreover, it seems that volumetric changes can be captured by structural MRI earlier than the cortical thickness changes during ageing and disease progression. Consistent with the changes of brain features, volume-based brain age and brain-PAD (i.e., TIV and left GMV), rather than CT-based brain age models, was associated with accelerated cognitive decline (i.e., lower score of MMSE at 1-year and 3-year follow-up) even after adjusting for baseline chronological age.
Except for different brain features, another related theoretical concern is whether hemispheric brain reserve changes differently over time as a function of chronological ageing. Indeed, left-right hemispheric asymmetry is 1 of the cardinal features of the brain, and also a critical aspect of healthy brain organization. 47 Decades of research have revealed that the lateralization of brain structures may be altered in brain disorders. For example, compared to young adults, old adults have significantly decreased brain volume in the left hemisphere. 48 Similar findings have also been reported in AD patients, 49 suggesting that atrophy in left hemisphere may be a feature of ageing and AD effect on the brain. Our models revealed that left GMV-based brain age, rather than right GMV-based brain age, was significantly greater in MCI converters than normal ageing adults, indicating the decline in brain reserve, predominantly within left hemisphere. Of note, in normal ageing adults, we found older right GMV-based brain age was associated with worse global cognition at 3-year follow-up. The compensatory mechanisms might explain the lateralized brain age during ageing and disease progression, which might be in-depth examined in future studies.
Limitations and future directions
The findings in this study should be interpreted with caution due to its limitations, with the major limitation being the small sample size of the cohort (i.e., OASIS-2). Other limitations of this study include: (1) Heterogeneity in participants: The absence of the subtypes of MCI converters may limit the interpretations of the clinical significance of feature-based brain age in disease-specific populations. For instance, vascular MCI and amnestic MCI might have similar symptoms of cognitive deficits at early stage (e.g., decreased processing speed), but with different etiologies. This divergence makes it difficult to compare the brain age model between these 2 populations. (2) Uneven follow-up time points: by looking only at 2 times (1-year and 3-year) of follow-up assessments per participant, we were unable to detect the annual changes in brain morphometry and lateralized feature-based brain age in ageing populations. (3) Single modality of neuroimaging: in this study, we calculated the brain age model based on the structural features, which does not completely account for individual’s whole brain features. For example, other modalities of MRI, including functional MRI, transverse relaxation rate R2* and susceptibility-weighted imaging (SWI), can catch the features of brain connectivity, white matter integrity and brain iron (i.e., Quantitative Susceptibility Mapping, QSM), 50 which could be used to incorporate morphometrical analyses to enable the whole brain features mapping in Alzheimer’s disease and Parkinson’s disease.51-53 (4) The absence of other variables, such as genetic information and domain-specific functions (i.e., learning, memory) in the dataset may limit the investigation of the relationship between brain age, genetic factors and cognitive function in current study. Nevertheless, it is somewhat significant that we found a relatively robust brain age prediction and patterns of hemispheric brain features-based brain age models, which further alludes to lateralized structural changes with mid-term follow-up periods during normal and pathological ageing. Meanwhile, our study is limited, as data on other variables related to participants’ genetic factors and medical history were not provided in the OASIS-2 dataset; thus, we did not attempt to examine the brain-genetic relationships in this study.
Beyond normal ageing adults and MCI converters, future studies will aim to investigate the diagnostic and prognostic values of brain age models in patients with neurodegenerative diseases, such as Alzheimer’s disease (AD), Parkinson’s disease (PD), and frontotemporal dementia (FTD). This would contribute to the development of the disease-specific brain age references and further expand the clinical applications of imaging-based brain features in detecting the progression of neurodegenerative diseases and providing multi-scale morphometric features to facilitate disease-specific brain-based interventions. Focusing on methodology, the differences of brain age models calculated based on machine learning or deep learning methods might also be an interesting topic in neuroscience. Moreover, methods such as postulating the individual variances of multi-modal brain features, or metabolic features (i.e., QSM), may represent a next frontier in decoding the complex interlinks between ageing, brain age models and disease progression.
Conclusion
In sum, we found that MRI-informed feature-based brain age and brain-PAD are good candidate biomarkers for capturing accelerated cognitive decline at individual level. The findings highlight the relevance between cortical surface morphometry and MCI conversion, laying the foundation for in vivo tracking of the disease progression in ageing populations. Novel classification models based on volume-based brain age show great potential for early dementia detection and might be useful for developing personalized and clinically useful biomarkers for neurological and psychiatric disorders in the future.
Supplemental Material
Supplemental Material: - MRI-informed machine learning-driven brain age models for classifying mild cognitive impairment converters
Supplemental Material for MRI-informed machine learning-driven brain age models for classifying mild cognitive impairment converters by Hanna Lu and Jing Li in Journal of Central Nervous System Disease.
Data Availability Statement
The data supporting the findings of this study are available on request from the corresponding author. The data is not publicly available due to privacy or ethical restrictions.
Ethical Statement
Ethical Approval
For the purpose of this study, we used the structural MRI scans of Cam-CAN and OASIS-2 that were previously collected under the study protocols at the University of Cambridge and Washington University. This study was carried out in accordance with the recommendations of the University’s Institutional Review Board (IRB). The protocol was approved by the University’s IRB. All participants were given written informed consent at the time of study participation. All participants gave written informed consent in accordance with the Declaration of Helsinki. The University’s IRB also provided explicit approval for open sharing of the anonymized data. The current study was approved by the Clinical Research Ethics Committee of The Chinese University of Hong Kong (CUHK) and New Territories East Cluster (NTEC) (The Joint CUHK-NTEC) (Ref No. 2023.496).
Footnotes
Acknowledgements
The authors would like to thank the Principal Investigators and researchers of Cam-CAN and OASIS-2 (Longitudinal). The funders were not involved in the study design, data collection and analysis, or the preparation of the article.
Author Contributions
HL was responsible for designing the study, performing the analyses, and preparing the manuscript. JL assisted in calculating the brain age models and organizing the results. Cam-CAN and OASIS-2 provided neuroimaging data. HL and JL were involved in data interpretation. All authors reviewed the manuscript and approved the final manuscript. Hanna Lu: Conceptualization, Formal analysis, Investigation, Methodology, Project administration, Resources, Supervision, Writing - original draft, Writing - review & editing, Jing LI: Formal analysis, Software, Validation.
Declaration of Conflicting Interests:
The author(s) declared no potential conflicts of interest with respect to the research, authorship, and/or publication of this article.
Funding:
The author(s) disclosed receipt of the following financial support for the research, authorship, and/or publication of this article: This work was supported by the Hong Kong Research Grant Council (RGC)-General Research Fund (GRF) (Grant No. 14111021) and Healthy Longevity Catalyst Awards (Hong Kong) (Project Number: HLCA/M-407/23). The corresponding author had full access to all the data in the study and had final responsibility for the decision to submit for publication.
Author’s Note:
Data used in the preparation of this article was obtained from the Cambridge Centre for Ageing and Neuroscience (Cam-CAN) project (https://www.cam-can.org/) and the Open Access Series of Imaging Studies-Longitudinal dataset (OASIS-2) (![]() ). The investigators from Cam-CAN and OASIS-2 contributed to the design and implementation of Cam-CAN and OASIS and/or provided data but did not participate in writing this article.
). The investigators from Cam-CAN and OASIS-2 contributed to the design and implementation of Cam-CAN and OASIS and/or provided data but did not participate in writing this article.
Supplemental Material
Supplemental material for this article is available online.
References
Supplementary Material
Please find the following supplemental material available below.
For Open Access articles published under a Creative Commons License, all supplemental material carries the same license as the article it is associated with.
For non-Open Access articles published, all supplemental material carries a non-exclusive license, and permission requests for re-use of supplemental material or any part of supplemental material shall be sent directly to the copyright owner as specified in the copyright notice associated with the article.