
Abstract
Quantitative ultrasound (QUS) techniques such as pixel intensity, ultrasound strain, and shear wave elastography have made it possible to identify the echogenicity (brightness) and mechanical properties (stiffness) of normal and pathological tissues. These techniques can be utilized as an alternative diagnosis tool to assess post stroke spasticity. Current clinical assessment methods include the Modified Ashworth Scale (MAS) and the Modified Tardieu Scale (MTS), which can result in inconsistencies due to their subjective nature. QUS provides robust approaches to assessing muscle stiffness associated with post stroke spasticity. Computer-aided pixel count quantifies tissue echogenicity in grayscale image. A strain ratio in ultrasound strain imaging compares the stiffness and movement (lengthening or shortening) of a spastic muscle with nonspecific muscle. In addition, shear wave elastography provides the shear wave velocity of an affected muscle that directly associated with the muscle stiffness before and after treatment for spasticity. This article reviews the theory behind these aforementioned concepts and discuss the relations between QUS and skeletal muscles in post stroke spasticity.
Introduction
Upper motor neuron (UMN) damage within the central nervous system (CNS) can result in spasticity, a motor dysfunction indicated by a velocity-dependent increase in tonic stretch reflexes due to hyperexcitability of the stretch reflex. 1 Causes of UMN lesions resulting in spasticity include cerebrovascular accidents, trauma, infections, malignancies, neurodegenerative disorders, and metabolic disorders. 2 A cerebral vascular accident (CVA) that leads to spasticity is known as post stroke spasticity (PSS), and can present in 19% to 43% of individuals within 3 to 6 months after suffering a CVA.3,4 The most common sites for PSS within the upper extremity are the elbow, wrist, and shoulder, which have been associated with lesions to the superior corona radiata, internal capsule posterior limb, posterior corona radiata, thalamus, putamen, premotor cortex, and insula. Within the lower extremities, common sites for PSS are the ankle, knee, and hip, which are associated with lesions to the superior corona radiata, internal capsule posterior limb, caudate nucleus, posterior corona radiata, thalamus, putamen, and external capsule.5,6 PSS is of clinical relevance because it can impair an individual’s ability to perform activities of daily living, increasing caregiver burden, as well as increase the cost for post stroke management. 7
Although there is little debate regarding the definition of spasticity, clinical examinations of such as the Modified Ashworth Scale (MAS) and Modified Tardieu Scale (MTS) have been scrutinized due to their subjective nature. 8 Assessment of spasticity using the MAS requires the observer to rate the patient’s muscle tone on a scale from 0 to 4, with 0 indicating no increase in muscle tone and 4 being the affected part(s) are rigid in flexion or extension. 9 MTS differs from MAS in that it assesses for spasticity with passive motion. MTS grades a muscle’s reaction to passive stretch as varying stretching speeds with 0 indicating no resistance and 5 indicating the joint cannot be moved. 8 When comparing MAS to MTS, MTS is shown to be more reliable than MAS in evaluating spasticity.10,11 Even with its improved accuracy, the consistency of MTS and MAS remains in question due to a poor inter-rater reliability and test-retest reliability.12,13
Less subjective measurements of spasticity include electromyography (EMG), magnetic resonance imaging (MRI), magnetic resonance elastography (MRE), and quantitative ultrasound imaging (QUS). Surface EMG has shown success in identifying muscle function after UMN damage using the Brain Motor Control Assessment (BMCA).14,15 Although EMG has shown promise, Biering-Sorenson reports issues with these procedures because spontaneous EMG activity is a sign of dystonia or muscle spasms, whereas evaluation of spasticity require activity of the stretch reflex. Furthermore, it is noted that the absolute amplitude of these response will vary between subjects from one session to another. 16 Another tool to identify spasticity is MRI. MRI can be used to determine spasticity by comparing the cross-sectional area and volume of a spastic muscle with its opposite counterpart, that is, triceps brachii muscle versus biceps brachii muscle. Using MRI, these studies indicate that there may be an association between a reduction in cross sectional area of the affected muscle and spasticity.17,18 In addition, MRE is capable to assess the stiffness of a tissue using shear waves with frequencies ranging from 50 to 500 Hz. These waves are then imaged using a specialized technique, which displays the stiffness of a tissue by using shear modulus. 19 MRE is already used as a noninvasive assessment of hepatic fibrosis and its results are closely correlated with histopathology in evaluation of tissue stiffness. Although MRE has shown promise in the evaluation of muscle spasticity, low availability and acceptance, high contraindications, and cost limit its application as a point care tool for the assessment of PSS. 20 Another tool that can be utilized to evaluate muscle properties is QUS. Like MRI and MRE, QUS has been used to assess the tissue morphology and stiffness related to the mechanical properties of the tissue. QUS differs from MRI in that it is less expensive and can be performed on a larger patient population (less patient cooperation is required and almost no contraindications) in a medical institution, imaging center, and rural clinics.
Quantitative Ultrasound Imaging Techniques
Main quantitative ultrasound (QUS) techniques in the evaluation of the skeletal muscles in PSS include conventional grayscale image and newly developed ultrasound elastography. Conventional grayscale image displays morphology and echogenicity of the muscle. Currently, two ultrasound elastography methods, ultrasound strain imaging and shear wave elastography are commonly utilized to assess the muscle tissue mechanical properties (stiffness) in clinical applications. Ultrasound strain imaging can be conducted to estimate tissue strain online or off-line. However, to date, ultrasound shear wave elastography is only available of measuring tissue shear modulus online using high-end scanners.21,22
Pixel-intensity of grayscale image
High-resolution grayscale image is commonly used to evaluate the morphology, structure, and echogenicity of muscles associated with neuromuscular disease. Healthy muscle cells appear hypoechoic with sharp bright lines on ultrasound image. The bright lines represent collagen fibers in the endomysium and perimysium. 23 An increased echogenicity of muscle can be seen in muscle fibrosis or fatty infiltration that result from either age-related degeneration or spasticity. Using computer-aided imaging processing, such as Image J (https://imagej.nih.gov/ij) analysis histogram, the number of gray pixels of the muscle can be counted as muscle pixel-intensity in the affected muscle with PSS (Figure 1). When assessing pixel-intensity, a standard machine setting for acquiring grayscale image of the muscle plays a critical role in maintaining a consistent collection of ultrasound imaging data on-line and assessment of pixel-intensity of the muscle off-line. The operator should use the same machine setting for all patients, initial studies, and follow-ups to minimize variation among operators and between the initial and follow-up scans. The most important settings for grayscale image include linear array transducer, scanning frequency, total gain, image depth, dynamic range, harmonic imaging, speckle reduction function (if applicable), time gain compensation. When using pixel-intensity to compare healthy muscle to spastic muscle, spastic muscle appears more echogenic and have a higher pixel intensity.23,24

Grayscale image of the longitudinal biceps muscle relaxation (90° elbow flexion) is acquired in a healthy subject (1a) and a patient with post stroke spasticity (1b) for off-line processing. Machine settings for recording grayscale images of the muscle included a linear array transducer (9L4, 9-4 MHz, Acuson S3000, Siemens Medical Solutions), scanning frequency 7 MHz, moderate gain, image depth 4 cm, dynamic range 60, harmonic imaging, turned off speckle reduction function, centered time gain compensation. Using Image J histogram analysis, mean pixel-intensity in the region of interest of the muscle is counted 42.781 in normal muscle (1a) and 74.281 in an affected muscle with MAS 1.0 spasticity (1b). A significant increase in pixel-intensity indicates higher echogenicity in the affected muscle with post stroke spasticity. In the histogram, Count is total pixels in the region of interest and Mean is the mean pixel count in the region of interest.
However, quantitative echogenicity alone cannot define the mechanical properties of the muscle, which has closer relation to muscle function and spasticity. In addition to quantitative echogenicity, grayscale ultrasound is another proposed option by observing a muscle’s architectural parameters such muscle thickness, fascicle length and pennation angle. 24 Unfortunately, the expected results for each parameter are highly variable, potentially due to the large variability of muscle groups and severity of the spasticity.24-27 This suggests that more research is required to evaluate spasticity using muscle architecture parameters from gray scale ultrasound.
Ultrasound strain imaging
Ultrasound strain imaging, also known as compression elastography, is the most used and first ultrasound elastography technique implemented.28,29 It is defined as the strain produced by the compressive force applied to tissue by the ultrasound transducer or other push device. 30 Using speckle tracking correlation coefficient method, the amount of deformation from the compression is measured by comparing the distance the tissue is compressed with its initial position.31,32 Using these measurements, the strain is calculated by subtracting the final length of the muscle with the initial length and dividing the result with the initial length ([Final Length − Initial Length]/Initial Length). 31 The theory behind this method is based on Hooke’s law, which indicates that if the compressive force on the tissue is equal throughout, the E (modulus of elasticity) = stress/strain.33,34 Based on this, one can think of strain as a change in tissue deformation versus depth. This indicates that strain will be higher in softer tissues due to a greater degree of deformation. Furthermore, strain will be lower in stiff tissue that experience limited deformation. 22 Implementation of this on ultrasound can be visualized either superimposed on or displayed adjacent to the grayscale image. 35 The ultrasound machine will produce a qualitative color-coded map. The spectrum of colors ranges from blue to yellow/green, and red. Stiffer tissues will appear blue, tissues that are intermediate will appear yellow/green, and soft tissues will appear red, or vice versa.36,37 The strain is the function of time, so the values of the strain can also be displayed as graphic curves quantitatively. In a strain graph, the Y-axis generally represents the value of strain and the X-axis represents the time in seconds38,39 (Figure 2). In clinical applications of ultrasound strain imaging, strain ratio is a normalization of the muscle strain by comparing the strain in the muscle with the strain in a reference tissue because the force used in compression is unknown. 40 Depending on the type of tissue measured, the strain ratio has been shown promise in the assessment of breast lesions/masses, myocardial stiffness, and post stroke spasticity.38,39,41-43 Axial strain ratio of the muscle to the reference tissue can be used to assess muscle stiffness associated with post stroke spasticity (Figure 2a-c). There is shown to be a significant increase in muscle stiffness in the biceps brachii of spastic individuals, as represented by a remarkable decrease in muscle axial strain in the spastic muscle compared with the axial strain in a healthy nonspastic muscle. 39 In addition, the affected muscle longitudinal movement (lengthening or shortening) during the joint flexion and extension can also be estimated in post stroke spasticity using ultrasound strain imaging (Figure 2d-e). Longitudinal strain ratio of the muscle to reference tissue can be used as a quantitative marker to assess the muscle movement function correlated with the region of motion. These findings are consistent with previous research, which shows that ultrasound strain imaging is a viable tool for measuring skeletal muscle mechanical properties and function with good inter- and intra-observer reliability. 38
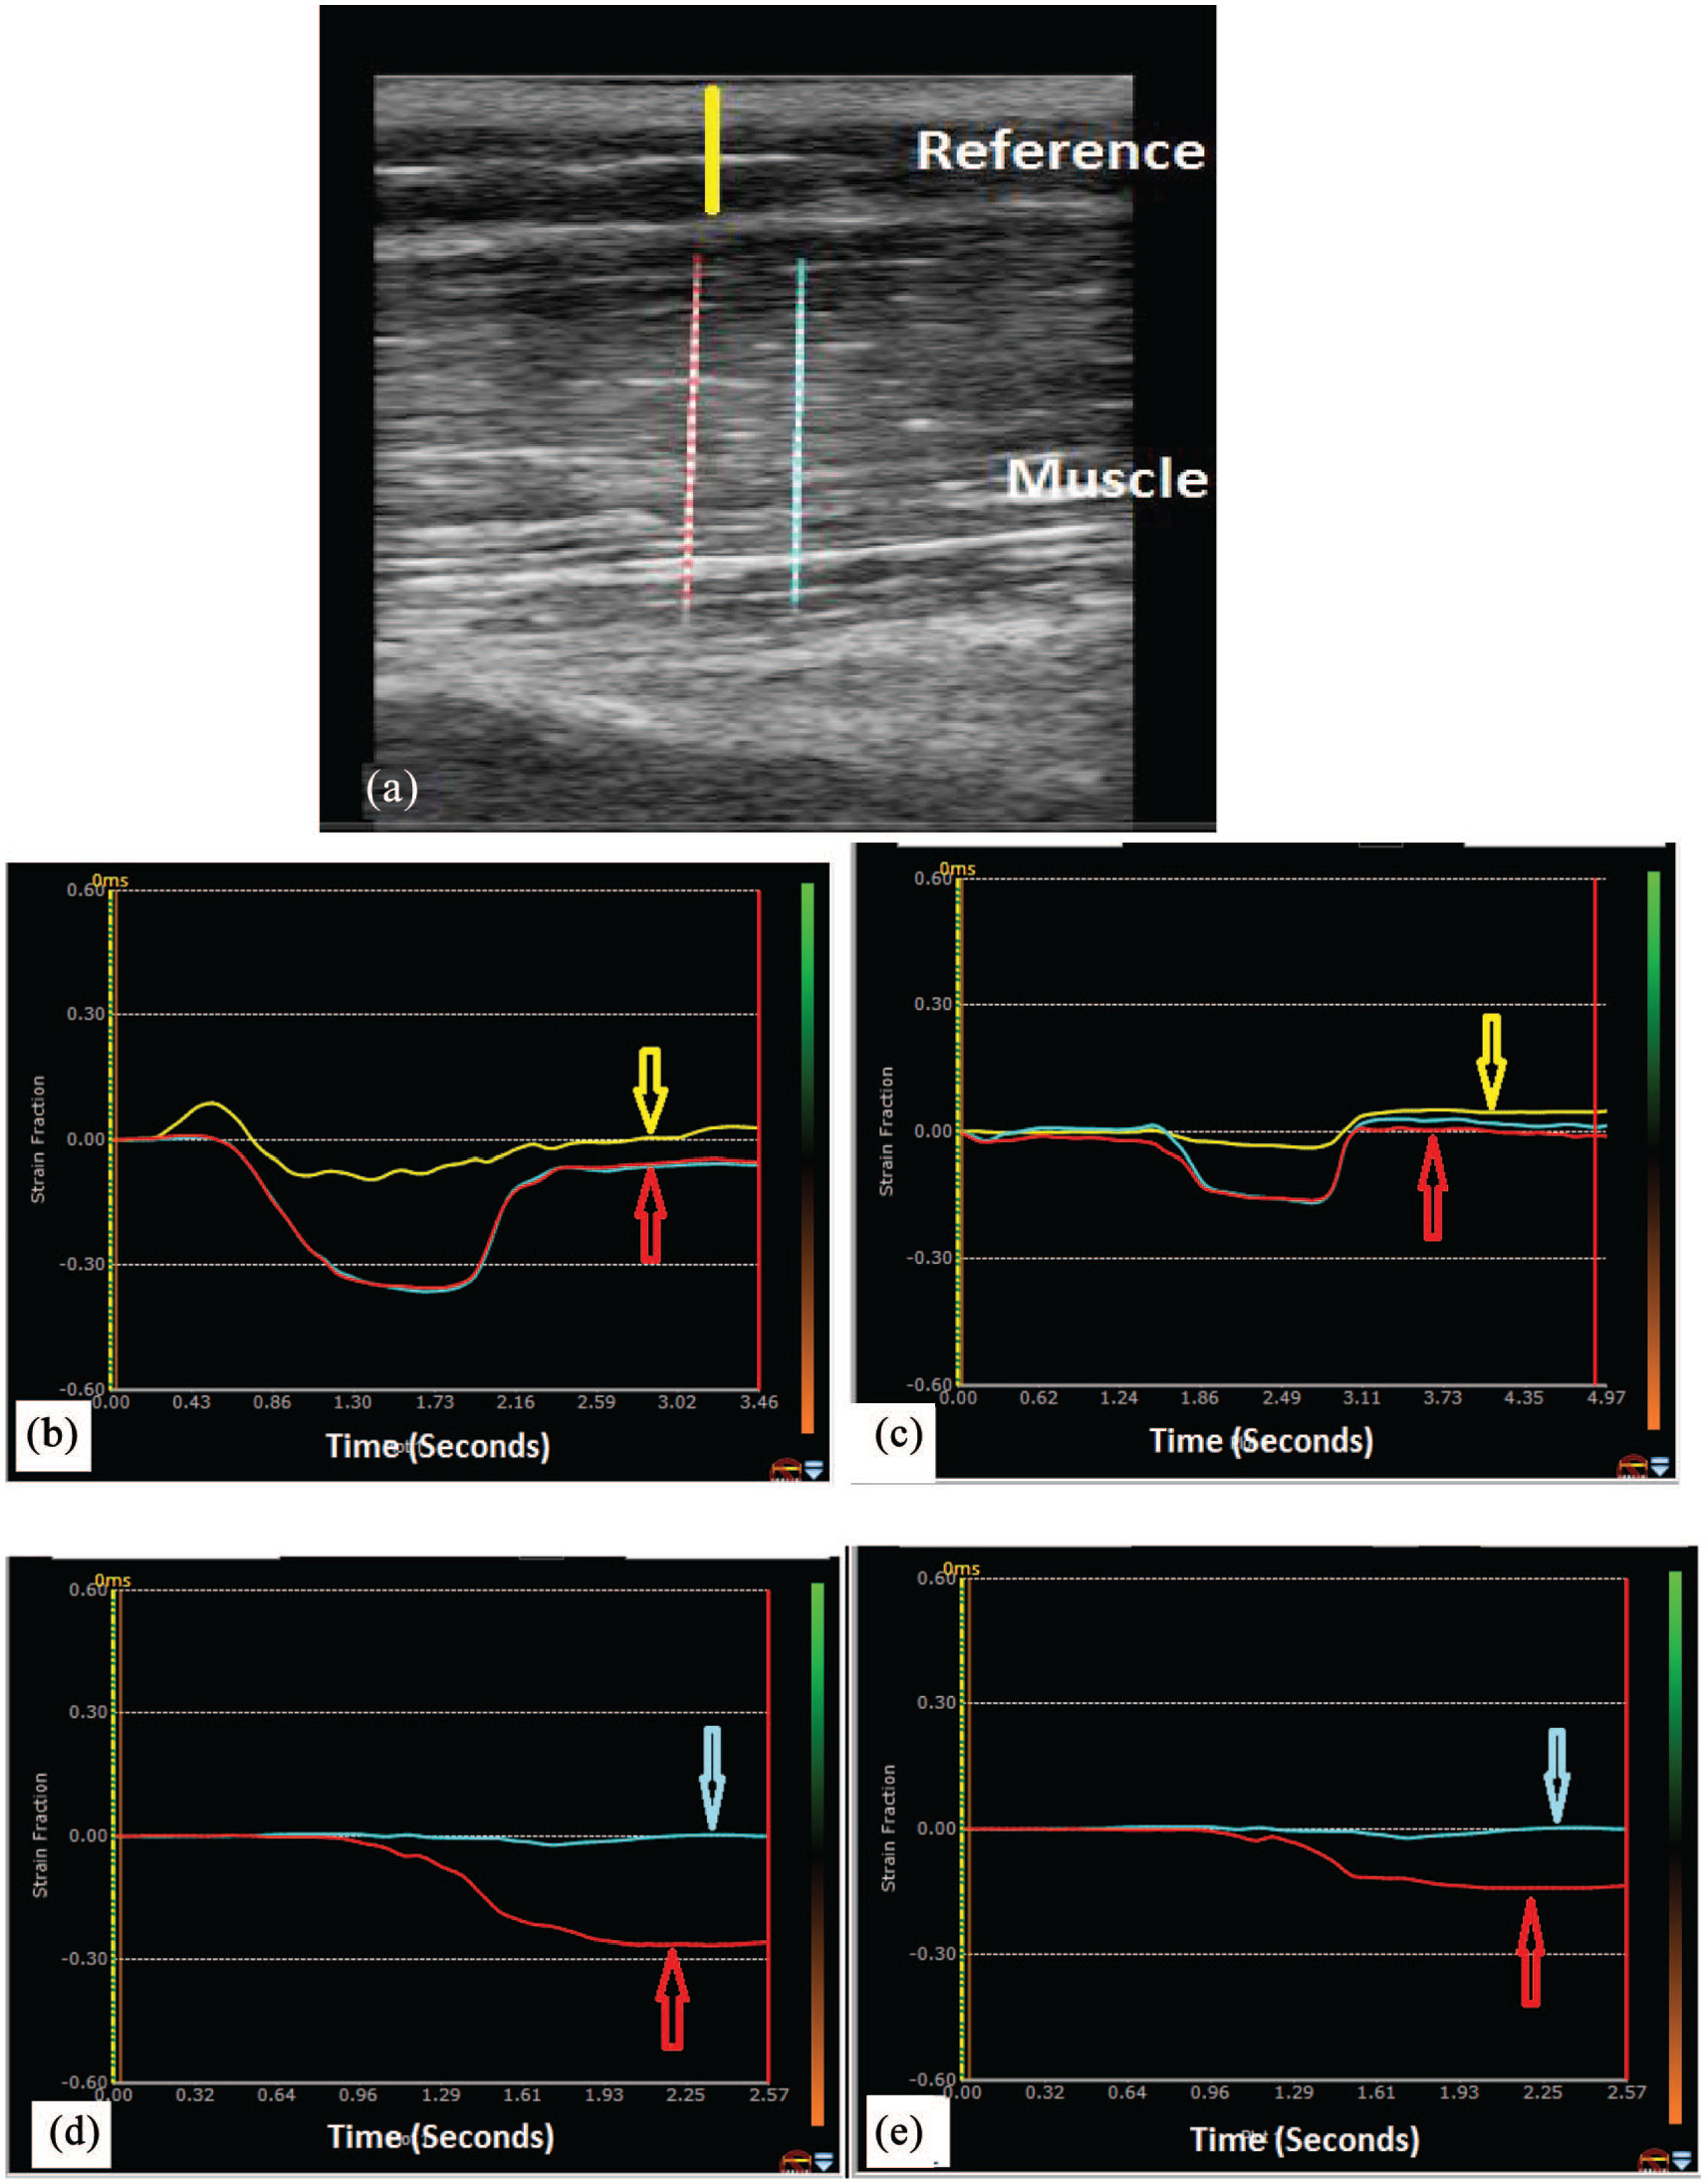
Cine loops of real-time grayscale image of the biceps brachii muscle is acquired in healthy and spastic muscle for off line processing using speckle tracking software. Strain ratio is defined as the strain of the muscle (muscle) divided by the strain in reference subcutaneous tissue (reference) (2a) because the force used for compression is unknown. Axial strain representing muscle deformation under an external compression is high in healthy muscle (−0.4, 2b) and low in a spastic muscle (−0.18, 2c). Longitudinal strain representing muscle (biceps) tissue movement (shortening in the strain graph) during joint (elbow) flexion is also high in the healthy muscle (−0.28, 2d) and low in a spastic muscle (−0.14, 2e) in post stroke spasticity. In strain graphs, Y-axis represents strain value and X-axis represents time in seconds. Yellow (2b, 2c) and cyan (2d, 2e) colored arrows point reference strain curves whereas red colored arrows point muscle strain curves (2b-e). One can clearly note that axial and longitudinal strains significantly differ between healthy and spastic muscles.
Ultrasound shear wave elastography
Another ultrasound technique that can measure the mechanical properties of a tissue is shear wave elastography. This technique involves the measurement of propagated waves that travel laterally and perpendicular from acoustic ultrasound waves emitted by the transducer. 44 These waves are referred to as shear waves and are generated from ultrasound push pulses that function to displace tissue. 45 The displacement of tissues by these waves are monitored by a separate wave that is derived from the ultrasound transducer. 46 The propagation of the shear waves through tissues resembles the ripples produced when a rock is thrown into a body of water. Shear waves travel through stiff tissues faster, and soft tissues slower.22,47 This is represented by the formula E = 3pc2, with E standing for Young’s elastic modulus, p standing for tissue density, and c being the shear wave velocity. 48 Because skeletal muscle is inherently anisotropic, it should be noted that this can cause a discrepancy between the shear modulus and Young’s elastic modulus. This effect is the result of shear waves favoring propagation alongside fibers rather than across, which can be avoided by scanning parallel alongside the fiber of interest.44,49 Like ultrasound strain imaging, the resulting information can be visualized superimposed or adjacent to the original gray scale image (Figure 3), with blue indicating soft tissue and red indicating stiff tissue or vice versa. 35 Shear wave elastography serves several different clinical purposes, including diagnoses of diseases of the liver and kidney, evaluation of solid breast masses, and assessing post stroke spasticity.50-54 Shear wave elastography is also feasible to assess the changes of muscle stiffness in physiologic conditions. The muscle is stiff when the muscle contracts and the muscle is soft as muscle relaxes (Figure 3). The identification of post stroke spasticity by using shear wave elastography is first established by the quantification of muscle stiffness. This is indicated by an increase in shear wave velocity within the biceps brachii and decrease in contractibility during elbow extension (muscle contraction). 53 The above findings can be extrapolated to assess for muscle spasticity, which will present as an increase in shear wave speed due to a muscle spasm (stiff). In a feasibility study, researchers observed a negative correlation between the mean SWV of a spastic biceps brachii muscle and its passive range of movement (R2 = −.88, P < .0001), indicating SWV increases as the range of motion of a spastic muscle decreases. 54 When comparing SWV to MTS and MAS, a positive correlation was observed, indicating shear wave velocity will increase with spasticity with R2 = .662, P < .001 and R2 = .536, P = .002 respectively. 55

Shear wave velocity (SWV) represents the biceps muscle stiffness can be measured with shear wave elastography. In order to ensure the quality of shear wave imaging processing to be robust, a shear wave propagation map (3a, right image, Aplio i800, Canon Medical Systems) or the quality map (3b, Acuson S3000, Siemens Medical Solutions) is displayed when measuring SWV. In healthy muscle, mean SWV measures 1.35 m/s (3c) with a 90° angle of the elbow joint relaxation (muscle relaxation) and 2.66 m/s when the elbow is 180° of full extension (3d). The change in SWV of the muscle during joint movement reflects the contractibility of the muscle.
The 2 commonly used forms of ultrasound elastography, ultrasound strain imaging, and shear wave elastography, have shown remarkable clinical adaptations. Specifically, its role in assessment of PSS is beginning to emerge. As research continues to validate its ability to effectively assess PSS, other research has shown promise in using ultrasound elastography to evaluate the treatment effects (Figure 4). After receiving BoNT-A injections in the affected biceps brachii, patients reported a quantitative improvement with increase of strain ratio and decrease of shear wave velocity (Figure 4), indicating a decrease in muscle stiffness after treatment. 21 These quantitative results were confirmed qualitatively by an increase in range of motion, decrease in MAS, and MTS scores. 21

Shear wave velocity (SWV) representing tissue stiffness was measured in an affected spastic biceps muscle at 90° of elbow relaxation (muscle relaxation). SWV measured 6.5 m/s (4a) immediately before and 1.6 m/s (4b) 4 months after Botulinum toxin-A injection treatment for upper lamb spasticity. The stiffness of the spastic muscle significantly decreased after the treatment.
Conclusion
Technological improvements have made QUS more accessible, robust, reliable, and most importantly versatile. This explains why QUS has become commonplace as a point of care tool in both developed and developing countries.56,57 QUS is feasible to provide quantitative markers in the assessment of the severity of muscle spasticity and monitor the treatment effects for PSS, which allow physicians to no longer rely on subjective tests such as the MAS and MTS in PSS management. The ability of QUS in the quantification of skeletal muscles properties and functions has potential in managing other neuromuscular and movement disorders as well. Although the research has been promising, pilot studies in a large population of post stroke spasticity to establish the diagnostic criteria and standard performance guidelines are warranted.
Footnotes
Declaration of conflicting interests:
The authors declared no potential conflicts of interest with respect to the research, authorship, and/or publication of this article.
Funding:
The authors received no financial support for the research, authorship, and/or publication of this article.
Authors’ contributions
Both Anthony Tran and Jing Gao, MD contributed to this review article.