
Abstract
Background:
Preoperative discrimination between benign and malignant ovarian tumors is important. The applicability of published prediction tools may be limited across different health systems. We aim to develop a machine learning model specifically for Macao’s population to predict the borderline or malignancy risk of ovarian masses using routinely available clinical data in Macao’s health system.
Methods:
The study cohorts were derived from 2 major hospitals in Macao, including 496 patients who underwent oophorectomy or cystectomy for ovarian masses at CHCSJ between January 2014 and December 2023, along with a simulated prospective cohort of 95 patients from CHCSJ between January 2024 and November 2024, and an external validation cohort of 61 patients from KWH between January 2020 and September 2024. Patients’ clinical information, ultrasound features, and laboratory test results before initial treatment were collected. LASSO regression was used for feature selection, and classifiers were developed using various machine learning algorithms. The predictions were compared with postoperative pathological diagnoses. The predictive performance was also compared with the RMI-4.
Results:
Age, menopausal status, 5 ultrasound features, and 7 laboratory tests were identified as predictors of borderline and malignant ovarian tumors. An ensemble learning model based on a voting classifier was selected as the final model. Our model outperformed RMI-4 in the internal test set, simulated prospective cohort, and external validation cohort, achieving an area under the curve (AUC) of 0.923–0.951 (vs 0.810–0.868, P < .05). Decision curve analysis demonstrated superior clinical utility, and SHAP analysis confirmed its interpretability.
Conclusions:
We propose a machine learning model targeting Macao’s population for predicting the borderline or malignancy risk of ovarian masses. Our model is accurate, low-cost, easily accessible, and interpretable. On the basis of no workflow changes, machine learning techniques can maximize the predictive potential of routinely available clinical data in a specific health system.
Keywords
Introduction
Ovarian tumors arise from various types of cells within the ovary, including epithelial cells, sex cord-stromal cells, and germ cells. According to the World Health Organization (WHO) tumor classification, ovarian tumors are categorized as benign, borderline, or malignant based on their pathological features. 1 Determining the nature of ovarian masses prior to surgery is crucial for developing an appropriate management strategy and surgical plan. Currently, the acceptable diagnostic tests for preoperative assessment of ovarian masses include serum markers such as cancer antigen 125 (CA125), human epididymis protein 4 (HE4), as well as ultrasound and magnetic resonance imaging (MRI). CA125 has high sensitivity for advanced ovarian cancer but poor specificity in premenopausal women, whereas HE4 offers better specificity in this group, and good sensitivity for early-stage cancers. 2 Ultrasound is usually the first-line tool for evaluating the size, structure (cystic, solid, or complex), and blood flow of ovarian masses, while MRI provides detailed images to characterize complex or indeterminate masses. Nevertheless, due to limitations such as anatomical location, rupture, bleeding, and tumor implantation, preoperative biopsy is not routinely employed. The pathological diagnosis of ovarian masses mainly relies on intraoperative frozen section analysis and postoperative pathological examination.
Since the 1990s, several tools have been proposed for predicting the risk of ovarian malignancy, including Risk of Malignancy Index (RMI),3,4 Risk of Ovarian Malignancy Algorithm (ROMA), 5 International Ovarian Tumour Analysis (IOTA) Simple Rules, 6 Copenhagen Index (CPH-I), 7 Ovarian-Adnexal Reporting & Data System (O-RADS), 8 and IOTA ADNEX. 9 These tools predict the benign or malignant nature of ovarian masses based on patients’ clinical information, serum tumor markers, and/or imaging features. In recent years, with advancements in artificial intelligence (AI), several machine learning-based models with stronger predictive capabilities have been proposed.10-12 However, the performance of these prediction tools may be influenced by factors such as ethnicity, tumor type and stage, and type of healthcare facility (eg, cancer center vs general hospital). Local validation studies are essential to identify the most appropriate tool and determine the optimal cutoff values for a specific population. 13
Macao is a special administrative region of the People’s Republic of China. The overwhelming majority (89.4%) of Macao’s population is Chinese, while the remainder consists of non-ethnic Chinese minorities, including Filipinos, Portuguese, and Vietnamese. 14 More than 70% of borderline and malignant ovarian tumors in Macao are diagnosed at an early stage (International Federation of Gynecology and Obstetrics [FIGO] stage I). To our knowledge, serum HE4 testing and specific imaging protocols are not routinely performed for patients with ovarian masses in most hospitals in Macao, thereby limiting the applicability of the aforementioned prediction tools. Additionally, the ethnicity and stage distribution of ovarian tumors in Macao may differ from those of the population on which these tools were originally developed.
To address these limitations, we attempt to develop a machine learning-based model specifically for Macao’s population, using routinely available clinical data to predict the risk of borderline or malignant ovarian masses. We also compare its predictive performance to that of the Risk of Malignancy Index 4 (RMI-4), which is one of the few prediction tools that can be retrospectively evaluated in our study cohorts. Our model aims to identify ovarian masses at high risk of being borderline or malignant, which may require additional consideration in management,15,16 and to provide an alternative tool for risk stratification before adapting the workflow of a specific health system to accommodate other prediction tools.
Materials and Methods
Statistical Analysis
Study cohorts
The study cohorts were derived from 2 major hospitals in Macao. The primary study cohort consisted of patients who underwent oophorectomy or cystectomy for ovarian masses at Conde de São Januário Hospital (CHCSJ cohort). The inclusion criteria included pathologically confirmed primary benign, borderline, or malignant ovarian tumors. The exclusion criteria were as follows: (1) physical changes such as cystic follicle or cystic corpus luteum less than 3 cm in greatest dimension, 1 (2) coexistence with other primary malignancies, (3) metastatic ovarian cancer, (4) incomplete clinicopathological information, and (5) conditions that could significantly alter laboratory test results, such as end-stage renal disease.
The CHCSJ cohort was divided into a retrospective cohort and a simulated prospective cohort, using January 1, 2024, as the cutoff point. The retrospective cohort consisted of patients treated from January 2014 to December 2023. As the total number of benign ovarian tumors was much higher than that of borderline and malignant ovarian tumors in the real world (approximately 5-7:1 at CHCSJ), for data balance consideration, all borderline and malignant cases during this period were included, whereas only benign cases from January 2019 to December 2023 were enrolled. The simulated prospective cohort included all patients with benign, borderline, and malignant ovarian tumors treated between January 2024 and November 2024.
The external validation cohort was contributed by Kiang Wu Hospital (KWH cohort), using the same inclusion and exclusion criteria, and included patients treated from January 2020 to September 2024.
As borderline ovarian tumors exhibit low malignant potential and their management differs from benign ovarian tumors,15,16 we classified borderline and malignant ovarian tumors into the same group in this study. An overview of the study cohorts was shown in Figure 1.
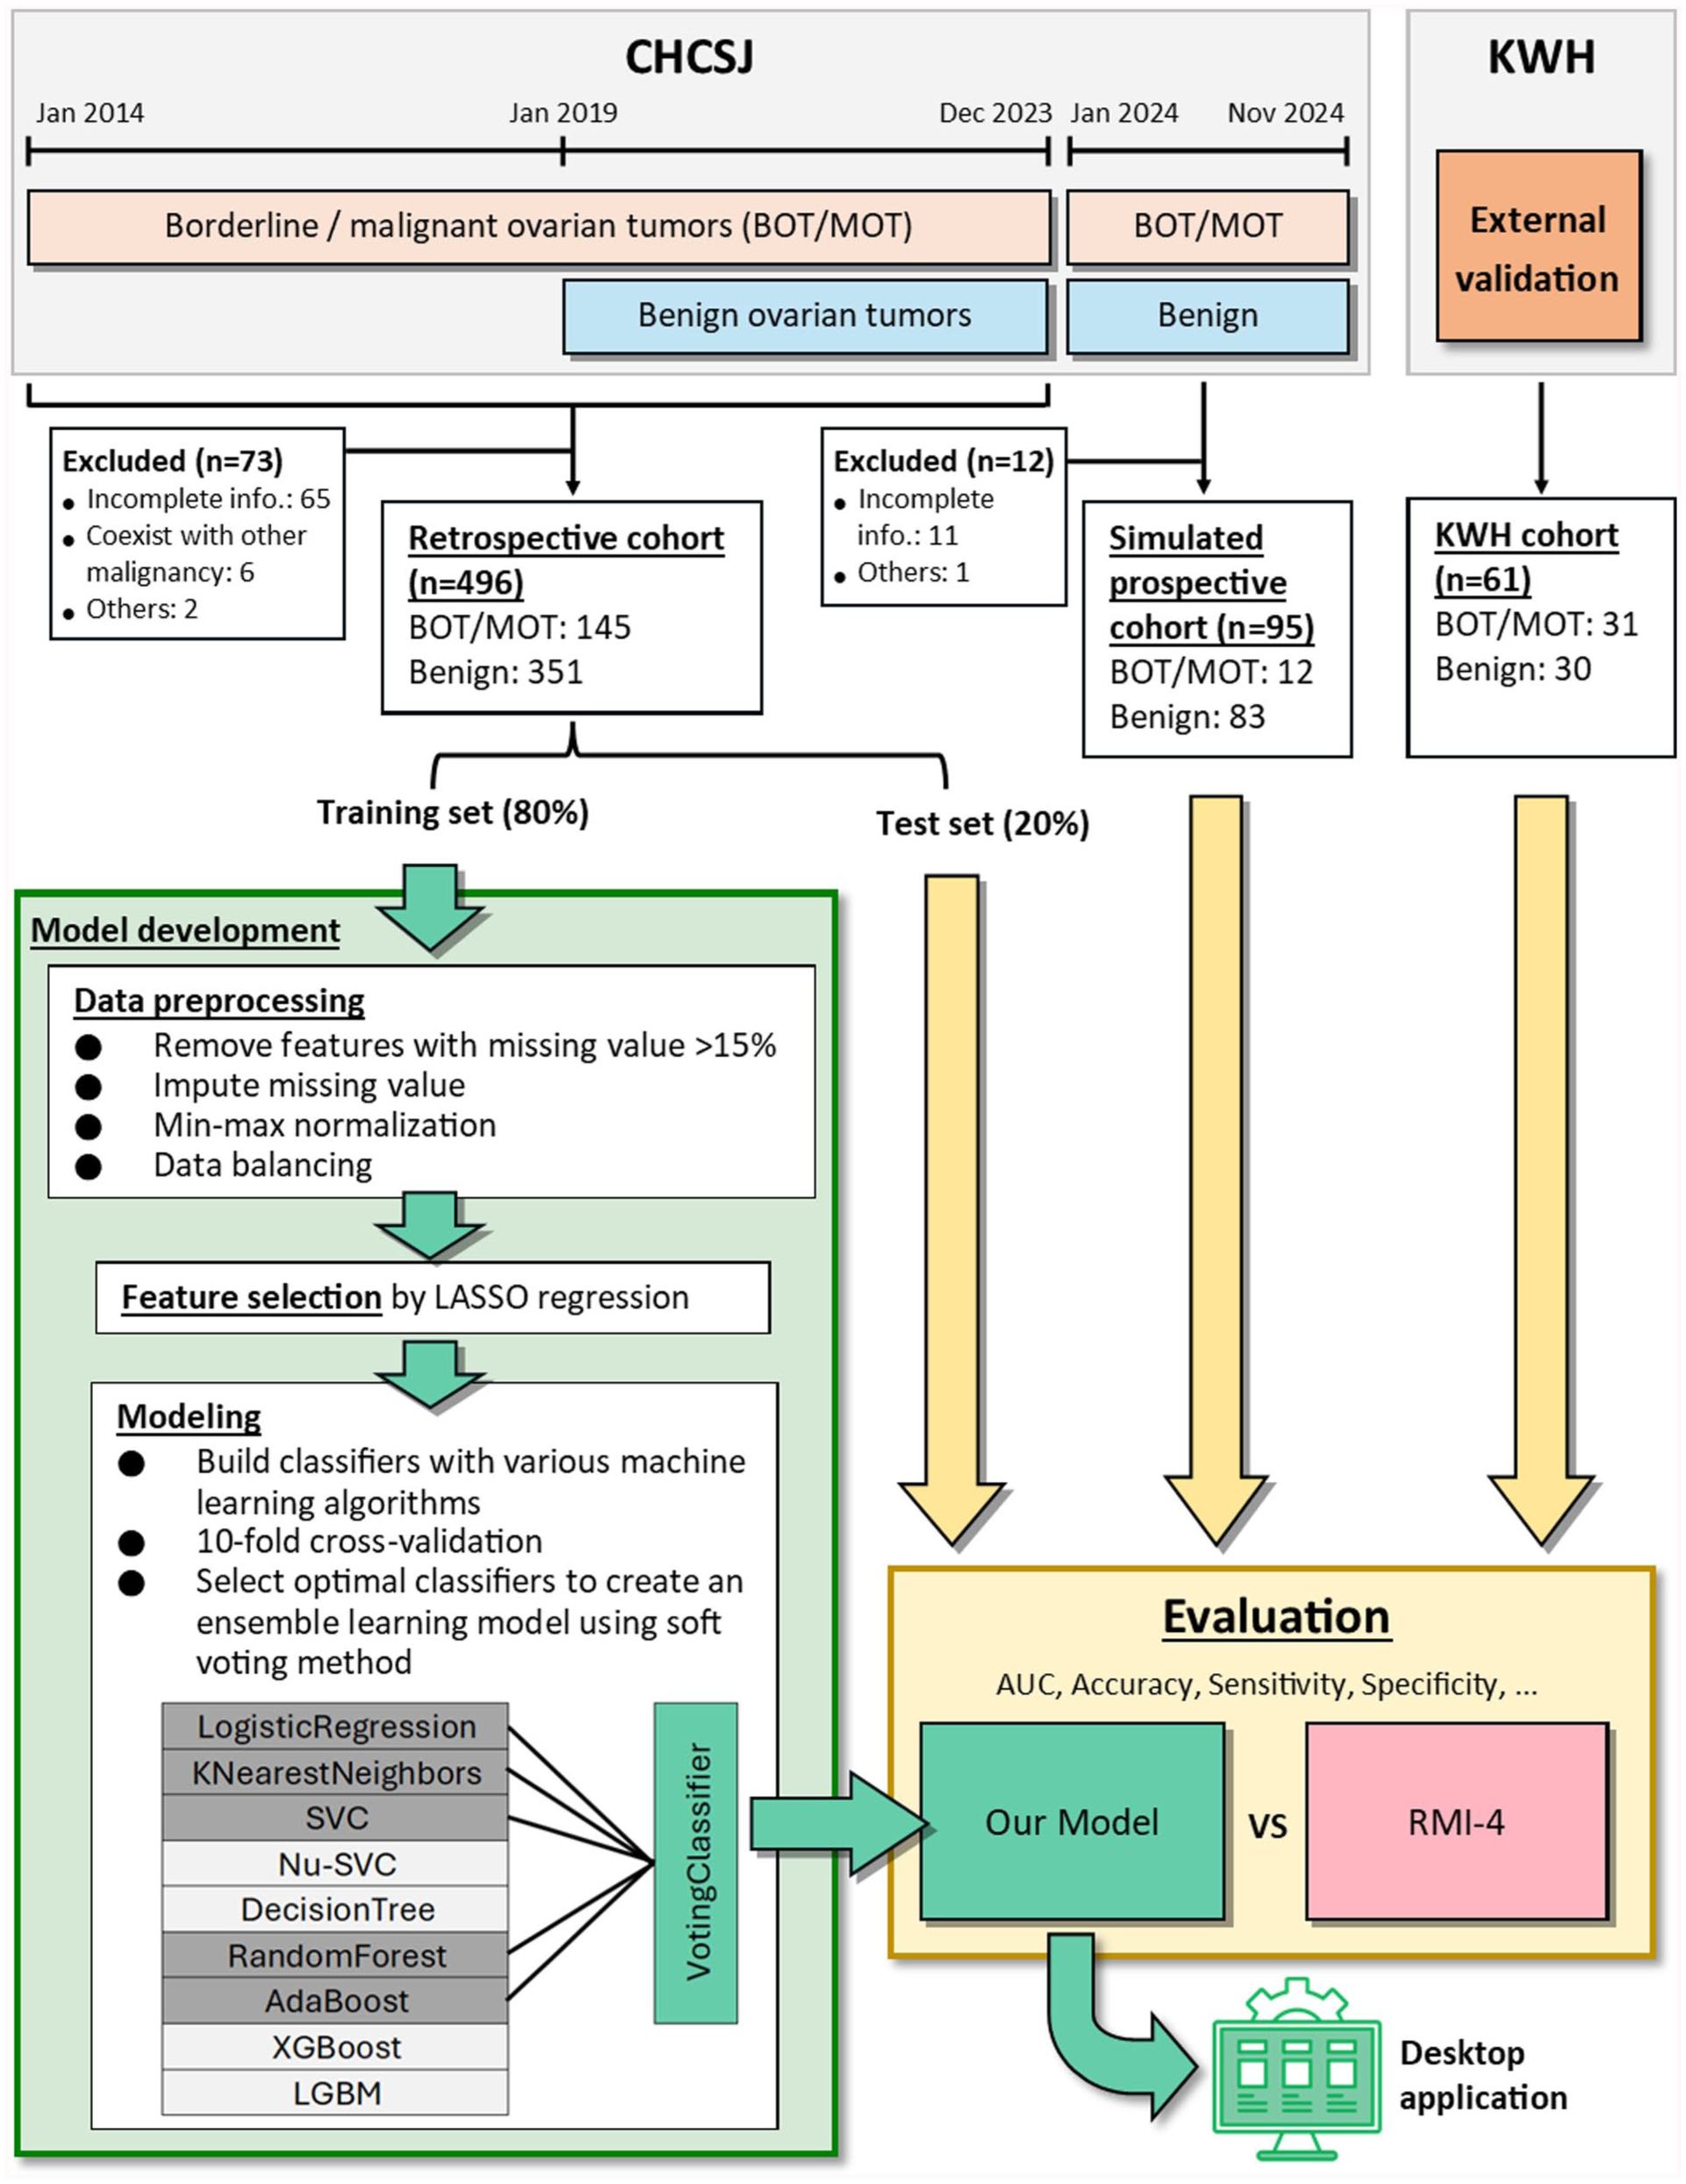
Flowchart of our model development.
Data collection
The following data were extracted from patients’ medical records: age, menopausal status, 7 ultrasound features, complete blood count, 8 biochemistry tests, 5 serum tumor markers, pathological diagnosis, and the FIGO stage. We selected the most recent results of ultrasound and laboratory tests performed before the initial operation or neoadjuvant chemotherapy. These features were routinely available for patients in Macao, and some have been reported to be associated with ovarian cancer.
Seven indexes were calculated using the following formulas: Platelet-to-lymphocyte ratio (PLR) = Platelet count (Plt)/Lymphocyte count (Lym); Neutrophil-to-lymphocyte ratio (NLR) = Neutrophil count (Neu)/Lym; Monocyte-to-lymphocyte ratio (MLR) = Monocyte count (Mon)/Lym; Systemic inflammatory response index (SIRI) = (Neu × Mon) / Lym; Systemic immune-inflammation index (SII) = (Neu × Plt) / Lym; AST-to-ALT ratio (AAR) = Aspartate transaminase (AST)/Alanine transaminase (ALT); AST/ALT-to-platelet ratio index (AARPRI) = (AST/ALT × 150)/Plt.
The RMI-4 was calculated using the formula: 4 RMI-4 = M × U × S × CA125. “M” represented menopausal status (menopause = 4, premenopause = 1). “U” was the count of presence of 6 ultrasound features (0 feature = 0, 1 feature = 1, more than 1 feature = 4). “S” represented tumor size (< 7 cm = 1, ⩾ 7 cm = 2).
The full list of features collected for analysis was shown in Supplementary Table S1. Serum HE4 and MRI features are not included in this study because they are not routinely performed in our study cohorts. Additionally, ethnicity was collected for demographic description. All data were de-identified by removing personal information including names, dates of birth, medical record numbers, and any data that would allow someone to be identified. We confirm that all methods were performed in accordance with the 1964 Declaration of Helsinki and its later amendments.
Data preprocessing and feature selection
The CHCSJ retrospective cohort was split into a training set (80%) and a test set (20%) with stratification randomly. The training set was used to develop machine learning models, while the test set, simulated prospective cohort, and external validation cohort were used to validate the final model. Features with more than 15% missing values were removed, and the remaining missing values were imputed using the mean imputation method. The data was normalized using min-max scaling method. Data balancing was performed on the training set by applying naive random over-sampling to the borderline/malignant group. Least Absolute Shrinkage and Selection Operator (LASSO) regression was applied to the training set to filter out the most relevant features.
Model development
We created classifiers using 9 classic machine learning algorithms, including logistic regression, K-nearest neighbors, support vector machine (SVC), Nu-support vector machine (Nu-SVC), decision tree, random forest, adaptive boosting (AdaBoost), 17 extreme gradient boosting (XGBoost), 18 and light gradient boosting machine (LGBM). 19 A voting classifier was also created using the relatively top-performing classifiers from various algorithms through the soft voting method. The selected features were used as input variables. The output of classifiers was either “benign” or “borderline/malignant,” ie, binary classification task. The pathological diagnosis was regarded as the ground truth label. The classifiers were first trained using 10-fold cross-validation. The hyperparameters of the classifiers were manually adjusted based on a grid search. Finally, the classifiers would be refitted on the entire training set using the best-found hyperparameters. The Transparent Reporting of a Multivariable Prediction Model for Individual Prognosis or Diagnosis-Artificial Intelligence (TRIPOD + AI) reporting guideline was followed during the development and validation of the prediction model (Please see Supplementary Material for the completed checklist). 20 The flowchart of the model development process was shown in Figure 1.
Due to security concerns, most hospital workstations were unable to access the Internet. Therefore, we developed a user-friendly desktop application that can be used offline. Clinicians can use our model on computers with restricted Internet access in clinics or wards.
Statistical Analysis
For patients’ characteristics, continuous variables were reported as mean ± standard deviation and compared using the Mann-Whitney U test. Categorical variables were stated as count (%) and compared using the chi-square test or Fisher exact test.
To evaluate predictive performance, the area under receiver operating characteristic curve (AUC), sensitivity, specificity, positive predictive value, negative predictive value, macro F1 score, and accuracy were used. The macro F1 score is defined as:
All statistical analysis was performed using R (version 4.3.1; https://www.r-project.org) and Python (version 3.11; https://www.python.org). The R package “glmnet” was used for LASSO. The Python packages “scikit-learn” (version 1.3.2), “xgboost,” and “lightgbm” were used for machine learning algorithms.
Results
Baseline characteristics
A total of 676 patients with ovarian masses were found at CHCSJ. 85 cases were excluded according to our criteria. The main reason for exclusion was missing data essential for the calculation of RMI-4 (n = 76) due to urgent operation (such as torsion or rupture) or incidentally found ovarian masses during other operations (such as Cesarean sections). Other reasons for exclusion included coexistence with other malignancies (n = 6) and markedly altered laboratory test results due to end-stage renal disease or hematopoietic disorder (n = 3). Finally, a total of 591 patients were included in the entire CHCSJ cohort, in which the retrospective cohort consisted of 496 patients (351 benign tumors, 48 borderline tumors, and 97 malignant tumors), and the simulated prospective cohort consisted of 95 patients (83 benign tumors, 7 borderline tumors, and 5 malignant tumors).
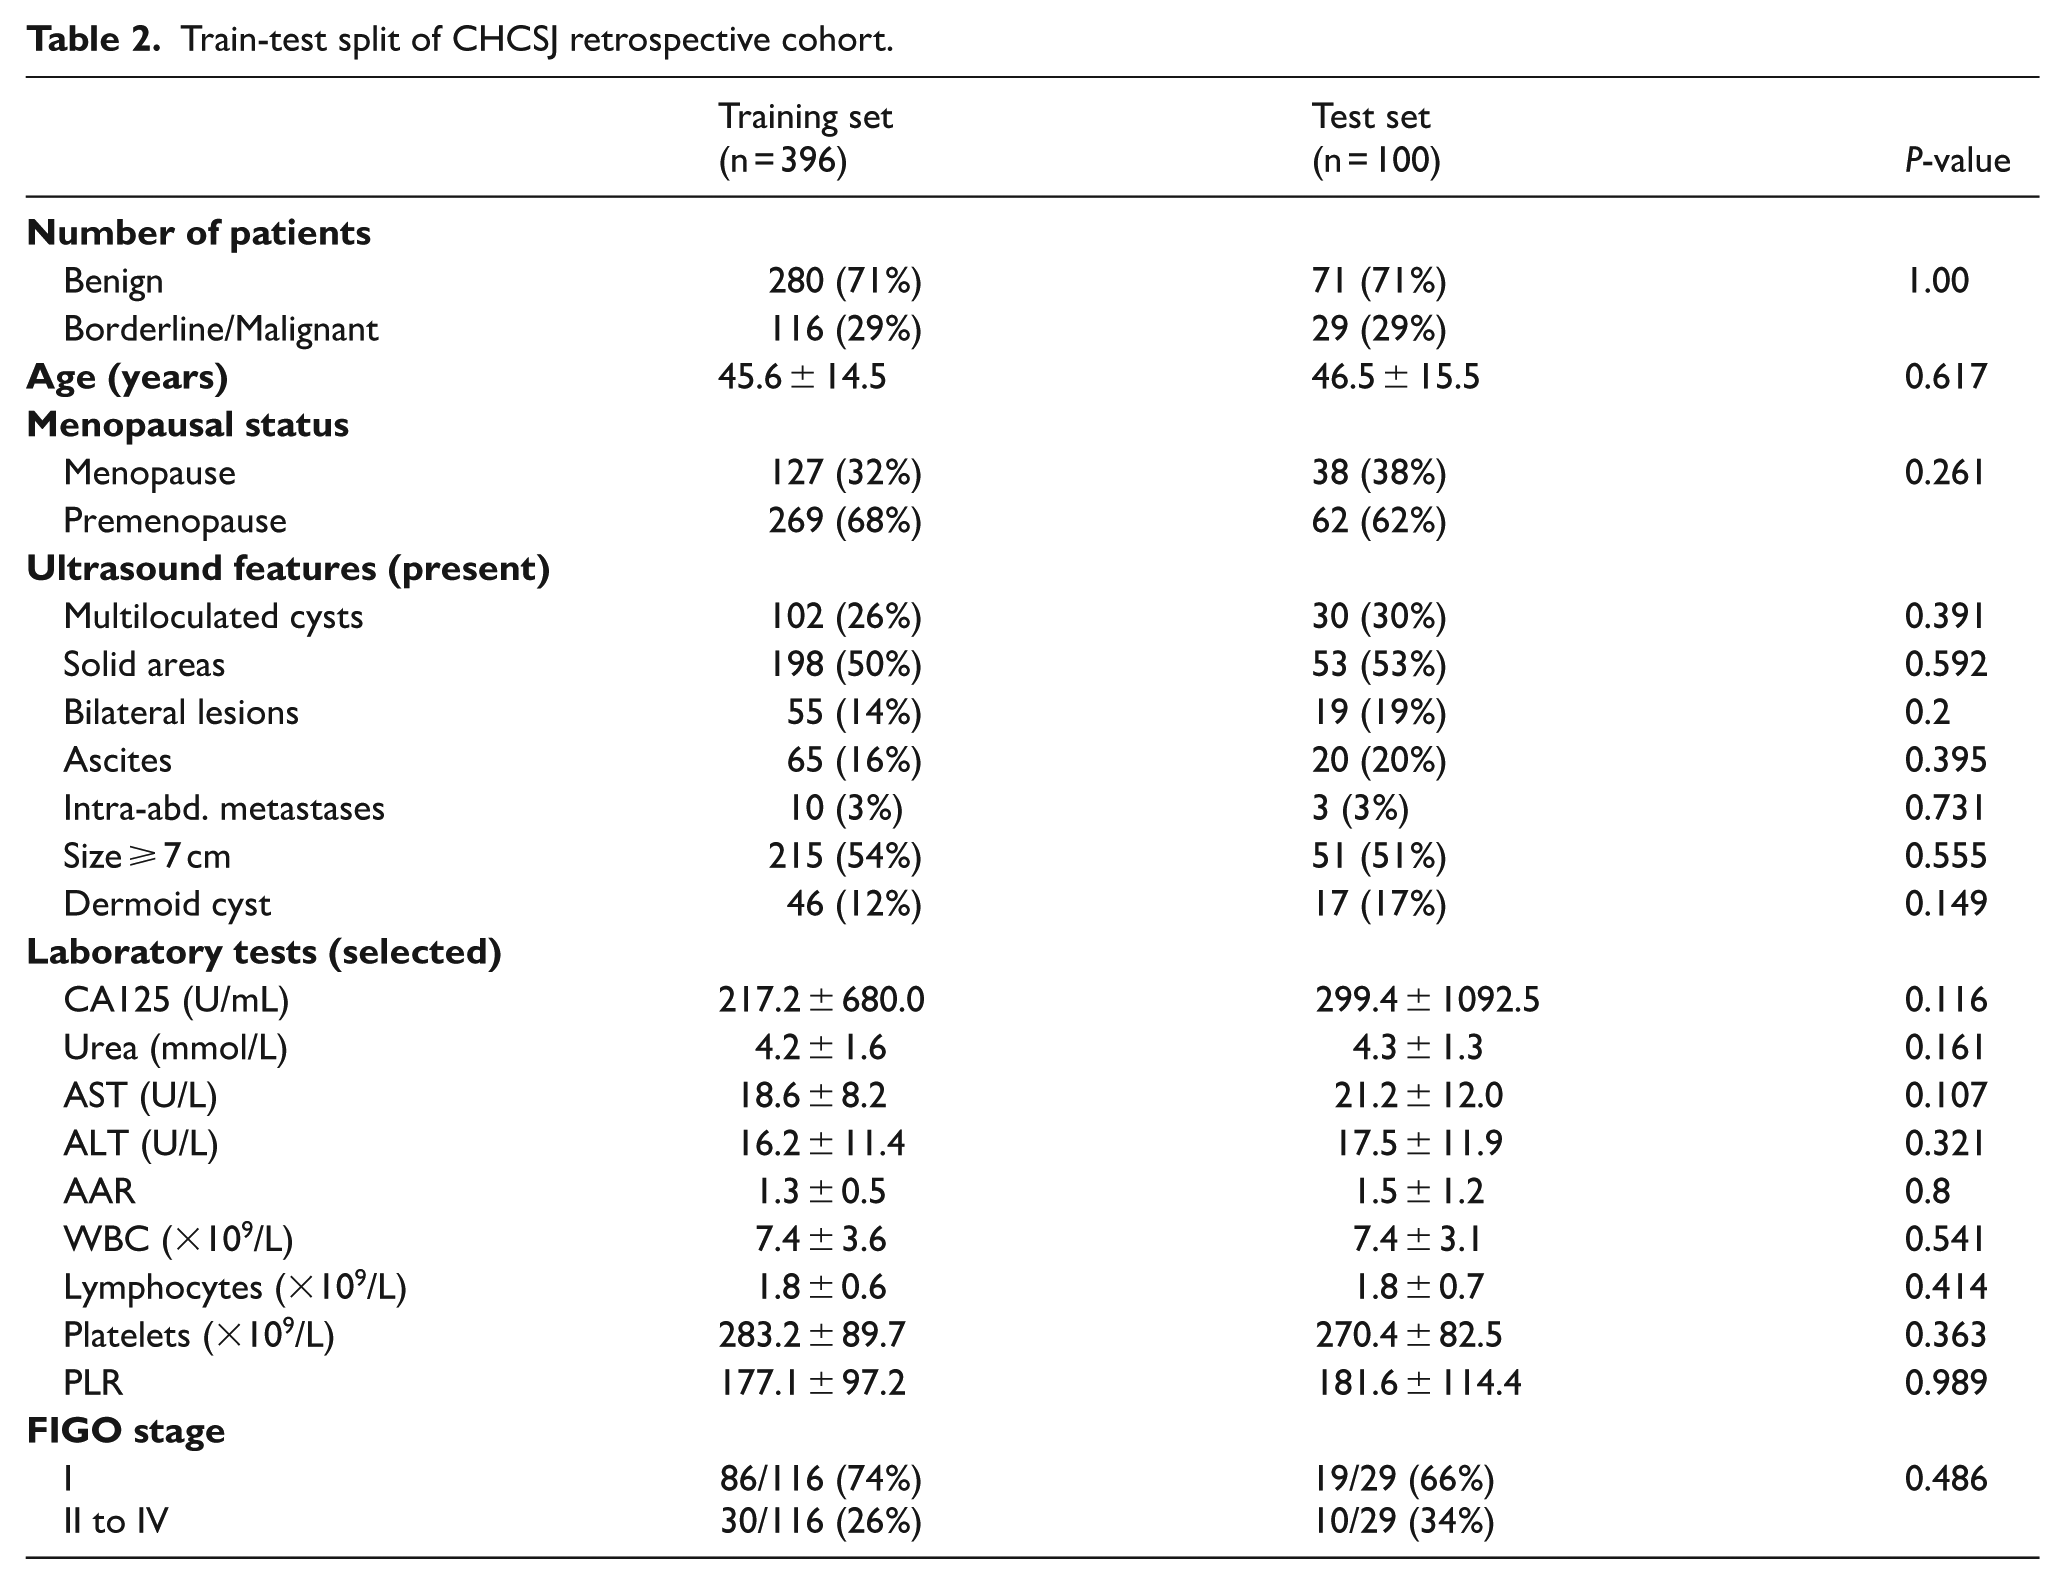
The training set and test set, which were split from CHCSJ retrospective cohort, consisted of 396 and 100 patients respectively. The training set included 280 benign tumors, 39 borderline tumors, and 77 malignant tumors, whereas the test set included 71 benign tumors, 9 borderline tumors, and 20 malignant tumors. Baseline characteristics between the training and test sets showed no significant differences in age, ethnicity, or other key clinical features. This ensured that the test set was representative of the studied population, thereby reducing potential bias.
The KWH cohort included 61 patients with ovarian masses, comprising 30 benign tumors, 14 borderline tumors, and 17 malignant tumors. The demographic and clinical characteristics of CHCSJ and KWH cohorts were summarized in Tables 1 to 3. For details of ultrasound features and laboratory test results, please see Supplementary Table S2.
Demographic and clinical characteristics of CHCSJ and KWH cohorts.

Abbreviations: AAR, AST-to-ALT ratio; ALT, alanine transaminase; AST, aspartate transaminase; BOT, borderline ovarian tumor; CA125, cancer antigen 125; PLR, platelet-to-lymphocyte ratio; WBC, white blood cell count.
Train-test split of CHCSJ retrospective cohort.
Pathological diagnoses of CHCSJ and KWH cohorts.

Features selected by LASSO regression
In the data preprocessing step, 5 features (total bilirubin, CEA, AFP, CA19-9, and CA15-3) were removed due to having more than 15% missing values in the training set. The remaining 33 features were eligible for feature selection step. Finally, 14 features relevant to distinguishing between benign and borderline/malignant ovarian tumors were identified using LASSO regression. These features included age, menopausal status, 5 ultrasound features (multiloculated cysts, solid areas, intra-abdominal metastases, tumor size ⩾ 7 cm, and suggestive of dermoid cyst), and 7 laboratory tests (CA125, Urea, ALT, AAR, WBC, Lym, and PLR).
Performance of classifiers on the training set
We used 80% of the CHCSJ retrospective cohort as the training set to develop and compare different classifiers. The AUCs of the classifiers in 10-fold cross-validation on the training set were shown in Figure 2A. Among the 9 foundation classifiers, the decision tree classifier performed the worst (0.833 ± 0.057). The average AUCs of the other 8 classifiers ranged from 0.913 to 0.958. However, no single classifier could significantly outperform all the others. We selected 5 relatively top-performing classifiers from various algorithms, including logistic regression classifier, K-nearest neighbors classifier, support vector classifier, random forest classifier, and AdaBoost classifier, to create a voting classifier. The AUC of the voting classifier in 10-fold cross-validation was 0.950 ± 0.024. For details of 10-fold cross-validation results, please see Supplementary Table S3.
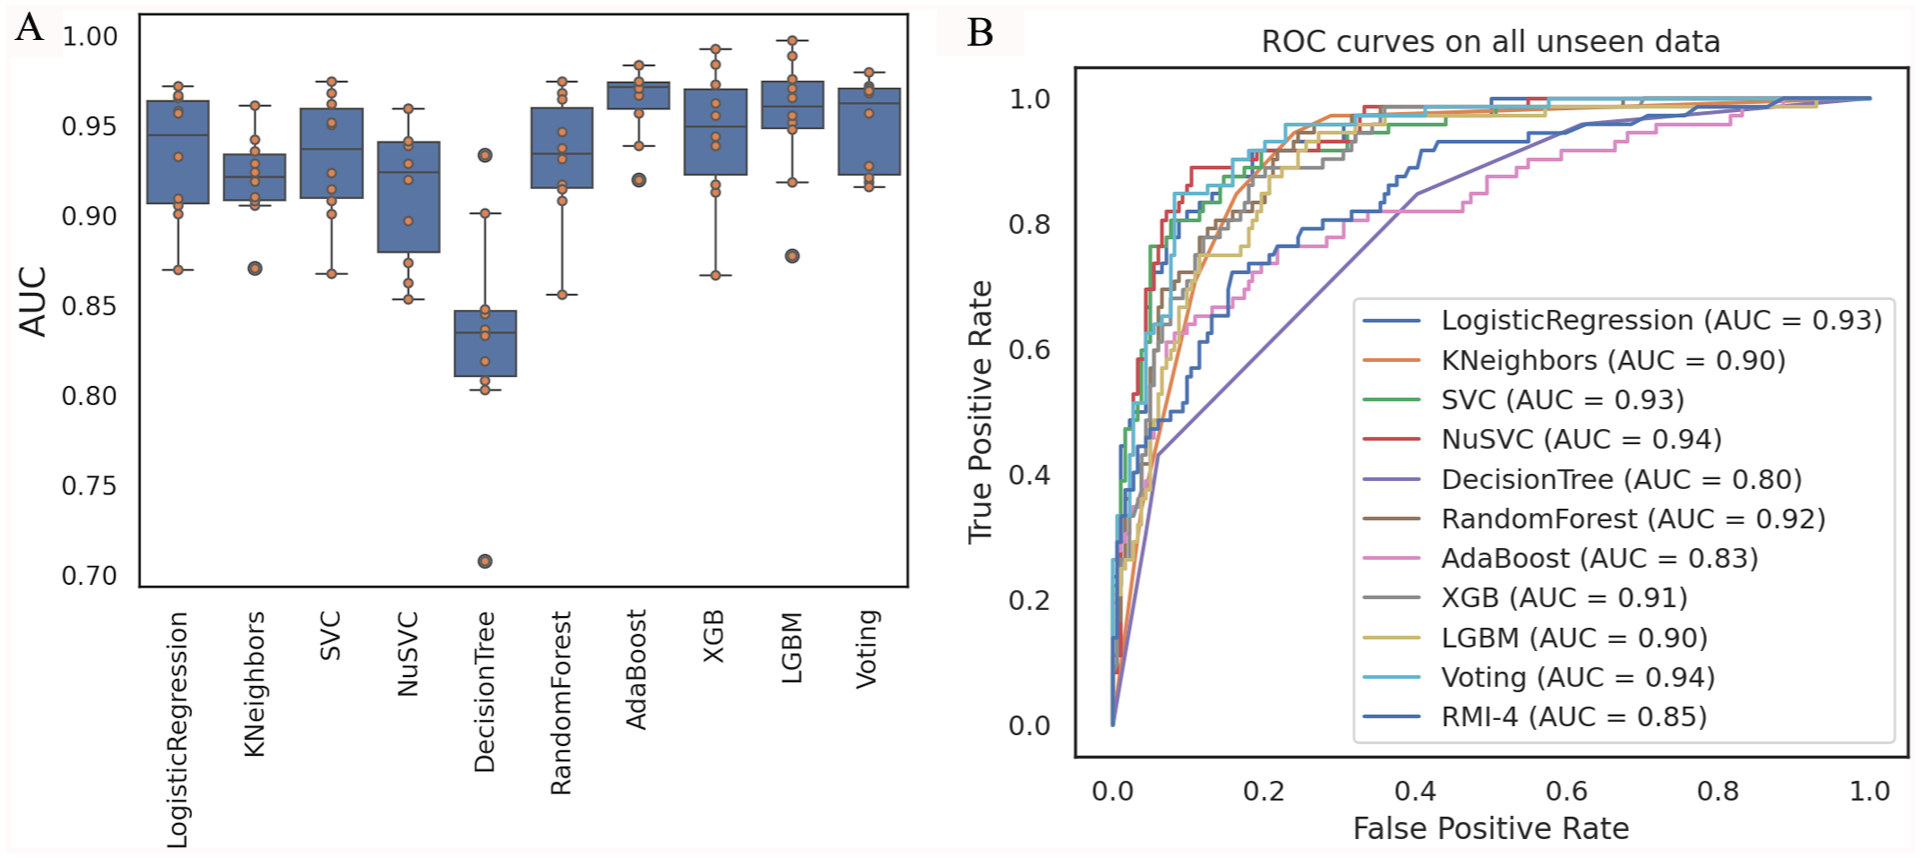
Performance of classifiers. (A) AUCs of classifiers in 10-fold cross-validation on training set. (B) ROC curves of classifiers on all unseen data.
Evaluating the predictive performance of classifiers on the test set, simulated prospective cohort, and external validation cohort
Three datasets were used to evaluate our models that were all unseen during the training process. The first dataset was the internal test set split from the CHCSJ retrospective cohort. The second dataset was the simulated prospective cohort from CHCSJ, used to assess the models’ ability to predict “future” cases. The third dataset was the external validation cohort from KWH, which was used to evaluate the generalization ability of the models and their adaptability to Macao’s population.
The ROC curves of the classifiers on all 3 evaluation datasets were shown in Figure 2B. The 3 models with the highest AUC were Nu-support vector machine classifier (0.94), voting classifier (0.94), and logistic regression classifier (0.93). Using the corresponding optimal cutoff values, their accuracies were 0.895, 0.898, and 0.844, respectively, and their macro F1 scores were 0.875, 0.876, and 0.825, respectively. Considering AUC, accuracy, and F1 score in an integrated manner, we believed that the voting classifier performed more robustly in practice. Therefore, an ensemble learning model based on voting classifier was selected as our final model. The optimal cutoff value was 0.5999, which was determined by a Youden index of 0.7657 on the evaluation data. For details of performance of classifiers on evaluation data, please see Supplementary Table S4.
The AUCs of our final model reached 0.934 (95% confidence interval [CI]: 0.879-0.990), 0.951 (95% CI: 0.909-0.992) and 0.923 (95% CI: 0.854-0.991) on the test set, simulated prospective cohort, and external validation cohort, respectively (all P-values < .05 when compared with the corresponding RMI-4) (Figure 3A to C). Using the optimal cutoff for our model and a cutoff of 450 for RMI-4, 4 our model demonstrated a superior ability in identifying borderline and malignant tumors across all evaluation datasets. Consequently, our model outperformed RMI-4 in all metrics, including sensitivity (0.774-0.917 vs 0.500-0.655), specificity (0.900-0.930 vs 0.867-0.916), positive predictive value (0.611-0.889 vs 0.400-0.800), negative predictive value (0.794-0.987 vs 0.634-0.925), macro F1 score (0.733-0.867 vs 0.444-0.704), and accuracy (0.836-0.920 vs 0.689-0.842) (Table 4).
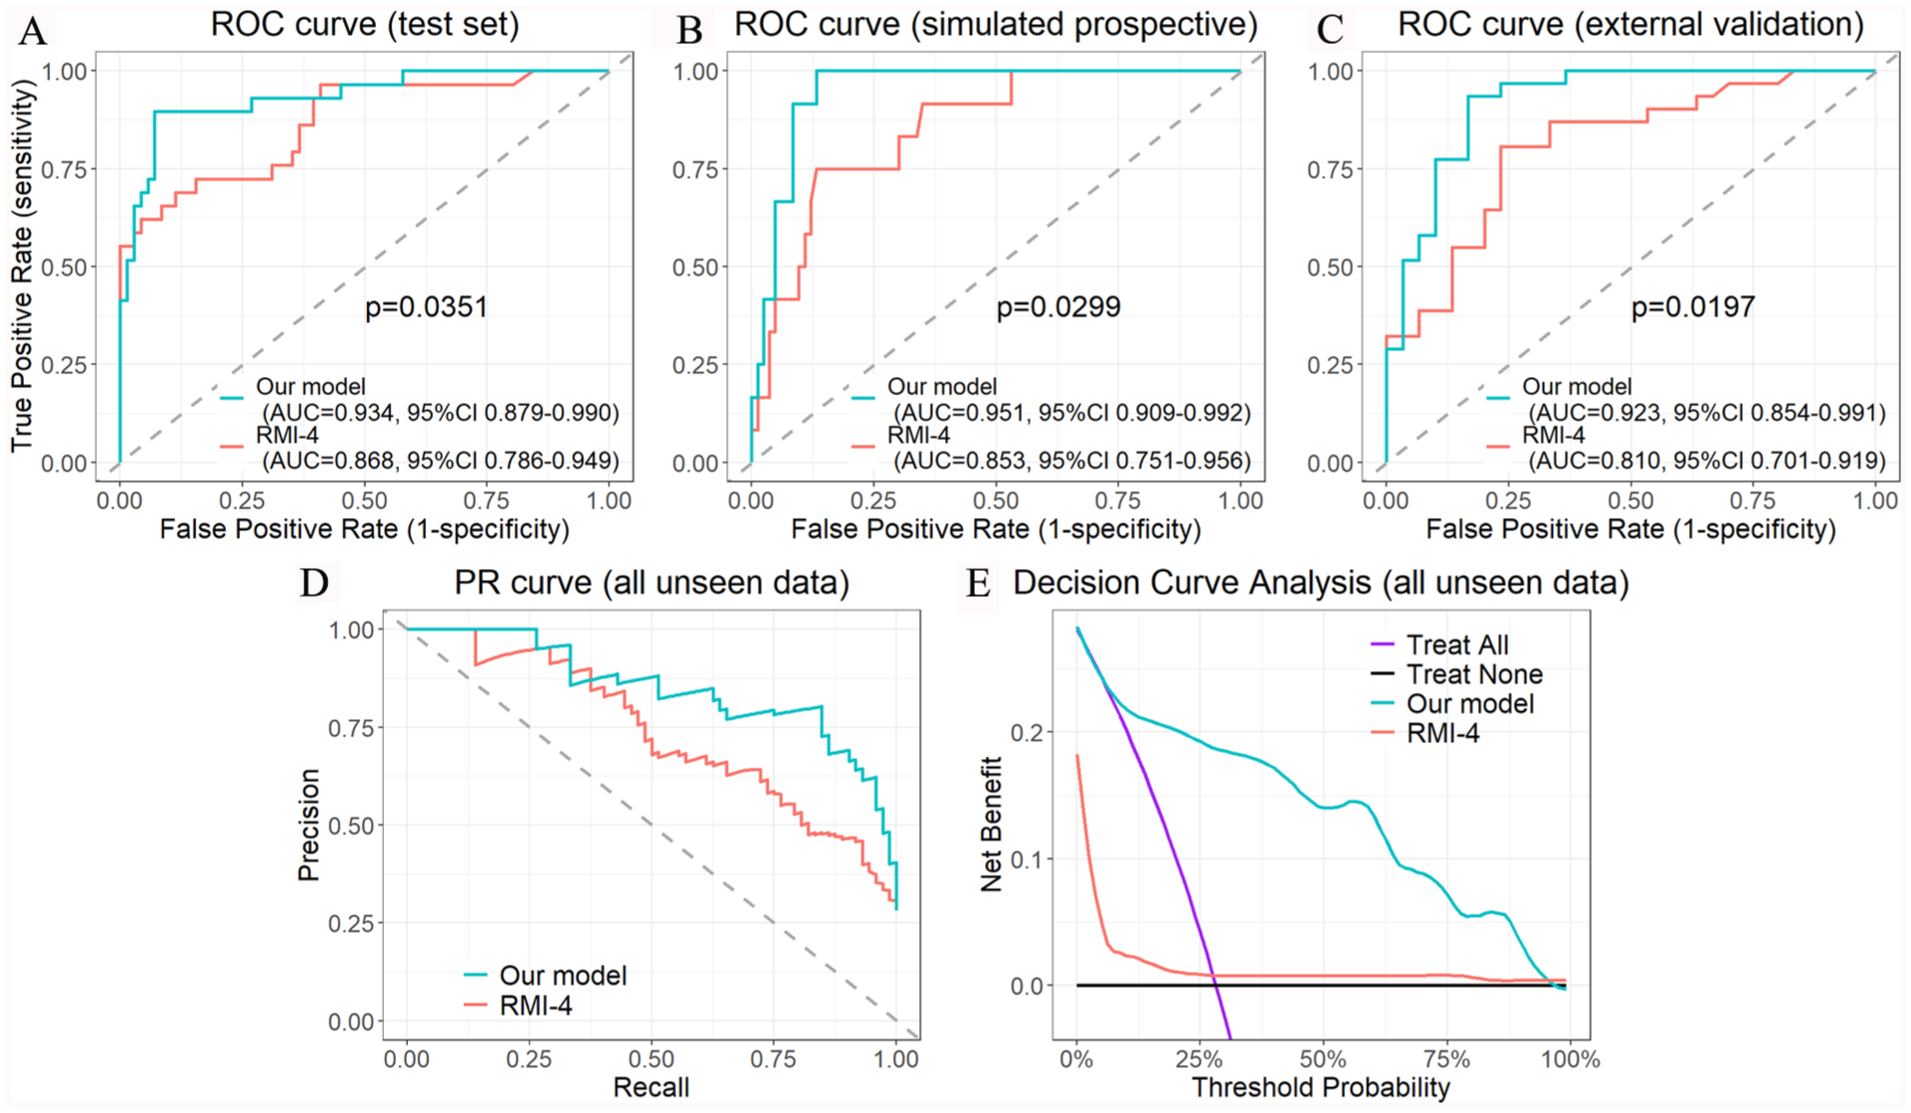
Predictive performance of our model and RMI-4. ROC curves for predicting risk of borderline/malignancy on test set, simulated prospective cohort, and external validation cohort are shown in (A) to (C), respectively. The precision-recall (PR) curve and decision curve analysis of our model and RMI-4 on all unseen data are shown in (D) and (E), respectively.
Predictive performance of our model and RMI-4 on evaluation datasets.

Abbreviations: AUC: area under the curve; NPV: negative predictive value; PPV: positive predictive value.
p-value < 0.05, Please see Figure 3A to C.
In the decision curve analysis (Figure 3E), our model demonstrated a greater net benefit across a wide range of threshold probabilities compared with the treat-all and treat-none strategies, as well as RMI-4.
Discordant cases
Among the 72 borderline and malignant tumors evaluated, 11 cases (15.3%) were incorrectly classified as benign tumors (ie, false negative) by our model. They included mucinous borderline tumor (n = 7), serous borderline tumor (n = 2), immature teratoma (n = 1), and FIGO stage I endometrioid carcinoma (n = 1). Notably, all 19 FIGO stage II to IV malignant tumors could be correctly predicted by our model. In contrast, 31 cases (43.1%) were misclassified by RMI-4, including 21 borderline tumors, 8 FIGO stage I malignant tumors and 2 FIGO stage III malignant tumors. The overall false negative rates of our model and RMI-4 were statistically significant (P < .01). By subgroup, the false negative rates of our model for borderline tumors, FIGO stage I malignant tumors, and FIGO stage II to IV malignant tumors were 30.0%, 8.7%, and 0%, respectively, whereas those of RMI-4 were 70.0%, 34.8%, and 10.5%, respectively.
Among the 184 benign tumors evaluated, the discordant predictions were 16 cases (8.7%) by our model and 19 cases (10.3%) by RMI-4. The false positive rates of our model and RMI-4 were statistically insignificant (P > .05). The discordant cases of our model included endometriotic cyst (n = 5), mucinous cystadenoma (n = 5), fibroma or fibrothecoma (n = 4), serous cystadenoma (n = 1), and mature cystic teratoma (n = 1).
Interpretability
We used SHAP (SHapley Additive exPlanations) to explain the outputs of our machine learning model. 22 Figure 4 showed the SHAP values of key features and their impacts on the model’s output. The top 5 features with the highest mean SHAP values included 4 ultrasound features and menopausal status.
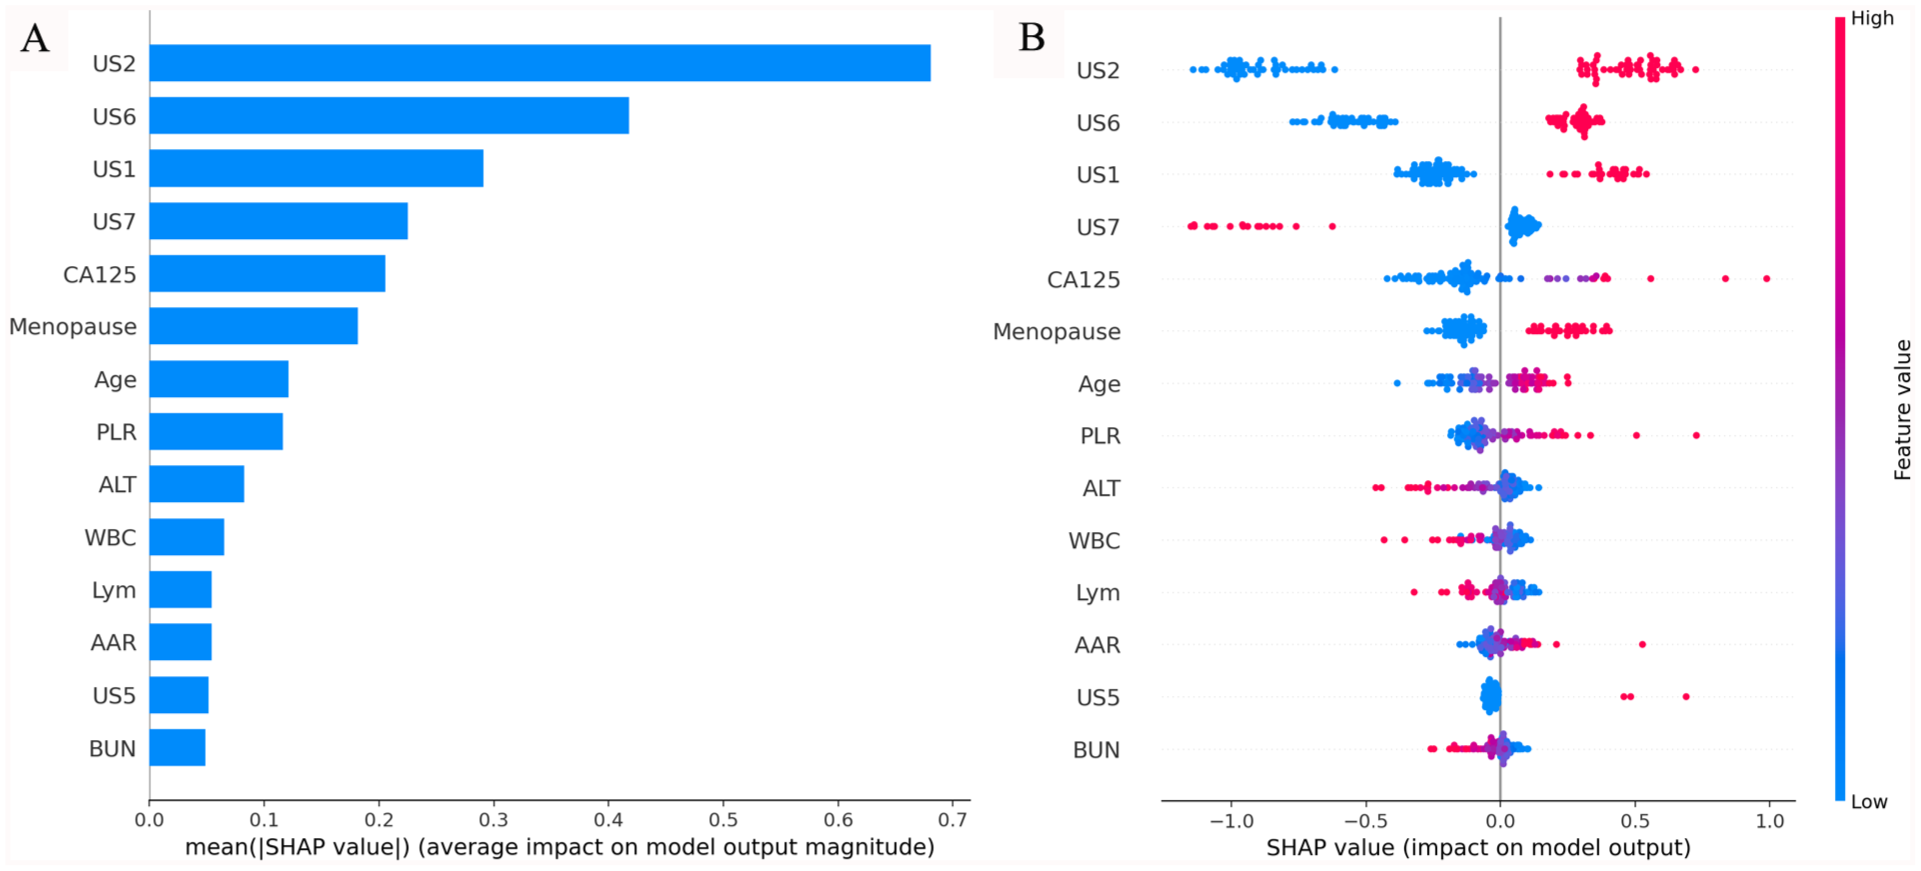
Interpretability of our model. (A) Bar plot showing the mean absolute SHAP values (ranked by their impact on the model output from top to bottom on vertical axis). (B) Beeswarm plot illustrating the distribution of SHAP values for each feature, with color indicating feature value (red for high, blue for low).
Discussion
Preoperative prediction of malignancy risk in ovarian masses is a challenging task, particularly in early-stage disease. In this study, we develop an ensemble machine learning model to predict the borderline or malignancy risk of ovarian masses specific to Macao’s population (Figure 5). Compared to RMI-4, our model exhibits superior ability in identifying borderline and malignant ovarian tumors, ie, reducing false negative cases. Our model demonstrates consistent predictive performance across the internal test set, simulated prospective cohort, and external validation cohort, ensuring its robustness and reproducibility. Stable AUC values across all datasets confirm its reliability in various clinical settings, reduce concerns about overfitting, and increase confidence in its real-world applicability. Additionally, the model achieves an ideal performance in the external validation cohort, and decision curve analysis indicates superior clinical utility. These findings support its generalizability in Macao’s population and its potential utility in clinical decision-making scenarios.

Sample case from test set. (A) RMI predicted the tumor was low risk for malignancy, whereas our model predicted it was high risk. Pathological examination of the resected ovary confirmed clear cell carcinoma, FIGO stage I. (B) SHAP demonstrated the importance of each key feature to the final prediction.
Predictors of borderline and malignant ovarian tumors
In this study, a total of 14 features were identified as predictors of borderline and malignant ovarian tumors. Among them, 6 features were used by RMI-4. Eight additional features were added, including age, 6 laboratory tests (Urea, ALT, AAR, WBC, Lym, and PLR), and ultrasound feature suggestive of dermoid cyst that was used by O-RADS score and tended to benign lesion. 8
Inflammatory biomarkers, such as platelet-to-lymphocyte ratio (PLR), have been reported to be associated with the diagnosis, tumor stage, prognosis, and treatment response of various malignancies, including ovarian cancer. 23 The potential mechanism is that ovarian cancer is associated with inflammation and changes of microenvironment, which may lead to the production of various cytokines and growth factors, finally resulting in lymphopenia, thrombocytosis, and increased PLR. 24
Liver fibrosis scores have been reported to be associated with an increased risk of gynecological cancers including ovarian cancer. The hypothesized mechanism is that non-alcoholic fatty liver disease is often associated with visceral adiposopathy, whose pathogenetic features have been proposed as tumorigenic triggers. 25 In this study, we evaluated 2 liver fibrosis markers AST-to-ALT ratio (AAR) and AST/ALT-to-platelet ratio index (AARPRI). The result showed that AAR was higher in borderline/malignant tumor group in Macao’s population, likely due to decreased ALT levels.
Serum urea has been reported to have an inverse association with renal cell carcinoma in females 26 and with overall cancer incidence. 27 Although their studies did not include ovarian cancer and the exact mechanisms were not fully understood, we did find serum urea was slightly lower in patients with borderline/malignant ovarian tumors in Macao’s population. This marker was selected by LASSO regression as one of the key features for prediction.
Ensemble learning and interpretability
Traditional machine learning approaches often rely on a single learning algorithm to make predictions based on a given dataset. However, these standalone models may suffer from limitations such as bias, overfitting, or high variance, which can impact their predictive performance. Ensemble learning has emerged as a powerful technique to address these challenges and improve the accuracy and stability of predictive models. 28 In this study, we found that the performance of the voting classifier was more robust than that of other classifiers on unseen data. This finding demonstrated that the ensemble learning model may have an advantage in this task.
Despite these advances, the opaque nature of AI decision-making—commonly referred to as “black box AI”—remains a significant barrier to clinical adoption. To address this, we used SHAP to explain the inner workings of our model and enhance interpretability. For instance, in the case shown in Figure 5B, SHAP analysis revealed that solid morphology and mass size were primary contributors to a high-risk prediction, whereas the absence of multilobulated morphology, mild elevation of CA125, and premenopausal status were associated with a low-risk prediction. This level of transparency supports clinical decision-making by clarifying the rationale behind risk stratification and fostering trust in model outputs.
In this study, we found that the mean SHAP values of ultrasound features were generally higher than those of laboratory tests (Figure 4), suggesting that imaging features may play a more prominent role in predicting borderline and malignancy risk in Macao’s population. Based on this, we hypothesized that the laboratory test-based prediction tools may be less accurate for Macao’s population, especially serum HE4 was missing in most patients. However, further validation studies are needed to prove this hypothesis.
Clinical implication
Unlike other recently published machine learning models, which use stronger clinical indicators such as HE4 and O-RADS score, as well as multimodal data fusion, our model uses basic laboratory tests and simple imaging features. In clinical practice, implementing new prediction tools often requires changes to the workflow, such as collecting additional clinical information, adding new laboratory test items, digitizing hardcopy photos, applying specific imaging protocols, providing additional training, and upgrading hardware. The trade-off between accuracy, cost, and accessibility is a critical consideration in the real world, particularly in public health systems. Before adapting the workflow of a specific health system to accommodate stronger prediction tools, using machine learning techniques to maximize the predictive potential of routinely available clinical data may offer a relatively low-cost, simple, and accessible solution to clinical problems.
The limitations of our study include: (1) the total number of cases in our cohorts is relatively small; (2) this is a bi-classification model, and the study cohorts are insufficient for effectively training a multi-classification model (ie, benign versus borderline versus early-stage malignancy versus advanced-stage malignancy); and (3) because some essential markers are missing in most patients in Macao, we are unable to conduct a head-to-head comparison between our model and other published prediction models retrospectively.
In the future, we will continue optimizing our model, conducting further validation and prospective studies, and exploring its clinical applications as a triage tool for determining which ovarian masses can be operated on by general gynecologists and which require gynecologic oncologists, determining the priority of elective surgery, and guiding the necessity of intraoperative frozen section analysis.
Conclusion
In this study, we established a population-specific ensemble machine learning model for predicting the borderline or malignancy risk of ovarian masses. Our model showed superior ability in identifying borderline and malignant ovarian tumors, with AUC values significantly exceeding those of RMI-4. Our model exhibited consistent predictive performance across all evaluation datasets. Decision curve analysis demonstrated superior clinical utility, and SHAP analysis confirmed its interpretability. Our model may serve as a potential triage tool. On the basis of no workflow changes, using machine learning techniques to maximize the predictive potential of routinely available clinical data in a specific health system may offer a relatively low-cost and accessible solution to clinical problems.
Footnotes
Acknowledgements
Not applicable.
Author Contributions
Declaration of Conflicting Interests
The authors declared no potential conflicts of interest with respect to the research, authorship, and/or publication of this article.
Funding
The authors received no financial support for the research, authorship, and/or publication of this article.
Supplemental Material
Supplemental material for this article is available online.
Data Availability Statement included at the end of the article.
Ethical Considerations
This study was approved by the Medical Ethic Committee at Conde de São Januário Hospital, Macao SAR, China (003/MEC/N/2025), and the Research Ethic Committee at Kiang Wu Hospital, Macao SAR, China (KWH 2024-025).
Consent to Participate
Written informed consent was waived by both ethic committees as this is a retrospective study using anonymized data collected during routine clinical care without altering patient management. We confirm that all methods were performed in accordance with the 1964 Declaration of Helsinki and its later amendments.
References
Supplementary Material
Please find the following supplemental material available below.
For Open Access articles published under a Creative Commons License, all supplemental material carries the same license as the article it is associated with.
For non-Open Access articles published, all supplemental material carries a non-exclusive license, and permission requests for re-use of supplemental material or any part of supplemental material shall be sent directly to the copyright owner as specified in the copyright notice associated with the article.