
Abstract
Background:
Hepatocellular carcinoma (HCC) is associated with poor prognosis and high mortality. Notchless homolog 1 (NLE1) is an important WD40 protein. Although several studies have shown that NLE1 is dysregulated in cancer, the function in hepatocarcinogenesis remains unclear.
Methods:
We screened for dysregulated WD40 proteins in HCC using data from the GSE5364 and GSE19665 datasets. A risk prediction model associated with WD40 proteins was constructed based on the TCGA database and validated with independent datasets (ICGC, GSE116174, and GSE14520). The significance of NLE1 was assessed using a genome-wide CRISPR screen and multiomics data from TCGA, CPTAC, multiple GEO datasets, and the single-cell dataset GSE166635. We further evaluated NLE1 expression in patient tissue microarrays. Kaplan−Meier plots, Cox regression analyses, and receiver operating characteristic (ROC) curves were used to evaluate the prognostic relevance of NLE1. Logistic regression was performed to analyse the associations between NLE1 expression and the clinical features of patients with HCC. Drug sensitivity to NLE1 was evaluated using organoid assays. Proliferation assays (CCK-8 and colony formation assays) were used to assess the effect of NLE1 on HCC cell growth.
Results:
We developed a risk prediction model based on WD40 proteins, which revealed significant differences in tumour immune cell infiltration between the high-risk and low-risk groups. In addition, high NLE1 expression was strongly associated with poor prognosis in HCC patients. Through organoid response characterization, we also found a significant correlation between NLE1 expression and sensitivity to the small molecules 17-AAG, AZD7762, and JQ1. Finally, enrichment analysis and proliferation assays confirmed that elevated NLE1 expression promotes HCC cell proliferation.
Conclusion:
NLE1 is an independent diagnostic and prognostic biomarker that promotes the proliferation of HCC.
Introduction
Hepatocellular carcinoma (HCC) is the third leading cause of cancer death worldwide. 1 The elevated mortality rate and unfavourable prognosis associated with HCC are attributed to a multitude of factors, including the absence of early symptoms, diagnosis at an advanced stage, a high rate of recurrence postresection, and a dearth of early diagnostic instruments.2,3 Consequently, the exploration of potential biomarkers and therapeutic targets is of paramount importance for improving the diagnosis and treatment modalities for HCC.
WD40 proteins are a large family of proteins characterized by the presence of WD repeats, 4 which play crucial roles in various cellular processes, including signal transduction, transcriptional regulation, and protein-protein interactions.4-8 Among these proteins, Notchless homolog 1 (NLE1) interacts with WDR12 as a midasin-binding molecule and plays a crucial role in ribosome synthesis and maturation. 9 Notably, recent studies have demonstrated that NLE1 regulates tumour cell cycle progression through activation of the E2F1-mediated CDK1 pathway. Furthermore, deletion of SMAD4 leads to c-MYC-mediated upregulation of NLE1, which promotes the growth and metastasis of colorectal cancer.10-12 However, the role and clinical significance of NLE1 in HCC remain unclear.
In this study, we developed a predictive model based on WD40 proteins and validated its accuracy across multiple datasets. Specifically, we found that NLE1 was significantly different from other dysregulated WD40 proteins, as evidenced by prognostic analysis and CRISPR screening, further confirming that NLE1 is a novel and promising biomarker for HCC. Our findings indicate that high expression of NLE1 in HCC is strongly associated with poor prognosis, as supported by both bioinformatics analyses and clinical data. Functional assays confirmed that NLE1 promotes the malignant proliferation of HCC cells, and pathway enrichment analyses suggested that NLE1 plays a pivotal role in tumour progression. In addition, we observed a significant correlation between NLE1 expression and sensitivity to small-molecule inhibitors, including 17-AAG, AZD7762, and JQ1, highlighting its therapeutic potential. In conclusion, our findings position NLE1 as an independent diagnostic, prognostic, and therapeutic target for HCC.
Materials and Methods
Model construction and validation
STAR-counts data and clinical information of liver hepatocellular carcinoma (LIHC) patients were downloaded from the TCGA repository (https://portal.gdc.com), and ICGC (https://dcc.icgc.org/releases/current/Projects). The GSE14520 (n = 221) and GSE116174 (n = 64) datasets were obtained from the GEO database. The log-rank test used for Kaplan-Meier survival analysis, and survival differences between 2 or more groups were compared as previously described. A time ROC analysis was conducted to ascertain the discriminative ability of the predictive model. The R software ‘glmnet’ package was used to perform the least absolute shrinkage and selection operator (LASSO) regression algorithm for feature selection.13-15 P value < 0.05 was considered statistically significant.
Correlation analysis between expression and prognosis
Kaplan-Meier survival analysis, univariate and multivariate Cox analysis, and receiver operating characteristic (ROC) curve analysis were performed using the ‘survival’, ‘survminer’, and ‘survival ROC’ R software packages. The significance of these differences was analysed using unpaired Student t tests.
Construction and validation of column line diagrams
Columnar plots, which translate complex statistical models into contour plots, are an effective method for predicting survival in patients with LIHC. Risk score, age, sex, primary tumour site, and metastatic status were used to construct plots based on the prognostic characteristics of immune-related genes using the ‘rms’ and ‘survival’ R packages. In addition, calibration curves were used to assess the predictive probability of differentiating patient groups in the column maps.16-18 The Benjamini−Hochberg (B-H) false discovery rate (FDR) was used as a correction to control for multiple comparisons.
Immunohistochemistry analysis
As previously reported.19,20 Immunohistochemistry (IHC) data for liver and HCC tissues were obtained from the Human Protein Atlas (HPA, https://www.proteinatlas.org/).
Immunization score
TRNA sequencing expression profiles and corresponding clinical information on LIHC were downloaded from TCGA. The pheatmap package in R software was used to plot multi-gene correlations. Correlations between quantitative variables without a normal distribution were described using Spearman correlation analysis.21,22 P-values less than 0.05 were considered statistically significant (*P < 0.05).
Single-cell sequencing data collection and processing
The LIHC single-cell GSE166635 dataset was downloaded. The data were downscaled using the UMAP method and clustered using the ‘KNN’ method with a resolution of 1.0. The cells were then annotated with different cell surface markers. On the basis of the single-cell sequencing data, the ‘CellChat’ R software package was used to evaluate NLE1 expression in multiple cell types.23,24
Drug sensitivity analyses
The relationship between NLE1 expression and drug sensitivity was assessed using multiomics data derived from organoid models and high-throughput drug screening results (Supplementary Table S1). The Liver Cancer Carcinoid Organoid Biobank (LICOB) is a publicly available resource that provides integrated genomic, transcriptomic, and pharmacological profiles of liver cancer organoids, enabling comprehensive analysis of tumour heterogeneity and therapeutic response. 25 The LICOB dataset can be accessed at http://www.cancerdiversity.asia/LICOB/.
Functional enrichment analysis
Gene set enrichment analyses were performed between the NLE1-H (NLE1-High) and NLE1-L (NLE1-Low) clusters of the TCGA database to identify KEGG pathways. All analyses were conducted using the ‘clusterprofiler’ and ‘enrichplot’ statistical software packages. 26 The R software GSVA package was used to analyse, choosing parameter as method ‘ssgsea’. The correlation for analysis, and the parameters were chosen according to the ‘ssgsea’ method. The correlations between genes and pathway scores were analysed by Spearman correlation.27-29 P < 0.05 and FDR < 0.05 were considered statistically significant.
Cell culture
PLC/PRF/5 (TCHu119; Shanghai Cell Bank) cells were maintained in RPMI-1640. Huh7 (FH0075; FuHeng Biology) and Hep3B (FH0861; FuHeng Biology) cells were cultured in DMEM. HepG2 (ATCC HB-8065; RRID: CVCL_0027) and HEK293T (ATCC CRL-3216; RRID: CVCL_0063) cells were authenticated by the ATCC. The cells were cultured in a humidified incubator with 5% CO2 at 37°C and maintained in DMEM (Gibco) supplemented with 10% FBS (fetal bovine serum), 1% (vol/vol) penicillin-streptomycin (Beyotime Biotechnology). All cell lines were identified by STR. Routine screening for mycoplasma was performed by PCR.
Plasmid transfection
Plasmid transfection was performed as previously reported. 30 Briefly, the full-length sequence of NLE1 (NM_018096) was cloned and inserted into the pLvx-IRES-Puro vector and sgNLE1 12 was constructed inserted the pLenti-EF1a-T2A-U6-gRNA vector. Polyethylenimine (PEI) (Polysciences) was then used with the packaging plasmids pSPAX2, pMD2.G mixed with 3flag-NLE1, sgNLE1, cas9 transfect 293 T cells individually. Viral supernatants were collected 48 hours after transfection. Hep3B/PLC, and Huh7/HepG2 cells were infected with concentrated viruses in the presence of polybrene (8 µg/ml). Stably transformed cells were screened with puromycin (1 µg/ml).
Western blot analysis
Western blot analysis was performed as described previously. 30 Briefly, for protein extraction, cell and tissue samples were placed in lysis buffer (50 mM Tris-HCl (pH 7.4), 150 mM NaCl, 50 mM NaF, 1 mM EDTA (ethylenediaminetetraacetic acid), 1 mM Na2P2O4, 1 mM Na3VO4, 1 mM PMSF (phenylmethanesulfonyl fluoride) and proteinase inhibitor cocktail (Sigma, St Louis, Missouri, USA) for 30 minutes at 4°C and then centrifuged at 12000 × g for 15 minutes, after which the protein supernatant was collected. A Bradford protein assay kit (Sangon Biotech, Shanghai, China) was used to measure the total protein concentration. Proteins were separated by SDS-PAGE (sodium dodecyl sulfate-polyacrylamide gel electrophoresis; 12%) and transferred onto PVDF membranes (Millipore, Ireland), which were blocked with 5% skim milk at room temperature for 1 hour and then incubated with primary antibody. The antibody used was as follows: NLE1 (1:500, sc-377142; Santa Cruz, Shanghai, China), Actin (1:5000, 66009-1-Ig; Proteintech, Wuhan, China). After the membranes were probed with primary antibodies and secondary antibodies, they were washed 3 times with TBST (Tris-buffered saline with Tween 20). For western blot analysis, β-actin was used as a loading control for protein normalization. Quantitative analysis was performed using ImageJ.
Cell proliferation and colony formation assay
It was performed as described previously. 31 Hep3B, PLC, Huh7, and HepG2 cells were seeded into 96-well plates at a density of 2000 cells/well for 0, 24, 48, 72, and 96 hours. Then 10 µL of CCK-8 solution (c0005; TargetMol) was added to each well. After 2 hours of incubation, the cell viability was determined at 450 nm. For the colony formation assay, stable cells were constructed and seeded into 6-well plates at a density of 1000 cells/well. After 6 days of cultivation, the cell colonies were fixed with 4% paraformaldehyde (Sigma) for 15 minutes at room temperature, stained with 0.1% crystal violet for 10 minutes, washed 2 times with PBS (phosphate buffered saline) and counted using an inverted microscope.
Dependency data
The dependency data used in this manuscript are from the public Avana 24Q2 dataset and include dependency data for 18443 genes from 1150 cancer cell lines across 28 lineages. We also used expression data from the Cancer Cell Line Encyclopedia (CCLE). These data are available online at https://depmap.org/portal/download/all/. Gene expression TPM (Transcripts Per Million) values of the protein-coding genes were calculated for DepMap cell lines. The median dependence of each gene in liver cancer was subtracted from that in all other cancer cell lines to calculate the median genetic dependence enrichment.
Statistical analysis
Statistical analysis was performed using Graph Pad Prism 8.0 (GraphPad, San Diego, California). The results are provided as the mean ± SD unless otherwise specified. The differences between groups were analysed by unpaired Student t test. P value < .05 (*P < 0.05; **P < 0.01; ***P < 0.001) was considered to indicate statistical significance.
Results
Development of a risk modelling model associated with WD40 proteins in the TCGA-LIHC cohort
To identify WD40 proteins associated with the prognosis of HCC patients, we analysed HCC data from the GSE5364 and GSE19665 datasets and identified 25 differentially expressed genes (DEGs), as shown in the workflow diagram (Figure 1A). We subsequently utilized absolute shrinkage and selection operator (LASSO) regression analysis to select the most potent prognostic genes from the assortment of 25 dysregulated WD40 proteins. Ultimately, 10 genes were selected based on the optimal λ value ascertained by the minimum criteria (Figure 1B and 1C). The genes were as follows: notchless homologue 1 (NLE1), cell division cycle 20 (CDC20), TLE family member 4 (TLE4), coronin 1A (CORO1A), paraoxonase 1 (PON1), peptidylglycine alpha-amidating monooxygenase (PAM), integrin subunit alpha 2 (ITGA2), CMT1A duplicated region transcript 1 (CDRT1), ribosomal RNA processing 9 (RRP9), and transducin beta-like 1 X-linked (TBL1X). These results suggest that these dysregulated WD40 proteins are closely related to the prognosis of HCC patients.

Identification of DEGs associated with WD40 proteins for developing a risk model using the TCGA-LIHC cohort. (A) Workflow Diagram for Screening WD40 proteins. (B, C) LASSO coefficient curves and regression models for 10 genes in the TCGA cohort. Cross-validation was performed in the LASSO regression model to select tuning parameters. Horizontal coordinates indicate log(λ) values and vertical coordinates indicate partial likelihood deviations. (D) Risk score, survival status, and expression level analysis of 10 candidate genes in the TCGA training cohort. (E) Survival analyses of risk scores in the TCGA training cohort (H: high-risk score; L: low-risk score). (F) ROC analysis of risk scores in the TCGA training cohort.
To characterize these dysregulated WD40 proteins in terms of prognosis, we developed a prognostic risk profile model based on the TCGA-LIHC cohort. Patients were stratified into high-risk and low-risk categories on the basis of the median risk score. The results indicate that patients within the high-risk group possess a comparatively elevated risk of mortality and a reduced survival duration. The expression profiles of each gene associated with the WD40 proteins were significantly different between the 2 cohorts (Figure 1D). The Kaplan-Meier survival curves demonstrated a significantly better survival outcome for patients in the low-risk group than for those in the high-risk group (Figure 1E). Time-dependent receiver operating characteristic (ROC) curves were used to evaluate the prognostic significance of dysregulated WD40 gene risk profiles for overall survival (OS), with areas under the curve (AUC) of 0.794 at 1 year, 0.78 at 3 years, and 0.619 at 5 years (Figure 1F).
Validation of risk signatures for dysregulated WD40 proteins in the ICGC and GEO cohorts
To further validate the models described above, our study incorporated 240 cases from the International Cancer Genome Consortium (ICGC), 221 cases from the GSE14520 dataset and 64 cases from the GSE116174 dataset as external validation data. Ten survival-related genes were extracted from the expression array. The risk scores for the samples within both validation cohorts were evaluated by the same algorithm utilized for TGCA-LIHC. The datasets from the ICGC and GEO revealed the modelled distribution patterns of OS-related risk across the study populations. Heatmaps depicting the expression profiles of WD40 protein-associated risk factors that were correlated with liver cancer prognosis revealed discernible trends between the low-risk and high-risk groups within the validation cohort. Intriguingly, our analysis revealed that the probability of survival for the high-risk category was markedly lower than that for the low-risk category across both validation cohorts, ICGC/GSE116174 and GSE14520 (Supplementary Figure S1A to 1C). We subsequently constructed time-dependent ROC curves to evaluate the prognostic efficacy of the WD40 protein-associated risk profile within the validation cohort (Supplementary Figure 1D to 1F). As shown, the AUCs were 0.794, 0.807, and 0.858 for 1, 3, and 4 years, respectively, in the ICGC cohort (Supplementary Figure 1G). The AUCs were 0.876, 0.772, and 0.851 for 1, 3, and 5 years, respectively, in the GSE116174 cohort (Supplementary Figure 1H). The AUCs were 0.673, 0.710, and 0.680 for 1, 3, and 5 years, respectively, in the GSE14520 cohort (Supplementary Figure 1I). This risk model revealed a significant disparity in immune cell infiltration between the high-risk and low-risk cohorts in the TCGA cohort (Supplementary Figure S2A to 2F). Collectively, these findings substantiate the robust predictive capacity of our model within the external validation cohorts.
NLE1 is highly expressed in HCC
To identify novel targets for the treatment of HCC, we investigated dysregulated WD40 protein expression and patient prognosis. We accessed the Cancer Cell Line Encyclopaedia (CCLE), 32 which revealed that most WD40 proteins are highly expressed in HCC (Figure 2A). Furthermore, we explored the Cancer Dependent Mapping (DepMap) database.33-35 The results of the CRISPR knockout (KO) functional screening revealed that the expression of CDC20 and NLE1 was the most significant (Figure 2B and 2C). In addition, the expression levels of NLE1 and CDC20 among the 10 candidate WD40 proteins were strongly correlated with the prognosis of patients with HCC (Supplementary Figure S3A).

NLE1 is highly expressed in HCC. (A) Transcript levels of the WD40 proteins in the HCC CCLE. The red line represents the median transcript level of the entire CCLE panel. (B) Gene effects of CRISPR KO screen WD40 Proteins in 27 HCC cell lines. Larger negative values indicate greater sensitivity to KO. Each cell line is represented by a circle symbol and the median gene effect for all cell lines is represented by a red line. (C) Cumulative gene of the median gene effect in the DepMap CRISPR KO dataset. Gene Effect scores derived from CRISPR knockout screens published by Broad Achilles and Sanger SCORE projects. Negative scores imply cell growth inhibition and/or death following gene knockout. (D) Expression of NLE1 mRNA in multiple cancers based on GSE45364. (E) Expression of NLE1 mRNA in multiple cancers based on GSE54236. (F) NLE1 expression levels were analysed in the GSE76427 dataset. (G) NLE1 expression levels were analysed in the GSE19665 dataset. (H) NLE1 expression levels were analysed in the GSE5364 dataset. (I) Liver and HCC tissue NLE1 IHC in patient tissue microarrays. Data from Human Protein Atlas (HAP, https://www.proteinatlas.org). (J) NLE1 protein expression levels in normal and HCC tissues from CPTAC samples (n = 165). Z-values indicate the standard deviation from the median across samples for specific cancer types. (K. L) UMAP-based unbiased clustering analysis of NLE1 expression in HCC GSE166635. Cells were coloured according to clustering features.
To determine the expression of NLE1, we analysed independent cohort GEO datasets including GSE45346 (Figure 2D), GSE54236 (Figure 2E), GSE76427 (Figure 2F), GSE19665 (Figure 2G) and GSE5364 (Figure 2H). The results suggested that NLE1 was highly expressed in HCC tissues compared with normal tissues. Moreover, the TCGA results revealed high levels of NLE1 expression in most of the tumours, including adrenocortical carcinoma (ACC), bladder urothelial carcinoma (BLCA), cholangiocarcinoma (CHOL), colon adencarcinoma (COAD), esophageal carcinoma (ESCA), head and neck sequamous cell carcinoma (NHSC), kidney chromophobe (KICH), kidney renal papillary cell carcinoma (KIRP), lung adencarcinoma (LUAD), lung squamous cell carcinoma (LUSC), pheochromocytoma and paraganglioma (PCPG), prostable adencarcinoma (PRAD), rectum adencarcinoma (READ), stomach adencarcinoma (STAD), and LIHC (Supplementary Figure S3B). In addition, we examined the protein expression of NLE1. The NLE1 was hardly expressed in normal tissues, whereas it was significantly highly expressed in the tissues of HCC patient samples (Figure 2I). The scoring of protein expression in the patient samples (n = 165) also revealed that NLE1 was highly expressed in the tumours (Figure 2J). Furthermore, to investigate the impact of NLE1 expression on tumorigenesis, we examined the cellular constituents within tumour tissues using the GSE166635 single-cell dataset (Figure 2K and 2L). The results revealed that NLE1 was expressed at higher levels in HPC-like (hepatic progenitor cells) and malignant cells than in other cell types (Supplementary Figure S4B). As positive controls KRT19 and EPCAM were used as positive controls (Supplementary Figure S4C and S4D).
High NLE1 expression is associated with poor prognosis
To assess the significance of NLE1 expression in HCC, we investigated its associations with the pathological features of HCC. The results revealed that NLE1 expression increased progressively with different pathological stages of the lesions (Figure 3A). TCGA data confirmed that LIHC histological grade was significantly and positively correlated with NLE1 expression (Figure 3B). To characterize the relationship between NLE1 and pathological malignant progression of HCC, we analysed samples from patients with different pathological stages in the GSE6764 dataset. The results revealed that NLE1 was expressed at a low level in the early stage of hepatocarcinogenesis and at a high level in the late stage, suggesting that NLE1 may be an early marker of HCC (Figure 3D). In particular, we tested the alpha-fetoprotein (AFP) levels in patients with clinical HCC and found that the levels were significantly greater in HCC patients with high NLE1 expression than in those with normal expression. In conclusion, these results suggest that NLE1 is a potential biomarker (Figure 3C).
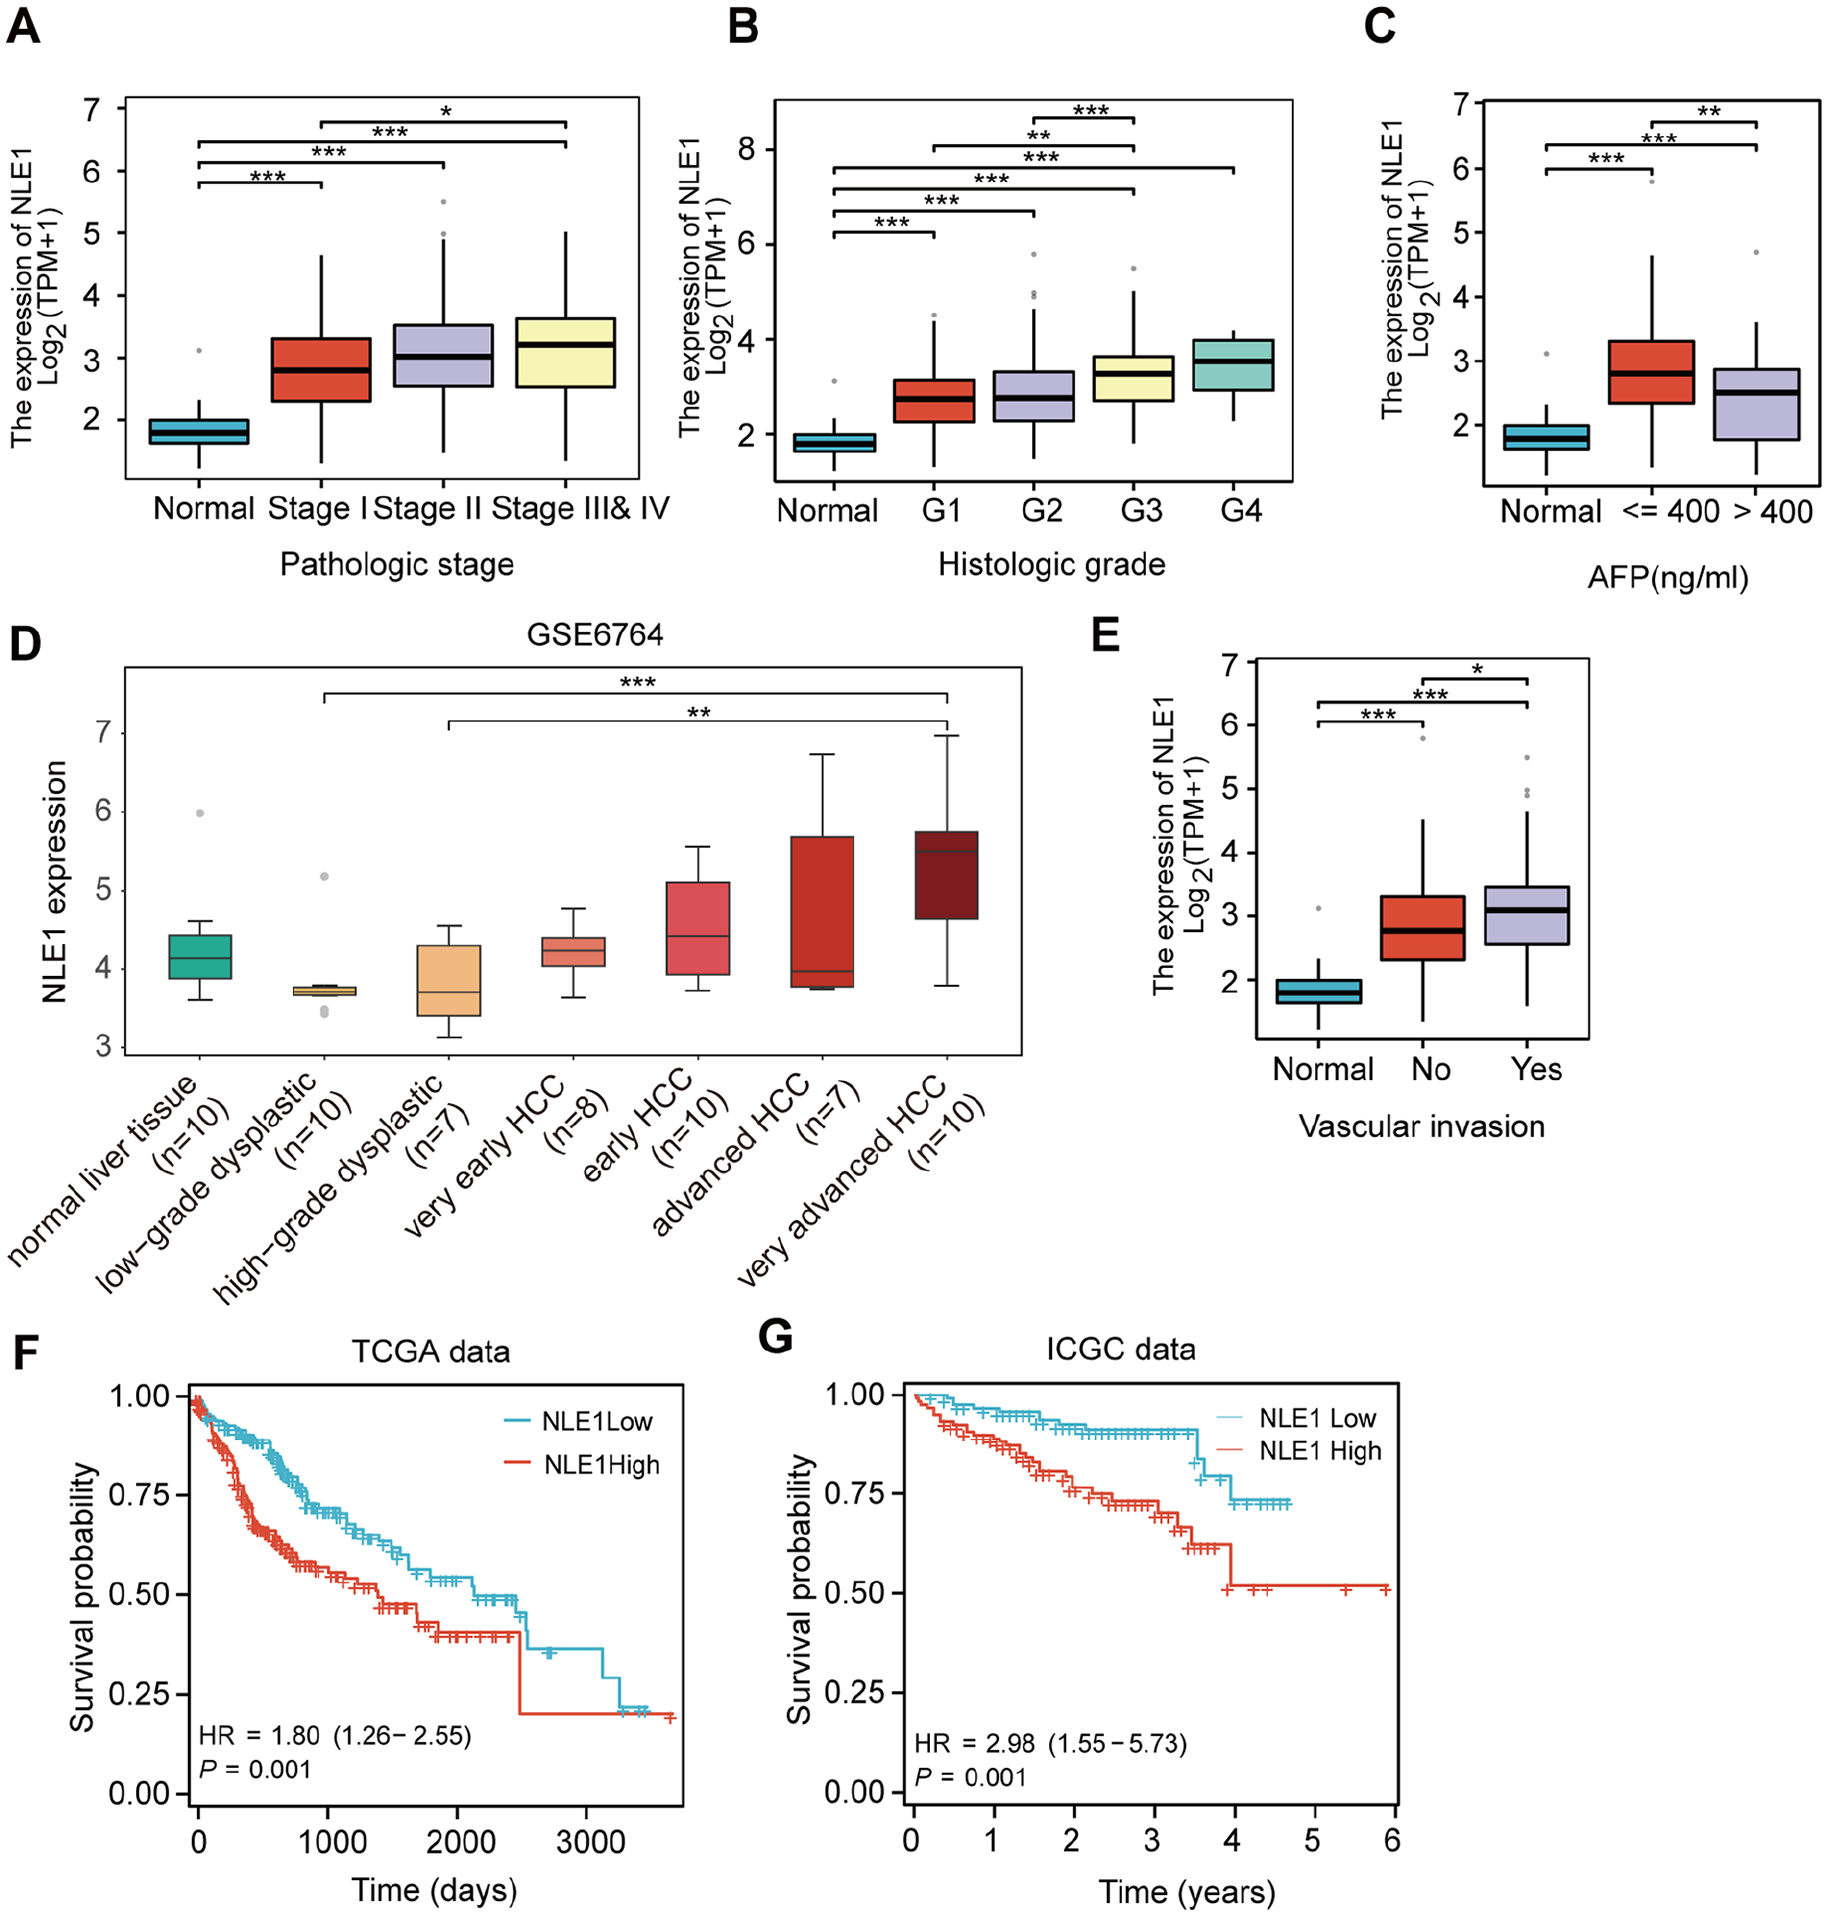
High level of NLE1 expression was significantly associated with poor prognosis in HCC. (A) The correlation between NLE1 expression and HCC pathological staging. (B) The correlation between NLE1 expression and Histologic grade. (C) Correlation analysis between NLE1 expression and AFP expression level in TCGA patients. (D) Expression levels of NLE1 at different stages of HCC development based on GSE6764. (E) The correlation between NLE1 expression and vascular invasion. (F) Kaplan-Meier plotter analysis of NLE1 expression and prognostic survival based on TCGA. (G) Kaplan-Meier plotter analysis of NLE1 expression and prognostic survival based on ICGC.
Furthermore, NLE1 expression was significantly positively correlated with vascular invasion (Figure 3E). Kaplan-Meier survival curve analysis revealed that elevated NLE1 mRNA expression was correlated with decreased survival in patients with HCC (Figure 3D), and ICGC analysis revealed similar results (Figure 3F). In conclusion, these results suggest that high NLE1 expression is significantly associated with poor prognosis.
NLE1 as an independent diagnostic factor for HCC
To evaluate the viability of NLE1 as a clinically independent prognostic diagnostic factor, we established a significant correlation between tumour stage and NLE1 expression via both univariate and multivariate Cox regression analyses based on OS data (Figure 4A and 4B). A prognostic model was developed, integrating patient demographics such as age and sex, along with TNM stage and NLE1 risk score, to create a comprehensive prediction plot (Figure 4C). Calibration curves predicting the 1-year, 3-year, and 5-year survival rates revealed that the survival rates predicted by the prediction map closely matched the actual survival outcomes (Figure 4D). The multimetric ROC curves suggested an AUC of 0.93 for the prediction map (Figure 4E). The AUC was 0.704 for the 1-year prediction map and 0.624 for the 3-year prediction map (Figure 4F). The time-dependent prognostic ROC and calibration curves for the ICGC-based histogram risk scores also revealed significant results (Figure 4G). In conclusion, the results indicate that NLE1 has high predictive accuracy in terms of age, pathological grade and stage and can be a valuable diagnostic factor for HCC.

Independent prognostic value of NLE1. (A) Unit stepwise regression for NLE1 in K-M Plotter. (B) Multivariate analysis based on clinical characteristics of NLE1 expression in the TCGA dataset. (B) Univariate and Multivariate analysis of clinical characteristics in the TCGA. (C. D) Survival analyses of column chart risk scores (H: high-risk score; L: low-risk score). (E) Diagnostic ROC and calibration curves for histogram risk scores based on TCGA. Predicted outcome (dichotomous): Tumour vs Normal (where reference group: Normal). (F) Time-dependent prognostic ROC and calibration curves for histogram risk scores based on TCGA. (G) Time-dependent prognostic ROC and calibration curves for histogram risk scores based on ICGC.
NLE1 drug sensitivity analysis and potential for clinical applications
To investigate the therapeutic potential of NLE1, we employed a patient-derived organoid (PDO) model of HCC to evaluate the ability of NLE1 to predict drug responsiveness among HCC patients, utilizing a cohort of 76 drugs (Figure 5A). Initially, we scrutinized the alterations in NLE1 expression at both the transcriptional and translational levels in liver cancer organoids after treatment with 76 chemotherapeutic agents or small-molecule compounds (Supplementary Figure S5A, S5B, and Table S1). The analysis revealed a pronounced correlation between NLE1 expression and treatment with compounds such as AGG17, AZD7762, and JQ1, suggesting that NLE1 is sensitive to certain agents (Figure 5B and 5C), offering significant therapeutic insights.

Correlation of NLE1 expression with clinical marker and drug sensitivity analysis. (A) Screening of model plots of NLE1 expression and drug response in HCC. (B) Response of NLE1 protein expression in PDO under 76 chemotherapeutic agents or small-molecule treatments based on Labao analysis. (C) Response of NLE1 mRNA expression in PDO to 76 chemotherapeutic agents or small molecules based on Labao analysis. (D) Correlation of NLE1 expression in TCGA with GPC3, a clinical marker for HCC. (E) Correlation of NLE1 expression in TCGA with the HCC clinical marker HSP90AA1. (F) Correlation of NLE1 expression in TCGA with the HCC clinical marker AFP.
Moreover, we analysed the correlation between NLE1 expression and clinical markers of HCC. We found that NLE1 expression was significantly positively correlated with HSP90AA1 and GPC3 (Figure 5D and 5E). More interestingly, HSP90AA1 is an already reported target of AGG17, which supports our results. In addition, we observed a significant correlation between NLE1 and AFP expression (Figure 5F). This evidence suggests that NLE1 can be used as a diagnostic and prognostic marker for HCC.
NLE1 promotes the proliferation of HCC cells
To further investigate the function of NLE1, we examined the DEGs between the NLE1 low-expression and high-expression groups on the basis of the TCGA-LIHC dataset. The results revealed that 812 of these DEGs were upregulated and that 570 were downregulated (Supplementary Figure S6A). A heatmap of genes positively and negatively correlated with NLE1 expression in HCC was generated (Supplementary Figure S6B). We performed KEGG (Kyoto Encyclopedia of Gene and Genomes) and GO (Gene Ontology) enrichment analyses on these DEGs. GO analysis revealed that NLE1 significantly promoted tumour cell proliferation and inhibited apoptosis (Supplementary Figure S6C, S6D, S6E). KEGG analysis of the NLE1 high-expression group revealed enrichment mainly in the IL-17 signalling pathway, cAMP signaling pathway, stem cell proliferation etc (Supplementary Figure S6F). KEGG and GO analysis of the NLE1 low-expression groups revealed DEGs involved in metabolic pathways, the cell cycle and cell adhesion, and so on (Supplementary Figure S6G and S6H).
To investigate the role of NLE1 in HCC, we analysed the effect of NLE1 on proliferation. NLE1 expression levels were measured in various HCC cell lines, revealing relatively high expression in HepG2 and Huh7 cells and relatively low expression in Hep3B and PLC cells (Figure 6A). Hence, NLE1 was knocked out in HepG2 (Figure 6B and 6C) and Huh7 cells and NLE1 was overexpressed in Hep3B and PLC cells (Figure 6D). We observed that, compared with that in control cells, the proliferative capacity of NLE1-knockdown (KO-NLE1) HepG2 and Huh7 cells was significantly lower (Figure 6B, 6C, and 6F). In contrast, the overexpression of NLE1 (OE-NLE1) in PLC and Hep3B cells increased their proliferative capacity (Figure 6D and 6E). Consistently, colony formation assays revealed that KO-NLE1 significantly inhibited colony formation (Figure 6G), whereas OE-NLE1 enhanced colony formation in HCC cells (Figure 6H). These findings suggest that NLE1 plays a key role in promoting the proliferation of HCC cells.

NLE1 promotes proliferation of HCC cells. (A) Western blotting to detect NLE1 expression levels in hepatocellular carcinoma cell lines. (B) NLE1-KO efficiency was detected in Huh7 cells. (C) NLE1-KO efficiency was detected in HepG2 cells. (D) NLE1 overexpression efficiency was detected in PLC and Hep3B cells. (E) CCK8 detects the effect of overexpression of NLE1 on the proliferative capacity of PLC and Hep3B liver cancer cells. (F) CCK8 detection of the effect of NLE1-KO on the proliferative ability of hepatocellular carcinoma cells Huh7 and HepG2. (G) Clone formation assay to detect the effect of overexpression of NLE1 on the proliferative ability of hepatocellular carcinoma cells PLC and Hep3B. (H) Effect of clone formation assay to detect NLE1-KO on the proliferative ability of hepatocellular carcinoma cells Huh7 and HepG2. P value < 0.05 (*P < 0.05; **P < 0.01; ***P < 0.001) was considered to indicate statistical significance. Data are the mean ± SD. The P value was determined by a 2-tailed unpaired Student t test. *P < 0.05, **P < 0.01, ***P < 0.001.
Discussion
Recent research has increasingly focused on the roles of WD40 proteins in cell biology and pathology. These proteins are often dysregulated in tumour cells, where they contribute to oncogenesis by influencing key biological processes, including signal transduction, the cell cycle, ubiquitination, transcription, and RNA processing. 6
In this study, we focused on the expression and characterisation of WD40 proteins in HCC. Previous studies have shown that Cdc20 plays an essential role in human tumorigenesis.36-39 PAM has been reported to be correlated with liver cancer prognosis in previous studies. 40 Integrin alpha 2 (ITGA2) has been implicated in tumour cell proliferation, invasion, metastasis and angiogenesis in recent studies.41,42 It has been reported that transducing protein beta-like protein 1 (TBL1X) can activate Wnt/β-catenin signalling to promote tumorigenesis.43,44 Our study demonstrated that the expression of NLE1, a novel biomarker for HCC, was strongly correlated with pathological stages and clinical indicators, further increasing its potential as a prognostic marker. We also analysed tumour tissues and assessed NLE1 expression at the single-cell level. Our results showed that NLE1 promotes malignant proliferation and inhibits apoptosis in HCC cells. Furthermore, enrichment analyses suggested that NLE1 may influence metabolic processes in tumour cells, which warrants further exploration. Taken together, our findings suggest that NLE1 may serve as a novel diagnostic and prognostic biomarker for HCC. However, the precise mechanism underlying WD40 protein dysregulation in HCC requires further investigation.
Organoid models serve as preclinical platforms that maintain tumour heterogeneity and in vivo characterisation is indispensable for effective drug evaluation and biomarker development.25,45 Currently, most drugs approved for the treatment of HCC are multikinase inhibitors, with sorafenib and lenvatinib as first-line treatments and regorafenib and cabozantinib as second-line treatments. 46 However, the low clinical response rates to these targeted agents and the inability of genomics to predict sensitive patients render the task of optimal patient selection a major challenge. In this study, we systematically analysed and screened NLE1 as a potential therapeutic target in HCC, particularly in the context of drug resistance and treatment optimization. Using a biobank of 82 human HCC samples, we identified a significant correlation between NLE1 expression and sensitivity to multiple chemotherapeutic agents and small-molecule inhibitors, including 17-AAG, AZD7762, and regorafenib.
The mechanistic link between NLE1 expression and drug sensitivity is of particular interest. NLE1 has been implicated in ribosome biogenesis and translational control, both of which are critical for tumour cell survival and adaptability under therapeutic pressure. Inhibition of NLE1 may impair protein homeostasis, disrupt cellular stress responses, and increase apoptosis, thereby sensitizing cancer cells to chemotherapy. For example, 17-AAG, an Hsp90 inhibitor, targets molecular chaperones that regulate protein folding and stability, and its enhanced efficacy in NLE1-high tumours suggests a potential dependence on protein quality control pathways.47-49 Similarly, AZD7762, a checkpoint kinase inhibitor, disrupts the DNA damage response and cell cycle progression, processes that may be more vulnerable in NLE1-expressing tumours. 50 Notably, our findings highlight the potential of NLE1 as a target for overcoming resistance in HCC treatment. Regorafenib, a second-line multikinase inhibitor, is commonly used for patients with sorafenib-resistant HCC.46,51-53 The observed correlation between NLE1 expression and regorafenib sensitivity suggests that NLE1 may play a role in modulating the tumour response to kinase inhibitors, providing an opportunity for personalized therapy selection and novel combination treatment strategies. Future studies should explore whether NLE1 inhibition could be combined with existing targeted therapies or immune checkpoint inhibitors to improve clinical outcomes.
Despite these promising findings, certain limitations should be acknowledged. While our results provide compelling in vitro evidence, further studies using mouse xenograft models or genetically engineered mouse models are essential for confirming our findings and elucidating the effects of NLE1 on tumour growth, metastasis, and therapeutic response. In addition, independent patient cohorts are needed to validate the predictive value of NLE1 expression in clinical settings. Furthermore, the specific molecular regulatory mechanisms of NLE1 in hepatocarcinogenesis remain to be elucidated. Addressing these limitations in future research will be essential for translating our findings into clinical applications.
Conclusions
This study suggests that NLE1 holds promise as both a diagnostic and prognostic biomarker in HCC. Furthermore, targeting NLE1 may improve treatment outcomes by sensitizing tumour cells to chemotherapy and overcoming drug resistance mechanisms. These findings provide a strong rationale for further preclinical and clinical investigations into NLE1 as a novel therapeutic target in liver cancer.
Supplemental Material
sj-xlsx-1-onc-10.1177_11795549251348902 – Supplemental material for WD40 Protein NLE1 as a Novel Diagnostic Biomarker Promoting Hepatocellular Carcinoma Proliferation
Supplemental material, sj-xlsx-1-onc-10.1177_11795549251348902 for WD40 Protein NLE1 as a Novel Diagnostic Biomarker Promoting Hepatocellular Carcinoma Proliferation by Rutong Zhang, Dehua Liu, Xiaoxi Feng, Zhenye Yang and Kaiguang Zhang in Clinical Medicine Insights: Oncology
Footnotes
Ethical considerations
This study did not involve human participants or identifiable patient data.
Author contributions
ZYY, KGZ, and RTZ contributed to the conceptualization and design of the study, data analysis, and manuscript drafting. RTZ and DHL were responsible for acquisition and preprocessing of the data, and contributed to revising the manuscript for important intellectual content. DHL and XXF participated in interpretation of the results and provided critical feedback on the manuscript. ZYY and KGZ supervised the study, secured funding, and revised the final version of the manuscript. All authors have read and approved the final version of the manuscript and agree to be accountable for all aspects of the work.
Funding
The author(s) disclosed receipt of the following financial support for the research, authorship, and/or publication of this article: This study was supported by the Department of Education of Anhui Province of China under (2023AH040396). Fundamental Research Funds for the Central Universities (WK911000004).
Declaration of conflicting interests
The author(s) declared no potential conflicts of interest with respect to the research, authorship, and/or publication of this article.
Data availability statement
The datasets used in this study were obtained from the following publicly available repositories: Publicly accessible, data can be freely accessed through the TCGA portal (https://portal.gdc.com). ICGC portal (https://dcc.icgc.org/releases/current/Projects), CPTAC database (https://pdc.cancer.gov/pdc/browse). GSE14520, GSE116174, GSE45436, GSE54236, GSE76427, GSE19665, GSE5346, and single-cell data GSE166635. Data can be accessed through the Gene Expression Omnibus (GEO) database. All data used in the study were fully anonymized and are publicly available for download. The bioinformatic tools used for data analysis include https://www.aclbi.com, ![]() , R software, version v4.0.3., and the corresponding references are provided in the manuscript.
, R software, version v4.0.3., and the corresponding references are provided in the manuscript.
Supplemental material
Supplemental material for this article is available online.
References
Supplementary Material
Please find the following supplemental material available below.
For Open Access articles published under a Creative Commons License, all supplemental material carries the same license as the article it is associated with.
For non-Open Access articles published, all supplemental material carries a non-exclusive license, and permission requests for re-use of supplemental material or any part of supplemental material shall be sent directly to the copyright owner as specified in the copyright notice associated with the article.