
Abstract
Background:
The cachexia index (CXI) has been proposed as a novel biomarker of cancer cachexia. We aimed to investigate the association between CXI and survival outcomes after stereotactic radiotherapy (SRT) in patients with non-small cell lung cancer (NSCLC) and brain metastases.
Methods:
Data from 145 patients with NSCLC, who underwent SRT for brain metastases between April 2016 and August 2020, were retrospectively analyzed. Cachexia index was calculated as skeletal muscle index (SMI) × serum albumin level/neutrophil-to-lymphocyte ratio, whereas SMI was calculated from computed tomography images captured at the L1 level. Kaplan-Meier curves and Cox proportional hazards models were used to assess progression-free survival (PFS) and overall survival (OS). The prognostic values of CXI and other cachexia biomarkers were assessed using receiver operating characteristic (ROC) curve analysis.
Results:
Lower pretreatment CXI (<30.8) was significantly associated with older age (P = .039), lower Karnofsky performance score (P = .009), and a high likelihood of extracranial metastases (P = .001). Patients with a lower pretreatment CXI had a significantly shorter PFS and OS than those with a higher CXI (P < .001). Multivariate analysis revealed that pretreatment CXI was an independent risk factor for both PFS, hazard ratio (HR) = 2.375; 95% confidence interval (CI) = 1.610-3.504; P < .001, and OS, HR = 2.340; 95% CI = 1.562-3.505; P < .001. Compared with other biomarkers, pretreatment CXI had the highest area under the ROC curve value for prognostic assessment, reaching 0.734. Moreover, the loss of CXI was a strong risk factor for survival independent of pretreatment CXI (P = .011).
Conclusions:
Cachexia index may serve as a clinically useful tool for predicting survival outcomes of patients with NSCLC and brain metastases who undergo SRT.
Introduction
Approximately 2.2 million new cases of lung cancer and 1.8 million cancer deaths are reported annually, making it the second most frequently diagnosed cancer and the leading cause of cancer-related mortality. 1 Non-small cell lung cancer (NSCLC) is the most common type of lung cancer, with >30% of cases involving brain metastases (BM).2,3 Currently, BM appear to be more prevalent, resulting in poor prognosis and quality of life. 4 The treatment options for BM include radiotherapy, systemic therapy, and surgical resection. Among radiation therapies, stereotactic radiotherapy (SRT) has been increasingly used in patients with brain oligometastases owing to its satisfactory local control and safety profiles.5,6 Nevertheless, survival after SRT remains poor and heterogeneous, necessitating accurate prognostic stratification in this patient population.
Cancer cachexia is a long-term wasting syndrome characterized by the progressive loss of skeletal muscle mass. 7 This syndrome has a complex multifactorial pathogenesis and is closely associated with weight loss, declining performance status, intolerance to treatment, and cancer-related death.8,9 For convenient estimation of cachexia, the cachexia index (CXI) was first developed in patients with advanced NSCLC 10 and then validated in many other malignancies.11-14 This composite index was calculated using serum albumin (ALB) level, neutrophil-to-lymphocyte ratio (NLR), and skeletal muscle index (SMI), representing individual nutritional status, systemic inflammation, and muscle mass, respectively. However, the prognostic value of the CXI in patients undergoing SRT for BM has not yet been studied. Moreover, whether CXI is superior to other blood biomarkers of cachexia remains unclear. As such, this study aimed to investigate the utility of the CXI in predicting survival outcomes in patients with NSCLC treated with SRT for BM.
Materials and Methods
Study population
This retrospective study enrolled consecutive patients with NSCLC who underwent SRT at the First Hospital of Hebei Medical University between April 2016 and August 2020. Patients with the following characteristics were included: age >18 years, histologically confirmed primary NSCLC, Karnofsky performance status (KPS) scores = 70 to 100, ⩽3 BM lesion(s) diagnosed by contrast-enhanced magnetic resonance imaging (MRI), and complete clinical and follow-up data. Patients with concurrent malignant or hematological disease, those with uncontrolled extracranial disease, active infective or inflammatory disease, and individuals using immunosuppressive or anti-inflammatory drugs were excluded. A total of 145 patients were included in this analysis (Figure S1). The data were collected from electronic databases. The study was conducted in accordance with the Declaration of Helsinki (revised in 2013) and was approved by the institutional review board of our institution (approval number: 2023Y072).
Treatments
All patients underwent SRT after providing informed written consent. Contrast-enhanced computed tomography (CT) was performed for planning purposes. These CT images were then fused with specific T1-weighted MRI images within 1 week of CT localization. The gross tumor volume (GTV) was defined as the contrast-enhanced tumor region on CT and MRI images, and the clinical target volume (CTV) was defined as the GTV. The planning target volume (PTV) was defined as the CTV plus a 1 to 2 mm margin after excluding critical organ structures (eg, the brain stem). A dose of 48 60 Gy in 6 to 8 fractions was delivered based on physician preference.
Systemic treatment was administered to all the patients in accordance with current guidelines. 15 Symptomatic and supportive treatment was performed according to patient condition. Each patient was regularly followed up with physical examination, laboratory investigations, CT, MRI, and other radiological examinations, if needed.
Definitions
Cachexia index was calculated using the following equation 10 :

Skeletal muscle index was calculated as the skeletal muscle area (SMA) divided by height in meters squared, and SMA was measured using specialized software (SliceOmatic version 5.0, TomoVision, Magog, QC, Canada) 16 with a single CT image captured at the first lumbar vertebra (L1) as shown in Figure 1. 17 The surface areas of the psoas muscles, abdominal wall muscles, and paraspinal muscles, in which transverse and spinous processes were visible, were used to determine SMA. After automated segmentation, 1 trained radiologist (LY) who was blinded to the patient information manually distinguished SMA from the adipose area using anatomic knowledge and standard Hounsfield unit (HU) ranges (adipose tissue = −190 to −30 HU and skeletal muscle = −29 to 150 HU). Boundaries of bone structures and organs were also corrected manually. We calculated the SMA at the L1 level instead of the L3 level because the L3 level is not always in the reach of chest CT scans. Albumin represents serum ALB level in g/dL. Neutrophil-to-lymphocyte ratio was defined as the absolute neutrophil count (×109/L) divided by the absolute lymphocyte count (×109/L). For each patient, the CXI was measured at baseline and after 6 to 8 weeks of SRT.

Example of body composition analysis for measurement of skeletal muscle area.
Several blood biomarkers related to cancer cachexia in patients with advanced NSCLC have also been analyzed. The systemic immune inflammatory index (SII) was calculated as platelet count (×109/L) × NLR. 18 The prognostic nutritional index (PNI) was calculated as follows 18 : 10 × serum ALB (g/L) + 0.005 × lymphocyte count (×109/L). The formula for calculating the geriatric nutritional risk index (GNRI) was 1.487 × serum ALB (g/L) + 41.7 × present body weight/ideal body weight (kg), where the ideal body weight was calculated as 22 × square of height (m). 19 The Naples prognostic score (NPS) was determined using serum ALB level, total cholesterol level, NLR, and lymphocyte-to-monocyte ratio (LMR), 20 whereas the controlling nutritional status (CONUT) score was determined using serum ALB level, total cholesterol level, and lymphocyte count. 21
Statistical analysis
The primary outcome was progression-free survival (PFS), which was calculated as the time interval from SRT to disease progression or the last follow-up. Overall survival (OS) was calculated as the time interval from SRT to death from any cause or to the last follow-up, which was the secondary outcome. The final follow-up was completed in June 2023.
Continuous variables were compared using the t test, and categorical variables were compared using the chi-squared test. The optimal cutoff value for the CXI for PFS was calculated by selecting minimum P value with the maximum chi-square value in all possible subdivisions of the populations using X-tile software version 3.6.1 (Yale University, New Haven, CT, USA). Differences in PFS and OS were assessed using the Kaplan-Meier method and log-rank test. Univariate and multivariate analyses were performed using the Cox proportional hazards model to identify independent prognostic factors for PFS and OS. The area under the receiver operating characteristic (ROC) curve (AUC) was used to compare the prognostic values of different biomarkers.
All statistical analyses were performed using Statistical Product and Service Solutions (SPSS) software version 23.0 (IBM Corporation, Armonk, NY, USA) and R software version 4.1.2 (R Foundation for Statistical Computing, Vienna, Austria). Differences with a 2-tailed P ⩽ .05 were considered to be statistically significant.
Results
Baseline characteristics
Between April 2016 and August 2020, 145 patients with NSCLC and newly diagnosed with BM were included in this study. As summarized in Table 1, there were 75 men (51.7%) and 70 women (48.3%), with a mean (±SD [standard deviation]) age of 59.2 ± 10.9 years. Of these, 66 (45.5%) were smokers and 74 (51.0%) had a KPS of 70 to 80. Most patients (72.4%) had adenocarcinomas. After a median follow-up of 19 months (range, 12-39 months), a total of 115 deaths (79.3%) and 136 (93.8%) disease progression events were recorded; the median PFS and OS were 10 and 22 months, respectively, for the entire cohort.
Associations between CXI and clinicopathological characteristics.
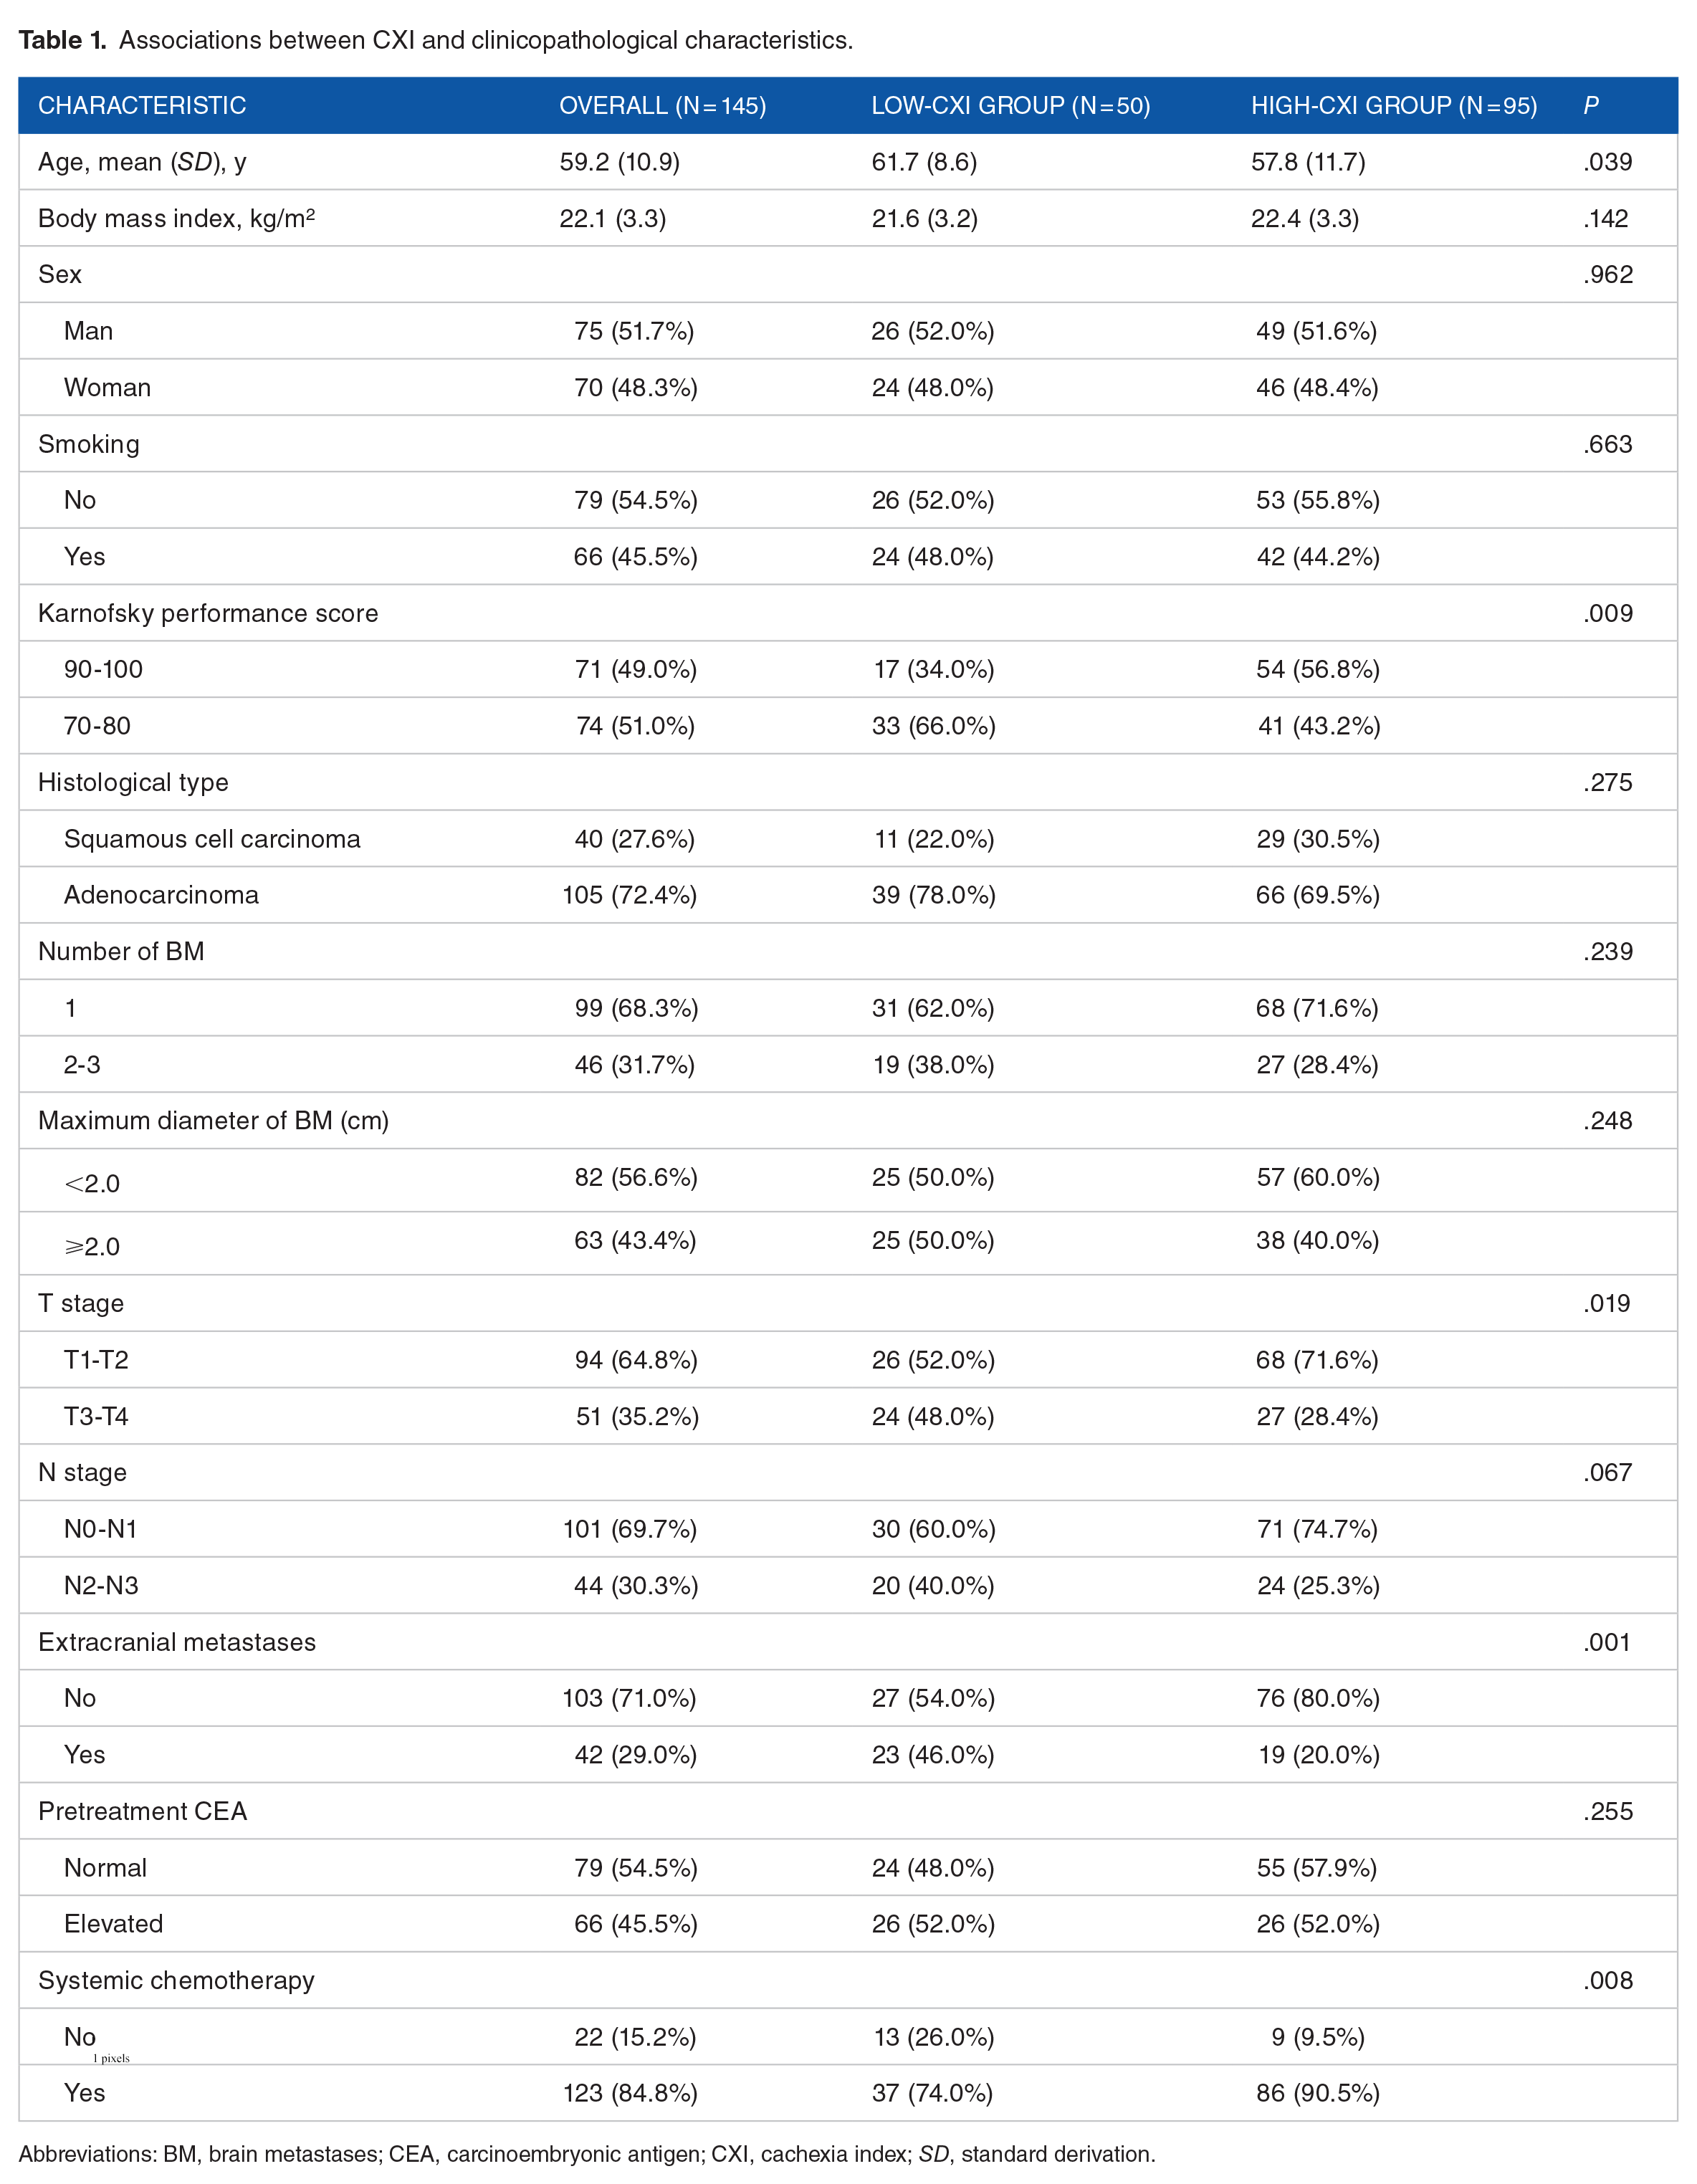
Abbreviations: BM, brain metastases; CEA, carcinoembryonic antigen; CXI, cachexia index; SD, standard derivation.
Associations between cachexia index and patient characteristics
The X-tile plot revealed that the optimal cutoff value for the CXI was 30.8 (Figure S2). The entire cohort was divided into low-CXI (n = 50 [34.5%]) and high-CXI (n = 95 [65.5%]) groups. A lower CXI (<30.8) was significantly associated with older age (61.7 [8.6] vs 57.8 [11.7]; P = .039), lower KPS (66.0% vs 43.2%; P = .009), T3 to T4 disease (48.0% vs 28.4%; P = .019), high likelihood of extracranial metastases (46.0% vs 20.0%; P = .001), and no receipt of chemotherapy (26.0% vs 9.5%; P = .008; Table 1).
Associations between cachexia index and survival outcomes
Univariate analysis revealed that KPS, number of BM, T stage, extracranial metastases, systemic chemotherapy, and CXI were significantly associated with PFS, and KPS, number of BM, extracranial metastases, systemic chemotherapy, and CXI were significantly associated with OS (P < .05). After adjusting for these factors, the CXI remained an independent risk factor for both PFS, hazard ratio (HR) = 2.113; 95% confidence interval (CI) = 1.413-3.159; P < .001, and OS, HR = 2.297; 95% CI = 1.516-3.482; P < .001 (Tables 2 and 3).
Univariate and multivariate analysis for PFS.

Abbreviations: BM, brain metastases; CEA, carcinoembryonic antigen; CI, confidence interval; CXI, cachexia index; HR, hazard ratio.
Univariate and multivariate analysis for OS.

Abbreviations: BM, brain metastases; CEA, carcinoembryonic antigen; CI, confidence interval; CXI, cachexia index; HR, hazard ratio.
As depicted in Figure 2, patients with a lower CXI had a significantly shorter PFS (median, 8 vs 13 months; P < .001) and OS than those with a higher CXI (median, 15 vs 25 months; P < .001). Moreover, CXI could differentiate prognosis in all subgroups, even in patients with unfavorable characteristics (Figure S3).

Kaplan-Meier curves for progression-free survival (A) and overall survival (B) in patients with low and high CXI.
Comparison with other biomarkers
The prognostic values, calculated as AUC, were compared among 6 candidate biomarkers: CXI, SII, PNI, GNRI, NPS, and CONUT. As depicted in Figure 3, the CXI had the highest AUC value in predicting 1-year PFS, reaching 0.734 (95% CI = 0.654-0.814). Multivariate analysis revealed that CXI, SII, and CONUT were all independently associated with PFS (P < .05); however, none of these biomarkers retained their independent values after adjusting for CXI (supplemental Table).
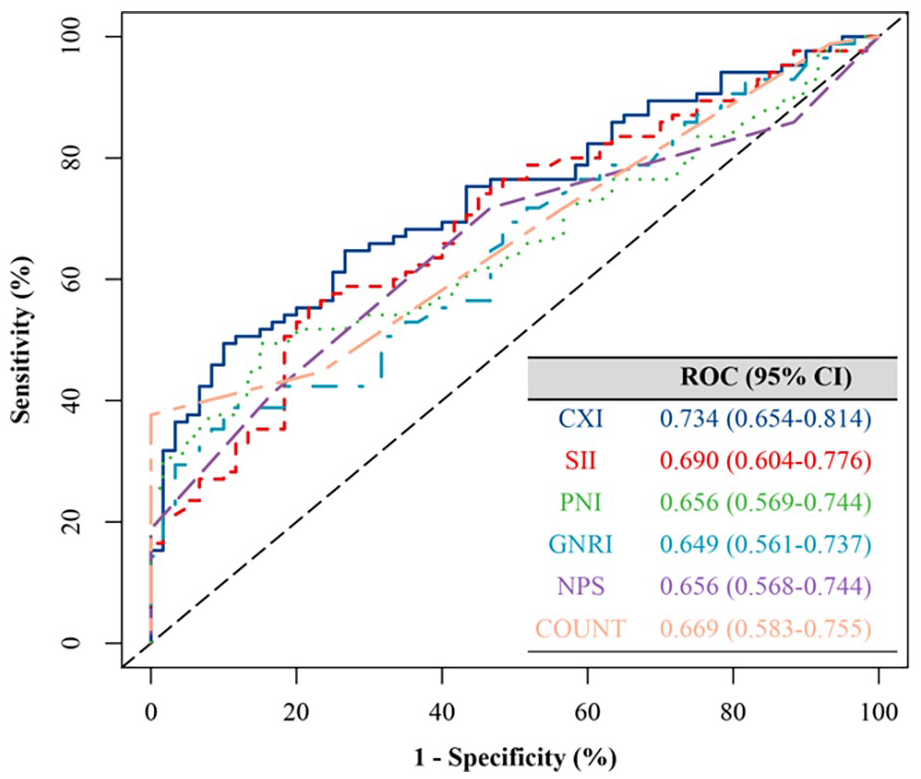
Areas under the receiver operating characteristic curves for 1-year progression-free survival.
Change in cachexia index
Overall, the CXI significantly increased after treatment (mean, 795 vs 1039; P < .001; Figure S4). When stratified according to pretreatment CXI, CXI significantly increased in the low-CXI group (mean, 41.6 vs 93.3; P < .001) but did not change in the high-CXI group (mean, 99.4 vs 109.4; P = .086). After adjusting for KPS, number of BM, and extracranial metastases, low pretreatment CXI, HR = 2.554; 95% CI = 1.727-3.776; P < .001, and loss of CXI, HR = 1.593; 95% CI = 1.111-2.284; P = .011, were independent risk factors for PFS.
Discussion
In this study, we found that the CXI, calculated using 3 cachexia-related parameters, was an independent risk factor for both PFS and OS. Cachexia index also exhibited superior prognostic value compared with other published cachexia biomarkers. Moreover, CXI loss after SRT is significantly associated with poor survival rates. These results demonstrated that the CXI could be a powerful prognostic indicator in patients with NSCLC and BM undergoing SRT.
Cancer cachexia is a multifactorial syndrome commonly observed in patients with solid tumors, particularly in those with advanced disease. 22 The current diagnostic criteria for cancer cachexia are inconsistent and mainly determined by weight loss. 23 However, the diagnostic accuracy of weight can be affected by recall bias. In addition, actual weight loss may be masked by factors such as fluid retention. 24 Therefore, reliable and objective diagnostic tools are required. The CXI is a novel biomarker for cachexia and was calculated using 3 parameters obtained from CT and routine laboratory blood tests. In a study involving 112 patients with advanced NSCLC, Jafri et al 10 found that the CXI significantly predicted survival rather than weight loss. A recent study involving 324 patients with gastric cancer reported that CXI had a better prognostic value than weight loss. 12 Our results also demonstrated that low CXI was significantly associated with shorter PFS and OS. Patients with a low CXI were more likely to be older and have a poor performance status and high tumor burden, which is similar to previous studies.10-14 Moreover, CXI retained its prognostic value among patient subgroups.
The key features of cancer cachexia, such as malnutrition (hypoalbuminemia), systemic inflammation (high NLR), and sarcopenia (low SMI), are closely associated with poor oncological outcomes in patients with NSCLC. Hypoalbuminemia is common in patients with advanced tumors and indicates an ongoing systemic response that causes malnutrition and inflammation. 25 Serum ALB levels have been shown to be strongly correlated with survival in patients.26,27 Cumulative evidence has confirmed that peripheral blood immune cells (neutrophils and lymphocytes), which serve as inflammatory indicators, are significantly associated with the prognosis of malignant tumors. 28 Neutrophils secrete cytokines, chemokines, and proteases that can result in tumor development, progression, and metastasis. 29 In contrast, lymphocytes play a critical role in the antitumor immune response by preventing tumorigenesis and killing tumor cells. 30 As a hallmark of cancer cachexia, sarcopenia is widely considered to be an adverse prognostic factor in various malignancies, including NSCLC.31-34 Moreover, SMI, which is scarcely affected by outside interference(s), such as body fluid volume, is more objective and stable than other blood biomarkers. This may explain why the prognostic value of the CXI was stronger than that of the blood cachexia biomarkers. 35
It remains unclear whether the improvement or deterioration of cancer cachexia has a significant effect on survival outcomes. In a retrospective study involving 123 patients with advanced ovarian cancer, Rutten et al 36 suggested that loss of SMI during neoadjuvant chemotherapy was significantly associated with impaired survival. Lin et al 37 also demonstrated that changes in SMI independently predicted the prognosis of patients with gastric cancer who underwent neoadjuvant chemotherapy. This study also demonstrated that loss of CXI after SRT had a negative impact on survival. As such, appropriate treatments for cancer cachexia should be performed in patients with a low CXI, which may prolong survival.
Despite these novel findings, this study had several limitations, the first of which was its retrospective design, for which selection bias was difficult to avoid. Second, this was a single-center study with a small sample size, which limits the generalizability of our findings. Third, this is the first study to calculate the CXI using the L1 CT scan. Although the widely validated CXI is always calculated based on the L3 CT scan; however, previous studies have confirmed that L1 and L3 are equally appropriate. We believe that this “novel” CXI will be equally useful in clinical practice. Moreover, the cutoff value for CXI in this study may not be suitable for other populations. Finally, further studies are needed to investigate the prognostic value of CXI in patients treated with other systemic therapies such as immunotherapy.
Conclusions
In conclusion, the CXI demonstrated satisfactory prognostic value and may be a useful tool for the measurement of cancer cachexia in patients with NSCLC who undergo SRT for BM. This biomarker can also be used to identify patients requiring therapies directed against cancer cachexia. Nevertheless, further large-scale prospective studies are needed to verify our findings.
Supplemental Material
sj-docx-1-onc-10.1177_11795549231222362 – Supplemental material for Prognostic Significance of the Cachexia Index in Patients with Non-Small-Cell Lung Cancer and Brain Metastases after Stereotactic Radiotherapy
Supplemental material, sj-docx-1-onc-10.1177_11795549231222362 for Prognostic Significance of the Cachexia Index in Patients with Non-Small-Cell Lung Cancer and Brain Metastases after Stereotactic Radiotherapy by Hui Xu, Bin Zhang, Yongqian Zhang, Chunchun Yang, Changwen Bo, Yuanyuan Guo, Yuan Cheng and Li He in Clinical Medicine Insights: Oncology
Footnotes
Funding:
The author(s) received no financial support for the research, authorship, and/or publication of this article.
Declaration of conflicting interests:
The author(s) declared no potential conflicts of interest with respect to the research, authorship, and/or publication of this article.
Author Contributions
HX, BZ, and LH conceived of the study and designed the study; YZ, CY, CB, YG, and YC helped collect data; HX analyzed the data; BZ wrote the article; LH helped revise the article critically for important intellectual content. All authors read and approved the final article.
Availability of Data and Materials
The data sets used and/or analyzed during this study are available from the corresponding author on reasonable request.
Ethics Approval Statements and Informed Consent
This study was conducted in accordance with the Declaration of Helsinki (revised in 2013) and was approved by the institutional review board of the First Hospital of Hebei Medical University (approval number: 2023Y072; approval date: August 2, 2023). Written informed consent was obtained from all patients for being included in the study.
Supplemental Material
Supplemental material for this article is available online.
References
Supplementary Material
Please find the following supplemental material available below.
For Open Access articles published under a Creative Commons License, all supplemental material carries the same license as the article it is associated with.
For non-Open Access articles published, all supplemental material carries a non-exclusive license, and permission requests for re-use of supplemental material or any part of supplemental material shall be sent directly to the copyright owner as specified in the copyright notice associated with the article.