
Abstract
Background:
The neurotrophic tyrosine kinase (NTRK) gene family includes NTRK1, NTRK2, and NTRK3, which encode tropomyosin receptor kinases TrkA, TrkB, and TrkC, respectively. This study aimed to initially assess the genomic and proteomic profiles of NTRK genes and Trk receptors in liver hepatocellular carcinoma (LIHC).
Methods:
The ONCOMINE, UALCAN, GEPIA, cBioPortal, FusionGDB, SurvivalMeth, and the Human Protein Atlas databases were searched for NTRK gene expression and protein data in LIHC. Immunohistochemistry was used to detect pan-Trk expression across a commercial microarray containing 96 hepatocellular carcinoma (HCC) and 94 para-cancerous tissue spots. A modified histological score (H-score) with a maximum score of 300 was used to quantify immunohistochemical staining for pan-Trk. Student’s t- and chi-square tests were the main statistical analyses used.
Results:
The transcriptional levels of NTRK genes in LIHC were not significantly different from healthy controls. Using UALCAN and GEPIA, only high expression of NTRK2 was significantly associated with longer disease-free survival (P = 0.004). The alteration frequencies were low (7% in NTRK1, 1.7% in NTRK2, and 2% in NTRK3). The methylation levels of NTRK genes were all significantly different as analyzed by UALCAN; the high-risk group displayed an unfavorable prognosis compared with the low-risk group for NTRK1 (P = 0.033) and NTRK3 (P = 0.005). The median H-score of pan-Trk in HCC and para-cancerous tissues was not statistically different (186.31 ± 23.86 and 192.38 ± 21.06, P = 0.065). No differences were observed in clinicopathological features of HCC with the median H-score for pan-Trk expression (p > 0.05). The survival rate of patients with pan-Trk expression was also not significantly different.
Conclusion:
The alteration frequency was low in NTRK genes, including gene fusion and methylation levels. Therefore, pan-Trk expression in HCC tissue has limited value in clinicopathological features and prognosis.
Introduction
Liver hepatocellular carcinoma (LIHC) was the sixth most diagnosed cancer with a high mortality rate. 1 The prognosis for LIHC is still poor, with a maximum 5-year survival rate of 18% in high-income countries. 2 Therefore, understanding the pathogenesis of and discovering new therapeutic targets for LIHC may play an important role in developing more precise treatments and improving prognoses.
The neurotrophic tyrosine kinase (NTRK) family comprises three genes, NTRK1, NTRK2, and NTRK3, which encode the tropomyosin receptor kinases TrkA, TrkB, and TrkC, respectively. 3 These NTRK genes are located on human chromosomes 1q23.1, 9q21.33, and 15q25.3, respectively. 4 The first-generation Trk inhibitors, larotrectinib, and entrectinib, were approved for treating NTRK fusion-positive solid tumors. 5 For larotrectinib treatment of NTRK fusion-positive cancer, the proportion of patients with an objective response rate was 79% (95% confidence interval (CI): 72%-85%), with 16% of patients having complete responses. 6 Another Trk inhibitor, entrectinib, was approved by the U.S. Food and Drug Administration (FDA) on August 15, 2019, based on the demonstration of a durable overall response rate of 57% (95% CI: 43%-71%). 7 Other Trk inhibitors include crizotinib, cabozantinib, lestaurtinib, altiratinib, foretinib, ponatinib, nintedanib, merestinib, MGCD516, PLX7486, DS-6051b, and TSR-011, all of which have been or will be used in clinical trials.8,9 Although Trk receptors play an important role in treating NTRK fusion-positive solid tumors, little is known about the relationship between Trk receptors and LIHC.
In this study, we utilized a series of bioinformatic databases to explore the genomic profiles of the NTRK gene family, including transcription levels, genetic variation, and protein expression, in LIHC. In addition, immunohistochemistry (IHC) staining was used to explore the relationship between pan-Trk and hepatocellular carcinoma (HCC).
Materials and Methods
ONCOMINE
ONCOMINE (www.oncomine.org) is a translational bioinformatics service that comprises 715 datasets and 86,733 samples for genome-wide expression analyses. 10 Data were extracted to evaluate the expression of NTRK genes in LIHC. This study used the default system values during the exploration process. A student’s t-test was used to analyze differences in the expression of NTRK genes in LIHC.
University of Alabama at Birmingham cancer data analysis
The University of Alabama at Birmingham cancer data analysis portal (UALCAN, http://ualcan.path.uab.edu/analysis.html), a comprehensive web resource, provides analyses from The Cancer Genome Atlas (TCGA) and MET500 cohort data. 11 UALCAN was used in our study to generate graphs depicting gene expression and survival curves. Expression data for the NTRK genes were obtained using the expression module. Survival analysis was performed using the survival module. A Student’s t-test was used to generate P values. The P-value cut-off was set at 0.05.
Gene expression profiling interactive analysis
Gene Expression Profiling Interactive Analysis (GEPIA, http://gepia.cancer-pku.cn/index.html) is an analysis tool developed at Peking University that contains expression data from RNA sequencing data of 9736 tumors and 8587 normal tissue samples. 12 We performed a prognostic analysis of NTRK genes with the “Single Gene Analysis” module. The resulting hazard ratios and P-values, or Cox P-values from the log-rank test, were plotted. Prognostic analysis was performed using Kaplan–Meier curves.
CBioPortal
cBioPortal (www.cbioportal.org), a comprehensive web resource, is used to visualize and analyze cancer genomics data based on the TCGA database. 13 Genetic alterations were obtained using cBioPortal. Additionally, patterns of gene alterations were visualized, gene alteration frequencies were compared, and all relevant genomic alterations were summarized.
Fusion gene annotation DataBase
Fusion Gene annotation DataBase (FusionGDB, https://ccsm.uth.edu/FusionGDB) contains a collection of 48,117 pan-cancer fusion genes from three representative fusion gene resources: Chimeric Transcripts and RNA-seq data (ChiTaRS 3.1), TumorFusions (an integrative resource for cancer-associated transcript fusions), and TCGA fusions, developed by Gao et al. 14 FusionGDB provides six categories of annotations: FusionGeneSummary, FusionProtFeature, FusionGeneSequence, FusionGenePPI, RelatedDrug, and RelatedDisease. 15
Methylation and clinical analysis
SurvivalMeth (http://bio-bigdata.hrbmu.edu.cn/survivalmeth/) was used to investigate the effect of DNA methylation-related functional elements on prognosis, and multiple types of commonly used functional elements associated with DNA methylation were considered. 16
The Human Protein Atlas
The Human Protein Atlas (https://www.proteinatlas.org/) is a freely accessible website that contains information regarding protein expression patterns in human tissues and cells. 17 We analyzed the protein expression of Trk receptors in liver cancer and normal tissues using immunohistochemistry, as detailed below.
Immunohistochemical staining of pan-Trk in the hepatocellular tissue microarray
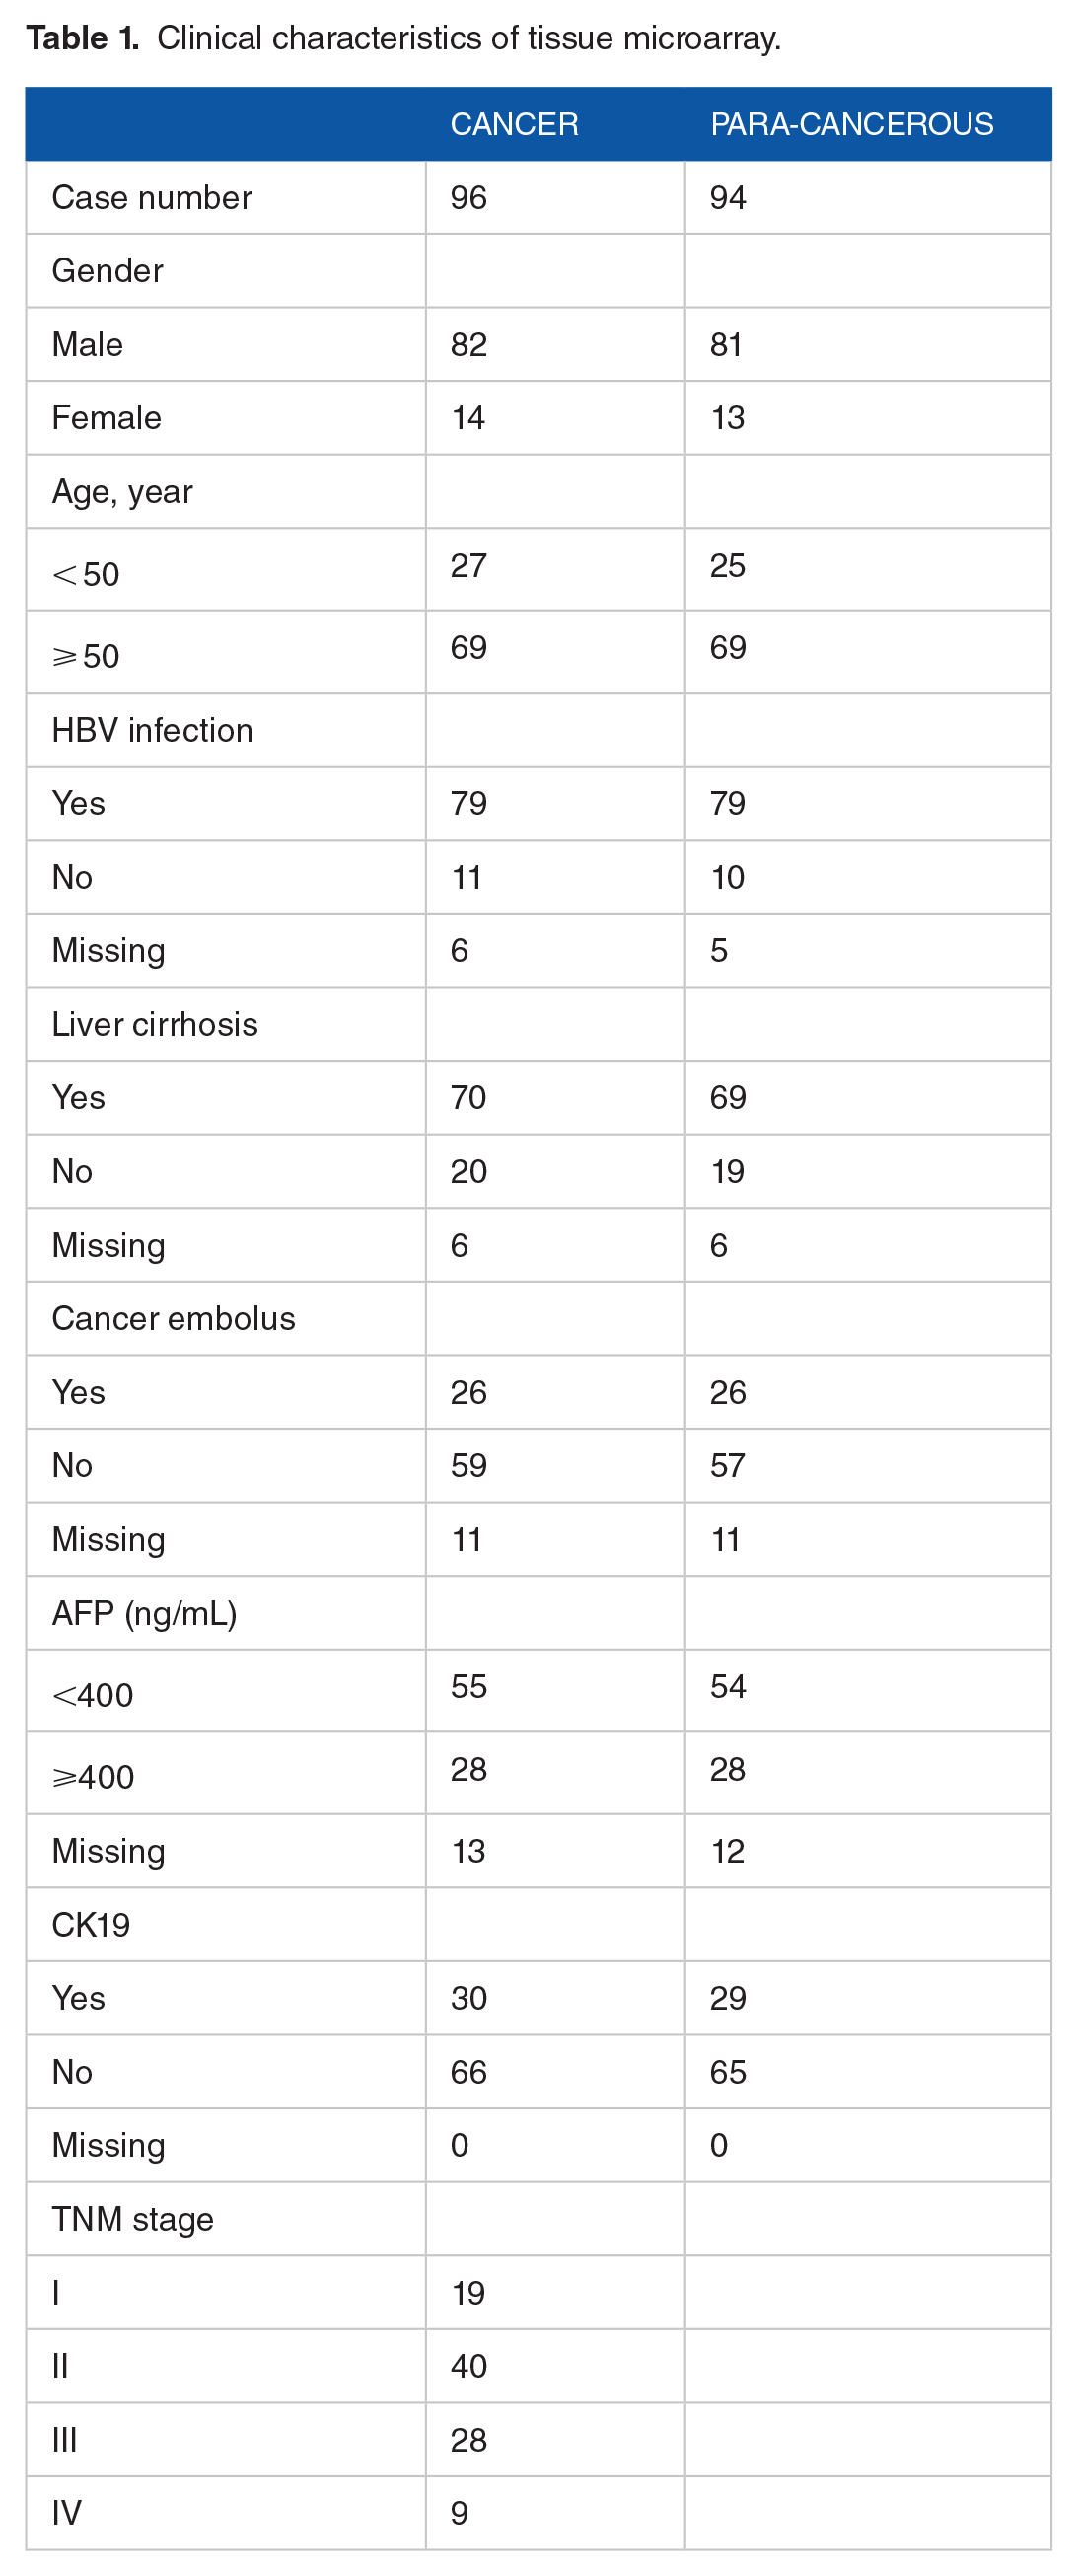
A commercial tissue microarray was purchased from Shanghai Outdo Biotech Co., Ltd. (HLiv-HCC197Sur-01; Shanghai, China). Clinical diagnoses and tumor-node-metastasis (TNM) stages were obtained from the patient’s clinical data, which were provided by the company. The Union for International Cancer Control’s TNM staging system was applied according to the eighth edition of the Cancer Staging Manual. The tissue microarray contained 96 HCC and 94 para-cancerous spots. Microarray samples are described in detail in Table 1. The patients underwent surgical resection between July 2010 and March 2012. All patients with complete clinical and follow-up data until November 2017 provided written informed consent.
Clinical characteristics of tissue microarray.
Pan-Trk levels in tissue samples were evaluated using IHC, which was performed according to the standard streptavidin-peroxidase method. Briefly, histological slides of tissue samples were deparaffinized using xylene and an alcohol gradient. The antigen was retrieved using citric acid antigen repair buffer (pH 6.0; Wuhan Goodbio Technology Co. Ltd, Hubei, China). Endogenous peroxidase activity was blocked by incubating the slides in a 3% H2O2 solution prepared in methanol at room temperature for 25 minute. The slides were washed with phosphate-buffered saline (PBS, pH 7.4) and blocked using a blocking buffer (10% fetal bovine serum in PBS; Boster Bioengineering, Hubei, China). The slides were subsequently incubated with rabbit anti-human polyclonal antibody against pan-Trk (ab76291, dilution 1:500; Abcam, Cambridge, UK), which reacts with a conserved proprietary peptide in the C-terminal portion of TrkA, B, and C, at 4ºC overnight. Thereafter, the slides were washed and incubated with polyclonal anti-rabbit immunoglobulin G secondary antibody (dilution 1:200; Wuhan Goodbio Technology). Immunocomplexes were detected using 3,3′-diaminobenzidine (Dako, Copenhagen, Denmark). Staining was monitored under a microscope and terminated when sufficient staining was achieved. The slides were dehydrated and stored. Tissue images were acquired and analyzed using CaseViewer (Danjier, Shandong, China). The histological score (H-score), defined as a continuous variable for each sample, was determined by two pathologists in our hospital blinded to clinical and molecular data and was calculated using the following formula: H-score = (1× % low intensity cells [1 +]) + (2× % medium intensity cells [2 +]) + (3× % high intensity cells [3 +]). H-scores ranging from 0 to 300 indicate stained tumor samples. High and low scores of pan-Trk expression were defined using the median H-score in HCC tissues as the threshold.
Statistical analysis
All statistical analyses were performed using SPSS software (version 22.0; SPSS, Chicago, IL, USA). H-scores were expressed as median± standard and were analyzed using a Student’s t-test. Pan-Trk expression levels and clinicopathological features of patients with HCC were analyzed using a chi-square test. The roles of pan-Trk in survival were assessed using the Kaplan–Meier method.
Results
Expression of NTRK genes in patients with LIHC
NTRK1, NTRK2, and NTRK3 expression patterns were studied using the ONCOMINE database. We first explored the transcriptional levels of NTRK genes in LIHC and normal tissue using ONCOMINE (Figure 1). Based on the data from ONCOMINE, the transcriptional levels of NTRK genes in LIHC tissues were not significantly different from the normal controls (P = 0.148 for NTRK1, P = 0.616 for NTRK2, and P = 0.972 for NTRK3). We assessed the expression levels of NTRK genes in 371 cases of LIHC and 50 normal controls using UALCAN, which were not significantly different between groups (P = 0.244 for NTRK1, P = 0.078 for NTRK2, and P = 0.681 for NTRK3) (Figure 1D to F).

The expression levels of NTRK genes in the ONCOMINE (A-C) and UALCAN (D-E) databases.
Prognostic value of NTRK mRNA in patients with LIHC
UALCAN and GEPIA were used to evaluate the prognostic value of differentially expressed NTRK genes in the progression of LIHC. The survival curves generated from UALCAN showed no differences in survival between different expression levels of NTRK genes (P = 0.15 for NTRK1, P = 0.37 for NTRK2, and P = 0.17 for NTRK3) (Figure 2A to C). Overall survival (OS) and disease-free survival (DFS) curves were further explored by GEPIA and are shown in Figure 2D to I. Neither the differential expression of NTRK1 nor that of NTRK3 were significantly associated with OS (P = 0.94, 0.87, respectively) or DFS (P = 0.68, 0.42, respectively). High expression of NTRK2 was significantly associated with longer DFS (P = 0.004), but not OS (P = 0.87).
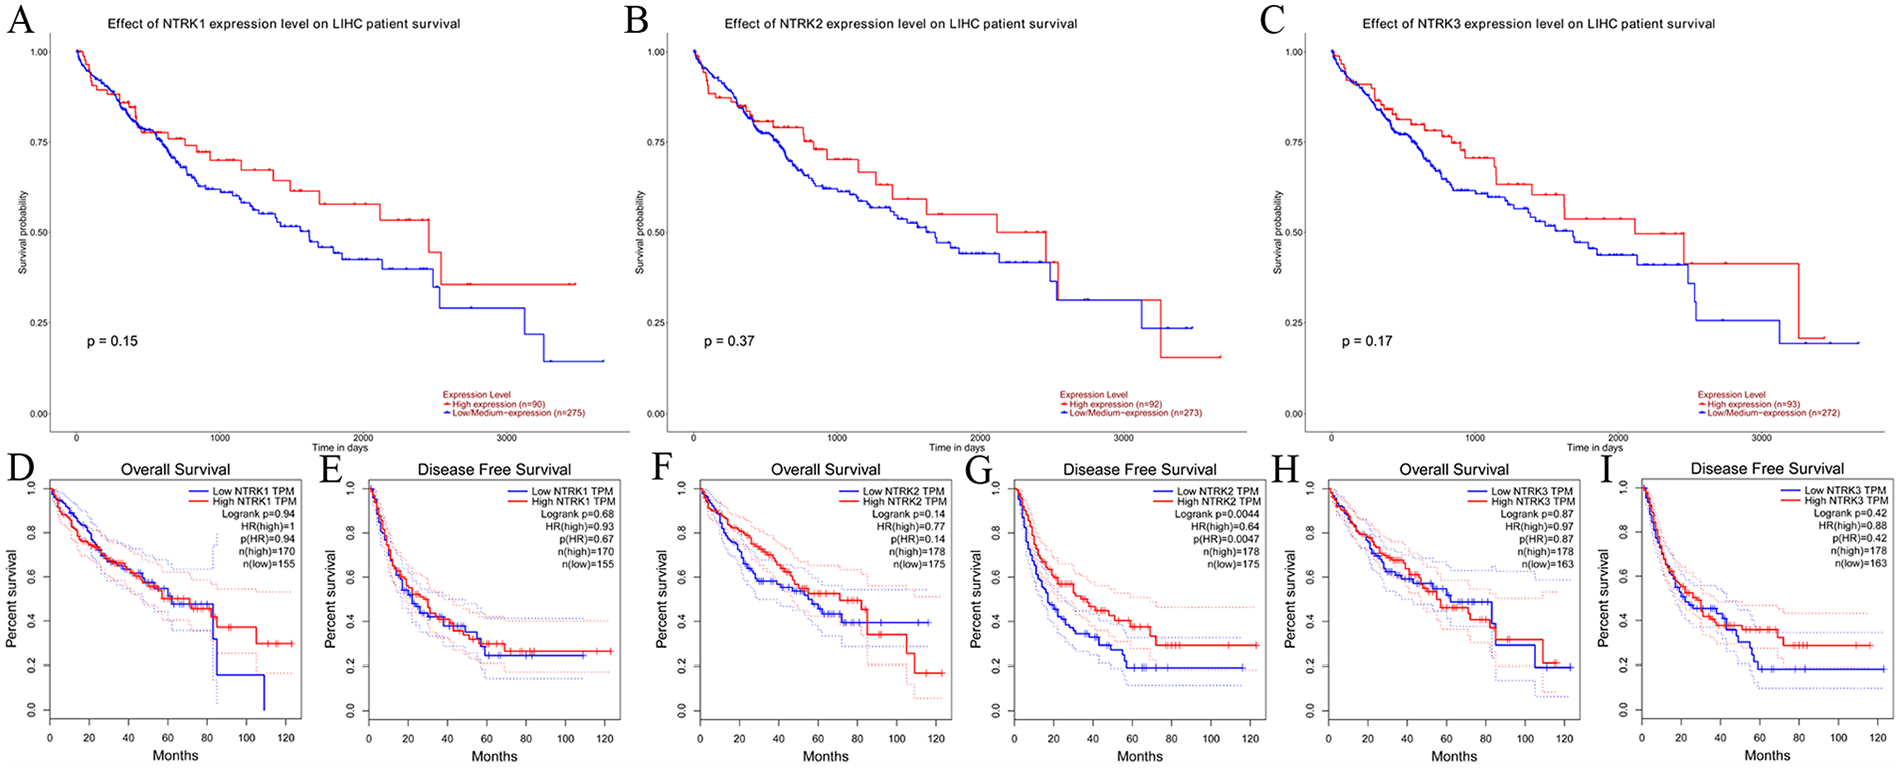
The prognostic value of NTRK mRNA in patients with LIHC as determined by using the UALCAN and GEPIA databases. A-C: Survival curves from UALCAN. D-I: Overall survival (OS) and disease-free survival (DFS) analysis by GEPIA.
Genetic alteration analysis
OncoPrint in cBioPortal was used to explore the genetic alterations of NTRK genes in LIHC using data from 1438 patients across six studies. As a result, the alteration frequency of NTRK1 was determined to be 7% (altered/profiled = 102/1375) and was due to amplifications (n = 91) and mutations (n = 11). The alteration frequency of NTRK2 was 1.7% (altered/profiled = 24/1375) and was due to mutations (n = 22), multiple alterations (n = 1), and a deep deletion (n = 1). The alteration frequency of NTRK3 was 2% (altered/profiled = 28/1375) and was due to mutations (n = 25) and amplifications (n = 3). The results are shown in Figure 3A to D.

Genetic alteration analysis of LIHC in cBioPortal. A: general overview of genetic alterations. B-D: Proportions of alteration frequencies and genetic types.
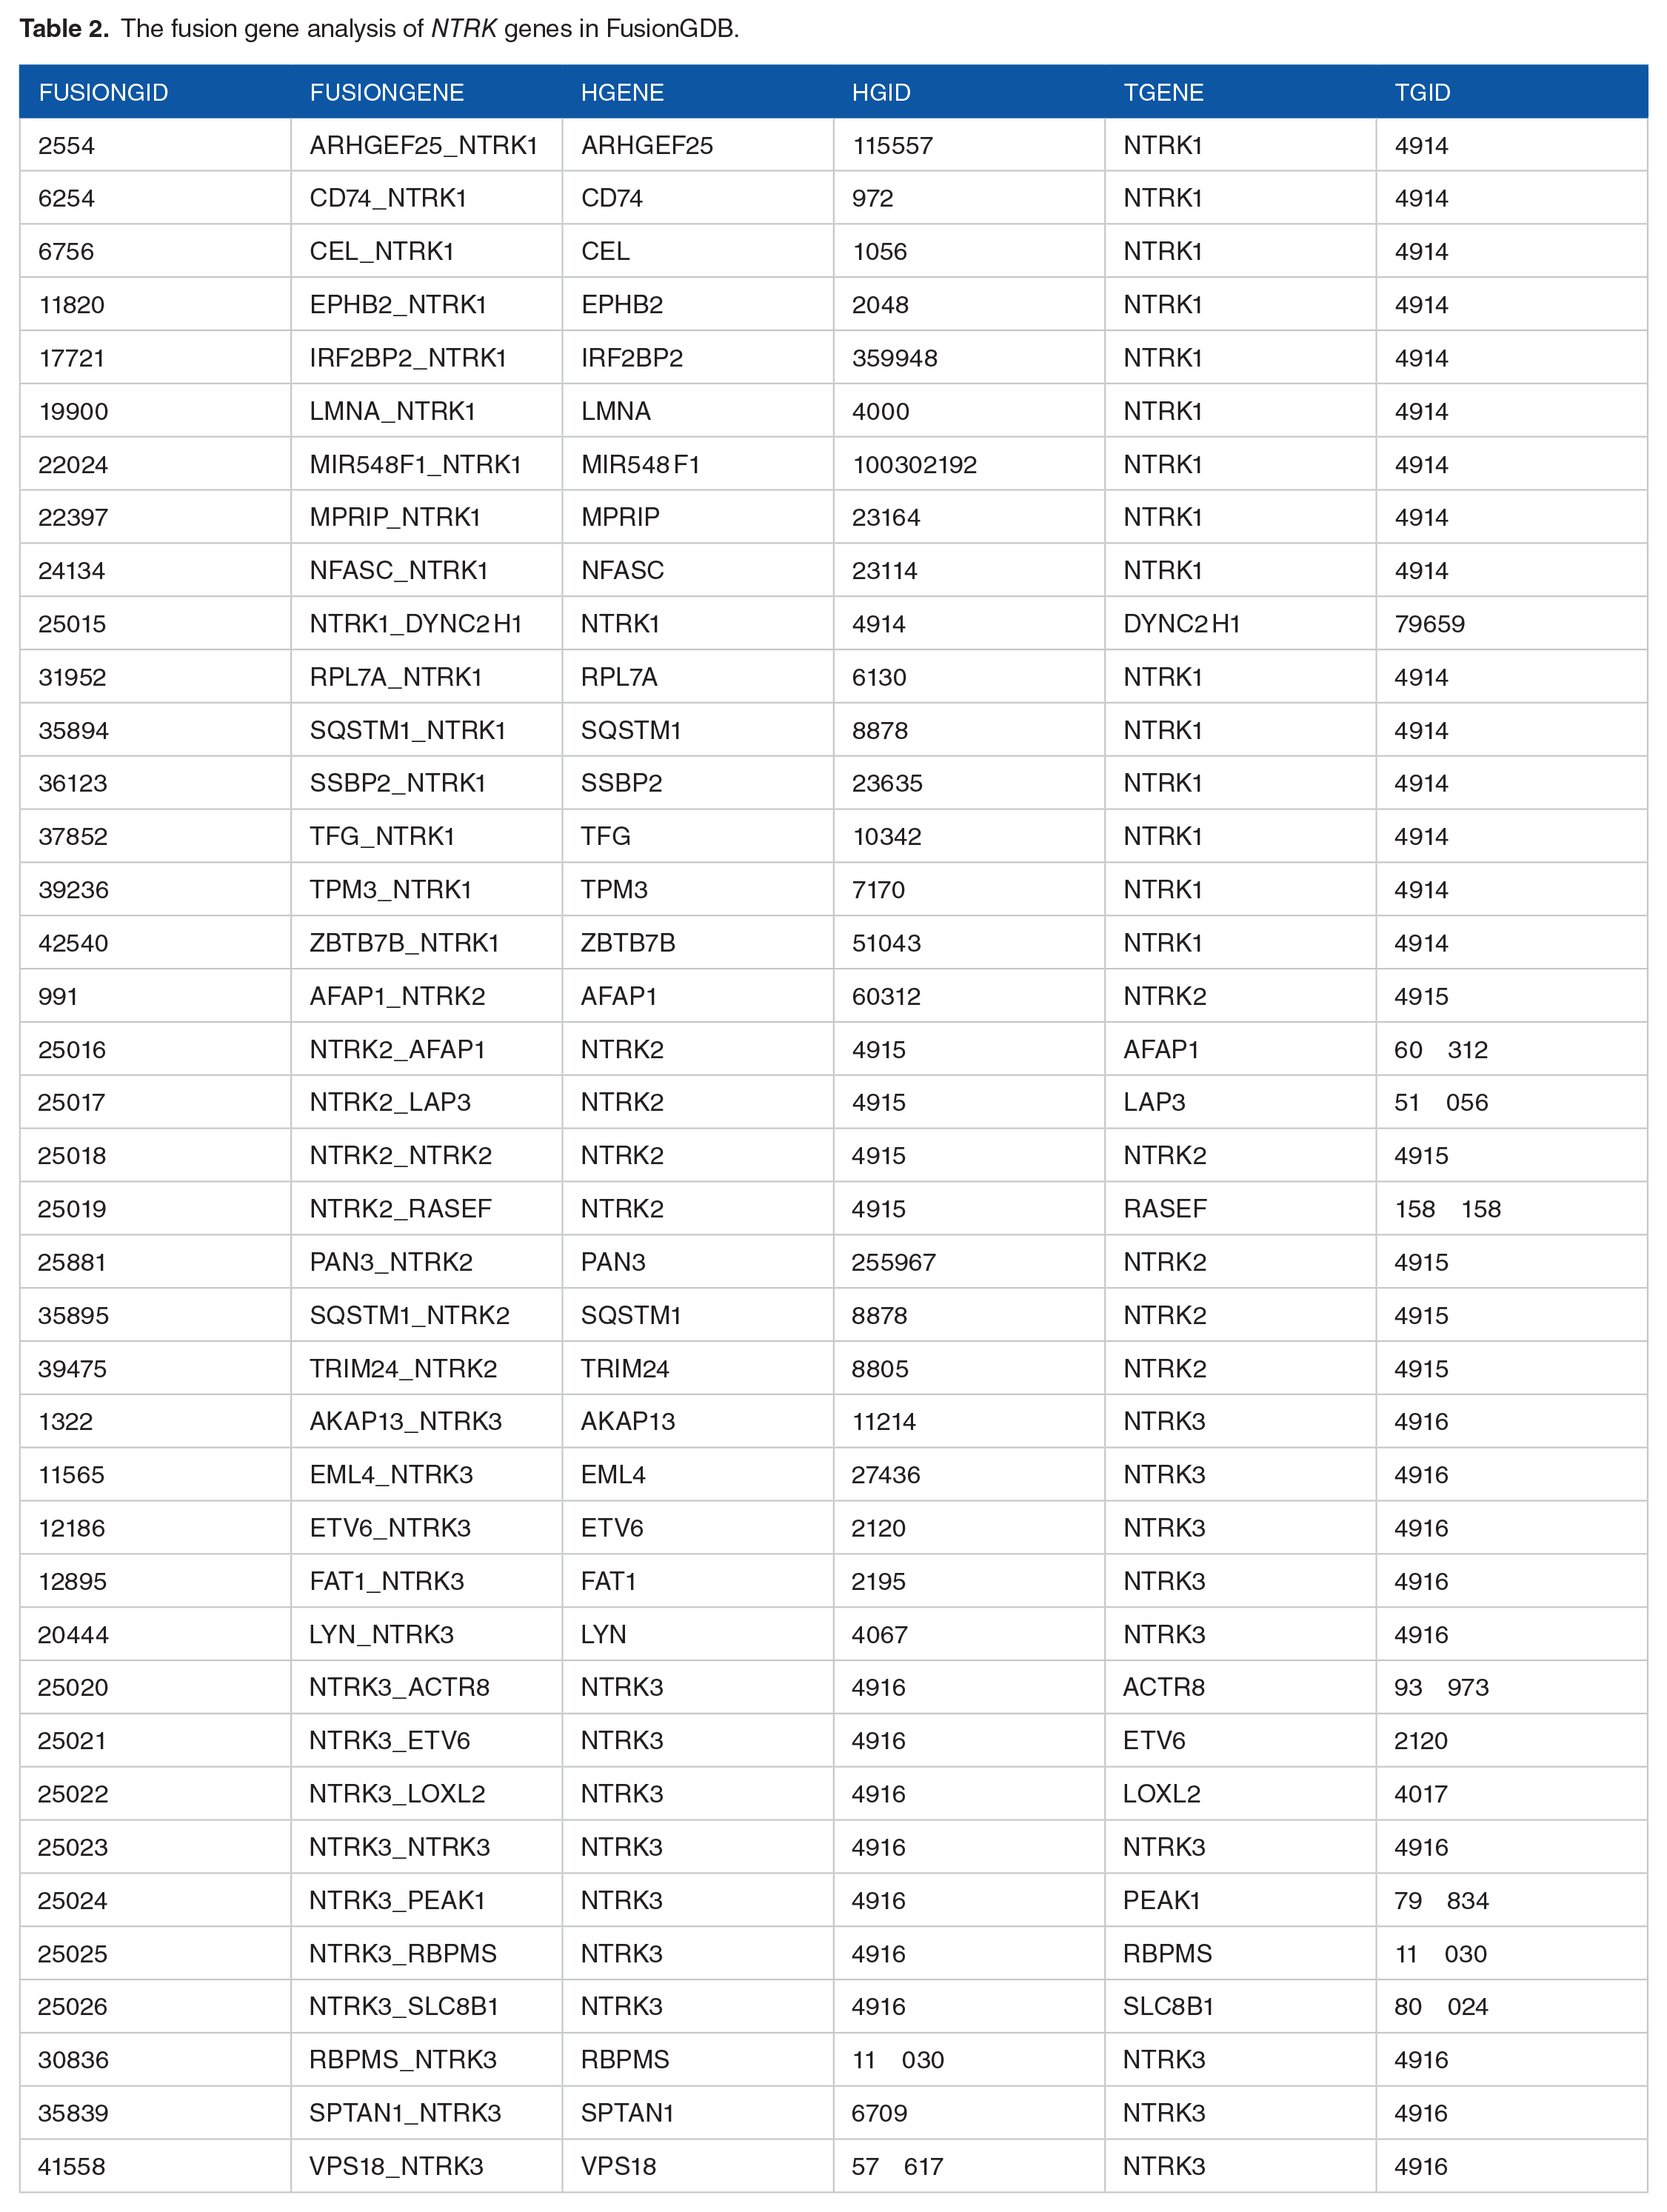
As FusionGDB aims to provide a resource or reference for the functional annotation of fusion genes in cancer for better therapeutic targets, a fusion gene analysis through this database was used to identify 16 NTRK1, 8 NTRK2, and 15 NTRK3 fusion genes (Table 2).
The fusion gene analysis of NTRK genes in FusionGDB.
The methylation levels of NTRK genes were analyzed using UALCAN. Hyper- and hypomethylation are generally indicated by beta values of 0.7–0.5 and 0.3–0.25, respectively. Compared to normal tissues, NTRK1 had a median beta value of 0.292 (0.331 for normal tissues, P = 1.840 E-06, Figure 4A), NTRK2 had a median beta value of 0.144 (0.106 for normal tissues, P = 1.624 E-12, Figure 4B), and NTRK3 had a median beta value of 0.089 (0.054 for normal tissues, P = 1.624 E-12, Figure 4 C). Survival related to methylation in LIHC was explored using SurvivalMeth. Detailed information about probe IDs and DNA methylation levels of NTRK genes in the normal and LIHC groups are presented in Figure 4D to F. The high-risk group displayed an unfavorable prognosis compared with the low-risk group for NTRK1 (P = 0.033) and NTRK3 (P = 0.005) but not for NTRK2 (P = 0.061) (Figure 4E to I).

Methylation levels of NTRK genes and survival analysis in the UALCAN database. A-C: Methylation levels of NTRK genes in LIHC and normal groups. D-F: Methylation levels of NTRK genes presented by this study. G-I: Survival of LIHC in relation to methylation of NTRK genes.
Immunohistochemistry staining data from the Human Protein Atlas
Most cancer tissues exhibited weak to moderate cytoplasmic immunoreactivity to Trk receptors, often with a granular pattern for TrkA (Figure 5A). Of the eight patients examined, one had high TrkA expression and six had medium expression levels (Figure 5B). A few cases of urothelial, lung, pancreatic, and head and neck cancers showed moderate to strong cytoplasmic positivity for TrkB, while the other cancers were mainly negative (Figure 5C). No patients with liver cancer had positive staining for TrkB (Figure 5D). Most cancer cells were negative for TrkC. Lymphomas and colorectal, cervical, and liver cancer tissues showed weak to moderate cytoplasmic and nuclear staining for TrkC in a fraction of cells (Figure 5E). One of the four patients with liver cancer showed a medium TrkC expression level (Figure 5F).

Trk receptor staining in cancer. A, C, and E: Proportions of Trk expression in cancer. B, D, and F: Representative images of Trk expression in liver cancer.
Expression levels of pan-Trk in HCC and para-cancerous tissues
IHC staining images showing pan-Trk expression levels in HCC and para-cancerous tissues are presented in Figure 6. Positive staining was observed in the cytoplasmic and membranous areas. In HCC tissue, the median H-score of pan-Trk was 186.31 ± 23.86. The median H-score was 192.38 ± 21.06 in para-cancerous tissues. No statistical significance was observed using a Student’s t-test (P = 0.065). After dividing pan-Trk expression into high and low expression groups according to the median value of pan-Trk, the value indexes of sex, age, hepatitis B virus (HBV) infection, liver cirrhosis, cancer embolus status, alpha-fetoprotein (AFP) level, CK19 expression, and TNM stage of patients with HCC were tested. No differences were observed in these value indexes for high or low expression of pan-Trk (P > 0.05, Table 3). After follow-up, 49 of 96 patients survived, and 47 died. According to the Kaplan–Meier survival analysis, the survival rates of patients with high vs low pan-Trk expression were not significantly different (P = 0.392, Figure 6).

Immunohistochemical staining and survival analysis of HCC and para-cancerous tissues.
Associating the expression of pan-Trk with clinicopathological features in patients with hepatocellular carcinoma.

AFP, alpha-fetoprotein; HBV, hepatitis B virus.
Discussion
There were 390,000 liver cancer-related deaths in China in 2020, second only to lung cancer. 18 Typically, only 5–15% of patients are eligible for surgical removal. Neither current ablation therapies nor chemotherapy effectively improves the outcomes of this devastating disease. 19
In the ONCOMINE database, the transcriptional levels of NTRK genes in LIHC tissues were not significantly different from those in normal individuals. The survival curves generated from UALCAN showed no relationship between the expression of NTRK genes and survival. Further exploration of the OS and DFS curves using GEPIA showed that neither high nor low transcriptional levels of NTRK1 or NTRK3 were significantly associated with OS (P = 0.94 and 0.87, respectively) or DFS (P = 0.68 and 0.42, respectively). Only high expression of NTRK2 was significantly associated with longer DFS (P = 0.004). The alteration frequencies were very low in all NTRK genes (NTRK1, 7%, NTRK2, 1.7%, and NTRK3, 2%). Fusions involving NTRK1, NTRK2, or NTRK3 are the most common mechanisms of oncogenic Trk activation. 20 NTRK fusions can be diagnosed using fluorescence in situ hybridization, reverse transcription polymerase chain reaction, DNA-based next-generation sequencing (NGS), and RNA-based NGS.21,22 Hsiao et al previously summarized the occurrence of NTRK fusion genes in cancer through different studies which found NTRK1-LMNA, NTRK1-RABGAP1 L, and NTRK1-TPM3 in cholangiocarcinoma; however, no NTRK2 or NTRK3 fusion genes were detected. Furthermore, there were no NTRK fusion genes associated with hepatocellular carcinoma. 23 However, analyses with FusionGDB revealed that NTRK gene fusions were diverse, including 16 NTRK1 fusions, 8 NTRK2 fusions, and 15 NTRK3 fusions.
Compared to normal tissues, NTRK1 was hypomethylated, and NTRK2 and NTRK3 were hypermethylated; these differences were statistically significant. The high-risk group displayed an unfavorable prognosis compared with the low-risk group for NTRK1 (P = 0.033) and NTRK3 (P = 0.005) but not for NTRK2 (P = 0.061). Choi et al 24 found that higher Trk expression in tissues occurred in hepatocellular carcinoma cases (21 of 288 (7.3%)) with recurrence-free survival (P = 0.092) and OS (P = 0.079); no NTRK fusion genes were detected in 16 samples overexpressing Trk receptors. Another study showed that the positive expression rate of TrkB in hepatocellular carcinoma tissues was 55.4% (36/65), significantly correlated with advanced stages of hepatocellular carcinoma. 25 Our study found that the differences in pan-Trk expression in LIHC and para-cancerous tissues were not statistically significant. Zhang and Liao 26 found that 12/110 (10.9%) cases of hepatocellular carcinoma showed weak cytoplasmic Trk expression by IHC, while all other hepatocellular carcinoma, including 69 intrahepatic cholangiocarcinomas, were negative for Trk. Our study may have observed no statistical difference in pan-Trk expression in LIHC and para-cancerous tissues due to weak or rare expression levels. Additionally, no differences were observed in the sex, age, HBV infection, liver cirrhosis, cancer embolus statuses or AFP level, CK19 expression, and TNM stage of patients with HCC with the median H-score for pan-Trk expression. In addition, the survival rate of patients with pan-Trk expression was not significantly different.
To further our understanding of the role NTRK genes play in LIHC, we used the extensive experimental data made available through a series of bioinformatic databases. As different databases validated our results, our findings were compelling. However, there were some limitations to our work. For example, gene fusion and methylation statuses of NTRK genes are important indicators for LIHC, but we did not expand our research further. Additionally, though an IHC analysis was used to explore pan-Trk expression in HCC tissues, some patient information is lacking in China, such as HBV infection status and alcohol consumption levels. This is due to a patient’s right to refuse some tests, especially those regarding HBV infection, liver cirrhosis, and cancer embolus statuses or AFP levels, for financial or other reasons. HBV infection is the leading cause of LIHC worldwide. China has the world’s largest burden of HBV infection, as nearly 23,355,000 patients infected with HBV (approximately 29.0% of global HBV infections) occurred in China in 2019.27,28
Conclusion
We systemically analyzed the relationships between NTRK gene expression and LIHC using bioinformatics and IHC. The expression levels of NTRK genes in LIHC tissues were not significantly different. Only high expression of NTRK2 was significantly associated with longer DFS. The alteration frequencies, including gene fusion events, are very low in NTRK genes. The methylation levels of all NTRK genes were significantly different between LIHC and normal tissues, and both NTRK1 and NTRK3 modifications may be related to the survival rate for patients with LIHC. However, we found that the expression of pan-Trk in HCC tissue has limited value in clinical characteristics and prognosis.
Footnotes
Acknowledgements
We acknowledge all other studies that supported our work that were not cited due to length constraints. We would like to thank the funding body that allowed us to carry out this study.
Author Contributions
Xuefeng Fang and Ying Yuan designed and supervised this project. Hejing Wang and Lina Qi performed bioinformatic analyses and wrote the article. Hejing Wang performed the immunohistochemical staining and analysis. Chenhan Zhong provided advice and supervision of the analytic process. Xuefeng Fang and Ying Yuan amended the writing of the article. All authors participated in the writing, review, and final approval of the manuscript.
Declaration of conflicting interests:
The author(s) declared no potential conflicts of interest with respect to the research, authorship, and/or publication of this article.
Funding:
The author(s) disclosed receipt of the following financial support for the research, authorship, and/or publication of this article: This work was supported by the Provincial Key R&D Program of Zhejiang Province (Grant number 2021C03125) and the National Natural Science Foundation of China (Grant number 81872481).
Ethical Statement
This study was approved by the Institutional Review Board of The Second Affiliated Hospital, Zhejiang University School of Medicine (202112202).