
Abstract
Introduction:
Modern radiotherapy with 4-dimensional computed tomographic (4D-CT) image acquisition for non–small cell lung cancer (NSCLC) captures respiratory-mediated tumor motion to provide more accurate target delineation. This study compares conventional 3-dimensional (3D) conformal radiotherapy (3DCRT) plans generated with standard helical free-breathing CT (FBCT) with plans generated on 4D-CT contoured volumes to determine whether target volume coverage is affected.
Materials and methods:
Fifteen patients with stage I to IV NSCLC were enrolled in the study. Free-breathing CT and 4D-CT data sets were acquired at the same simulation session and with the same immobilization. Gross tumor volume (GTV) for primary and/or nodal disease was contoured on FBCT (GTV_3D). The 3DCRT plans were obtained, and the patients were treated according to our institution’s standard protocol using FBCT imaging. Gross tumor volume was contoured on 4D-CT for primary and/or nodal disease on all 10 respiratory phases and merged to create internal gross tumor volume (IGTV)_4D. Clinical target volume margin was 5 mm in both plans, whereas planning tumor volume (PTV) expansion was 1 cm axially and 1.5 cm superior/inferior for FBCT-based plans to incorporate setup errors and an estimate of respiratory-mediated tumor motion vs 8 mm isotropic margin for setup error only in all 4D-CT plans. The 3DCRT plans generated from the FBCT scan were copied on the 4D-CT data set with the same beam parameters. GTV_3D, IGTV_4D, PTV, and dose volume histogram from both data sets were analyzed and compared. Dice coefficient evaluated PTV similarity between FBCT and 4D-CT data sets.
Results:
In total, 14 of the 15 patients were analyzed. One patient was excluded as there was no measurable GTV. Mean GTV_3D was 115.3 cm3 and mean IGTV_4D was 152.5 cm3 (P = .001). Mean PTV_3D was 530.0 cm3 and PTV_4D was 499.8 cm3 (P = .40). Both gross primary and nodal disease analyzed separately were larger on 4D compared with FBCT. D95 (95% isodose line) covered 98% of PTV_3D and 88% of PTV_4D (P = .003). Mean dice coefficient of PTV_3D and PTV_4D was 84%. Mean lung V20 was 24.0% for the 3D-based plans and 22.7% for the 4D-based plans (P = .057). Mean heart V40 was 12.1% for the 3D-based plans and 12.7% for the 4D-based plans (P = .53). Mean spinal cord Dmax was 2517 and 2435 cGy for 3D-based and 4D-based plans, respectively (P = .019). Mean esophageal dose was 1580 and 1435 cGy for 3D and 4D plans, respectively (P = .13).
Conclusions:
IGTV_4D was significantly larger than GTV_3D for both primary and nodal disease combined or separately. Mean PTV_3D was larger than PTV_4D, but the difference was not statistically significant. The PTV_4D coverage with 95% isodose line was inferior, indicating the importance of incorporating the true size and shape of the target volume. Relatively less dose was delivered to spinal cord and esophagus with plans based on 4D data set. Dice coefficient analysis for degree of similarity revealed that 16% of PTVs from both data sets did not overlap, indicating different anatomical positions of the PTV due to tumor/nodal motion during a respiratory cycle. All patients with lung cancer planned for radical radiotherapy should have 4D-CT simulation to ensure accurate coverage of the target volumes.
Keywords
Introduction
Management of locally advanced non–small cell lung cancer (NSCLC) continues to remain a challenge for thoracic radiation oncologists (ROs). A significant number of these patients fail locoregionally following radiotherapy with or without chemotherapy. In a recently reported multicenter randomized controlled trial, patients with stage III NSCLC when treated with modern 3-dimensional conformal radiotherapy (3DCRT) techniques in combination with chemotherapy had a local failure rate of 31% to 39% at 2 years. 1 Previous studies incorporating older radiotherapy techniques without computed tomographic (CT) imaging indicate a 2-year local failure of 60% to 80% in locally advanced lung cancer. 2 Although intrinsic radiobiological resistance of the tumors and total dose/fractionation may determine the response to treatment, geographic miss and suboptimal dose to the gross pulmonary parenchymal and nodal disease due to respiratory-mediated tumor motion play a significant role in the outcome of these patients. Lung tumors can move unpredictably in all directions and up to 5 cm during the course of radiation; inability to identify and account for tumor motion can lead to suboptimal dose coverage contributing to local failure.3–7 For the purpose of radiation planning and delivery, respiratory motion of a lung tumor can be determined and encompassed by obtaining a slow CT scan, an exhalation breath-hold CT scan, or a 4-dimensional (4D) CT scan. 5 Although slow CT scan encompasses the whole respiratory cycle, it takes several minutes to acquire the imaging data with relatively poor image resolution. Exhalation breath-hold CT image acquisition can also take significantly longer time and depends on the patient’s ability to hold his or her breath. However, 4D-CT scan can encompass the whole tumor trajectory during a breathing cycle while maintaining high-quality image resolution. The 4D-CT scan not only precisely determines the average tumor motion but more importantly depicts the range of tumor motion in relation to surrounding normal structures. Modern 4D-CT scanners can image the whole thorax while capturing all the phases of respiratory cycle in less than a minute.8–12
Despite our improved understanding of the respiratory motion and technical advancement in the management of respiratory motion during the course of radiotherapy in the past decade, many radiotherapy centers in the world continue to use free-breathing CT (FBCT) imaging for radiotherapy planning in the treatment of lung cancer. In a survey of ROs in New Zealand and Australia from 62 radiotherapy departments, only 58% of the surveyed ROs used 4D-CT simulation for radiotherapy planning of lung cancer. 13 Unfortunately, FBCT cannot account for change in the gross tumor volume (GTV) due to variation in the shape and position of the target at a certain point during a respiratory cycle. To correct for these geometric uncertainties, a larger planning target volume (PTV) is required which poses higher risk of toxicity for surrounding normal structures. 14
In this study, we have retrospectively examined and compared 3DCRT plans generated with standard FBCT with the plans generated on 4D-CT scan for patients with stage I to IV NSCLC treated with definitive or high-dose palliative-intent radiotherapy in our institution. Our objective was to determine whether discrete motion assessment and radiotherapy planning with 4D-CT imaging are necessary to ensure adequate target volume coverage by the prescribed dose when compared with our institution’s standard practice with FBCT-based radiotherapy plans with a standard PTV margin based on population-based estimates.
Materials and Methods
The study was approved by the Research Ethics Board, University of Manitoba. Fifteen patients were enrolled with variable stages of lung cancer who, at the discretion of their RO, were to receive definitive or high-dose palliative-intent radiotherapy with or without concurrent chemotherapy. A formal written consent was obtained from each patient.
Image acquisition
Free-breathing CT and 4D-CT image acquisition were acquired consecutively at the same session in the same treatment position. Free-breathing CT was acquired according to the standard procedure and protocol of the institution. For 4D-CT image acquisition, the respiratory cycle was monitored using the Real-Time Position Management system from Varian Medical Systems Inc. (Palo Alto, CA, USA). A box containing infrared reflectors was placed on the skin and illuminated with an infrared source. The motion of the marker was tracked using an infrared camera leading to generation of respiratory signal transmitted to the CT scanner. 5
FBCT-based radiotherapy volume delineation
The GTV_3D for primary and/or nodal disease was contoured on free-breathing 3D-CT data set with or without radiolabeled fluorodeoxyglucose positron emission tomography (PET) image fusion. Parenchymal tumors were contoured on lung window level and nodes were contoured on soft tissue windows. Choice of the window resolution for contouring and inclusion of the gross nodal disease was left to the discretion of the treating RO. Clinical target volume (CTV_3D) was GTV_3D plus 5 mm expansions in all directions then modified based on the proximity of organs at risk (OAR) to exclude heart, esophagus, bone, vessels, and lung. Planning target volume (PTV_3D) was CTV_3D plus 1 cm axial and 1.5 cm superior/inferior expansions to incorporate setup errors and an estimate of respiratory-mediated tumor motion. The 3DCRT plans were generated as per institution protocol using Eclipse Treatment Planning System from Varian Medical Systems (Palo Alto, CA, USA). All study patients received 3DCRT.
4D-CT–based radiotherapy volume delineation
Two thoracic ROs independently contoured on each 4D-CT data set with or without PET fusion for parenchymal and nodal disease based on a prewritten contouring protocol. GTV_4D for primary and/or nodal disease was contoured on each phase of the respiratory cycle separately from phase 0% to 90% and then merged onto CT average to create internal target volume (IGTV)_4D. Window levels for lung parenchymal and soft tissue were used for contouring lung parenchymal tumors and nodal volumes, respectively. CTV_4D was defined as IGTV_4D plus a 5-mm expansion then edited based on the proximity of OAR to exclude heart, esophagus, bone, vessels, and lung. PTV_4D was defined as CTV_4D plus a 0.8-cm isotropic expansion to incorporate setup error only.
Radiotherapy planning
A designated radiation planner developed a 3DCRT plan for each patient by designing field apertures from multiple gantry angles to cover PTV_3D with ⩾95% of the prescribed dose while minimizing dose to surrounding critical structures. For each patient, only 1 PTV was created that included gross pulmonary and/or nodal disease with a margin for CTV for both data sets. All the patients were treated according to the 3DCRT plan. The 3DCRT plans were then copied onto the 4D-CT volume data set. Hence, for the purpose of this study, a 4D plan was generated for each patient using the same geometry, gantry angles, and other physical parameters as used for 3DCRT plan.
Data analysis
The 2 plans were then compared for the following:
GTV_3D vs IGTV_4D. Gross pulmonary and nodal disease contoured as 1 volume on 2 data sets;
GTVP_3D vs IGTVP_4D. Only gross pulmonary disease contoured on 2 data sets;
GTVN_3D vs IGTVN. Only gross nodal disease contoured on 2 data sets;
PTV_3D, PTV_4D. PTV for 2 data sets;
PTVD 95_3D vs PTVD 95_4D. Volume of PTV_3D and PTV_4D covered by 95% of the prescribed dose in both plans;
Dose volume histogram. Dose received by OAR (lungs, heart, spinal cord and esophagus) in both plans;
Dice Similarity Coefficient (DIC). Dice Similarity Coefficient was calculated to examine the overlap between PTV_3D and PTV_4D. DIC = 2a/(2a + b + c), where “a” is the area of overlap between 2 measures in 1 patient, “b” is the area identified in the first but not the second measure, and “c” is the area identified in the second but not the first.
Statistical methods
Parameters of interest were compared using paired t test. SAS version 9.4 software was used for all statistical analyses.
Results
The patient characteristics are described in Table 1. In total, 15 patients were enrolled in the study and 14 were analyzed. One patient was excluded as there was no measurable GTV to delineate on imaging data set. Median age was 71 years. Most of the patients (86%) had stage III or IV NSCLC. Most of them (93%) were prescribed between 50 and 60 Gy or >60 Gy. Only 5 of the 14 patients had both primary and nodal volumes delineated.
Patient characteristics.

Total dose (Gy)/fractionation (n) schedules include 30/10, 40/16, 50/20, 55/22, and 60/30.
A statistical analysis of the mean volumes generated on 2 imaging data sets is presented in Table 2. Mean dice coefficient of PTV_3D and PTV_4D was 84%, indicating that in 16% of the patients volumes were not at the same anatomical position. D95 (95% isodose line) covered 98% of PTV_3D and 88% of PTV_4D (P = .003). Mean lung V20 was 24.0% for the 3D-based plans and 22.7% for the 4D-based plans (P = .057). Mean heart V40 was 12.1% for the 3D-based plans and 12.7% for the 4D-based plans (P = .53). Mean spinal cord Dmax was 2517 and 2435 cGy for 3D-based and 4D-based plans, respectively (P = .019). Mean esophageal dose was 1580 and 1435 cGy for 3D and 4D plans, respectively (P = .13).
Comparison of treatment volumes between 2 imaging data sets.

Abbreviations: 3D, 3 dimensional; 4D, 4 dimensional; GTV, gross tumor volume; GTVN, gross tumor volume Node; GTVP, Gross tumor volume Primary; IGTV, internal gross tumor volume; ITVN, internal target volume Node; ITVP, Internal target volume Primary; PTV, planning tumor volume.
Except PTV all other volumes are significantly larger on 4D scan compared with FBCT scan.
Discussion
The FBCT scan commonly used to acquire imaging data set for contouring and treatment planning for lung cancer has several inherent problems. Image acquisition through FBCT scan is based on the assumption that the target of interest in the thoracic cavity remains stationary during the collection of 360° projection data. In reality, the target follows a 3D complex motion during a full respiratory cycle and the acquired image may be distorted due to intraslice and interscan artifacts. Furthermore, there may be blurring of GTV due to tumor motion resulting in decreased resolution at the tumor boundaries. The combined effect of these image artifacts may result in uncertainties in tumor delineation, suboptimal dose to the tumor, and unnecessary higher dose to the surrounding normal structures.15,16
The 4D-CT scan is the reconstruction of 3D volume as a function of time with organ motion inclusive. The image data set is created by tagging respiratory tracing produced by a surrogate marker with the acquired images at a particular phase of breathing. As a result, multiple 3D image data sets are produced representing full trajectory of the tumor and OAR. Gross tumor volume can be delineated on these data sets on each respiratory phase of the cycle and summed to create internal target volume (ITV). Hence, the PTV margin in a radiotherapy plan based on the 4D image database is small to account only for day-to-day setup variation. 16
Several investigators have previously explored the utility of 4D-CT scan in the treatment planning of lung cancer. Rietze et al compared GTV of the patients with lung cancer delineated on helical CT and 4D-CT scans. Gross tumor volume derived from 4D data sets, as a summation from all the phases of the respiratory cycle was larger than the GTV contoured on helical CT scan (39.9 vs 24.4 cm3). Although the mean GTV between 2 scans was similar, GTV derived from helical scan was distorted in shape due to image artifacts. 17
In a Canadian study with 24 patients with NSCLC, a helical CT and a 4D-CT scan were obtained in the same treatment position. Gross tumor volume delineated on 4D data set was on average 24.8% larger than the GTV delineated on helical CT scan. Mean lung dose and V20 lung volumes were reduced with 4D-CT planning compared with conventional 3D-CT planning, with additional reduction in dose to the lungs when respiration-induced motion was incorporated throughout the process of imaging, radiation treatment planning, and treatment delivery. 18
In this study, we have examined the clinical utility of the volumes generated from 2 imaging modalities by creating radiation treatment plans from both imaging data sets. We have compared GTV_3D and IGTV_4D for a quantitative difference and an overlap between the volumes. We have analyzed the effect of motion in delineation of GTV of the primary and nodal disease separately. The FBCT and 4D-CT images were acquired in the same treatment position, with the same immobilization and during the same simulation session. It is also noticeable that in our study the PET scan was incorporated for the delineation of volumes in 50% of the patients for both imaging modalities. In our center, we routinely use PET-CT simulation for radiotherapy planning of locally advanced lung cancer. 19 Clinical target volume was created for both imaging data sets with the same margin. Same beams with the same gantry angles and beam-modifying devices were superimposed on contours generated from the 4D-CT data set. We found that both gross lung primary and nodal volumes combined or individually were significantly larger on 4D-CT scan than the volumes created through FBCT scan (Table 2). Individual patient data displayed in Figure 1 show greater variability of IGTV_4D compared with GTV_3D, indicating the tumor trajectory affected by motion not recognized by FBCT in most of the patients. Paradoxically, PTV_3D was larger than PTV_4D, although the difference was not statistically significant. This may be due to smaller margins (8 mm) to account for the setup errors only for PTV_4D compared with PTV_3D (1 cm axially and 1.5 cm superior/inferior) which included both—the anticipated motion of the GTV based on population statistics and the margin for setup errors. 20 Interestingly, when the 3DCRT plan was superimposed on PTV_4D, some of the 4D_PTV was not encompassed by the 3DCRT 95% isodose line and dose coverage was more variable than 3D plans (Figure 2). This is likely due to the difference in the anatomical location between the 2 volumes caused by unpredictable trajectory of the tumor during a breathing cycle. We confirmed this observation with DIC analysis. Dice Similarity Coefficient can compare and determine the overlap between 2 volumes of similar size at 2 different anatomical locations. 19 Dice Similarity Coefficient for PTV_3D and PTV_4D was 84%, indicating 16% of volumes were nonoverlapping which could be the effect of tumor motion with alteration of shape and position of the GTV (Figure 3). Inability of FBCT to account for change in anatomical shape and position of GTV due to 3D motion likely contributed to under-coverage of PTV_4D.
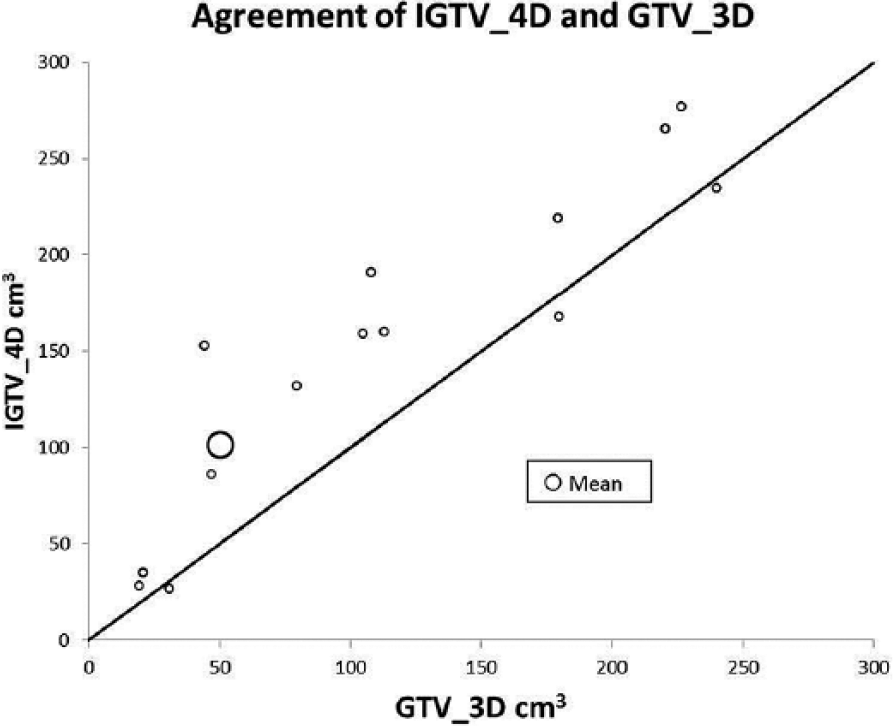
Relationship between IGTV_4D and GTV_3D and individual variation in volume in each data set. The diagonal line represents perfect agreement between the 2 volumes. 3D indicates 3 dimensional; 4D, 4 dimensional; GTV, gross tumor volume; IGTV, internal gross tumor volume.

Minimum isodose coverage of PTV: variability was more pronounced in the 3DCRT plans superimposed on the 4D-CT data set compared with plans generated with FBCT data set indicating under-coverage due to the impact of incorporating 4D-CT gross tumor. The diagonal line represents perfect agreement. 3DCRT indicates 3-dimensional conformal radiotherapy; 4D-CT, 4-dimensional computed tomographic; FBCT, free-breathing CT; PTV, planning tumor volume.

Dice Similarity Coefficient for PTV_3D and PTV_4D. The mean DIC was 84%. 3D indicates 3 dimensional; 4D, 4 dimensional; PTV, planning tumor volume.
The observed differences are primarily due to tumor trajectory during the breathing cycles not captured by FBCT. Tumor motion can be influenced by several patient-related and tumor-related factors. Application of generic margins based on population statistics without defining the trajectory of tumor motion in an individual patient can cause geographic miss, compromise local control, and may increase the risk of normal tissue toxicity due to unnecessary larger margins for PTV.21–23 Further tumor motion can be unpredictable, as hysteresis is a well-recognized phenomenon which may not be captured by FBCT with a potential adverse effect on the dosimetry of the radiotherapy plan.24,25
In our study, we combined primary lung tumor and nodal disease to create GTV and ITV. Subset analysis of the 5 patients with both primary and nodal disease revealed that nodal volumes were almost 100% larger in 4D-CT compared with 3D data set (Table 2). The change in nodal volume is attributed to the nodal motion not captured by FBCT. Mediastinal nodal motion is a recognized entity in radiotherapy planning of lung cancer. A retrospective study of 41 patients with lung cancer with 100 mediastinal nodes contoured on 4D-CT in all the phases of respiratory cycle reported a significant range of motion for the mediastinal nodes. Most of the nodes (77%) moved more than 0.5 cm and a few (10%) moved more than 1 cm with an average range of motion of 0.68 cm. 26
Mean esophageal, spinal cord, and lung dose was lower and mean heart was higher in the plan generated with PTV_4D compared with the plan with PTV_3D. However, these differences were not statistically significant. Previous studies have indicated reduced dose to the OAR with incorporation of 4D-CT scan in radiation planning of lung cancer. 18 Various stages of the lung cancer patients and small sample size in our study may have offset any statistically significant reduction in dose to OAR.
The remarkable outcome of stage I NSCLC treated with stereotactic body radiotherapy (SBRT) is due to our ability to deliver radiation to the gross tumor, which is highly precise, focused, least toxic to neighboring normal structures, and biologically effective. The 4D-CT scan is an essential requirement for SBRT planning which is not always the case for locally advanced lung cancer. 13 We have also learned from our SBRT experience that a biological equivalent dose (BED10) of at least 100 Gy10 is needed to achieve a local control of 90% in lung cancer. 27 Unfortunately, in the case of locally advanced NSCLC, treatment with conventional radiotherapy techniques has failed to make any significant improvements in the locoregional control. 28 In RTOG 0617, 74 Gy was associated with inferior survival outcome compared with 60 Gy radiotherapy. 1 It is unclear why this is the case as dose escalation is associated with higher local control.29,30 One reason might be that 4D-CT imaging was not mandated in the radiotherapy planning. More conformal radiation from intensity-modulated radiotherapy (IMRT), which was permitted to meet the planning objective for the 74-Gy arm, may have also led to higher rates of geographic miss due to tumor motion.
Limitations of Our Study
Our study has a small sample size but highlights the significance of precise target volume definition with 4D-CT imaging even in a small data set. The importance of target volume coverage is paramount to the effectiveness of radiotherapy, so even a few patients with suboptimal coverage using a standard approach is worrisome. We have not created IMRT plans with PTV margins as delineated for 4D plans to determine the clinical implications of planning on IGTV_4D. Only 5 of 14 patients were actually treated, including primary and mediastinal disease; hence, sample size is too small to determine the implications of motion due to lung primary and nodal disease separately.
Conclusions
This pilot study was fashioned to determine the usefulness of 4D-CT on treatment planning of lung cancer. Our data from 3D-FBCT treatment planning suggest that with uncertainty in tumor motion, larger margins are needed to ensure tumor coverage at the expense of higher dose to OARs. All patients with lung cancer treated radically or with high-dose palliative radiotherapy should be planned based on 4D-CT imaging. Currently, our institution has commenced implementation of 4D-CT routinely as part of radiotherapy planning for curative intent for stage II/III NSCLC as a result of findings from this study.
Footnotes
Acknowledgements
The authors acknowledge CancerCare Manitoba Foundation (CCMF) for provision of research funding and support for this study. They also acknowledge Dr. Zoann Nugent for statistical support and Dr. Ethan Lyn for his contributions in the design of the protocol for this study.
Peer review:
Four peer reviewers contributed to the peer review report. Reviewers’ reports totaled 568 words, excluding any confidential comments to the academic editor.
Funding:
The author(s) received no financial support for the research, authorship, and/or publication of this article.
Declaration of conflicting interests:
The author(s) declared no potential conflicts of interest with respect to the research, authorship, and/or publication of this article.
Author Contributions
Conceived and designed the experiments: SV, NA. Analyzed the data, NA, SV, SL, KJ and KS. Wrote the first draft of the manuscript: NA. Contributed to the writing of the manuscript: SL and SV. Agree with manuscript results and conclusions: NA, SV, SL, KJ and KS. Jointly developed the structure and arguments for the paper: NA SL. SV Made critical revisions and approved final version: NA, SL and SV. All authors reviewed and approved of the final manuscript.