
Abstract
Background:
Single nucleotide polymorphisms (SNPs) in the low-density lipoprotein receptor-related protein 5 (LRP5) and the low-density lipoprotein receptor-related protein 5 (LRP6) genes have been implicated in the pathogenesis of type 2 diabetes mellitus (T2DM) and obesity (OB). This study aimed to evaluate the polymorphisms in LRP5 and LRP6 genes in postmenopausal patients with T2DM and OB.
Methods:
Participants were categorized into the Non-T2DM group (n = 53) and the T2DM group (n = 89) based on glycemic levels. Baseline data and biochemical indices were collected, Bone mineral density (BMD) was measured using dual-energy X-ray absorptiometry, and SNPs at the LRP5 and LRP6 loci were assessed by time-of-flight mass spectrometry.
Results:
1. There was a statistical difference in the distribution of genotypes (CC/CT) at locus rs4988331 (χ2 = 67.940, P = .000) and in the distribution of alleles (C/T) between the T2DM and non-T2DM groups (χ2 = 50.506, P = .000). Additionally, there were significant differences in the allele (G/A) at locus rs11054704, and both allele (G/T) and genotype (GG/GT) distributions at locus rs1181334 between the OB group and the normal weight group (P < .05). 2. OB was identified as a risk factor for T2DM in individuals with the wild-type at locus rs1181334, and the interaction between wild-type and mutant was significant (P < .05). 3. Multifactorial logistic regression analysis revealed that BMD (OR 3.755; 95% CI, 1.215-11.608) and triglyceride-glucose (TyG) index (OR 2.855; 95% CI, 1.361-5.986) were risk factors for T2DM in postmenopausal women, whereas alkaline phosphatase (ALP; OR 0.970; 95% CI, 0.945-0.995) and rs4988331 mutation (OR 0.018; 95% CI, 0.006-0.060) were protective factors.
Conclusion:
Mutations at the LRP5-rs4988331 locus, as well as the LRP6-rs11054704 and rs1181334 loci, may be associated with the development of T2DM and OB in postmenopausal women.
Plain Language Summary
Why was the study done? The incidence of T2DM and OB is increasing year by year, and the pathogenesis is still unclear. Mutations in the LRP5 and LRP6 genes have been considered to be related to T2DM and OB. Therefore, this study aims to evaluate the correlation of the polymorphisms in the LRP5 and LRP6 genes in postmenopausal patients with T2DM and OB. What did the researchers do? This case-control study collected data from 142 postmenopausal women, divided into a non-Type 2 Diabetes Mellitus (T2DM) group (n = 53) and a T2DM group (n = 89). Baseline data and biochemical indicators were collected. Bone mineral density (BMD) was measured using dual-energy X-ray absorptiometry, and single nucleotide polymorphisms (SNPs) at the LRP5 and LRP6 loci were assessed by time-of-flight mass spectrometry, followed by statistical analysis. What did the researchers find? Mutations at the LRP5-rs4988331 locus, as well as the LRP6-rs11054704 and rs1181334 loci, are associated with the occurrence of T2DM and OB in postmenopausal women. What do the findings mean? This is a clinical study where we have identified the correlation between LRP5 and LRP6 with T2DM and OB. We can conduct animal and cell experiments targeting the mutations at these gene loci to elucidate the roles of LRP5 and LRP6 in the development of T2DM and OB, thus providing a research foundation for the prevention and treatment of T2DM and OB.
Introduction
Type 2 diabetes mellitus (T2DM) is a multifactorial disease characterized by hyperglycemia due to impaired insulin secretion and insulin resistance. 1 Prolonged hyperglycemia often leads to microvascular complications and peripheral neuropathy, causing dysfunction of various organs and leading to a variety of complications that threaten patients’ health. 2 Approximately 1 in 11 adults worldwide suffer from diabetes mellitus, with T2DM accounting for 90% of these cases, resulting in a significant economic burden. 3 Existing studies have confirmed that both genetic and environmental factors contribute to the occurrence of T2DM, and while the pathogenesis still requires further elucidation, genetic susceptibility plays a crucial role. 4 The prevalence of obesity (OB) is increasing annually. OB is associated with insulin resistance and shares common pathophysiological mechanisms with T2DM. Cytokines secreted by adipose tissue are linked to inflammation and various endocrine functions. 5
In recent years, genome-wide association studies (GWAS) have identified many single nucleotide polymorphisms (SNPs) associated with T2DM and OB, including those in regions related to the Wnt signaling pathway (eg, LRP5, LRP6, SOST, WNT10B, WNT16, SFRP1, FOXC2, LRP4, GPR177, and CTNNB1).6,7 As a key factor initiating the downstream pathway of Wnt signaling, LRP5 acts as a protective factor against T2DM by promoting insulin signaling and increasing insulin production, thereby reducing blood glucose levels. 8 Additionally, LRP5 and LRP6 are involved in glucose and cholesterol metabolism. Some studies have found that their gene polymorphisms are associated with obesity and obesity-related metabolic factors, such as dyslipidemia and body mass index (BMI). Hence, they may be potential susceptibility genes for T2DM and OB.9,10 However, the specific mechanism of action of the LRP5 and LRP6 genes in T2DM and OB remains unclear.
Therefore, this study aimed to investigate the effects of SNPs of LRP5 and LRP6 on T2DM and OB susceptibility and their interactions in postmenopausal women, and to identify clinical influences on T2DM and OB in postmenopausal women. This study is expected to discover new biological pathways and lay the foundation for the prevention and treatment of T2DM and OB.
Methods and Materials
General materials
From January to May 2024, basic data were collected from postmenopausal women attending outpatient clinics in the Shihezi region of Xinjiang. Inclusion criteria: The diagnostic criteria for T2DM were based on the 2020 Chinese Diabetes Diagnosis and Treatment Guidelines, and the OB diagnostic criteria were based on the “Adult Obesity Dietary Guidelines” released by the National Health Commission in 2024. Exclusion criteria: (I) Type 1 diabetes and mitochondrial diabetes; (II) Severe heart disease and liver disease; (III) Physical disability; (IV) Malignant tumors; (V) Mental illness; and certain drugs causing diabetes and obesity.
Methods
Collection of baseline data
Baseline measurements included gender, age, blood pressure, height, weight, body mass index (BMI), and waist-to-hip ratio (WHR). Fasting venous blood (5 ml) was collected from each subject in the morning, and serum concentrations of fasting blood glucose (FBG), calcium (Ca), phosphorus (P), alkaline phosphatase (ALP), triglycerides (TG), creatinine (Cr), blood urea nitrogen (BUN), uric acid (UA), albumin (ALB), high-density lipoprotein cholesterol (HDL-C), and low-density lipoprotein cholesterol (LDL-C) were measured using the Roche automatic biochemical analyzer (Modular DPP-H7600). Hemoglobin A1C (HbA1c) was determined using high-pressure liquid chromatography.
Calculation of related indices
• Body mass index (BMI) = Weight (kg)/Height (m)2. BMI between 18.0 and 23.9 kg/m2 is considered normal weight, 24.0 to 27.9 kg/m2 is considered overweight, and BMI ⩾ 28 kg/m2 is considered obese.
• Waist-to-hip ratio (WHR) = Waist circumference (cm)/Hip circumference (cm). WHR ⩾ 0.8 is considered abdominal obesity.
• Triglyceride-glucose index (TyG index) = Ln(TG (mg/dL) × FBG (mg/dL)/2).
• TyG-BMI index = TyG index × BMI.
• TyG-WC index = TyG index × WC.
Measurement of BMD
Bone mineral density (BMD) was measured at the lumbar spine (L1-L4), total hip, femoral neck, and Ward’s triangle (g/cm2) using dual-energy X-ray absorptiometry (DPX Prodigy; GE Lunar DEXA). A T-score between −1 and +1 is considered normal, −1 to −2.5 indicates decreased bone mass, and ⩽−2.5 indicates osteoporosis (OP).
DNA extraction
5 mL of fasting venous blood was collected from each subject in the morning, and anticoagulant (EDTA) was added immediately. DNA was extracted and stored at −20°C for later use. For long-term storage, samples were fixed with anhydrous ethanol.
Genetic distribution
Based on our sample, the calculated genetic effect is as follows: rs4988331 (0.478) rs599083 (0.020) rs1181334 (0.001) rs11054704 (0.010).
Polymorphisms of the LRP5 and LRP6 gene loci were determined using matrix-assisted laser desorption/ionization time-of-flight mass spectrometry (MALDI-TOF-MS).
Statistical processing
Measurements were expressed as mean ± standard deviation; categorical variables are expressed as numbers and percentages. Chi-square test, Fisher’s exact test, binary logistic regression, Pearson correlation analysis and linear regression were used to analyze the relationship between genetic polymorphisms and T2DM and OB, and the influencing factors of T2DM. ROC curve analysis was used to evaluate the diagnostic value of TyG, TyG-BMI and TyG-WC in T2DM. SPSS 25.0 statistical software was used to process the data, and the statistical significance was set to P < .05.
Result
Baseline data of participants
The study included 142 subjects, divided into a normal control group (n = 53) and a T2DM group (n = 89) based on their medical history and FBG results. The findings revealed that the T2DM group had significantly higher FPG, HbA1C, TyG, TyG-BMI, and TyG-WC compared to the normal control group (P < .01), while AST, ALB, Cr, HDL-C, and ALP were lower than those in the normal control group (P < .05; Table 1). Baseline data comparison revealed that the T2DM group had higher WHR, LDL, TyG, TyG-BMI, and TyG-WC, but lower AST, ALB, Cr, HDL, and ALP. This may be due to abnormal glucose metabolism often being accompanied by abnormal lipid metabolism, 11 with individuals with abdominal obesity more likely to experience glucose and lipid metabolic disorders. This suggests that diet and weight control can reduce insulin resistance and lower blood glucose, consistent with previous research. 12 Huo et al 13 found that reducing the TyG index can decrease insulin resistance and be used for early-stage T2DM screening and risk assessment.
Comparison of baseline information between groups (xˉ ± s).

P < .05 compared with Non-T2DM.
Comparison of biochemical indices of LRP6 gene mutations
Baseline data analysis of different genotypes of each SNP revealed that at the rs4988331 locus, there were differences in the distribution of FPG, Cr, ALB, HbA1c, and AST between wild-type and mutant genotypes. At the rs599083 locus, a statistically significant difference in ALB distribution was observed between wild-type and mutant genotypes. At the rs11054704 locus, a statistically significant difference in age was found between wild-type and mutant genotypes, while at the rs1181334 locus, statistically significant differences in age and HbA1c distribution were noted between wild-type and mutant genotypes. At the rs11054704 locus, compared to the wild type (GG), the mutant type (AA/GA) in the Non-T2DM group has higher age and menopausal (P < .05), and the mutant type in the T2DM group has higher BMI and ALP levels, which has lower HDL-C (P < .05). At the rs1181334 locus, compared to the wild type (GG), the mutant type (GG/GT) in the Non-T2DM group also had higher age and menopausal (P < .05), and the mutant type in the T2DM group had higher BMI and lower HDL-C (P < .05). There were no statistically significant differences in the remaining parameters (Tables 2 and 3). This suggests that LRP6 gene mutations do not affect the average age distribution and glycation of postmenopausal women regardless of T2DM, but the presence of T2DM may be a confounding factor for the BMI difference at the rs11054704 locus. Current research on the LRP5 gene in mice shows that mice expressing the high bone mass mutant LRP5 allele are leaner, with reduced TG and free fatty acid levels. 14
Comparison of wild type and mutant type at LRP5 gene rs11054704 locus with biochemical parameters between non-T2DM group and T2DM group (xˉ ± s).

*P < 0.05 compared with GG genotype.
Comparison of wild type and mutant type at LRP5 gene rs1181334 locus with biochemical parameters between non-T2DM group and T2DM group (xˉ ± s).

P < .05 compared with GG genotype.
Association of LRP5 and LRP6 genotype and allele distribution with T2DM
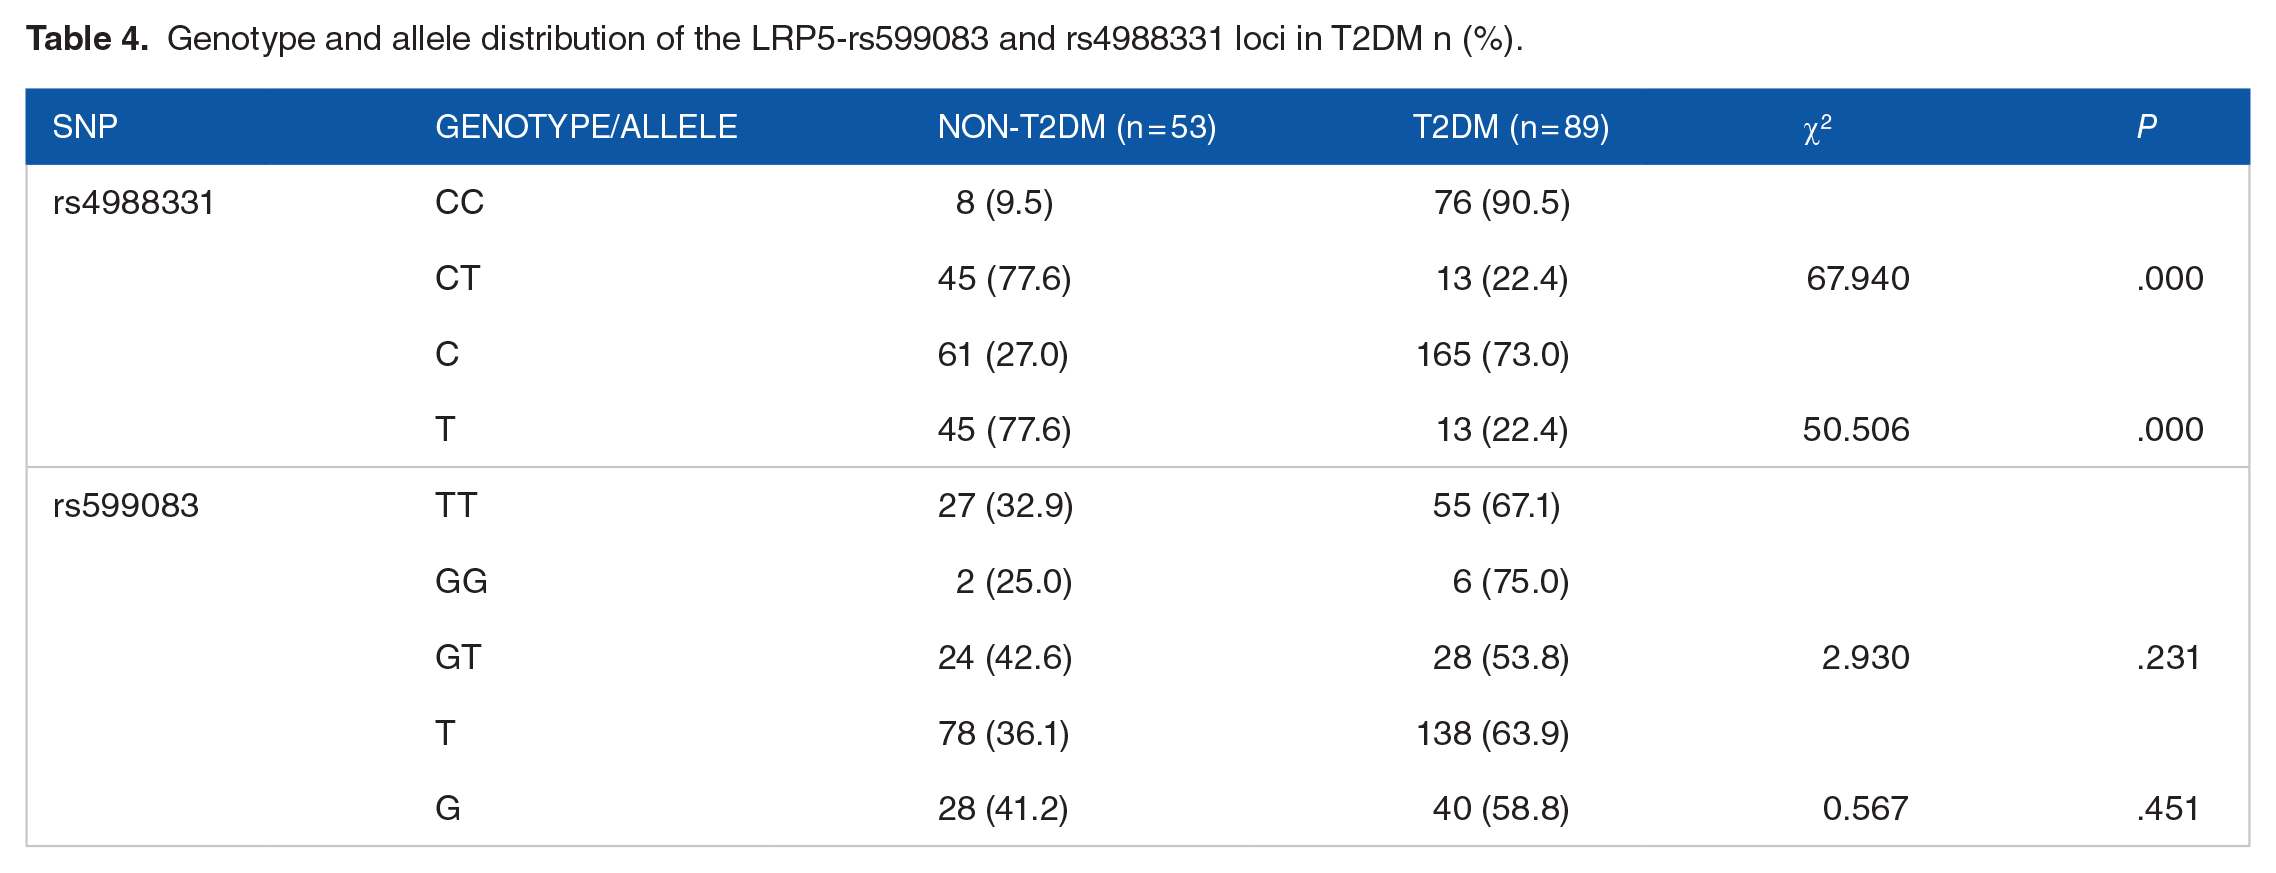
The genotype distributions of LRP5-rs4988331, rs599083, and LRP6-rs11054704, rs1181334 loci all conformed to the Hardy-Weinberg equilibrium (P > .05). There was a statistically significant difference in the genotype and allele distribution of the LRP5-rs4988331 locus between the diabetes and non-diabetes groups (P < .01). No statistically significant differences were found in the genotype and allele distribution frequencies of the other loci between the groups (P > .05; Table 4).
Genotype and allele distribution of the LRP5-rs599083 and rs4988331 loci in T2DM n (%).
Distribution differences of T2DM and OB
There were no statistically significant differences in the distribution of T2DM and OB among postmenopausal women (P > 0.05; Supplemental Table 1).
Relationship between genotype and allele distribution of LRP6 gene and OB
Based on BMI measurements, the study subjects were divided into normal weight group (n = 43), overweight group (n = 60), and OB group (n = 39). No statistically significant differences were found in the genotype and allele distribution frequencies of the LRP5 gene rs4988331 and rs599083 loci between these groups (P > .05). For the LRP6 gene rs11054704 locus, there was a statistically significant difference in alleles G and A between the normal weight group and the OB group. At the rs1181334 locus, there were statistically significant differences in genotypes GG and GT, as well as alleles G and T, between the normal weight group and the OB group (P < .05; Table 5).
Genotype and allele distribution of LRP-6 genes rs11054704 and rs1181334 in OB n (%).

Fisher’s exact probabilities.
Stratified association analysis
Postmenopausal women with the GG genotype at locus rs1181334 had a 2.427-fold higher risk of T2DM in obese postmenopausal women than in non-obese postmenopausal women (OR = 2.427, 95% CI (1.123-5.246), P = .024); and the LRP6-rs1181334& obesity and LRP6-rs11054704& obesity interacted with the occurrence of T2DM (P = .022; P = .050). However, no association between obesity and T2DM was found in the stratified analysis of different genotypes regarding the LRP5-rs4988331 and rs599083 loci (P > .05); and the interaction between LRP5-rs4988331& obesity and LRP5-rs599083& obesity and the occurrence of T2DM was not significant (P > .05; Supplemental Figure 1).
Multivariate logistic correlation
Model I multivariate logistic regression analysis confirmed that Cr (OR = 0.962, 95% CI (0.935-0.990), P = .009), HDL (OR = 0.290, 95% CI (0.092-0.908), P = .034), ALB (OR = 0.783, 95% CI (0.655-0.937), P = .007), AST (OR = 0.950, 95% CI (0.905-0.997), P = .036), ALP (OR = 0.950, 95% CI (0.905-0.997), P = .023), rs4988331 (OR = 0.027, 95% CI (0.010-0.073), P = .000), TyG (OR = 1.932, 95% CI (1.162-3.212), P = 0.011), TyG-WC, (OR = 1.004, 95% CI (1.001-1.008), P = 0.013) and TyG-BMI (OR = 1.025, 95% CI (1.006-1.045), P = .012) were influencing factors for the occurrence of T2DM in postmenopausal women. Model II, which excluded TyG-WC and TyG-BMI due to their collinear relationship, revealed that Cr, HDL, ALB, and AST were not significant influencing factors for T2DM. However, BMD (OR, 3.755; 95% CI, 1.215-11.608) and TyG (OR, 2.855; 95% CI, 1.361-5.986) were identified as risk factors for T2DM, while the elevation of ALP (OR, 0.970; 95% CI, 0.945-0.995) and the mutation of rs4988331 (OR, 0.018; 95% CI, 0.006-0.060) are protective factors in this population (Table 6). This model indicates that the TyG index, which combines triglyceride and blood glucose levels, is associated with insulin resistance and may serve as a useful predictive tool for assessing the risk of T2DM in postmenopausal women. Furthermore, the identification of BMD as a risk factor may suggest the need for closer monitoring of T2DM in patients with osteoporosis.
Multivariate analyses of factors associated with T2DM.

Model I was adjusted for Age and BMI. Model II was adjusted for Age, BMI, BMD, TYG, Cr, AST, rs4988331, ALP, ALB.
Pearson correlation analysis and multiple linear regression of the TyG index
Pearson’s correlation analysis of TyG index with WC, AST, ALT, ALB, ALP, Cr, FPG, HbA1C%, TG, HDL, LDL, and BMD (L1-L4) showed a strong positive correlation between TyG index and serum TG levels in postmenopausal women (r = .863, P = .000) and a moderate positive correlation with FPG and HbA1C% (r = .541, P = .000; r = .417, P = .000). There was a moderately strong positive correlation with FPG and HbA1C% (r = .541, P = .000; r = .417, P = .000), a weak positive correlation with WC and BMD (r = .216, P = .010; r = .272, P = .001), and a weak negative correlation with HDL-C (r = −.327, P = .000). WC, FPG, HbA1C%, TG, HDL, and BMD (L1-4) were included in the multiple linear regression model resulting in the regression equation: Y(TyG) = 5.824 − 0.205 × (HDL) + 0.366 × (TG) + 0.077 × (FPG); (Supplemental Table 2).
ROC analysis of TyG, TyG-BMI, and TyG-WC indices with T2DM with OB
The diagnostic value of the TyG, TyG-BMI, and TyG-WC indices for T2DM with OB was evaluated using receiver operating characteristic (ROC) curves. The areas under the curve (AUC) for the TyG, TyG-BMI, and TyG-WC indices were 0.627, 0.807, and 0.738, respectively (P < .01). These findings demonstrate that all 3 indices have a certain diagnostic value for T2DM, with the TyG-BIM index having the largest area under the curve, indicating it has the highest diagnostic accuracy among the 3 indices (Figure 1).

ROC analysis of TyG, TyG-BMI, and TyG-WC.
Discussion
LRP5 and LRP6 are cell surface receptors associated with the activation of the Wnt signaling pathway, which have been implicated in insulin resistance and the decline of pancreatic beta cell function, with mutations in LRP5 potentially related to the development of T2DM. 15 OB is a significant risk factor for T2DM, and since LRP5 and LRP6 play roles in bone and energy metabolism, they may indirectly affect obesity by influencing bone mass and energy expenditure. For instance, certain variants of LRP5 have been associated with changes in bone mineral density and BMI. 16 LRP6 may be related to obesity by regulating the differentiation and maturation of adipocytes and affecting energy metabolism and fat distribution, with variations or dysfunction of LRP6 potentially impacting an individual’s body weight and fat distribution pattern. 17
Our study found that the mutation at the rs4988331 site of the LRP5 gene reduced the susceptibility to T2DM. However, mutations at the LRP5 gene’s rs599083 site and the LRP6 gene’s rs1181334 and rs11054704 sites did not show a direct association with T2DM. Different single nucleotide polymorphisms (SNPs) may have distinct functions and potential differences among various populations, which could lead to such inconsistencies. In another study the recessive model and the haplotype GCTCC at the LRP5 gene’s rs7102273 site were found to decrease the risk of T2DM. 10 A study by Zhang et al on adults found that the polymorphism of the LRP5 gene interacted with overweight and obesity to influence the risk of developing T2DM 18 ; the research by Yadav and Patel also suggested that mutations in the LRP5 gene lead to disruptions in glucose metabolism and obesity, 8 Chen et al ’s review article outlined the close relationship between the Wnt/c-Jun N-terminal kinase signaling pathway and insulin resistance, inflammatory responses, and dysfunction of pancreatic beta cells and endothelial cells, 19 indicating that the WNT signaling pathway may play a significant role in the risk of T2DM.
We also studied the relationship between 4 SNPs of the LRP5 and LRP6 genes and OB and found no association between the rs4988331 and rs599083 loci of the LRP5 gene and OB. However, the rs11054704 and rs1181334 loci of the LRP6 gene were significantly associated with OB, with the allele A of the rs11054704 locus and the allele T of the rs1181334 locus both increasing the risk of obesity in postmenopausal women. In a study of young Chinese men, mutations in 3 SNPs (Q89R, N740N, and A1330V) of the LRP5 gene were not associated with obesity. 20 A study on the drug carbamazepine showed that carbamazepine promotes fat production by inhibiting the expression of LRP6 in the Wnt/β-catenin pathway, leading to drug-induced obesity. 21 LRP6 increases the expression of insulin receptors by activating the canonical Wnt pathway, reducing the synthesis of low-density lipoprotein and triglycerides. 22
Additionally, gene stratification analysis found that in the GG genotype of the rs1181334 locus, there was a significant difference in the distribution of OB between the T2DM and Non-T2DM groups, with the prevalence of T2DM in OB patients being 2.43 times higher than that in non-OB patients. There was also a significant interaction between different genotypes at the rs1181334 locus. This suggests that LRP6 plays an important role in mediating OB in postmenopausal Han women with T2DM. This study was a case-control study, and the specific mechanisms of LRP6 and LRP5 genes in T2DM and OB are still unclear, requiring further animal and cytological experiments for validation.
After adjusting for factors such as age, BMI, Cr, AST, and ALB, multivariate logistic regression analysis for T2DM showed that increased BMD and elevated TyG index were risk factors for T2DM in postmenopausal women, while elevated ALP and mutation at the rs4988331 locus were protective factors. Napoli et al 23 showed that BMD decreases in T1DM patients, but BMD is usually normal or even slightly elevated in T2DM patients of the same age group. Huang et al 24 also demonstrated a significant association between T2DM and OP risk and higher BMD, consistent with the findings of this study, which may be related to the age distribution differences, medication use in T2DM patients, or related pathogenesis in this study. Pearson correlation analysis showed that the TyG index was positively correlated with WC, BMD, FPG, HbA1c, and TG, and weakly negatively correlated with HDL, with the regression equation being: Y(TyG) = 5.904 + (−0.206) × HDL + 0.366 × TG + 0.077 × FPG. The TyG index in T2DM patients is proportional to the number of inflammatory cells. 25 ROC curve analysis in this study found that the TyG index, TyG-BMI index, and TyG-WC index could all predict T2DM, but the test efficacy was not high. This indicates that the TyG index can reflect the degree of insulin resistance and the pathological state of T2DM to a certain extent, and its changes can be used to monitor the disease progression and treatment effects in T2DM patients.
Conclusion
In summary, this study found that different genotypes of LRP5 and LRP6 and their interactions with obesity may increase the risk of T2DM in postmenopausal Han Chinese women. Additionally, using the TyG index and its related indices to predict T2DM may have the potential to predict the susceptibility of postmenopausal Han Chinese women to T2DM. The limitation of this study is that we only collected postmenopausal Han Chinese women from the Shihezi area in Xinjiang as research subjects, and the sample size is small, without considering differences in race, gender, regional culture, etc. Despite the limited sample size of this study, it can still provide valuable preliminary explorations and basic data for follow-up larger-scale studies. The next step in our research will be to expand the sample size and conduct basic experiments to further explore the specific mechanisms.
Mutations at the LRP5-rs4988331 locus, as well as the LRP6-rs11054704 and rs1181334 loci, may be associated with the development of T2DM and OB in postmenopausal women.
Supplemental Material
sj-docx-1-end-10.1177_11795514241307180 – Supplemental material for The Relationship Between LRP-5 and LRP-6 Gene Mutations and Postmenopausal Type 2 Diabetes and Obesity
Supplemental material, sj-docx-1-end-10.1177_11795514241307180 for The Relationship Between LRP-5 and LRP-6 Gene Mutations and Postmenopausal Type 2 Diabetes and Obesity by Jun Li, Ya Li, Yunqiu Lu, Siyuan Li, Yecheng Zhu, Chuanbing Sun, Partab Rai and Xuehai Jia in Clinical Medicine Insights: Endocrinology and Diabetes
Footnotes
Acknowledgements
Jun Li is the corresponding author; Jun Li is the first author, Ya Li, Yunqiu Lu, and Siyuan Li are the co-first authors. Thanks to all authors for their participation and support.
Declarations
Supplemental Material
Supplemental material for this article is available online.
References
Supplementary Material
Please find the following supplemental material available below.
For Open Access articles published under a Creative Commons License, all supplemental material carries the same license as the article it is associated with.
For non-Open Access articles published, all supplemental material carries a non-exclusive license, and permission requests for re-use of supplemental material or any part of supplemental material shall be sent directly to the copyright owner as specified in the copyright notice associated with the article.