
Abstract
We describe 2 families with 5 members from 2 generations whose clinical and laboratory characteristics over up to 15 years were consistent with dysglycemia/impaired glucose tolerance. In both families (2 probands and 3 family members), long-term follow-up excluded diabetes type 1 and type 2. Diabetes type 1 antibodies were persistently negative and C-peptide levels were normal. In Family 1, the proband, during a follow-up of 7 years (10.3-17.5 years of age), exhibited persistently high HbA1c (>5.7%) with fasting blood glucose levels mostly higher than 100 mg/dl and postprandial glucose levels up to 180 mg/dl. She eventually required oral anti-diabetics with an improvement in glycemic balance. The father and sister also had persistent mild hyperglycemia with borderline high HbA1c (mostly > 5.7%) levels over 15 and 6.2 years respectively. In Family 2, the proband exhibited borderline high fasting hyperglycemia (>100 mg/dl) at age 16.2 years with increasing HbA1c levels (from 5.6%–5.9%) and impaired glucose tolerance at age 18.3 years (2 h blood glucose 156 mg/dl after 75 g glucose). His sister also exhibited borderline hyperglycemia with borderline high HbA1c over 2 years (13.6-15.4 years). These subjects shared a unique phenotype. They are tall and slim with decreased BMI. Three subjects from Generation II failed to thrive during infancy. In view of the data from 2 generations suggesting maturity-onset diabetes of the young (MODY) with autosomal dominant inheritance, we sought to analyze the MODY genes. In Family 1, the molecular analysis by the MODY panel including 11 genes and whole exome sequencing did not detect any mutation in the proband. In Family 2, the MODY panel was also negative in the proband’s sister. These families may represent a hitherto unidentified syndrome. Unique features described in this report may help to reveal additional families with similar characteristics and to decipher the molecular basis of this syndrome. In selected cases, oral antidiabetics in adolescents may improve the glycemic balance.
Introduction
A diagnosis of MODY should be considered in individuals who have atypical diabetes and multiple family members from several generations with diabetes not characteristic of type 1 or type 2 and transmitted as an autosomal dominant trait. 1 Thus, 5 subjects from 2 families, spanning 2 generations, who presented with dysglycemia/impaired glucose tolerance over a longstanding follow-up and exclusion of diabetes type 1 and 2 initially suggested MODY. In most patients, MODY results from β cell dysfunction in varying severity according to the mutations involved. To date, 11 genes have been identified. The disease remains undiagnosed in many subjects unless hyperglycemia is detected during routine laboratory examination. The onset of diabetic manifestations typically occurs in subjects below 25 years. Misdiagnosis as type 2 or even type I diabetes has also been reported.2,3 In cases with unexplained hyperglycemia, a family history of diabetes is an important clue for the diagnosis of MODY. Except for rare cases, the subjects are rarely insulin-dependent, and oral antidiabetics are beneficial in many cases. Despite increasing awareness and improved molecular evaluation, many MODY cases remained still undiagnosed.4 -6
Case reports
We describe 2 families with at least 5 members whose clinical and laboratory characteristics up to 15 years of follow-up have not been consistent with diabetes type 1 or 2 but rather suggestive of MODY (Figure 1. Pedigree). The pedigrees were consistent with an autosomal dominant trait since dysglycemia and phenotypic characteristics were transmitted only by one of the parents to the next generation in both families. As shown below, dysglycemia/impaired glucose tolerance by accepted criteria was evident in all subjects from 2 families over 2 generations (2 probands and 3 family members). 7 Throughout follow-up, diabetes type 1 antibodies were negative and C-peptide levels remained normal in both index cases and family members with mild hyperglycemia (Tables 1 and 2). Only the mother in Family 2 did not exhibit dysglycemia, but carried the typical phenotypic characteristics with tall stature and low body mass index (BMI). In both families, affected individuals carried unique phenotypic characteristics with tall stature and decreased BMI. In all family members the BMI was calculated by dividing their weight in kg by the square of height in meters (kg/m2).

The pedigree of 2 families with MODY-like syndrome.
Long-term laboratory data of the index case from Family 1, generation II, over 7 years and the effect of repaglinide.

Fasting blood glucose. Normal values: HbA1c, 4 to 5.7%, glucose, 70 to 100 ng/dl, C-Peptide, 298 to 2350 pmol/l, GAD Ab, 0 to 25 IU/ml, Islet Cell Ab, <7 U/ml, Insulin Ab, <12 U/ml, Insulin, 2 to 29 mIU/l.
Long-term laboratory data in subjects with MODY-like syndrome from 2 families.
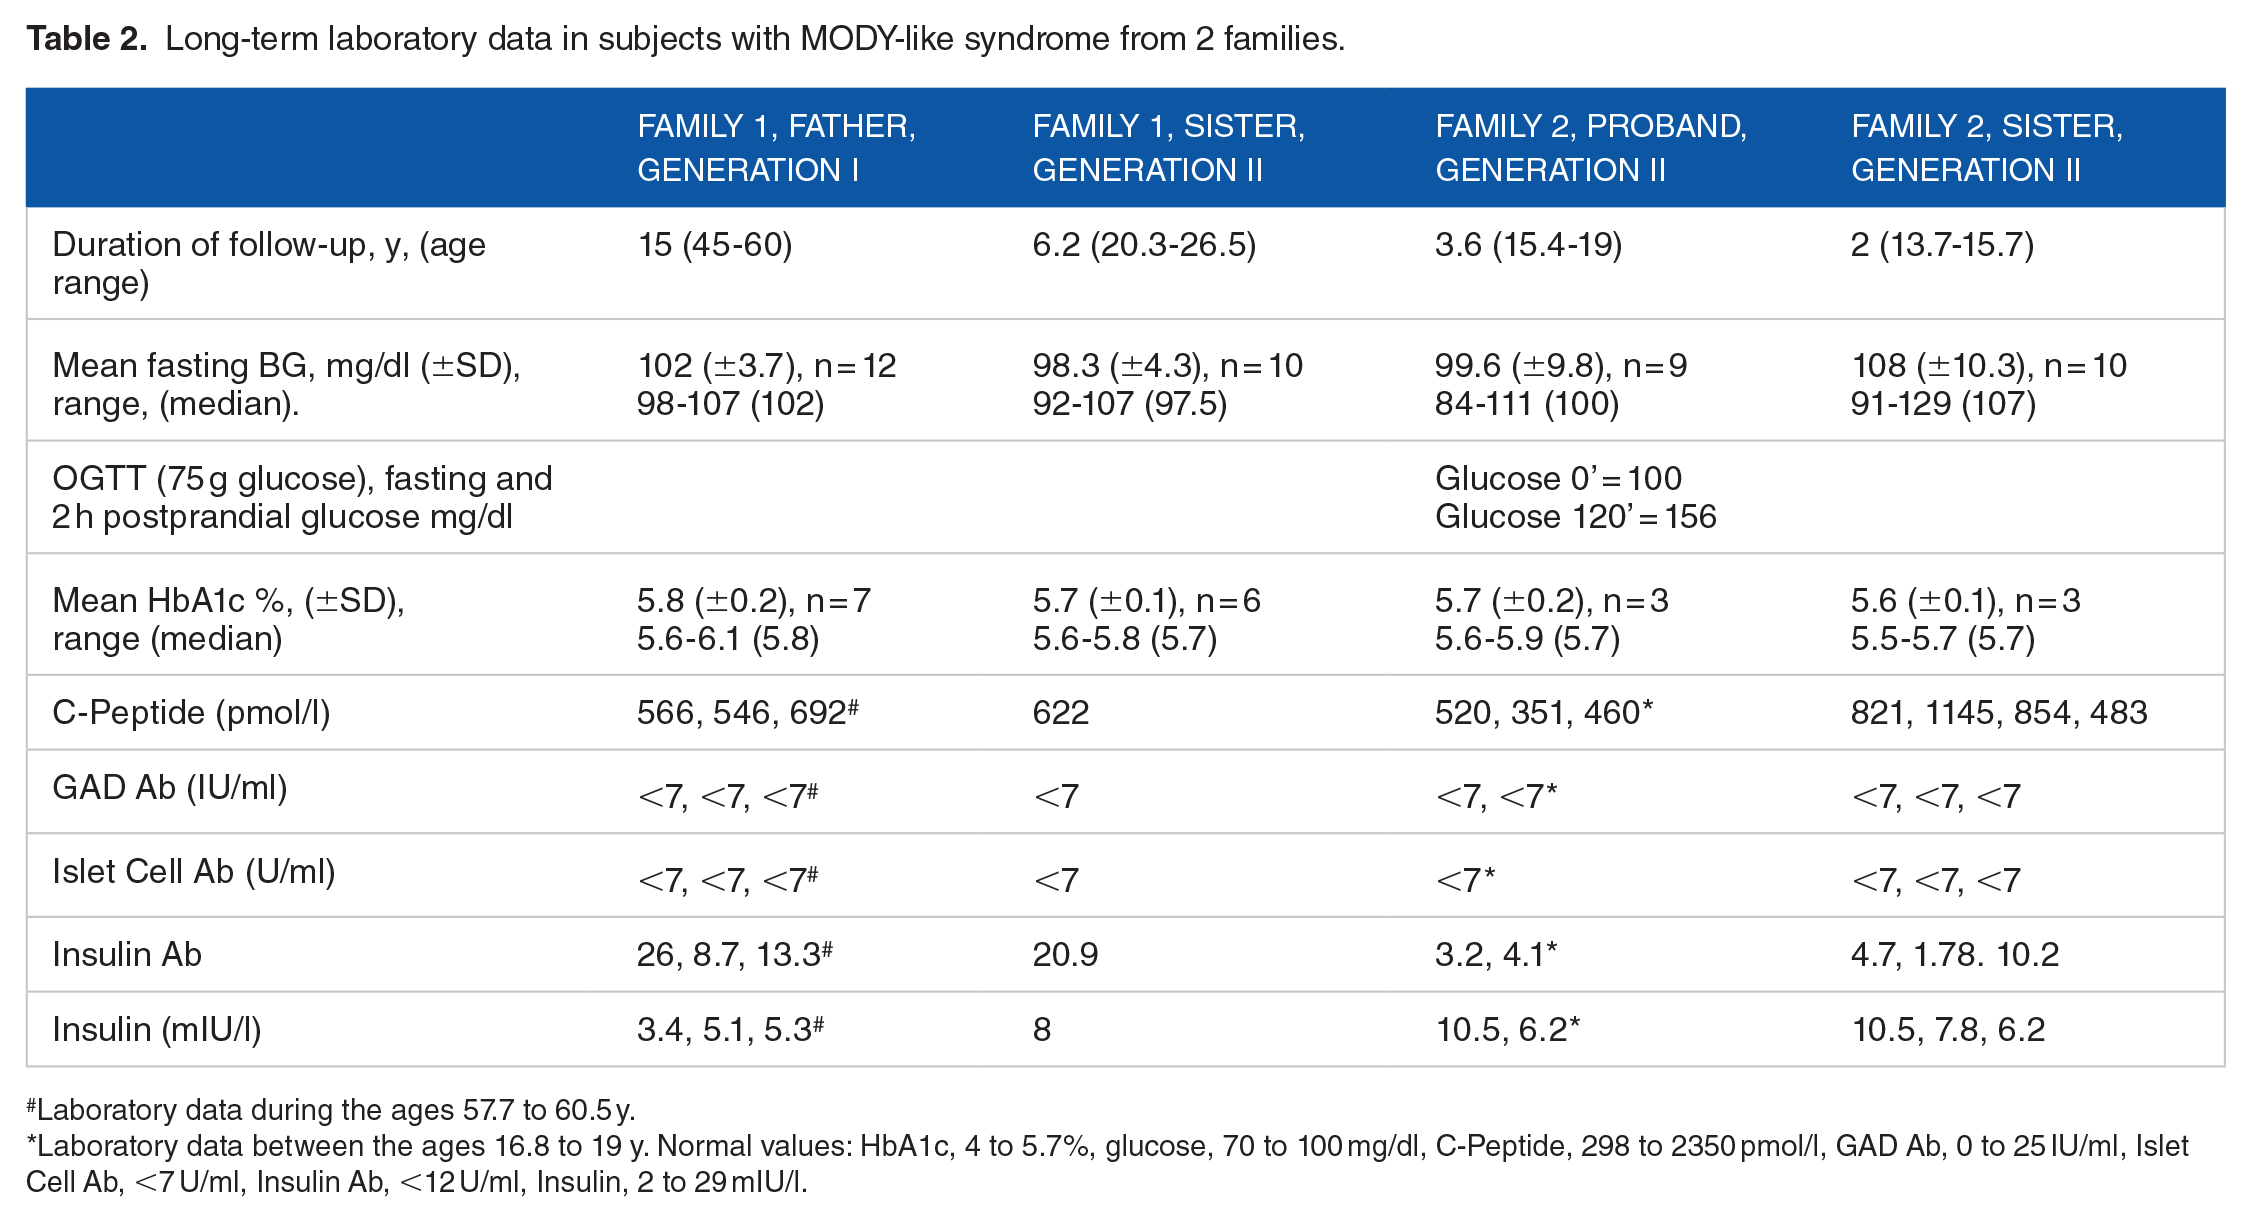
Laboratory data during the ages 57.7 to 60.5 y.
Laboratory data between the ages 16.8 to 19 y. Normal values: HbA1c, 4 to 5.7%, glucose, 70 to 100 mg/dl, C-Peptide, 298 to 2350 pmol/l, GAD Ab, 0 to 25 IU/ml, Islet Cell Ab, <7 U/ml, Insulin Ab, <12 U/ml, Insulin, 2 to 29 mIU/l.
Family 1
The index case was born at 40 weeks of gestation after a normal pregnancy and vaginal delivery. Her birth weight was 3420 g. Past medical history was remarkable for speech delay and joint laxity, necessitating speech therapy and physiotherapy for several years. Cognitive development was normal. She also had a history of poor weight gain.
She was first referred to us for mild hyperglycemia at 10.3 years of age detected when she was hospitalized for a syncope episode. After the discharge, HbA1c was 6%. Since than HbA1c levels persistently remain high until recently and started to normalize only after repaglinide therapy (Table 1). At the age of 10.5 years, glucose tolerance test (with 50 g glucose) was performed. At 0, 30, 60, 90, 120 minutes, glucose levels were 97, 163, 140, 111, 89 mg/dl, respectively. The corresponding Insulin levels were, <2, 22.7, 16.5, 10.9, 5.8 mIU/l. Fasting blood glucose levels measured at the laboratory after the age of 12.5 years of age were always higher than 100 (Table 1). Diabetes type 1 antibodies and C-peptide concentrations throughout 7 years of follow-up were normal (Table 1). Further endocrine investigations during follow-up revealed normal thyroid function tests with negative thyroid (anti-TPO and anti-Thyroglobulin) and celiac antibodies. Basal cortisol (554 nmol/l), serum immunoglobulins, blood lipids, and lipase levels were also normal.
She has always been tall and slim, with a height percentile persistently along 75% to 90% (height SDS +1.2-+0.9). Until the age of 6.5 years, her weight was around 50th percentile (Wt. SDS +0.23) which decreased to 25th percentile at the age of 10.2 years (Wt. SDS −0.75). At age 12.5, she weighed 33 kg (BMI = 13.18 kg/m2, BMI SDS = −3.36). After the age of 14 years, in parallel to the pubertal spurt, she also gained weight. She had her first menstruation at the age of 15 years (like her mother). At last examination, at the age of 17.5 years, she is 175 cm tall and weighs 49 kg., the BMI was 16.3 kg/m2, with a BMI SDS −2.97 (Figures 2A, B and 3). Arachnodactyly and mild scoliosis were also noted.
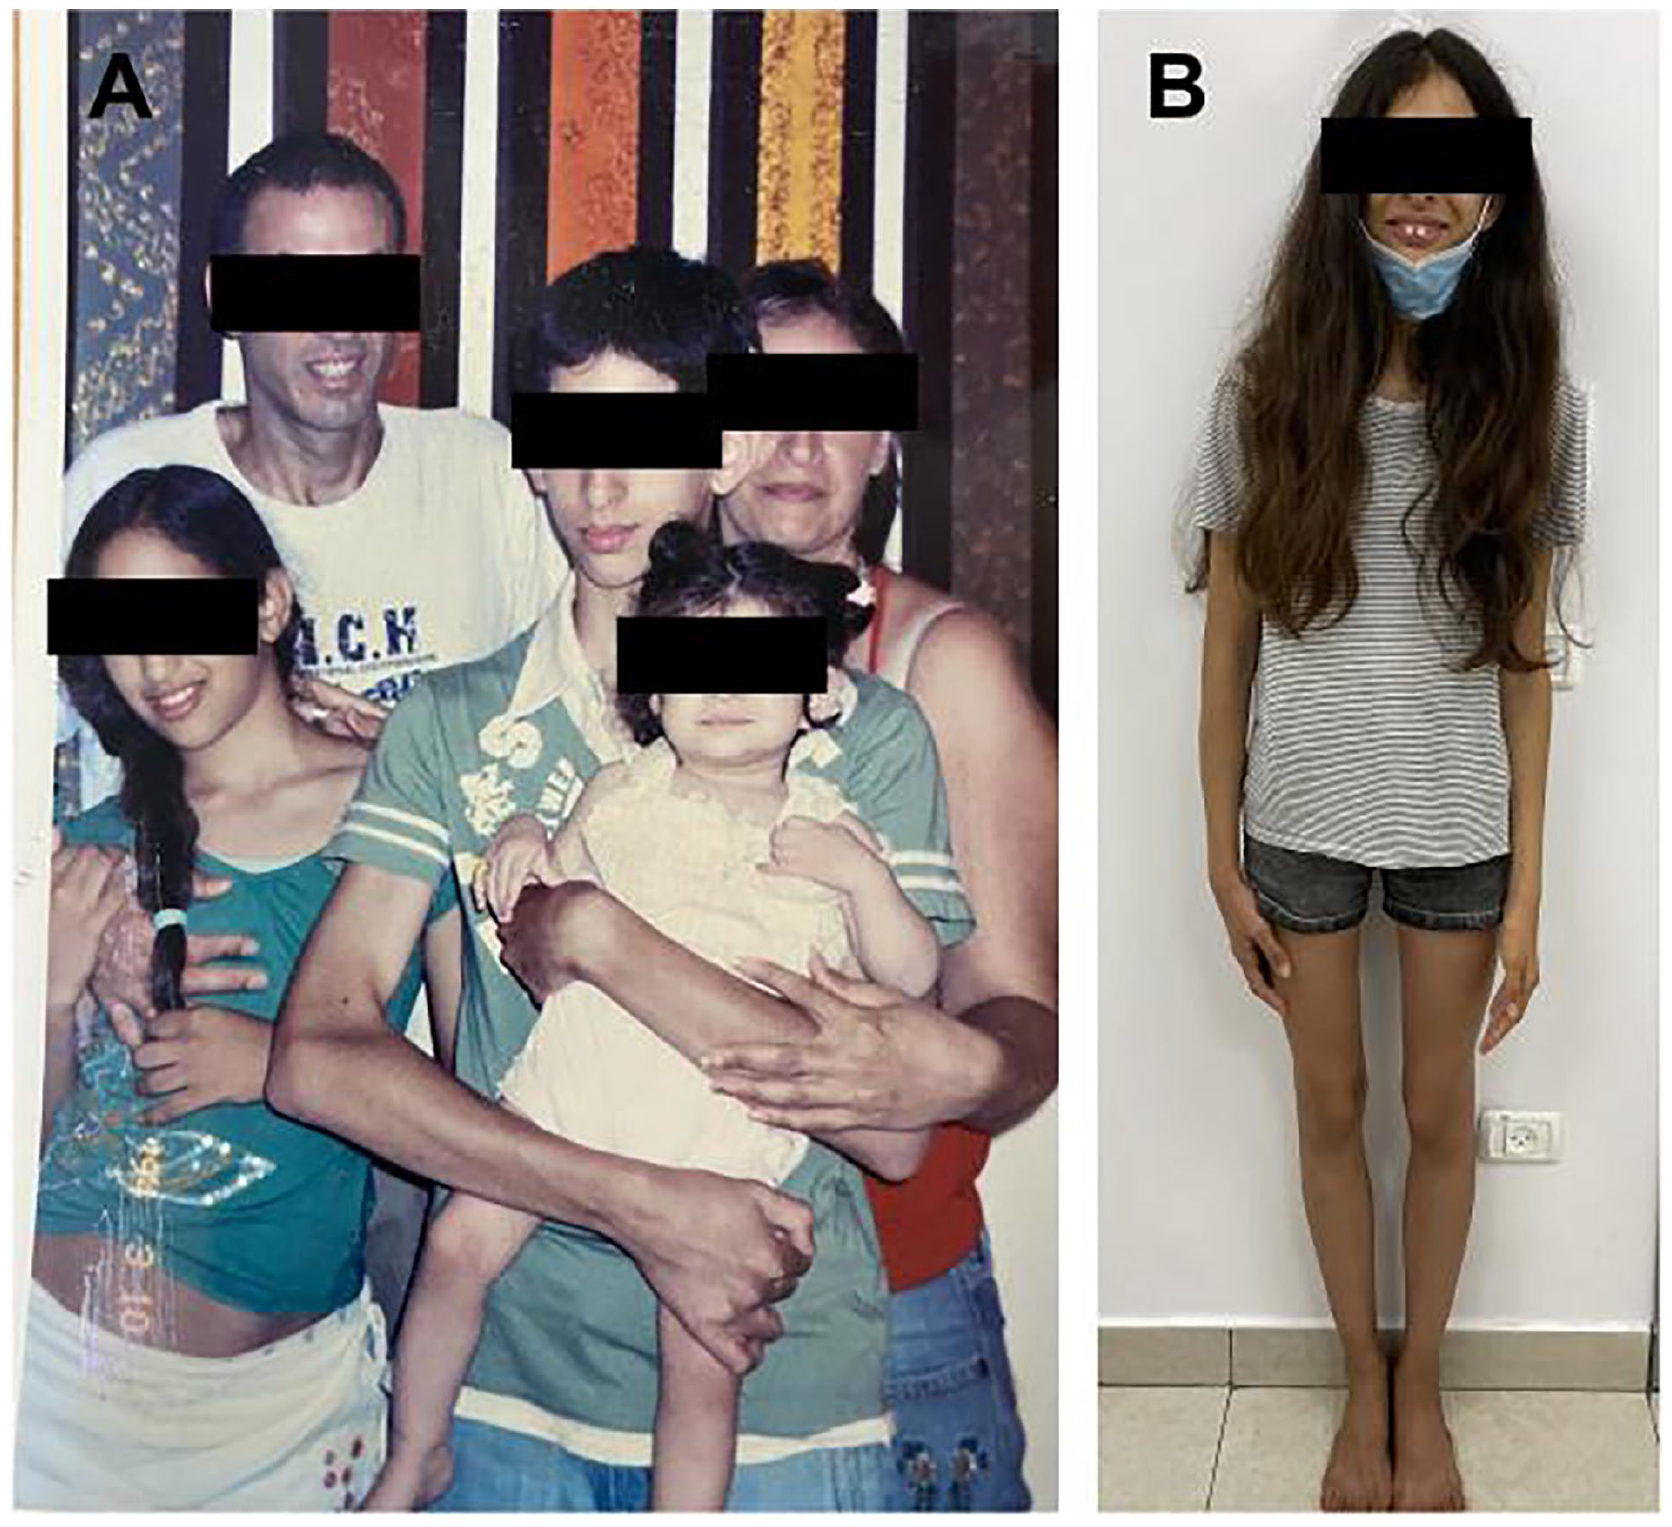
Phenotypic characteristics in members of Family 1. The youngest baby is the proband at age 1.5 years (A) and at the age of 16.8 years (B). The older brother at the age of 14 years shares similar phenotypic characteristics (A).

Height and weight curves of the proband from Family 1. Father (Fat.) and mother’s (Mo) height were shown as well.
The glycemic balance during repaglinide: During follow-up, before oral antidiabetic repaglinide therapy, the daily fasting glucose concentrations checked by glucometer (2-3 times/day) fluctuated between 97 and 124 mg/dl. Due to deterioration of post-prandial glucose concentrations measured at home by glucometer, (levels as high as 180 ng/dl) and high HbA1c, consistent with impaired glucose tolerance, at the age of 13.2 years repaglinide was started at lunch (her principal meal). The dose was gradually increased to 0.75 mg at lunch and 0.25 mg at supper due to high blood glucose levels up to 135 mg/dl in the morning, with a decrease in HbA1c to 5.7% (Table 1). Most recently, monitoring fasting blood glucose levels for the last 2 months thrice a week (N = 23) showed a mean blood glucose of 111 mg/dl (range = 103-117 mg/dl, median = 112 mg/dl). She did not exhibit symptoms of type 1 diabetes, such as polyuria, or polydipsia. She never had diabetic ketoacidosis. During the follow-up, in repeated examinations, no evidence of diabetic complications such as retinopathy and neuropathy were found. Urinalysis was always normal with no glycosuria.
Genetic consultation, as well as cardiac, ophthalmological, and orthopedic evaluations, yielded normal results, with the exception of mild scoliosis. These findings helped rule out syndromes linked to tall stature, low BMI, poor weight gain during infancy and childhood, joint laxity, and arachnodactyly, such as Marfan syndrome and homocystinuria. No pathogenic variants for any connective tissue disorder were found by WES. She did not have clinical and laboratory parameters of lipodystrophy as well. Molecular analysis by MODY panel, including 11 genes, did not detect MODY mutations. Her cognitive functions were completely normal.
The family history was significant in that the father, aged 60.5, sister, aged 26.5 years, and brother, aged 29.5 years had all similar phenotypic appearances (Figure 2). All had a history of persistent borderline high glucose levels (blood glucose levels around 100 to 110 mg/dl), (mostly>100 mg/dl) over the years (Table 2).
The older sister’s glucose concentrations first detected at age 20.3 years were borderline high, with HbA1c levels of 5.7% to 6.1% consistent with dysglycemia (Table 2). The routine laboratory examinations every 1 to 3 years since the age 12 years always showed glucose levels around 100 mg/dl (Table 2). Until the age of 20 years the examinations including liver, kidney function tests, lipids, vitamins (including, vitamin B12, folic acid, vitamin D), thyroid function tests and antibodies were all normal (data not shown). Celiac antibodies were negative repeatedly (6 examinations over a decade). Her last Hb at the age 25 years of age was 13 g/dl with a completely normal blood count although she had a history of iron deficiency that was successfully treated with iron tablets. Since the detection of mild hyperglycemia, the C-peptide level was found to be normal, and diabetes type 1 antibodies were negative (Table 2). She is a vegetarian young adult. Phenotypic characteristics were similar to her sister’s features. She is tall and slim. She had her first menstruation at 14 years of age. At the age of 23 years, she is 172 cm tall (height SDS +1.4) and weighs 65 kg with a BMI of 22 kg/m2. She strictly keeps a healthy lifestyle.
The older, 30 years old brother, who lives in another country, was not available for examinations. According to his mother’s report, the glucose concentrations were slightly above 100 mg/dl 3 years ago. As seen in Figure 2A, at the age of 14 years, he carries similar phenotypic characteristics as his father and sisters. According to the mother’s report he is currently taller than his sister, the index case.
The father of Iraqi origin is 182 cm tall and weighs 72 kg. (BMI = 21.8 kg/m2). Since the age of 45 years his fasting blood glucose levels were always borderline high (mostly > 100 mg/dl). Blood glucose levels before the age of 45 years were normal. The glucose and HbA1c levels for the next 15 years shown in Table 2 (mean HbA1c 5.8, range 5.6%-6.1%) were consistent with impaired glucose tolerance/dysglycemia. 7 He never required oral antidiabetics. GAD and Islet cell Abs, were negative and C-peptide levels were normal repeatedly. Normal insulin concentrations excluded hyperinsulinism (Table 2). Cholesterol = 231, TG = 110, HDL-C = 51, and LDL-C = 158 mg/dl were all within normal range. TSH = 2.82 mIU/l was also normal. In all affected family members, no diabetic complications were found and urinalysis was normal without glucosuria.
The mother is of Moroccan origin, aged 57 years, suffers from obesity, osteoarthritis, and hypothyroidism due to Hashimoto’s thyroiditis and is on Eltroxin. The mother’s phenotypic characteristics were clearly different from the father with dysglycemia and low BMI over years. She is 163 cm tall and weighs 100 kg (BMI = 37.7 kg/m2). She recently reported elevated glucose levels up to 120 mg/dl with HbA1c 5.8% to 5.9%, but is not receiving antidiabetic medications. The C-peptide level at age 54.5 years was 1168 pmol/l (normal: 298-2350). Islet cell, GAD and insulin antibodies were undetectable. Her condition is most probably consistent with diabetes type 2. The parents are not related. In all affected family members with dysglycemia, no evidence of diabetic complications such as retinopathy and neuropathy were found. Urinalysis was always normal with no glycosuria.
These data of the index case, her sister, and the father suggested autosomal dominant MODY (Figure 1). However, as mentioned above, the MODY panel that tested 11 genes revealed no mutations. Moreover, whole-exome sequencing performed by 3billion company in the index case resulted in no reportable pathogenic variants, relevant to the phenotype of the patient including genetic syndromes associated with tall stature. In addition to the index case, cognitive functions of all affected family members were normal.
Family 2
In this family, 2 children (generation II) were referred to us for borderline high blood glucose levels.
In the index case, borderline high blood glucose levels first noted at age 16.3 years (Table 2). He was born at 37 weeks of gestation after normal pregnancy and delivery. The birth weight was 2700 g. His psychomotor development was normal. He has always been healthy but failed to gain weight, especially after 11 years (Figure 4). However, he was always tall with a height along the percentile 82, reaching the percentile 90 after the pubertal spurt. At the age of 16.5 years, his height was 185.5 cm, and his weight was 53.9 kg (BMI = 15.78 kg/m2, BMI SDS = −2.70). His pubertal status was consistent with Tanner stage 5 and the testicular volume was 25 ml. After the detection of mild hyperglycemia, blood glucose levels monitored at home by glucometer (2-3 measurements/week) were always around 100 mg/dl ranging between 95 and 105 mg/dl and occasional two-hour postprandial glucose levels monitored at home were around 110 to 120 mg/dl. During the follow-up, mean and median fasting glucose concentrations measured at the laboratory were 100 mg/dl (Table 2). At the age of 18.3 years, 2-hour glucose concentration after 75 g of glucose was 156 mg/dl, consistent with the diagnosis of impaired glucose tolerance (Table 2). The diabetes type 1 antibodies were negative with normal C-peptide concentrations. Other laboratory examinations were normal, including complete blood count, TSH, blood urea nitrogen, electrolytes, liver enzymes, celiac antibodies, IGF-1, and blood lipids. Currently, he is not on oral anti-diabetic therapy.

Height and weight curves of the proband from Family 2. Father (Fat.) and mother’s (Mo) height were shown as well.
The youngest sister also shared the same phenotypic characteristics with her brother. She was first referred to our outpatient clinic at 13 10/12 years of age for failure to gain weight. She was born at 40 weeks of gestation after normal pregnancy and delivery. Birth weight was 3200 g. In infancy, she failed to gain weight. Otherwise, her psychomotor development was normal. Repeated laboratory investigations between 1 9/12 and 6 years of age, including complete blood count, TSH, thyroid antibodies, blood urea nitrogen, electrolytes, liver enzymes, IGF-1, and lipids were also normal (data not shown). Negative transglutaminase antibodies at ages 3 and 6 years excluded celiac disease. Between the ages of 6 to 12 years, she practiced intensive artistic gymnastics 6 days a week.
On physical examination at the age of 13 10/12 years, she weighed 37.6 kg, and her height was 162.2 cm (height percentile 62, BMI 14.3 kg/m2, BMI SDS = −2.95). She looked tall and slim. The pubertal stage was consistent with Tanner 3 to 4 breast tissue and Tanner 2 axillary and pubic hairs. The growth rate of 7 cm/year since the age of 13 5/12 years was consistent with pubertal growth spurt. She had her first menstruation at the age of 14 years of age. In the last exam at the age of 15.5 years. her height was 171.5 cm and her weight was 49.5 kg (BMI = 16.8 kg/m2, BMI SDS = −1.70).
Fasting hyperglycemia was first detected at 13 7/12 years of age (glucose 106 mg/dl). Subsequently, HbA1c was also found to be borderline high. Mild fasting hyperglycemia persisted with negative diabetes type 1 antibodies with normal insulin and C-Peptide concentrations (Table 2). Since then, repeated glucose determinations at home 2 to 3 times per week were borderline high, between 105 and 110 mg/dl. These data were consistent with dysglycemia/impaired glucose tolerance. Molecular analysis of 11 genes by MODY panel failed to detect any mutations.
The father, aged 60 years, has been diabetic since the age of 45 years. He was diagnosed with type 2 diabetes and treated with oral antidiabetics until a few years ago when insulin therapy was initiated due to significant hyperglycemia (up to 265 mg/dl with HbA1c of 10.7%) before insulin therapy. The C-peptide level at age 56 years was borderline high, 2052 pmol/l (normal: 298-2350). He is 197 cm tall and he weighs 98 kg. (BMI = 25.2 kg/m2). The diagnosis was consistent with diabetes type 2. Paternal grandmother aged 90 has been diabetic since the age of 60 years and she is on insulin therapy. No further details are available.
The mother aged 53 years is healthy. During childhood and adolescence she was tall and slim as her children. She is 170 cm tall and weighs 63 kg. (BMI = 21.8). Her yearly fasting blood concentrations have been normal for the last 2 decades, between 78 and 96 mg/dl. During her first pregnancy, glucose tolerance test with 75 g glucose was normal excluding gestational diabetes (HbA1c at the age of 52 was 5.2%). Both parents are of Russian Jewish origin and are not related. Like Family 1 cognitive functions were completely normal in all family members.
Methods
Next generation sequencing – MODY gene panel
The Illumina Novaseq 6000 (San Diego, CA, USA) was used to sequence genome sections that were collected. Franklin by Genoox process and software was used for the raw genome sequencing data analysis, which included variant calling, annotation, and alignment to the GRCh37/hg19 human reference genome.
The DNA was enriched for exons and flanking regions. The captured regions of the genome were sequenced with Novaseq 6000 (Illumina, San Diego, CA, USA). The raw genome sequencing data analysis, including alignment to the GRCh37/hg19 human reference genome, variant calling and annotation, was conducted with Franklin by Genoox pipeline and software. Read mapping was done using Burrows-Wheeler Aligner (version 0.7.16), using the hg19 genome as a reference. Read calling, initial filtration and variant, as well as artifact identification, was done using the GATK genome analysis toolkit (version 4.0.7.0) and freeBayes (version 1.1.0).
Frequency analysis was done using international databases such as GnomAD and ExAC and more. There is also the use of an internal data knowledge base, which contains specific variants identified in the Israeli population, based on 2000 exomes sequenced up to May 2018 and hundreds of exomes done ever since. Interpretation and evaluation of the variants was performed using Franklin by Genoox as well as leading data reservoirs such as ClinVar, Varsome, LOVD, ClinGen and more. Final analysis was done by a team of experts with collaboration with the treating physicians.
Whole exome sequencing
DNA was extracted from a blood sample of the patient from Family 1, and analyzed by the 3Billion company. xGen Exome Research Panel v2 was used by the company to capture all exon regions of all human genes (~22 000). Following capture, The 3Billion company sequenced these regions using the Illumina Novaseq 6000. The 3Billion company analyzed the raw genome sequencing data, including alignment to the GRCh37/hg19 human reference genome, variant calling, and annotation, using a combination of open-source bioinformatics tools and our in-house software.
To prioritize variants, the 3Billion company used EVIDENCE, a variant interpretation software. This system prioritizes variants based on the American College of Medical Genetics and Genomics (ACMG) guidelines and the patient’s phenotype. 8 The EVIDENCE system works in 3 steps: variant filtration, classification, and similarity scoring for the patient's phenotype.
First, The 3Billion company used gnomAD (http://gnomad.broadinstitute.org/-) and a 3billion genome database to estimate allele frequency. The 3Billion company filtered out common variants with a minor allele frequency of >5% according to ACMG guideline BA1. 8
Second, the 3Billion company extracted evidence on the pathogenicity of variants from scientific literature and disease databases including ClinVar (https://www.ncbi.nlm.nih.gov/clinvar/) and UniProt (https://www.uniprot.org/). The company evaluated the pathogenicity of each variant on its associated diseases according to the recommendations of ACMG guideline. 7
Third, the 3Billion company transformed the patient's clinical phenotypes to corresponding standardized human phenotype ontology terms (https://hpo.jax.org/) and used them to measure the similarity9,10 with each of approximately 7000 rare genetic diseases (https://omim.org/ and https://www.orpha.net/consor/cgi-bin/index.php). The similarity score between the patient's phenotype and symptoms associated with each disease caused by prioritized variants (according to ACMG guidelines) ranges from 0 to 10.
Finally, medical geneticists along with the treating physicians manually evaluated the candidate variants for the associated diseases. The 3Billion company only considered variants confirmed by paired-end Sanger sequencing as conclusive.
Discussion
In these 2 families, mild hyperglycemia with fasting blood glucose levels mostly higher than 100 mg/dl was first detected during childhood and adolescence in 5 family members from generations I and II (2 members from generation II in each family and one subject from generation I) and persisted over the years. In these family members, HbA1c values were also persistently borderline high with negative diabetes type 1 antibodies and normal C-peptide concentrations. These data were consisted with dysglycemia/impaired glucose tolerance criteria.1,7 In the index case from Family 1, increasing blood glucose levels up to 180 mg/dl (especially postprandial) required oral antidiabetic therapy that improved her glucose balance and HbA1c. Impaired glucose tolerance developed also in the adolescent boy from Family 2. The brother of the index case in Family 1 and the sister of the index case in Family 2 run a milder course with borderline high glucose and HbA1c levels that were also consistent with dysglycemia. Other characteristics of these family members were tall stature with reduced BMI. In both families, at least 3 family members from generation 2 failed to thrive in infancy and childhood.
The father in Family 1 (generation I) shared all the clinical and laboratory characteristics of the index case, with high borderline glucose levels over a decade and mildly elevated HbA1c levels up to 6.1% over the same period. In contrast, the mother in Family 2 exhibited the same phenotypic characteristics with normal blood glucose and HbA1c level. The Mother in Family 1 and the father in Family 2 (oral antidiabetics and insulin therapy) had features of type 2 diabetes, including obesity.
In these 2 families comprising at least 5 affected subjects exhibited unique phenotypic characteristics, mildly elevated long-lasting blood glucose and HbA1c concentrations detected in childhood and adolescence. Moreover the familial occurrence suggested an autosomal dominant pattern initially. According to American Diabetes Association guidelines we sought to analyze MODY genes in our patients with dysglycemia/impaired glucose tolerance who never exhibited signs and symptoms of diabetes type 1 or 2 during a long-standing follow-up. 1 Two subjects from both families (from generation II) exhibited elevated blood glucose concentrations both in fasting and postprandial. Patients with MODY3 and MODY1 can exhibit elevated blood glucose concentrations both in fasting and postprandial.3,11 PAX4, BLK and KLF genes have been recently refuted as MODY genes by the Monogenic Diabetes Expert Panel of MODY (https://search.clinicalgenome.org/kb/affiliate/10016?page=1&size=25&search=). Thus, the MODY panel genes that were based on 11 genes in proband from Family 1 and proband’s affected sister in Family 2 did not reveal any disease-causing mutations. Moreover, WES in the index case from Family 1 was also negative, excluding other genetically inherited mutations. Except for the failure to thrive in infancy and childhood, none of the clinical and laboratory characteristics were consistent with lipodystrophy syndromes. 12 In a recent study, commercial gene panels identified pathogenic variants in as low as 27% of patients suspected to have MODY. 13 In their series, the authors identified 2 more cases of MODY by exome sequencing. In our report, in addition to MODY panel sequencing that was negative in affected members from 2 families, WES also failed to detect pathologic mutations in the index case from Family 1. WES is considered a more efficient methodology for clarifying not only rare MODY subtypes but also possible new genotype-phenotype associations. Despite advanced methodologies, the unidentified MODY variants in syndromic as well as non-syndromic MODY-like patients still pose a significant drawback in the correct diagnosis of MODY in many cases.4,5,14,15
The failure to identify a molecular variant that is associated with the present family pedigree by MODY panel and WES may reflect several possibilities: 1. The mutation(s) may be a hitherto unidentified sequence in a MODY-associated gene due to undercovered regions. 2. Whole exome sequencing neglects the same variants and therefore cannot replace gene panels (the methodology is the same). 3. The mutation may be in a gene that has not been previously associated with MODY. Novel mutations responsible for the disease may be identified among several family members by linkage analysis by either WES or whole genome sequencing. 4. There is also a possibility that a mutation/deletion may be located in the intron of a gene that is not covered by the MODY gene panel and WES, also it is possible that it is located either upstream or downstream of the gene, in an enhancer or repressor region. 5. It is also possible that this represents a combination of genetic factors, such as multiple variants in several genes (polygenic) or multiple benign variants in the same gene although the nature of the inheritance does not correlate well with multifactorial inheritance. Finally, we do not exclude the possibility that the families presented may represent a hitherto unidentified new syndrome.
Conclusions: In subjects with a presumed diagnosis of MODY the available molecular diagnostic armamentarium still fails to diagnose the molecular basis of MODY-like syndrome in many cases. Special phenotypic features described in this report may also help to reveal additional family members with similar characteristics and to decipher the molecular basis of this unique, syndromic form. Repaglinide may improve glycemic balance and prevent diabetic complication in selected cases.