
Abstract
Background And Aims:
Maintaining appendicular skeletal muscle mass is important for maintaining the quality of life of elderly patients with type 2 diabetes. The possibility of GLP-1 receptor agonists for maintaining appendicular skeletal muscle mass has previously been reported. We investigated changes in appendicular skeletal muscle mass, measured by body impedance analysis, in elderly patients who were hospitalized for diabetes self-management education.
Methods:
The study design was a retrospective longitudinal analysis of the changes in appendicular skeletal muscle mass in hospitalized patients over the age of 70 years. The study subjects consisted of consequential patients who received GLP-1 receptor agonist and basal insulin co-therapy or received basal insulin therapy. Body impedance analysis was performed on the day after admission and on the ninth day of admission. All patients received standard diet therapy and standard group exercise therapy 3 times per week.
Results:
The study subjects consisted of 10 patients who received GLP-1 receptor agonist and basal insulin co-therapy (co-therapy group) and 10 patients who received basal insulin (insulin group). The mean change in appendicular skeletal muscle mass was 0.78 ± 0.7 kg in co-therapy group and −0.09 ± 0.8 kg in the insulin group.
Conclusions:
This retrospective observational study suggests the possibility of favorable effects of GLP-1 receptor agonist and basal insulin co-therapy for maintaining appendicular skeletal muscle mass during hospitalization for diabetes self-management education.
Introduction
The number of patients with type 2 diabetes worldwide is increasing every year, and their age is also on the rise. 1 Skeletal muscle mass, which tends to decrease with age, is more likely to decrease in patients with diabetes; therefore, skeletal muscle mass should be carefully monitored in elderly patients with diabetes mellitus.2,3 In fact, skeletal muscle mass reduces owing to the effects of diabetes itself. 4 The loss of skeletal muscle mass due to diabetes can worsen glycemic control, 4 which can subsequently lead to diabetic complications. 4 The progression of diabetic complications and poor glycemic control further reduce skeletal muscle mass. 4
Patients with diabetes and sarcopenia are considered to be prone to postprandial hyperglycemia. 5 Thus, multiple doses of insulin injection therapy are beneficial for these patients. Reentry and postprandial blood glucose have been reported to be suppressed by GLP-1 receptor agonists and basal insulin co-therapy. 6
We investigated changes in appendicular skeletal muscle mass, measured by body impedance analysis, in elderly patients who were hospitalized for diabetes self-management education and received a GLP-1 receptor agonist and basal insulin co-therapy or received basal insulin therapy.
Materials and Methods
Study patients
The study design was a retrospective, longitudinal analysis. The study subjects consisted of consequential patients aged >70 years who were admitted to Ayabe City Hospital for Diabetes Self-Management Education, between May 2019 and February 2021, and received glargine/lixisenatide or basal insulin.
All patients received standard diet therapy and standard group exercise therapy 3 times per week. In addition, patients with HbA1c >9% at admission were treated with multiple doses of insulin injections combined with basal insulin or glargine/ lixisenatide . Glargine/lixisenatide has been used since June 2020.
Body impedance analysis was performed on the day after admission and on the ninth day of admission. Among the patients, those whose skeletal muscle mass could not be assessed were excluded.
This study was approved by the local research ethics committee of Ayabe City Hospital (No.H30-08) and was conducted in accordance with the Declaration of Helsinki. Informed consent was obtained from all patients.
Data collection
Fasting blood glucose, C-peptide, and creatinine levels after overnight fasting in venous blood were measured the day after admission. Hemoglobin A1c (HbA1c) was measured using high-performance liquid chromatography, and the results were expressed in National Glycohemoglobin Standardization Program units. The estimated glomerular filtration rate (eGFR) was calculated using the formula of the Japanese Society of Nephrology. Retinopathy was assessed by chart review and graded as follows: no diabetic retinopathy, simple diabetic retinopathy, or proliferative diabetic retinopathy. 7 Neuropathy was diagnosed using the criteria for diabetic neuropathy proposed by the Diagnostic Neuropathy Study Group. 8 Nephropathy was graded as follows: normoalbuminuria, urinary albumin excretion <30 mg/g of creatinine (Cr) (mg/gCr); microalbuminuria, 30 to 300 mg/gCr; and macroalbuminuria, >300 mg/gCr. 9 Body mass index (BMI) was calculated as body weight in kilograms divided by height in meters squared. We asked patients about the duration of diabetes, smoking status, and alcohol consumption.
Measurement of body composition
The patient’s body composition was determined using a segmented multi-frequency bioelectrical impedance body composition analyzer (Inbody 770; Inbody Japan Inc., Tokyo, Japan). 10 The multi-frequency impedance body composition analyzer was validated and correlated well with dual-energy X-ray absorptiometry. 11 Data on body weight (kg), body fat mass (BFM, kg), and appendicular skeletal muscle mass (kg) were collected. Body fat percentage (BFP, %) was expressed as a percentage of BFM (kg) divided by the total body weight (kg). 12 Skeletal muscle mass index (SMI) was calculated by dividing the appendicular skeletal muscle mass (kg) by the patient’s height (meters squared). 13
Body composition was measured in all patients on the day after admission and on day nine of admission. Changes in body weight, skeletal muscle mass, and fat mass were defined as (each parameter at the time of the examination on the ninth day of admission minus each parameter on the day after admission).
Standard diet therapy and standard exercise therapy during hospitalization
The diet during hospitalization was based on the “Recommendations on Diet Therapy for Japanese Diabetic Patients” of the Japanese Diabetes Association, with total energy calculated as ideal BW × 25 to 30 kcal/kgBW/day, carbohydrates as 50% to 60% of total energy, protein as 1.0 to 1.2 g/kgBW/day, regardless of renal function, and the rest was provided as fat. Additionally, snacks were prohibited during hospitalization. All patients were instructed to perform aerobic exercises. Hospitalized patients were instructed to perform standardized exercise therapies 3 times a week.
Statistical analysis and missing values
The statistical analyses were carried out using JMP version 14.0 software (SAS Institute Inc., Cary, North Carolina). The subjects consisted of 2 groups: the GLP-1 receptor agonist and basal insulin co-therapy and basal insulin therapy groups. Continuous variables are presented as mean (standard deviation [SD]) values, and categorical variables as numbers (%). The statistical significance of the difference between the groups was assessed using the t-test for continuous variables and the χ2 test for categorical variables in the 2 groups. The relationships between changes in appendicular skeletal muscle mass and other variables were examined using regression analyses.
Results
Thirty-two patients (20 men and 12 women) were hospitalized for diabetes self-management education and received basal insulin therapy or GLP-1 RA and basal insulin co-therapy during the study period. Twenty patients (12 men and 8 women) aged >70 years were included in this study (Table 1). Among the study subjects, all 10 patients (5 men and 5 women) in the co-therapy group received iGraLixi. The average age of patients in the basal insulin therapy and co-therapy groups were 76.8 ± 5.4 and 76.7 ± 5.2 years, respectively. HemoglobinA1c levels in the basal insulin therapy and co-therapy groups were 10.0 ± 1.2% and 10.9 ± 1.4%, respectively. The impedance change values in the trunk were −0.1 (0.4) and −1.2 (0.4), respectively, with a significant decrease in the co-therapy group (P = .045). The changes in skeletal muscle mass were −0.09 ± 0.8 and 0.78 ± 0.7 kg, respectively, with a significant increase in the co-therapy group (P = .013). The changes in body fat were −0.12 ± 0.9 and −0.87 ± 0.6 kg, respectively, with a significant decrease in body fat percentage in the co-therapy group (P = .022) (Figure 1). The total amount of insulin did not change, although the combination therapy group had less bolus insulin and more basal insulin.
Baseline characteristics of the study participants.

Abbreviations: eGFR, estimate glomerular filtration rate.
Data are given as numbers (percentages), mean (standard deviation).
P value = Standard therapy versus combination therapy Student’s t-test, Pearson’s qui-squared test were performed.
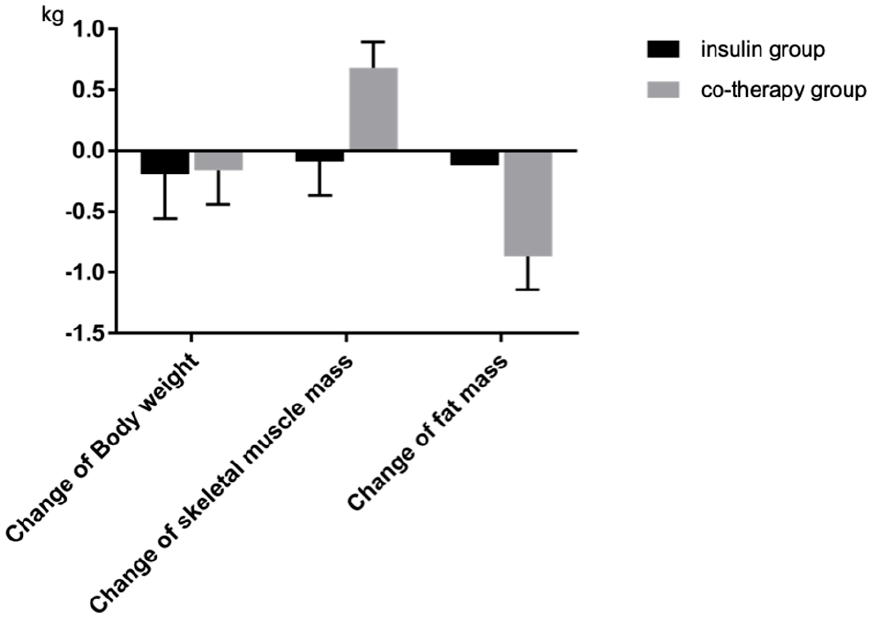
Comparison of Insulin group and Co-therapy group in change of body weight, skeletal muscle mass and fat mass.
The associations between changes in skeletal muscle mass and metabolic parameters are shown in Table 2. There was an association between changes in skeletal muscle mass and changes in body weight (r = .63, P = .006) and co-therapy (r = .50, P = .035). The average number of daily injections was not significantly related to changes in appendicular skeletal muscle mass (r = −.41, P = .095).
Simple correlation between change of skeletal muscle mass and metabolic parameters.

Gender was defined as women (=0) or men (=1) and smoking status, alcohol, retinopathy, nephropathy, and neuropathy were defined as no (=0) or yes (=1). The relationships between change of skeletal muscle mass and other variables were examined by Pearson correlation and simple regression analyses.
The multiple regression analyses demonstrated that changes in skeletal muscle mass were associated with co-therapy (β = .84, P = .009), after adjusting for age, sex, smoking status, alcohol consumption, height, weight, duration of diabetes, average number of daily injections, total insulin dose, and hemoglobin A1c (Table 3).
Multiple correlation between change of skeletal muscle mass and metabolic parameters.

Model 1 was adjusted for age and gender. Model 2 included all variables in Model 1 plus smoking status, alcohol, height and weight. Model 3 included all variables in Model 2 plus duration of diabetes, average of daily steps, total insulin dose, and hemoglobin A1c.
No apparent adverse events were observed in the study subjects.
Discussion
The appendicular skeletal muscle mass was maintained during hospitalization in patients receiving co-therapy. Multiple daily injections of insulin therapy are used for patients with diabetes mellitus. 14 In addition, glucagon-like peptide-1 (GLP-1) is a peptide hormone synthesized and secreted by enteroendocrine L cells. It has a number of physiological effects mediated by its receptor and GLP-1 receptor agonists, including enhancement of glucose-induced insulin secretion, increase in beta-cell survival, inhibition of glucagon production, and delayed gastric emptying. In addition, several studies suggest possible, but unclear, effects of GLP-1-based drugs on muscle mass, metabolism, and function.15,16 GLP-1 receptor agonists and insulin therapy have the potential to increase skeletal muscle mass. In this study, we observed changes in appendicular skeletal muscle mass during hospitalization in patients who received iGraLixi and lixisenatide combined with glargine at a ratio of 1:1.
The effects of GLP-1 on skeletal muscle have been demonstrated in in vitro and in vivo studies. A study that evaluated the effects of GLP-1 on human skeletal muscle cells reported that it induced myogenesis via a cAMP-dependent complex network. 17 In a study using a dexamethasone-induced mouse muscle atrophy model, it was reported that exendin 4 administration improved muscle atrophy by suppressing muscle atrophy genes, such as myostatin and atrogin 1, resulting in increased muscle mass and muscle function. 18 In addition, it has been reported that intravenous administration of GLP-1 increases blood flow by mobilizing microvessels in skeletal muscle in healthy adults, suggesting that GLP-1 may lead to increased skeletal muscle mass due to increased tissue oxygenation. 19
In clinical practice, adequate nutrition is essential for increasing skeletal muscle mass in patients with type 2 diabetes, and there has been concern about sarcopenia, especially in the elderly, due to weight loss caused by the appetite-suppressing effect of GLP-1. 20 In this study, no decrease in food intake was observed during hospitalization.
The limitations of this study are as follows. Because this was a retrospective and non-randomized study, we could not fully explain the causal relationship of our findings. Second, the present study was conducted during 1 week of hospitalization; therefore, the long-term effects remain unknown. Third, this study did not evaluate muscle strength and physical fitness, which are directly related to daily life. Fourth, the study did not evaluate exercise during hospitalization, other than the number of steps taken. Finally, we did not evaluate the amount of activity before and after hospitalization, although the difference in activity before and after hospitalization may have affected the change in skeletal muscle mass after hospitalization.
Conclusion
This retrospective observational study implies the possibility of a favorable effect of GLP-1 receptor agonist and basal insulin co-therapy for maintaining appendicular skeletal muscle mass during hospitalization for diabetes self-management education.