
Abstract
Background:
Glucose variability (GV) is a common and challenging clinical entity in the management of people with type 1 diabetes (T1DM). The magnitude of GV in Saudi people with T1DM was not addressed before. Therefore, we aimed to study GV in a consecutive cohort of Saudis with T1DM.
Methods:
We prospectively assessed interstitial glucose using FreeStyle® Libre flash glucose monitoring in people with TIDM who attended follow-up in the diabetes clinics at King Fahad Medical City between March and June 2017. Glycemia profile, standard deviation (SD), coefficient of variation (CV), mean of daily differences (MODD), and mean amplitude of glucose excursion (MAGE) were measured using the standard equations over a period of 2 weeks.
Results:
Fifty T1DM subjects (20 males) with mean age 20.2 ± 6.1 years and mean fortnight glucose 192 ± 42.3 mg/dl were included. The mean SD of 2-week glucose readings was 100.4 ± 36.3 mg/dl and CV was 52.1% ± 13%. Higher levels of glucose excursions were also observed. MODD and MAGE were recorded as 104.5 ± 51.7 and 189 ± 54.9 mg/dl, respectively which is 2 to 4 times higher than the international standards. Higher MODD and MAGE were observed on weekends compared to weekdays (111.3 ± 62.1 vs 98.6 ± 56.2 mg/dl and 196.4 ± 64.6 vs 181.7 ± 52.4 mg/dl, respectively; P ⩽ .001).
Conclusion:
Higher degree of glycemic variability was observed in this cohort of TIDM Saudis. Weekends were associated with higher glucose swings than weekdays. More studies are needed to explore these findings further.
Keywords
Introduction
Diabetes Mellitus (DM) is a chronic metabolic disorder with a rapidly growing global prevalence.1,2 Type 1 diabetes mellitus (T1DM) is caused by deficiency in insulin production and characterized by considerable glucose variability (GV) mainly because of differences in the pharmacological properties between exogenous and endogenous insulin. 3 GV is linked to higher production of oxidative stressors that might lead to microvascular complications. 4 On the other hand, this theory has been rejected by other studies done based on the diabetes control and complications trial findings.5,6 Nevertheless, GV predicts more hypoglycemia attacks, negatively affecting quality of life, and treatment satisfaction in T1DM.7,8
The role of HbA1c as a solo measure of diabetes control has been questioned. Therefore, other measures such as time in target time in range, above range and below range, and GV measures were shown to be useful tools to draw a better picture about the daily glucose excursions as agreed at the most recent international consensus.9,10
Several measures are used to calculate GV such as standard deviation (SD), coefficient of variation (CV), mean amplitude of glycemic excursions (MAGE), and mean of daily differences (MODD). Each GV measure has its advantages and disadvantages, however, generally, CV is the most acceptable variability metric as it is measured relative to the mean.11,12
The introduction of continuous glucose monitoring systems (CGMS) enables physicians to monitor GV more accurately. 9 Flash glucometer FreeStyle® Libre provides painless unlimited glucose checking with a memory that lasts for 14 days. It has also been used with success to keep glucose readings in target and to decrease fluctuations. 13 Multiple information can be obtained from the ambulatory glucose profile (AGP) such as median curves of the glucose readings, details of hypoglycemia and hyperglycemia patterns, and injections and mealtimes if entered by the patient.
T1DM is a prevalent disorder in Kingdom of Saudi Arabia (KSA) affecting about 33.5 out of 100 000 persons which is among the highest worldwide. 14 Unfortunately, this is accompanied by clear deficiency in the literature regarding measures of the glucose control and variability patterns in Saudis with T1DM. 14 Most of the studies conducted were describing crude levels of HbA1c, numbers of hypoglycemia attacks, and the occurrence of diabetic ketoacidosis (DKA), but without measuring the GV.15,16
Therefore, using AGP, we aimed to study the short-term GV and the variables of glycemia control among a cohort with T1DM who attend follow-up in the diabetes clinics at King Fahad Medical City (KFMC).
Methods
We prospectively recruited 50 consecutive subjects with TIDM between March and June 2017 who attend the diabetes clinics in KFMC and assessed the interstitial glucose using the FreeStyle® Libre flash glucose monitoring for a fortnight. Exclusion criteria were age below 14 and above 50 years, body mass index (BMI) >35 kg/m2, pregnancy, evidence of overt macro/microvascular diabetes mellitus complications (retinopathy, nephropathy, and neuropathy), recent DKA, any illness or treatment that requires hospitalization, history of thromboembolism, and use of insulin pumps.
The study was approved by the Institutional Review Board at KFMC under the reference number IRB No. 16-734. The research involved negligible risk to the participants and after a full description of the study purpose and protocol was given to each volunteer, an informed minimal risk written consent was obtained.
In the initial visit, participants’ demographic information including age, sex, duration of diabetes, weight, and BMI, waist circumference, and blood pressure were recorded. Treatment details including the type of insulin used and total daily insulin dose were also recorded. Flash glucose monitoring system readings were installed for 2 weeks using Freestyle Libre® software produced by Abbott which is a flash glucometer that can measure interstitial glucose and transmit data to a wireless reader every 5 minutes. The sensors and the scanners were distributed to the patients free of charge.
At the end of the 2 weeks, a follow-up visit was arranged and the flash data were downloaded to confirm compliance and study the glycemia metrics and GV. Laboratory tests were undertaken including HBA1c, low density cholesterol, triglyceride, and albumin/creatinine ratio and the results were recorded for correlation with the GV metrics. During the follow-up visit, the results which showed that the Flash glucose monitoring system was not used for 7 consecutive days were excluded. GV was calculated using different metrics including SD, CV, MODD, and MAGE.
Hypoglycemia was defined as interstitial glucose levels <70 mg/dl, while hyperglycemia was defined as interstitial glucose levels >180 mg/dl. Time in target, was recorded as time with glucose levels between 70 and 180 mg/dl. The percentage of time spent above the target levels and the hypoglycemia attacks and their duration were retrieved from AGP.
SD was calculated by the standard equation for the 2-week glucose readings for each subject over 14 days. The average of SD for all subjects was then recorded. CV was measured through the ratio of SD to the mean glucose for each patient over a fortnight then the average for the total CV results was calculated.
For the intraday glycemic variability, the MODD was calculated by measuring the absolute differences between glucose values at corresponding time points of consecutive days Additionally, weekdays and weekends values were separately recorded. 17
MAGE was calculated based on the mean of differences between consecutive peaks and nadirs of differences greater than 1 SD of mean glucose. Again, MAGE for weekdays and weekends were separately recorded and the average was taken for each participant.
Data analysis
Analysis of the data was performed using SPSS program version 16 and statistical significance for correlation was accepted at P < .05. Between groups comparisons of normally distributed variables were carried out using student t-tests. Paired t-test was used for comparing data from the same participants. Data comparison between different participants was undertaken using independent samples t-test. Comparisons of non-normally distributed variables for unpaired samples were carried out using Mann-Whitney U tests, while Wilcoxon test was used to compare paired samples. Pearson test was used to measure the correlations between the GV metrics and other variables. Wherever applicable, data are presented as mean ± SD.
Results
Baseline characteristics
The study involved a total of 50 Saudi T1DM subjects (20 males; 40%) with mean age of 20.2 ± 6.1 range (range 14-36) years. The average BMI was 24.2 ± 4.6 kg/m2 and the HbA1c was 8.9% ± 2%. Duration of diabetes was 7.8 ± 4.9 years and all participants were using multiple daily injections composed of insulin Aspart premeals and Insulin Glargine 100 as long acting with an average total daily dose of 69.7 ± 28.6 units. The baseline characteristics of the participants are shown in Table 1.
Baseline characteristics of the study population.

Glucose variability measurements
The average daily scans were 9.8 ± 6.9 times while the mean captured AGP data was 71% ± 22%. The SD of 2-week interstitial glucose readings on AGP was 100.4 ± 36.3 mg/dl indicating higher GV in this cohort of T1DM. 18 Similar finding was also noticed in the CV 52.1% ± 13% while the target is 36%. Higher levels of glucose excursions were observed as seen in the MAGE and MODD being 189 ± 54.9 and 104.5 ± 51.7 mg/dl, respectively which are also higher than the international reference. 18
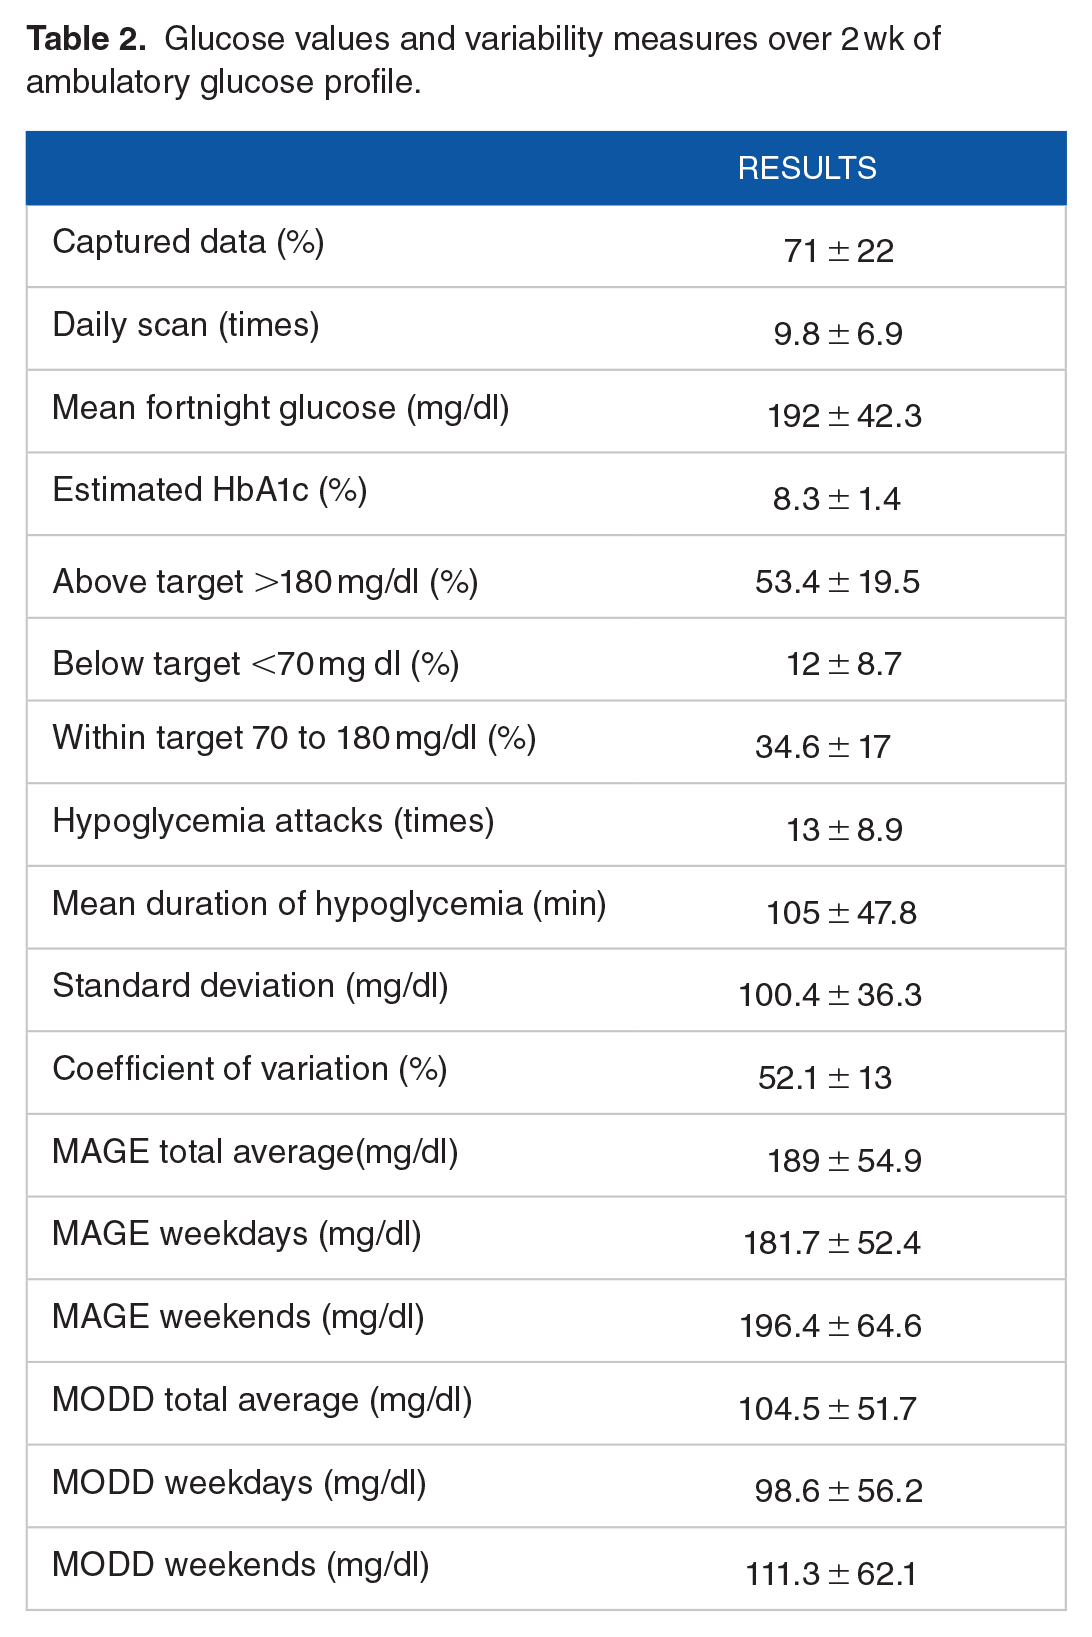
The mean fortnight interstitial glucose was 192 ± 42.3 mg/dl. The percentage of above target (>180 mg/dl), low (<70 mg/dl), and within target (>70 and <180 mg/dl) glucose were 53.4% ± 19.5%, 12% ± 8.7%, and 34.6% ± 17%, respectively indicating higher glucose levels in this cohort of participants. Data are summarized in Table 2.
Glucose values and variability measures over 2 wk of ambulatory glucose profile.
MAGE and MODD in weekdays and weekends
Both MODD and MAGE were higher in the weekends compared with weekdays being 111.3 ± 62.1 versus 98.6 ± 56.2 mg/dl and 196.4 ± 64.6 versus 181.7 ± 52.4 mg/dl, respectively (P ⩽ .001), indicating that glucose variability is significantly higher in the weekends than weekdays. Data are summarized in Figure 1.
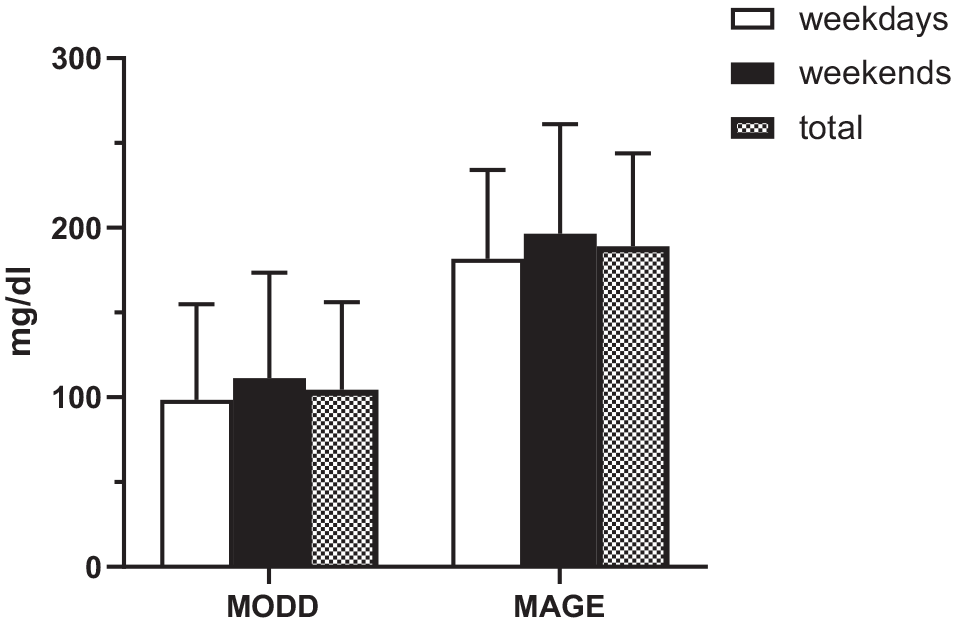
Mean of daily differences (MODD) and mean amplitude of glucose excursions (MAGE) in weekends, weekdays and total.
Hypoglycemia profile
The other striking finding was the increased hypoglycemia (<70 mg/dl) events recorded 13 ± 8.9 times per fortnight with a mean duration of 105 ± 47.8 minutes. Hypoglycemia was more frequently between 3 and 8 am.
Correlations between GV measurements and other variables
In order to explore variables that may predict the glucose variability measures, data were further analyzed using a bivariate correlation. The number of daily scans negatively predicted MAGE (r² −0.338; P = .018) and a similar trend was observed with MODD (r² −0.249; P = .081). Moreover, above target glucose (>180 mg/dl) predicted higher GV as seen in SD, MODD, and MAGE (r² = 0.584, 0.345, and 0.321, respectively; P < .05) respectively. As expected, blood glucose within target levels negatively predicted all GV measures including CV, SD, MODD, and MAGE (r² = −0.366, −0.642, −0.299, and −0.419, respectively; P < .05). Both measured and estimated HbA1c predicted higher GV as seen in both SD and MAGE (r² = 0.357 vs 0.638 and 0.390 vs 0.542, respectively; P < .05) indicating GV occurs more in non-controlled subjects with T1DM. Data are summarized in Table 3.
Correlations between glucose variability measure and the other factors.

P ⩽ .05. **P ⩽ .01.
Discussion
Glucose variability (GV) in T1DM is a common and difficult clinical encounter for both the patients and treating physicians. 11 It is a well-recognized predictor of hypoglycemia which is the main factor that prevents tight glycemia control. Moreover, evidence supports that reducing the glucose swings can improve the overall glycemic control. 19
We present the first prospective study, estimating GV in a cohort of Saudi T1DM population using AGP. The SD in this cohort was 100.4 mg/dl, CV was 52.1%, MODD 104.5 mg/dl, and MAGE 189 mg/dl. Higher variability was observed in the weekends compared to the weekdays which may be related to changes in lifestyle and sleep pattern. Additionally, we found higher rates of hypoglycemia attacks (<70 mg/dl) occurring on average 13 times per 2 weeks with prolonged duration (mean 105 minutes) in around 12% of the time. About one-third of the subjects were having glucose readings in range while the time spent above target was about 53%.
The glycemia and GV indices calculated in our participants were higher than the recommended published targets. 18 In comparison to a Spanish study which screened the blood glucose in a similar pattern to our participants (9.8 times per day), the percentage of time spent in glucoses <70 mg/dl, 70 to 180, and >180 mg, SD and CV were 6.8%, 55.4%, 37.7%, and SD and CV of 69 mg/dl and 41.2% respectively. In the same study, the estimated HbA1c was 7.45%, compared to 8.3% in our participants. 20
Another work that used CGMS baseline and 6 months follow-up pooled data of 4 prospective studies involving 545 individuals with T1DM found that the percentage of time below range, in range and above range were 5%, 58%, and 37%, respectively. Again, they reported better glycemic indices than those observed in our population which could be explained by the differences in the population. 21
There are several possible explanations causes for the increased GV in our study. First, the age group targeted in this study is well-known to be associated with higher GV. 22 Second, the higher prevalence of hypoglycemia attacks observed in our participants can also increase GV. Indeed, previous studies have linked higher GV with increased hypoglycemia attacks. 7 In fact, the relation between GV and hypoglycemia is bidirectional and intersecting and the treatment approach can be similar. Of note, the pattern of prolonged hypoglycemia detected using flash glucometer in this study was similarly found in the neighboring Gulf country of Emirates. 23 Third, the type of long acting insulin used may also be contributing as all the study participants were using insulin glargine U100 which is linked to higher variability compared with the second generation long acting insulins analogs like Glargine U300 and Degludec. 24 Fourth, the glycemia control of our participants was suboptimal as the mean measured HbA1c was 8.9%. Higher HbA1c was associated with higher GV as reported by Kuenen et al. 25 Furthermore, a study of about 300 subjects using CGMS showed a positive correlation between SD and MAGE and HbA1c. 25 We found the same correlation between SD and HbA1c indicating more GV with higher glycated hemoglobin. Finally, the knowledge, attitude and adherence to carbohydrate counting are also possible contributors, but these were not assessed in our study.
Interestingly, we found that MAGE and MODD were higher in weekends compared with weekdays which may be related to changes in the in the activity and sleeping pattern that might happen in weekends. Such differences should be addressed by the physicians and the educators as part of the diabetes education. We also showed a negative correlation between the frequency of scanning and MAGE, which mirrors other data which also found that the higher frequency of scanning was associated with lower GV and better glycemia metrics.20,26
Limitations
The weaknesses of this study include the use of flash glucometer in assessing GV which may overestimate hypoglycemia and perhaps increase the oscillation of blood glucose. 27 However, AGP is relatively a new technology that is increasingly being used by thousands of people with T1DM and therefore it is beneficial to be familiar with the type of data that can be generated using these systems. Another limitation is the relatively small number of study subjects when compared with the real-world studies yet, the data generated are highly relevant and alarming and mandates further work. Moreover, unlike the real-world studies, we have more controlled study subjects and we have therefore measured more GV variables. Severe hypoglycemia defined as blood glucose <54 mg/dl and hypoglycemia unawareness were not addressed in this work which may add to the limitations. However, this is unlikely to affect our conclusions.
Conclusion
This work is the first to show the higher GV and frequent and prolonged hypoglycemia in a group of Saudi T1DM subjects. We present evidence that weekends are associated with higher GV compared with working days. Intensified diabetes education, implementation of strict carbohydrates counting, and use of newer basal insulin may improve these variations. Our data provide useful insights about the patterns of glycemia control that will help in treating patients more efficiently. Further and longer studies to explore the causes of increased variability and its effect on diabetes-related complications are needed.
Footnotes
Funding:
The author(s) received no financial support for the research, authorship, and/or publication of this article.
Declaration of conflicting interests:
The author(s) declared no potential conflicts of interest with respect to the research, authorship, and/or publication of this article.
Author Contributions
BA: data collection and analysis and manuscript writing. SA: data analysis and manuscript writing. MA: manuscript writing. SE: data collection. SK: data collection and manuscript wetting. BB: manuscript writing. NA: data analysis and manuscript writing. AAJ: data analysis and manuscript writing.