
Abstract
Background/Objectives:
Thyroid function tests (TFTs) changes in obese people have been studied with increasing interest, however, studies have been inconsistent hence it remains poorly understood. We compared the TFTs of morbidly obese euthyroid Saudi subjects with non-obese controls and then we examined the influence of leptin, adiponectin, and insulin resistance on TFTs.
Subjects/Methods:
Fifty-five euthyroid obese subjects attending bariatric surgery clinic and 52 non-obese age-and gender-matched controls were recruited. We measured body weight, BMI, body composition, thyroid-stimulating hormone (TSH), Free T4 (FT4), Free T3(FT3), thyroid antibodies, fasting leptin, adiponectin, and lipid profile. Insulin resistance was quantified by HOMA-IR. Data are presented as mean ± SEM.
Results:
Mean BMI was 45.6 ± 1.5 and 23.2 ± 0.5 kg/m2, for the obese and non-obese controls, respectively, P value < 0.001. Mean TSH was 2.7 ± 0.18 mIU/L in obese subjects and 1.7 ± 0.13 mIU/L (0.27-4.2) in the non-obese controls, respectively, P value .014. Mean FT3 was 3.9 ± 0.1 pmol/L (3.1-6.8) in obese subjects compared to 5.0 ± 0.1 pmol/L in non-obese controls, respectively, P value 0.001, however, FT4 was similar in the 2 groups. In the whole group (N = 107), BMI correlated positively with TSH and negatively with FT3. Leptin correlated negatively with both FT4 and FT3 in the non-obese group only while none of the TFTs correlated with HOMA-IR or adiponectin in either group. Binary logistic regression showed that each 1 unit increase in TSH increased the odds of becoming obese by 12.7, P value 0.009, 95 C.I. (1.9-85.0). Conversely, each - unit increase in FT3 decreased the odds of becoming obese by 0.2, P value 0.023, 95% C.I. (0.05-0.80).
Conclusions:
We report a small increase in TSH and a small decrease in FT3 within the normal range in obese subjects compared to non-obese controls. We also report a positive correlation between TSH and BMI with increased odds ratio of becoming obese with the increase in TSH and decrease in FT3. These changes may be either causally related or adaptive to the obesity state. FT4 and FT3 seem to correlate with leptin (but not with adiponectin or HOMA-IR) in the non-obese controls only. Larger mechanistic studies are needed to further elucidate the interesting association between obesity and TFTs.
Introduction
Obesity is a worldwide health problem and its prevalence is increasing steadily all over the globe. Obese subjects are at increased risk of acquiring dyslipidemia, elevated blood pressure, impaired glucose metabolism, and eventually cardiovascular and metabolic diseases. The last national survey on obesity and its associated risk factors in the Kingdom of Saudi Arabia showed a significant increase in the overall rate of overweight and obesity among the Saudi population with a rate of 33.7 %, making it the world’s 15th most obese country with a prevalence of 52.9%. 1 The gender distribution of the same study showed that the rate of obesity was 67.5% in women and 38.2% in men. 1 The prevalence is likely to continue to increase as more people are adopting a sedentary lifestyle and continue to consume poor-quality food. The pathophysiology of obesity is complex and is still poorly understood, nonetheless, the major causes include genetic, environmental, behavioral, dietary, endocrine causes, medications, and psychological factors.
The role of thyroid hormones in regulating adipose tissue metabolism in humans has been evaluated with growing interest over the past decades, not only for better understanding of the pathogenesis of obesity but also for therapeutic implications and future drug discoveries. An elevated serum level of thyroid-stimulating hormone (TSH) which is associated with triiodothyronine (T3) values in or slightly above the upper normal range, is frequently found in obese subjects, especially those with severe morbid obesity (BMI ⩾ 40).2-4 The underlying mechanism for this elevation in TSH is still unclear with proposed explanations such as it might be an adaptive mechanism to increase the metabolic rate and decrease further weight gain as suggested by some authors.4,5 Alternatively, TSH elevation has been suggested to represent a state of thyroid hormone resistance at the pituitary level, however, the response of TSH to thyrotropin-releasing hormone (TRH) stimulation test has been inconsistent. 4 Thyroid autoimmunity is another potential explanation for thyroid dysfunction in the obese subjects since there is a link between obesity and thyroid autoimmunity that has been described in several studies with the possibility that obesity enhances the risk of thyroid autoimmunity.3,6 Another possible explanation with increasingly growing body of evidence is the central effect of leptin on TRH, where leptin modulates TRH gene expression in the paraventricular nucleus of the hypothalamus.7-9 Leptin is a protein product of the obese gene (OB) and is expressed primarily by adipocytes. 10 Leptin has a major influence on energy balance by suppressing food intake and inducing weight loss. 11 Leptin concentration is proportional to the amount of total adipose tissue and weight loss results in a decrease in serum leptin level. 12 Most studies that examined weight loss in obese subjects have reported a decrease in serum TSH and T3 levels that may be explained by a decline in serum leptin levels.13-15 Besides, alterations in peripheral thyroid metabolism may also contribute to decreased serum T3 levels. 8 However, studies have been inconsistent with regards to the relationship between leptin and thyroid function and further studies are still needed to clarify this relationship.
Adiponectin is another protein produced exclusively by adipocytes. 16 It is present in the circulation in abundant amounts and plays an important role in energy metabolism.16,17 As opposed to leptin, serum concentrations of adiponectin decreased in states of insulin resistance such as obesity and type 2 diabetes.18,19 In obese subjects, adiponectin levels correlate negatively with BMI, body fat mass, serum leptin concentrations, fasting insulin levels and insulin resistance. 20 Adiponectin has been implicated in hypothalamo-thyroidal axis regulation by some but not all studies, therefore, this relationship has not yet been well defined and requires further clarification.19-21 Interestingly, adiponectin exhibits important antihyperglycemic, antiatherogenic, and anti-inflammatory properties, which could have an important implication on the development of therapies for the treatment of obesity and obesity-related diseases. 22 Since both leptin and adiponectin are differentially expressed in obesity, and both are implicated in the regulation of the hypothalamus-thyroidal axis regulation, it makes sense to study thyroid function in conjunction with these adipocytokines. Despite the very high prevalence of obesity in Saudi Arabia yet very few studies were caried out to examine the interesting relationship between thyroid function and obesity in euthyroid subjects in more depth with very few exceptions. 23
Objectives
The objectives of this study were to examine the effect of obesity on thyroid function tests and to explore the relationship between thyroid function and adipose tissue metabolism parameters, namely, leptin, adiponectin, and parameters of insulin resistance in euthyroid obese Saudi subjects attending the bariatric surgery clinic and comparing them with non-obese controls.
Subjects and Methods
This was an observational study that included euthyroid Saudi subjects with morbid obesity visiting the bariatric surgical clinics at King Fahad Medical City (KFMC), and King Saud University Medical City (KSUMC), Riyadh, Saudi Arabia. The inclusion criteria for the obese group were as follows: age ⩾ 18 years, healthy male or female, BMI ⩾ 30 kg/m2. Exclusion criteria were: pregnancy, history of thyroid disease, use medications that may influence thyroid function such as thyroxine, amiodarone or lithium, diabetes, significant cardiovascular disease, presence of any clinically significant abnormalities on physical examination, and presence of positive thyroid autoantibodies (thyroperoxidase (TPO) antibodies, thyroglobulin (Tg) antibodies, and anti-TSH receptor antibodies). Inclusion criteria for the non-obese controls were as follows: Healthy male and female, BMI < 30 kg/m2, visiting family medicine clinic at KFMC. Exclusion criteria for the non-obese controls were the same as outlined above for the obese group. The non-obese control group were matched for age and gender with the obese subjects.
Demographic data including age, gender, and educational level were collected. Anthropometric measurements including: weight (kg), height (meters), waist circumference (centimeters), systolic and diastolic blood pressure (mm Hg) were measured by trained staff nurses using standard procedures. Weight (Kg) was measured using an international standard scale (Digital Pearson scale, ADAM Equipment Inc., Oxford, CT, USA). Height and waist and circumference (measured to the nearest 0.5 cm) were measured utilizing a standardized measuring tape. Body mass index (BMI) was calculated as follows: weight in kilograms divided by height in square meters. Blood pressure (measured in mmHG) was measured by a trained registered nurse twice after being seated for 10 minutes using a standard conventional sphygmomanometer and the average of the 2 readings was recorded. Fat mass percent (% Fm) was measured by body composition analyzer (In Body 720 Body Composition Analyzer).
Venous Blood samples were collected for all the tests in standard tubes according to the guidelines of clinical laboratory standards institute (CLSI) in the morning, between 8 and 10 am, after a fasting period of 8 hours. These samples were used to quantify Thyroid Stimulating Hormone(TSH), free thyroxine (FT4), free triiodothyronine (FT3), thyroperoxidase (TPO) antibodies, thyroglobulin (Tg) antibodies, anti-TSH receptor antibodies, serum adiponectin, serum leptin, fasting blood glucose, glycated hemoglobin (HbA1c), fasting insulin levels and fasting lipid profiles (Total cholesterol, low-density lipoprotein (LDL), high-density lipoprotein (HDL), and triglyceride levels (TG)). Insulin sensitivity was calculated based on the Homeostasis Model Assessment-Insulin Resistance (HOMA-IR) formula: fasting plasma insulin (mU/l) X fasting plasma glucose (mmol/l)/22.5. 24
Informed consent
The protocol was approved by KFMC Institutional Research Board (IRB), the approval number was 13-029. All the subjects received detailed information about the study and signed written informed consent. The consent form was written in the native Arabic language.
Statistical analysis
Using a statistical power of 0.8, the estimated sample size was 100 subjects, 50 subjects in each group. The enrollment of the subjects was based on first come first selected based on the above inclusion and exclusion criteria. The data were analyzed using SPSS software version 23.0 (SPSS Inc., Chicago, IL, USA). Continuous data were analyzed using the independent student t-test. Pearson’s correlation coefficient or spearman’s correlations were used to test correlations between the different biomarkers as appropriate. Binary logistic regression analysis was used to test the association between the obesity status (yes/no) as the dependent variable and other explanatory variables. Multivariate regression analysis for the obese and non-obese controls, each separately to examine the determinants of thyroid function tests among the different explanatory variables. Statistical significance was set at P value ⩽ 0.05. Data are presented as mean ±SEM.
Laboratory methods
Serum TSH, FT4, and FT3 were estimated using commercially available kits by Roche Elecsys Modular Analytics Cobas e411 utilizing electrochemiluminescence immunoassay (Roche Diagnostics, Mannheim, Germany). The functional sensitivity of this kit to measure TSH was 0.014 mIU/mL. The normal reference range for TSH was (0.27-4.20 mIU/ml, for FT4 was (12-22) pmol/L and for FT3 was (3.1-6.8 pmol/L, respectively. TPO antibodies were also measured using commercially available ELISA kits (Bio-Line S.A, Brussels, Belgium) with a sensitivity of 1.4 U/ml (intra- assay variability 6.9%; inter-assay variability 13.4%). Total cholesterol, LDL, HDL, TG levels were measured by enzymatic methods. 25 The plasma glucose levels were estimated using the glucose-oxidase peroxidase (GOD-POD) method with the glucose GOD-POD kit and results were presented in mmol/L. Glycated hemoglobin HbA1C was measured from venous blood samples collected following overnight fast using the chromatographic based method (Marquart et al, 1980). The serum insulin level was measured using an enzyme-linked immunosorbent assay (ELISA) kit (LDN, Germany) and its values are reported in μIU/ml.
Leptin and adiponectin assays
Five milliliter of the venous blood sample was taken from the study subjects at baseline. Blood samples collected from study participants were refrigerated and centrifuged at room temperature. Serum samples were stored at −80°C until assayed at a later date. Serum leptin and adiponectin levels were determined using a quantitative sandwich enzyme immunoassay technique (DRG Diagnostics, GmbH, Germany). Samples were assayed in triplicates for both Leptin and adiponectin. Results were expressed as mean ± SEM. The functional sensitivity of the kit to measure adiponectin was 0.2 ng/ml, whereas the functional sensitivity for measurement of leptin was 0.7ng/ml. the normal level for leptin using the DRG kit was 3.84 ± 1.79 for males and 7.36 ± 3.73 for females respectively.
Results
The mean BMI was 45.6 ± 1.5 kg/m2 and 23.2 ± 0.5 kg/m2, for the obese and non-obese subjects, respectively, P value < 0.001. The baseline characteristics of the study population are shown in Table 1. No differences in the gender and mean age were found between obese and non-obese controls, P value 0.35. The obese subjects had significantly higher waist circumference, Fat mass, fasting glucose and lower HDL-Cholesterol and marginally higher triglycerides, compared to the non-obese controls, respectively. However, the two groups had similar HbA1c, total cholesterol, and LDL-cholesterol (Table 1).
Baseline characteristics of the study population.

Data are presented as mean ± SEM.
The mean TSH was significantly higher in the obese group compared to the non-obese controls, 2.7 ± 0.8 versus 1.7 ± 0.13, P value 0.014, respectively (Table 2). FT3 was significantly lower in the obese group compared to the non-obese controls, 3.9 ± 0.1 versus 5.0 ± 0.1, respectively, P value 0.001, however, FT4 was similar in the two groups, P > 0.05 (Table 2). Figure 2 summarizes the changes in TFTs across the BMI quartiles and shows that subjects in the third and fourth BMI quartiles (BMI > 30 and 40, respectively) had the highest mean TSH and the lowest mean FT3 values compared to subjects in the first and second BMI quartiles. The obese subjects had significantly higher leptin and leptin /adiponectin ratio and significantly lower adiponectin compared to the non-obese controls (Table 2). The obese subjects had a slightly higher but not statistically significant fasting insulin level compared to the non-obese subjects, P value > 0.05. HOMA-IR was higher in the obese group compared to the non-obese controls, however, the difference did not reach statistical significance with P value of 0.06 (Table 2).
Comparison of thyroid function, leptin, adiponectin, leptin/adiponectin ratio and HOMA-IR between obese subjects and non-obese controls.

Data are presented as mean ± SEM.
In the whole group (N = 107), there was a positive correlation between serum TSH and both body weight (r, 0.35, P value 0.001) and BMI (r, 0.34, P value 0.001), respectively (Figure 1 shows correlation between TSH and BMI). Moreover, BMI negatively correlated with FT3 as well (r –0.26, P value 0.006), however, there was no correlation between FT4 and BMI.

Positive correlation between serum TSH and BMI.
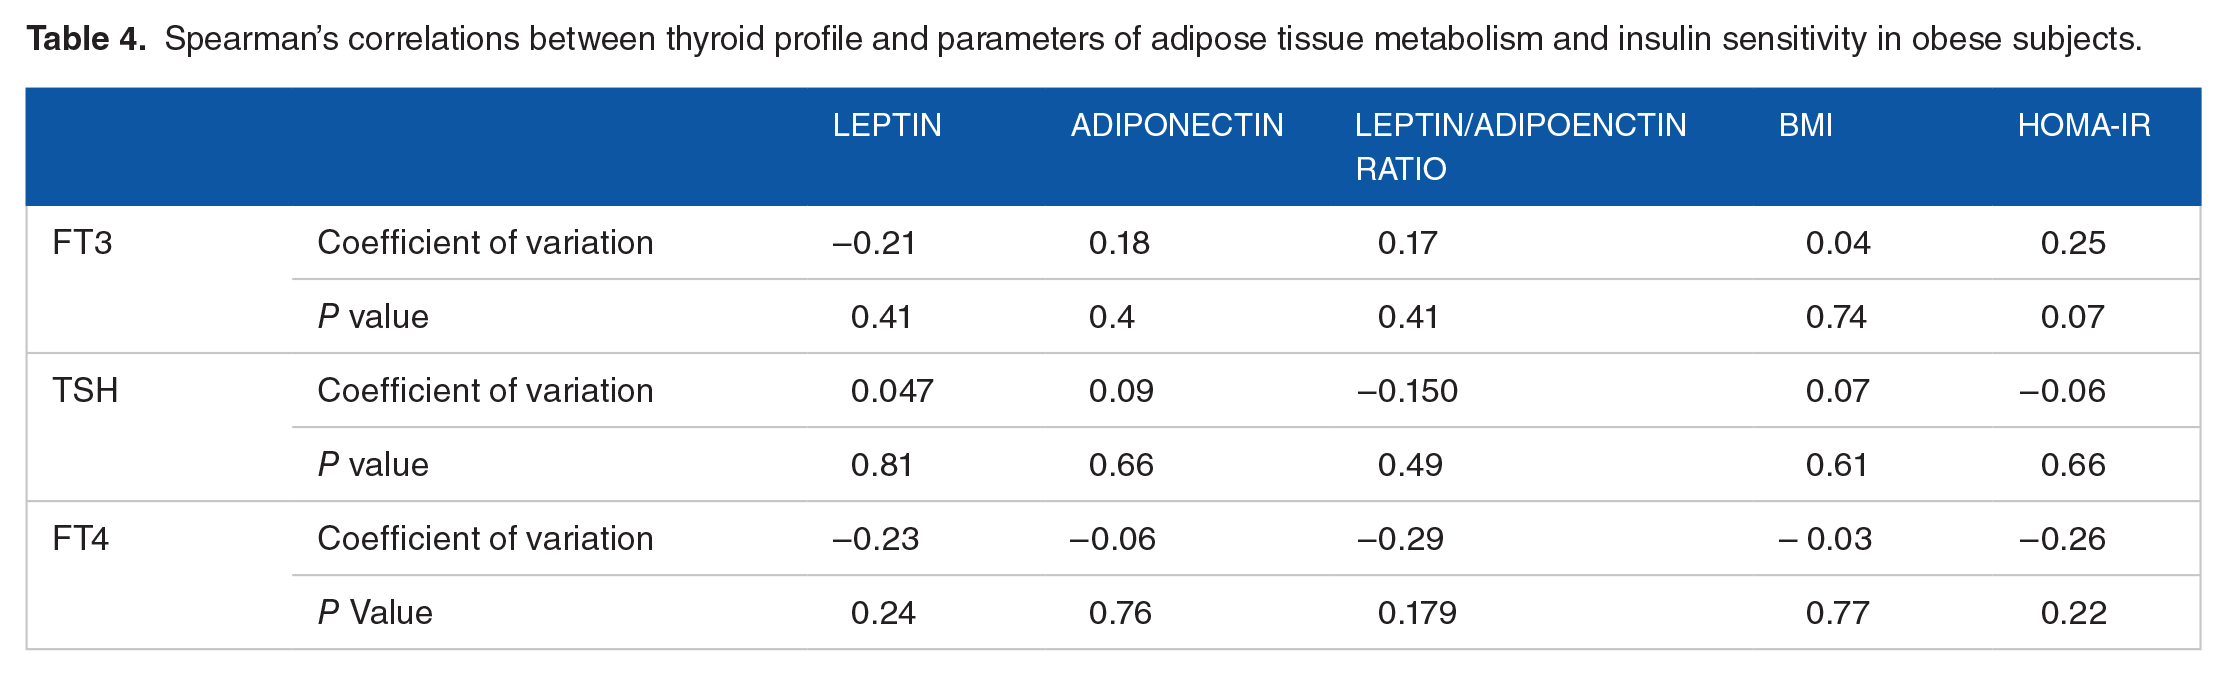
In the non-obese group, both FT4 and FT3, but not the TSH, significantly negatively correlated with serum leptin and leptin/adiponectin ratio, but not with adiponectin, or HOMA-IR as shown in (Table 3). Moreover, FT4 correlated with BMI in the non-obese group as well (Table 3). On the other hand, there were no correlations between serum FT4, FT3, TSH, and either leptin, adiponectin, leptin/ adiponectin ratio, HOMA-IR or BMI in the obese group (Table 4).
Spearman’s correlations thyroid profile and parameters of adipose tissue metabolism and insulin sensitivity in Non-obese controls.

Bold text indicates significant correlations.
Spearman’s correlations between thyroid profile and parameters of adipose tissue metabolism and insulin sensitivity in obese subjects.
In binary logistic regression with the status as obese or non-obese as the dependent variable, TSH (P value 0.009), FT4 (P value 0.022), and FT3(P value 0.020) were the only independent predictors of obesity( BMI > 30) in a model that has included TSH, FT4, FT3, age, gender, leptin, adiponectin, leptin/adiponectin ratio, and HOMA-IR (Table 5). The adjusted odd ratio (AOR) for becoming obese (BMI > 30) is increased by 12.6 for each 1 unit increase in TSH above 2.54 also, the odds for becoming obese was increased by 2.7 for each.
Binary logistic regression with the obesity status either obese or non-obese as dependent variable and age, gender, TSH, FT3, Leptin, Adiponectin, Leptin/Adiponectin Ratio, HOMA-IR as independent variables.

Abbreviation: AOR, Adjusted odd ratio.
Bold text indicates significant correlations.
Multivariate regression analysis was done on the obese and non-obese groups separately to test the association between either FT4, FT3, or TSH as dependent variables in a model that included leptin, adiponectin, leptin adiponectin ratio, and HOMA-IR, adjusted for age, gender, and BMI. In the non-obese controls, FT4 was independently associated with leptin (P value 0.016) and FT3 (P value 0.017) in a model that included age, gender, BMI, FT3, TSH, leptin, adiponectin, leptin/adiponectin ratio, and HOMA-IR. In the obese group, FT4 had no significant associations with all the above listed explanatory variables, including leptin, adiponectin, leptin/adiponectin ratio and HOMA-IR. In the non-obese group, FT3 was independently associated with serum adiponectin (P value < 0.001 ), FT4 (P value 0.026), and leptin/adiponectin ratio (P value 0.003) in a model that included age, gender, BMI, leptin, adiponectin, HOMA-IR, FT4, TSH and leptin/adiponectin ratio, however, FT3 association with leptin was not statistically significant (P value 0.07) . In the obese group, FT3 was independently associated with HOMA-IR (P value 0.002) and adiponectin (P value 0.036), in a model that included age, gender, BMI, HOMA-IR, leptin, adiponectin, Leptin/adiponectin, and FT4. Serum TSH was not associated with leptin, adiponectin, or HOMA-IR in either the obese or non-obese groups separately, however, in the pooled goup, TSH was associated with BMI (P value < 0.001), and age (P value 0.045).
Discussion
In this study, we compared the thyroid function tests of the morbidly obese, euthyroid Saudi subjects with age and gender-matched non-obese euthyroid controls and our findings showed that, even within the normal reference range, obese subjects had significantly higher TSH and lower FT3 concentrations yet similar FT4 levels, compared to non-obese controls. Moreover, TSH positively correlated with both body weight and BMI, and the latter also negatively correlated with FT3 as well. Our findings support the hypothesis that even very minor alterations in thyroid function within the normal reference range may be associated with weight gain and regional obesity, nonetheless, most of the previous studies were done in different ethnic groups hence generalizability of the findings to other ethnic groups would not be appropriate.26,27 Moreover, previous studies did not have well characterized controls group matched for age and gender and did not look at factors such as leptin, adiponectin and insulin resistance in the study population, which all add to the strength of our current study and its findings.26,27 Some studies that were carried out in different ethnic groups and gender populations reported the same association between thyroid function and BMI, including one study from Saudi Arabia, however, these studies were limited by either inclusion of one gender only or the positive association between TSH and BMI was reported in one gender only.21,23,28 Our results of binary logistic regression clearly showed the association of obesity (BMI > 30) with increasing TSH with adjusted odds ratio of becoming obese increasing by 12.7 for each unit increase in TSH, although the 95% confidence interval for this association is very wide indicating that our sample size is smaller and studies on larger samples are clearly needed. Moreover, the obese group had lower levels of FT3 compared to non-obese controls and the logistic regression supported this observation as it appears that there is a negative association between higher levels of FT3 and the odds of becoming obese. However, causality cannot be concluded from these types of cross-sectional studies as there are many other important factors such as genetics, environmental, dietary, and physical activity levels that are known to influence the risk of weight gain and obesity. Moreover, our findings support the findings of a previous study in hypothyroid patients on levothyroxine (L-T4) replacement therapy in which the authors showed that small alterations in serum TSH caused by minimal changes in the doses of L-T4 have led to a remarkable alteration in resting energy expenditure (REE) in these patients.9,29 It is well known that the thyroid hormone regulates body weight by regulating energy expenditure and adipocyte metabolic parameters and any dysfunction in thyroid hormones during hyperthyroidism or hypothyroidism causes a significant change in body weight and resting metabolic rate. 30 On the other hand, lack of association between TSH, FT4, and FT3 and BMI has also been reported by some authors where no association was found between either serum TSH or FT4 and BMI, and no difference was reported in BMI when participants were divided according to serum TSH or free T4 levels. 31 Moreover, the same authors showed no difference in serum TSH or free T4 between lean and obese euthyroid subjects. 31 Some authors postulated that the alterations in thyroid function in obese subjects could be a consequence rather than a cause and is regarded as an obesity-related complication as thyroid function parameters are reversed to normal following weight loss, as in the example of the remission of the comorbidities of obesity such T2DM, hypertension and dyslipidemia following bariatric surgery. 32
One possible hypothesis to explain the change in thyroid function profile in the euthyroid obese population is the fact that the adipocytokines leptin and adiponectin are secreted by the adipocytes and leptin, in particular, regulates the TRH gene expression in the paraventricular nucleus of the hypothalamus. 7 However, in our study and despite the fact that morbidly obese subjects had significantly higher leptin and lower adiponectin levels compared to non-obese controls, nonetheless, leptin did not correlate with thyroid hormones in the obese group and instead, it negatively correlated with both FT3 and FT4 in the non-obese group only and was not correlated with TSH in either group. These observations may indicate that the relationship between leptin and thyroid function may be influenced by different factors in the obese subjects compared to non-obese subjects. Moreover, the results of multivariate regression showed the association between FT4 but not FT3 with leptin in the non-obese group only while the association between FT3 with adiponectin was observed in both the obese as well as the non-obese group may be due our small sample size or alternatively it may indicate lack of consistent influence of leptin or adiponectin on TFTs in obese subjects. Most of the studies have been conflicting regarding the relationship between TSH, serum leptin level, and BMI, with the majority of these studies reporting a lack of association.33,34 Very few studies reported a positive association between serum TSH and leptin such as the study that has was published by Iacobellis et al. 21 One of the explanations for the association between leptin and TSH is the hypothesis that TSH stimulates the release of leptin by adipocytes and then leptin stimulates the release of TSH to compensate for the increase in the fat mass.35,36 However, our findings do not support this hypothesis as we report lack of correlation and association between TSH and either leptin or adiponectin.
We found no significant difference in FT4 level between obese subjects and non-obese controls and this is in agreement with the findings of most of the published studies including the publication by Fox et al and Lundback et al., where the authors showed a lack of significant association between adiposity, FT4 and free T3 level.27,37
Hypothyroidism and subclinical hypothyroidism are associated with insulin resistance and metabolic complications such as hypertriglyceridemia and type 2 diabetes mellitus, however, our study failed to show any correlation between TSH level, FT4, FT3, leptin, adiponectin, leptin/ adiponectin ratio, and insulin sensitivity measured by HOMA-IR in obese subjects and this might be explained by our small sample size but other factors may be responsible such as the fact that HOMA-IR is a crude way of assessing insulin resistance and has its own limitations and more robust and dynamic methods such as euglycemic clamp would have been more reliable as has been demonstrated by Iacobellis et al 21 where the authors showed that thyroid function was associated with adiponectin and insulin resistance parameters, namely, the M index derived from the clamp although the study population were exclusively females. In our study though, we observed a negative correlation between both FT4 and FT3 and leptin/adiponectin ratio, which is a surrogate marker of insulin resistance.
The present study had several strengths and weaknesses. First, while it has confirmed what most of the previous studies found such as the higher TSH and lower FT3 levels in obese subjects compared to non-obese controls as well as confirming the positive correlation between BMI and TSH in a Saudi population. However, we believe our study has a better design than some of the previous studies, such the careful patient selection with age and gender-match with non-obese controls as well as excluding most of the possible confounding factors such as thyroid autoimmunity, which this has been implicated in the etiology of thyroid dysfunction in obese subjects. Moreover, we have excluded acutely illness patients who are known to have abnormal TFTs as well as we eliminated the effects of interfering medications that may affect the thyroid function. Nonetheless, we acknowledge the small sample size and the cross-sectional reporting of our data, however, we will be reporting the influence of weight reduction surgery by sleeve gastrectomy and change in body composition on thyroid function, serum leptin, serum adiponectin, and insulin sensitivity of these subjects at 3- and 6-months intervals, respectively on a second manuscript at a later date, which we expect to give further insights into the long-term changes in thyroid function tests in obese subjects following weight loss. We believe our current study expands the literature on this interesting area of obesity and thyroid function research and opens further areas of research questions such as: does a mild increase in TSH within or slightly above the normal range in obese subjects have any long term consequences ?. Also, it here is a need for further studies to answer the question of whether there is a need to consider different normal reference ranges for TSH and FT3 in obese individuals based on their BMI range as shown in Figure 2, which clearly demonstrates that subjects in the third and fourth BMI quartiles (BMI > 30 and 40, respectively ) had the highest mean TSH and the lowest mean FT3 values compared to subjects in the first and second BMI quartiles. Lastly, we need further studies to address the question of whether its justified to treat a mild elevation in TSH in symptomatic obese people

Changes in thyroid function tests in the study population divided by BMI quartiles. It shows that subjects in the third and fourth BMI quartiles (BMI > 30 and 40, respectively) had the highest mean TSH and the lowest mean FT3 values compared to subjects in the first and second BMI quartiles.
In conclusion, we report that, obese euthyroid Saudi subjects have significantly higher serum TSH and lower FT3 levels, yet similar FT4 levels, respectively, compared to age and gender -matched non-obese controls . Moreover, we report a positive correlation between TSH and both body weight and BMI with increasing odds ratio for becoming obese with increasing levels of TSH and decreasing levels of free T3, within the normal reference range. Leptin seems to negatively correlate with both FT4 and FT3 in the non-obese group only while none of the TFTs correlated with HOMA-IR or adiponectin in either group. It’s still debatable whether the changes in thyroid function tests within the normal reference range are causal or adaptive to the obesity state, however, we will be reporting the 3- and 6-months measurements, respectively, for all the parameters for the obese group who underwent sleeve gastrectomy at a later date. Further mechanistic studies on larger numbers of patients are needed to better explore the relationship between obesity and thyroid function tests.
Footnotes
Acknowledgements
We would like to thank Dr. Shawana Khan and Dr. Abdullah Saleh for their contribution to the study.
Funding:
The author(s) disclosed receipt of the following financial support for the research, authorship, and/or publication of this article: Institutional Research Fund through the Research Centre at King Fahad Medical City, Riyadh, Saudi Arabia. IRF number 13-029.
Declaration of conflicting interests:
The author(s) declared no potential conflicts of interest with respect to the research, authorship, and/or publication of this article.
Author contributions
The authors were assigned specific sections to draft, these were developed into a single manuscript which was reviewed and approved by all the authors.