
Abstract
Chronic obstructive pulmonary disease (COPD) is one of the major causes of chronic morbidity and mortality worldwide. The development of markers of COPD onset is hampered by the lack of accessibility to the primary target tissue, and there is a need to consider other sample sources as surrogates for biomarker research. Airborne toxicants pass through the nasal epithelium before reaching the lower airways, and the similarity with bronchial histology makes it an attractive surrogate for lower airways. In this work, we describe the transcriptomics findings from the nasal epithelia of subjects enrolled in a clinical study focusing on the identification of COPD biomarkers. Transcriptomic data were analyzed using the biological network approach that enabled us to pinpoint the biological processes affected in the upper respiratory tract in response to smoking and mild-to-moderate COPD. Our results indicated that nasal and lower airway immune responses were considerably different in COPD subjects and caution should be exercised when using upper airway samples as a surrogate for the lower airway. Nevertheless, the network approach described here could present a sensitive means of identifying smokers at risk of developing COPD.
Introduction
Chronic obstructive pulmonary disease (COPD) is one of the major causes of chronic morbidity and mortality worldwide. 1 Although the forced expiratory volume (FEV1) is the diagnostic tool for COPD, the disease is heterogeneous, and various methods are necessary to confirm initial diagnosis, define the phenotype, and identify the regions of the airway in which it manifests. These techniques include the assessment of gas transfer and high-resolution computed tomography (CT) to assess lung function and the extent of small airway obstruction and lung emphysema, respectively.2,3 However, although valuable, these methods do not allow for the identification of subjects at risk of developing COPD or those who have subclinical disease, when intervention might still be effective. 4
The development of biomarkers of disease onset and early progression is hindered by the accessibility of primary tissue, so there is a need to evaluate alternative sample types for biomarker research. 5 The appreciation of the nasal epithelium as a surrogate for the lower airways has grown in recent years. Not only is it the passage through which airborne toxicants travel to the lower airways, but it also mimics the bronchus with respect to cellular composition. 6 While the nasal mucosa is attached to bone, the bronchial mucosa attaches to cartilage. 7 Along the airway, the epithelium gets thinner and cellular composition changes with goblet cells gradually being replaced by club cells in the distal airways. 8 However, when COPD develops, the small airways become populated by goblet cells, leading to the mucus production associated with the disease. 9
The main cause of COPD, cigarette smoking, damages the upper respiratory tract.10–12 The harmful effects seen in the lower and distal airways are also mirrored in the nasal epithelium, with functional and inflammatory changes also observed in young “healthy” smokers. 13 Nasal mucosa from smokers accumulates DNA adducts at a higher frequency than the bronchial mucosa,14,15 and this is associated with polymorphisms in several genes linked to lung cancer risk. 16 Similar relationships have been reported between sinonasal symptoms and COPD, and these studies have been comprehensively reviewed. 17
Nasal sampling is a minimally invasive technique 18 that could replace invasive bronchoscopy in clinical practice. 19 It provides a sufficient amount of cellular material for molecular profiling in state-of-the-art systems biology approaches and has also been proposed as a tool to study DNA methylation in airway diseases. 20 In this study, we set out to identify differences between the nasal mucosal transcriptomes of current smokers (CS), smokers with COPD, and never-smokers (NS). We obtained nasal epithelial samples from a noninterventional, observational case-control clinical study aimed at identifying biomarkers for mild-to-moderate COPD. While confirming some of the earlier findings regarding similar gene expression changes in response to cigarette smoke exposure in the nose and bronchus,21,22 we also provide novel information about the regulation of gene expression in the nasal epithelium in COPD GOLD I and II subjects compared with CS, with some support from cytokine levels determined in the nasal lavage of the same subjects.
Methods
Clinical study subjects
The Queen Ann Street Medical Center (QASMC) clinical study was a noninterventional, observational, case-control study conducted in the United Kingdom. It was approved by the UK National Health Service Ethics Committee (The Black Country Ethics Committee, case number: 11/WM/0114) and was in compliance with International Conference on Harmonisation Good Clinical Practice (ICH-GCP) guidelines. 23 The study has been registered on ClinicalTrials.gov with identifier NCT01780298. After given full and adequate oral and written information about the nature, purpose, possible risk, and benefits of the study, each subject signed an informed consent form.
A total of 240 study subjects of equal sex distribution and aged between 41 and 70 years were included. The study focused on four groups: NS, CS, former smokers (FS), and subjects with early-stage COPD (FEV during the first second [FEV1]/forced vital capacity [FVC] ⩽70%, FEV1 ⩾50%) (www.goldcopd.org), each consisting of 60 subjects. Current smokers, FS, and COPD subjects had a smoking history of at least 10 pack-years. Subjects in each of the groups were matched to subjects in the COPD group by age (±5 years), ethnicity, and sex. For this purpose, a match ID was defined for each paired group of 4 subjects.
Collection of nasal scrapes and gene expression profiling
Nasal epithelium for microarray analysis was collected from all 240 study participants during clinical visits 2 and 4 using a plastic Rhino-probeTM. RNA was extracted, processed, and hybridized to Affymetrix Human Genome U133 Plus 2.0 Arrays by AROS Applied Biotechnology A/S (Aarhus, Denmark) according to their standard procedures. Following AROS hybridization quality control (QC), 211 CEL files (50 COPD, 54 CS, 52 FS, and 55 NS) were delivered for further analysis.
Network-based analysis of differential gene expression
The CEL files first underwent an iterative QC using the standard arrayQualityMetrics software package from the Bioconductor repository available for the R statistical programming language.24,25 At each iteration, arrays that failed in at least 2 of the 5 considered quality metrics (distances between arrays, signal intensity distributions, relative logarithmic expressions, normalized unscaled standard errors, and spatial distributions in individual arrays) were discarded. This procedure rejected 22 arrays in 4 iterations.
The remaining 189 CEL files were background-corrected, normalized, and summarized using frozen-Robust Microarray Analysis. 26 The summarization step additionally made use of the custom Chip Definition Files (CDF) environment HGU133Plus2_Hs_ENTREZG v16.0, 27 which directly converted the final expression matrix into the HGNC namespace used in the downstream network analysis (http://www.genenames.org/). These raw and normalized data have been deposited in the ArrayExpress repository (E-MTAB-4015). Public data sets used in the study are summarized in Supplementary Table 2.
For all relevant subject group comparisons (CS vs NS, COPD vs NS, and COPD vs CS) a model for estimating the differential gene expression was fitted with LIMMA (Smyth, 2004). It included the “match ID” variable as a discrete covariate to account for the subject grouping (see “Clinical study subjects” subsection). The P-values for each computed comparison were adjusted across genes using the Benjamini-Hochberg false discovery rate method. 28
To quantitatively assess the perturbation of relevant biological processes, we employed previously defined network models describing essential biological pathways related to cell stress, proliferation, cell fate, and inflammation (Supplementary Table 1).29,30 The network models were built from causal molecular relationships identified from scientific literature and encoded in the Biological Expression Language, which is human readable and allows for computation.31–35 A biological entity in the network is called a node, and the relationships between the nodes are network edges. The network models have 2 layers, in which the upper layer represents the actual causal network model and the lower layer represents the gene expression changes resulting from the activation of certain components in the upper layer (Figure 1A). Hence, the network models can be scored with transcriptomics data sets by using the differential gene expression to infer the activity of the components in the upper layer. 36 The method uses gene expression data without a fold-change or P value cut-off. Briefly, the 18 604 differential gene expression values of each comparison were transformed into 2210 differential values for each network node, which were then summarized into one quantitative measure of network perturbation amplitude for each network as a whole.37–40 The network models are available for view in http://www.causalbionet.com/, and Supplementary Table 1 lists all 29 network models and their overarching biological grouping that were applied in the current analysis.
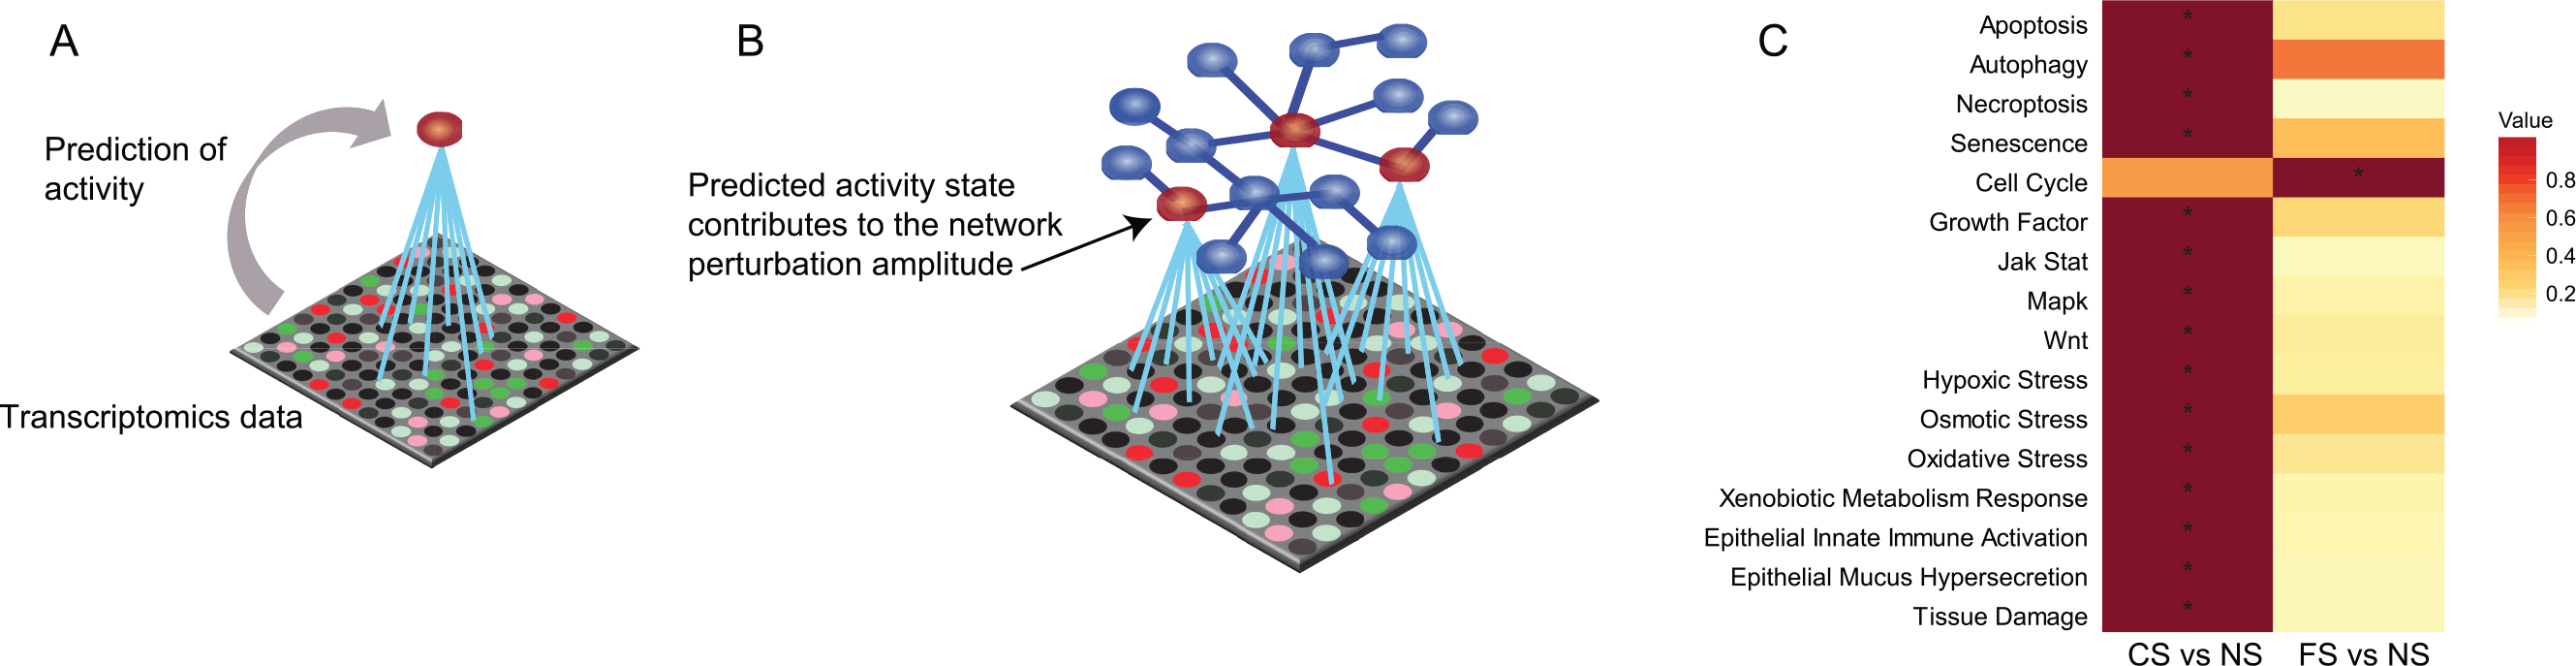
Impact of smoking on the nasal epithelium. (A) The principle of scoring the transcriptomics data onto biological network models. The activation/inhibition of biological entities is predicted based on differential gene expression. (B) The network perturbation amplitude is computed as a whole based on the predicted impact on the biological entities constituting the network model. 36 (C) Heatmap comparing the impact of smoking and smoking cessation on each network across the data sets. The color gradient of the network perturbation amplitude score is normalized to the maximum score per network. Only the network models that show a significant impact for at least one sample type comparing current smokers and never-smokers are shown. A network is considered significantly perturbed if the network perturbation amplitude score remains significant after accounting for the experimental variation and if the companion statistics O and K are significant (P < .05). The O and K statistics indicate the specificity of the score to the biology represented by each network. *Significant score with respect to the experimental variation and with significant O and K statistics. CS indicates current smoker; FS: former smoker; NPA, network perturbation amplitude; NS: never-smoker.
Collection, processing, and statistical analyses of nasal lavage samples
Nasal lavage was collected during visit 2. To perform the nasal lavage, a 10-mL syringe was prefilled with 5 mL of sterile 0.9% saline (at room temperature) and attached to a hollow nasal adapter or “olive.” The syringe was gently placed into the left nostril, saline was released into the nasal cavity, and the fluid was withdrawn into the syringe and flushed back into the nasal cavity 20 times over a 1-minute period, after which the nasal fluid was collected for analysis. Monocyte chemoattractant protein-1 (MCP-1) and tissue inhibitor of metalloproteinase-1 (TIMP-1) were analyzed using the Luminex multiplexed bead array system (R&D Systems, Abingdon, UK), and neutrophil elastase (NE) was analyzed using an enzyme-linked immunosorbent assay (eBioscience, Hatfield, UK). Unadjusted P values were estimated by paired t-tests. The pairing was done by matching the NS and CS subjects to the COPD subjects by age, sex, and ethnicity.
Results
Biological impact of smoking on the nasal epithelium
For the quantitative assessment of the biological impact of smoking on nasal epithelium, we used the network approach introduced in several previous publications.36–38,41 The original networks were modified to include COPD-relevant processes as well as to aggregate some of the smaller network models into coherent representations of biological processes.40,42 The network models were chosen based on the assumption that most of the scraped nasal cells were epithelial cells 43 and that biological processes were similar to those found in the lower airways. The network models used are listed in Supplementary Table 1, the sample details are shown in Supplementary Table 2, and the network scoring is described in Figure 1A and B. Analogous to the gene set enrichment, genes are grouped under their common regulators. When the level of the corresponding messenger RNAs are changed in the sample, one can infer the activity of the common regulator (Figure 1A). When modeled under a given biological process with causal connections, these inferred molecular activities determine whether the biological network is perturbed as a whole (Figure 1B). The analysis demonstrated that several networks related to inflammation (epithelial mucus hypersecretion, epithelial innate immune activation, and tissue damage), cell stress (xenobiotic metabolism response and oxidative stress), proliferation (growth factor), and cell fate (senescence, necroptosis, autophagy, and apoptosis) were affected by smoking (Figure 1C). The comparison of FS with NS group suggested impacts that could be irreversible. The smoking-induced perturbations were largely predicted to recover in the FS nasal epithelium; however, the cell cycle appeared as a newly perturbed network model in the FS nasal epithelium (Figure 1C).
To look further into the mechanisms responsible for the impact on each network, we conducted a leading node analysis. Leading nodes are the entities in the network models that together contribute 80% to the network perturbation amplitude score. Moreover, while the network perturbation amplitude is without direction, the leading node analysis shows the directionality (upregulation or downregulation) of the impact. Figure 2A shows the top leading nodes for each of the networks affected in the smoker compared with nonsmoker nasal epithelium. Although the xenobiotic metabolism response was upregulated in the smokers’ nasal epithelium, the majority of network nodes were predicted to be downregulated, indicating overall inhibition of these processes in response to smoking. In the context of several models, nuclear factor (NF)-κB signaling was predicted to be downregulated in the smoker nasal epithelium. Figure 2B shows the leading nodes and their directionality for the impact on the FS nasal epithelium with respect to mechanisms captured by the cell cycle network model. Here, factors involved in cell cycle progression, such as E2F proteins, TFDP1, and CCNA2, were predicted to be downregulated.
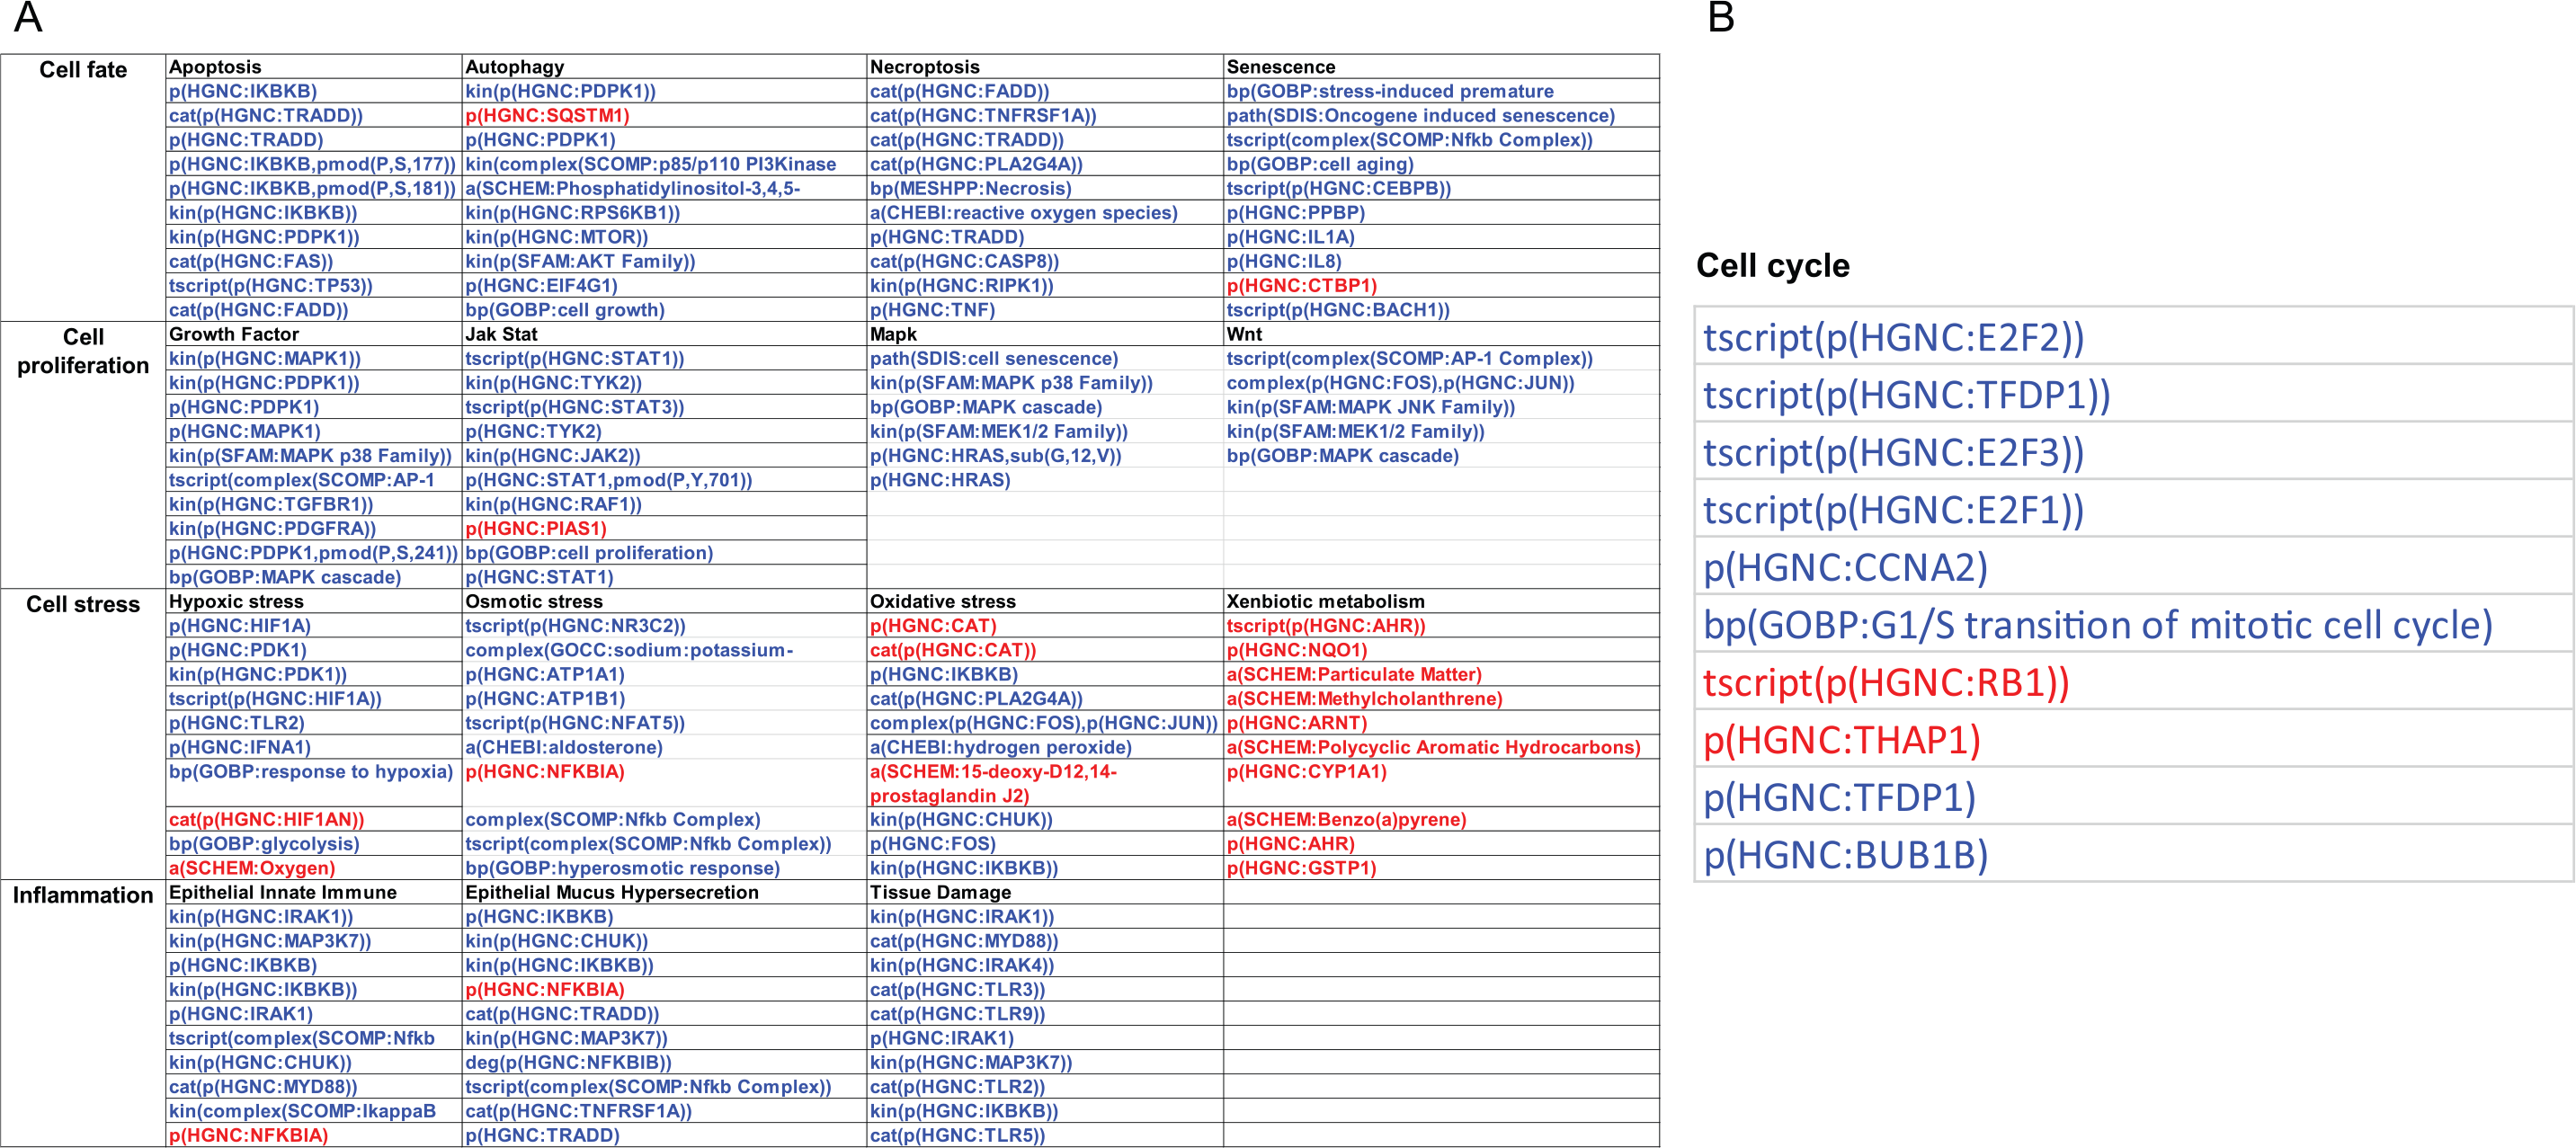
Leading node analysis of the network perturbation in (A) current smoker and (B) former smoker nasal epithelium. While the network perturbation amplitude is without direction, the leading node analysis reveals the directionality of the backbone score. The top 10 leading nodes in A and B are represented in Biological Expression Language (BEL); the vocabulary for BEL is provided in http://www.openbel.org/. The directionalities of regulation are shown as red (up) and blue (down) and the order indicates the relative contribution to the score.
COPD-specific impact on nasal epithelium biology and comparison with that of the lower airways
Applying rigorous statistical analysis of gene expression results (false discovery rate <0.05), we found no significantly differentially expressed genes between COPD subjects and CS (Figure 3A). On the contrary, the threshold-free network approach enabled us to identify biological impacts present in nasal epithelium of COPD subjects but not in CS (Figure 3B). We compared these findings with public data sets of both large and small airway samples from asymptomatic smokers and COPD smokers.44–53 The description of all data sets used in this study is shown in Supplementary Table 2. Networks that showed perturbations in samples from all 3 levels of the respiratory tract were epithelial innate immune activation, oxidative stress, and senescence (Figure 3B). The leading node analysis revealed that these networks were perturbed in opposite directions in nasal and large airway samples compared with small airway samples from COPD subjects as shown by the leading node directionalities in Figure 4A. The amount of reactive oxygen species (modeled under oxidative stress) and senescence were predicted to be reduced in the nasal and large airway samples of COPD subjects compared with smokers. However, all of these mechanisms were predicted to be increased in the small airway of COPD subjects compared with smokers. Figure 4B shows a detail of the epithelial innate immune response network model with IRAK1, TRAF6, MYD88, and IL1R1 predicted downregulated in the smoker nasal epithelium.

Impact of COPD on the nasal and the respiratory tract epithelium. (A) Volcano plots representing the differentially expressed genes extracted from each data set. For each gene, the gene expression change, calculated as the log2 fold-change, is plotted on the x-axis and the statistical significance, proportional to the negative log10-adjusted P value, is plotted on the y-axis. Yellow and cyan dots highlight genes that are statistically significantly upregulated and downregulated, respectively (FDR-adjusted P < .05). (B) Heatmap comparing the impact on each network across the comparisons (COPD vs current smoker at different levels of the respiratory tract). The color gradient of the network perturbation amplitude score is normalized to the maximum score per network. Only the network models that show a significant impact for at least one comparison are shown. A network is considered significantly perturbed if the network perturbation amplitude score remains significant after accounting for the experimental variation and if the companion statistics O and K are significant (P < .05). The O and K statistics indicate the specificity of the score to the biology represented by each network. *Significant network perturbation amplitude score with respect to the experimental variation and with significant O and K statistics. COPD indicates chronic obstructive pulmonary disease; CS: current smoker; FDR: false discovery rate.

(A) Leading node analysis of the networks affected in the nasal epithelium, large airway, and small airway of COPD subjects compared with current smokers. The top 10 leading nodes are represented in Biological Expression Language (BEL); the vocabulary for BEL is provided in http://www.openbel.org/. The directionalities of regulation are shown as red (up) and blue (down), and the order indicates the relative contribution to the score. (B) A subset of the epithelial innate immune activation network model is shown with the network perturbation amplitude backbone scores for some of the most important nodes that are affected in the smoker nasal epithelium. Each node contains the score for COPD subjects vs current smokers in (1) nasal epithelium, (2) large airway, and (3) small airway. Blue bar indicates predicted downregulation, and yellow/orange bar indicates predicted upregulation. COPD indicates chronic obstructive pulmonary disease.
Differences in nasal biology in COPD subjects compared with NS
For diagnostic purposes, it is necessary to recognize the differences between COPD subjects and smokers with NS to classify subjects who are at risk of developing COPD. Therefore, we have also evaluated the changes in the nasal transcriptome in COPD and CS groups compared with NS. Shown in Figure 5, the majority of processes that were affected in the smoker nasal epithelium were affected to a higher degree in COPD subjects. The exceptions were xenobiotic metabolism that was no longer affected in COPD and calcium signaling in the context of cell proliferation that was affected when disease manifested. Verified by leading node analysis, the common processes affected in both COPD and CS groups were similar and regulated in the same direction (not shown).

Impact of smoking and COPD on the nasal epithelium compared with nonsmoker nasal epithelium. The heatmap shows all the networks that were perturbed in the nasal epithelium of COPD subjects or current smokers compared with never-smokers. The color gradient of the network perturbation amplitude score is normalized to the maximum score per network. Only the network models that show a significant impact for at least one comparison are shown. A network is considered significantly perturbed if the score remains significant after accounting for the experimental variation and if the companion statistics O and K are significant (P < .05). The O and K statistics indicate the specificity of the network perturbation amplitude score to the biology represented by each network. *Significant NPA score with respect to the experimental variation and with significant O and K statistics. COPD indicates chronic obstructive pulmonary disease; CS: current smoker; NPA: network perturbation amplitude; NS: never-smoker.
Markers of inflammation in the nasal lavage
Study subjects also underwent nasal lavage to identify markers that are altered by smoking and mild-to-moderate COPD. These included, but were not limited to, the following: NE, interleukin (IL)-1β, IL-2, IL-4, IL-5, IL-6, IL-8, IL-10, IL-9, IL-12, IL-13, IL-17, tumor necrosis factor-α, transforming growth factor-β, granulocyte macrophage colony stimulating factor, MCP-1, TIMP-1, matrix metalloprotease (MMP)-8, MMP-9, MMP-12, interferon-γ, and interferon gamma–induced protein 10 kDa (IP-10). The majority of these analytes were below the detection limit or there were no notable differences between CS and NS or COPD subjects and CS (not shown). Tissue inhibitor of metalloproteinases-1 was the only analyte present at higher levels in nasal lavage from smokers compared with NS. Monocyte chemoattractant protein-1 was increased and neutrophil elastase was decreased in the nasal lavage of COPD subjects compared with CS (Figure 6).
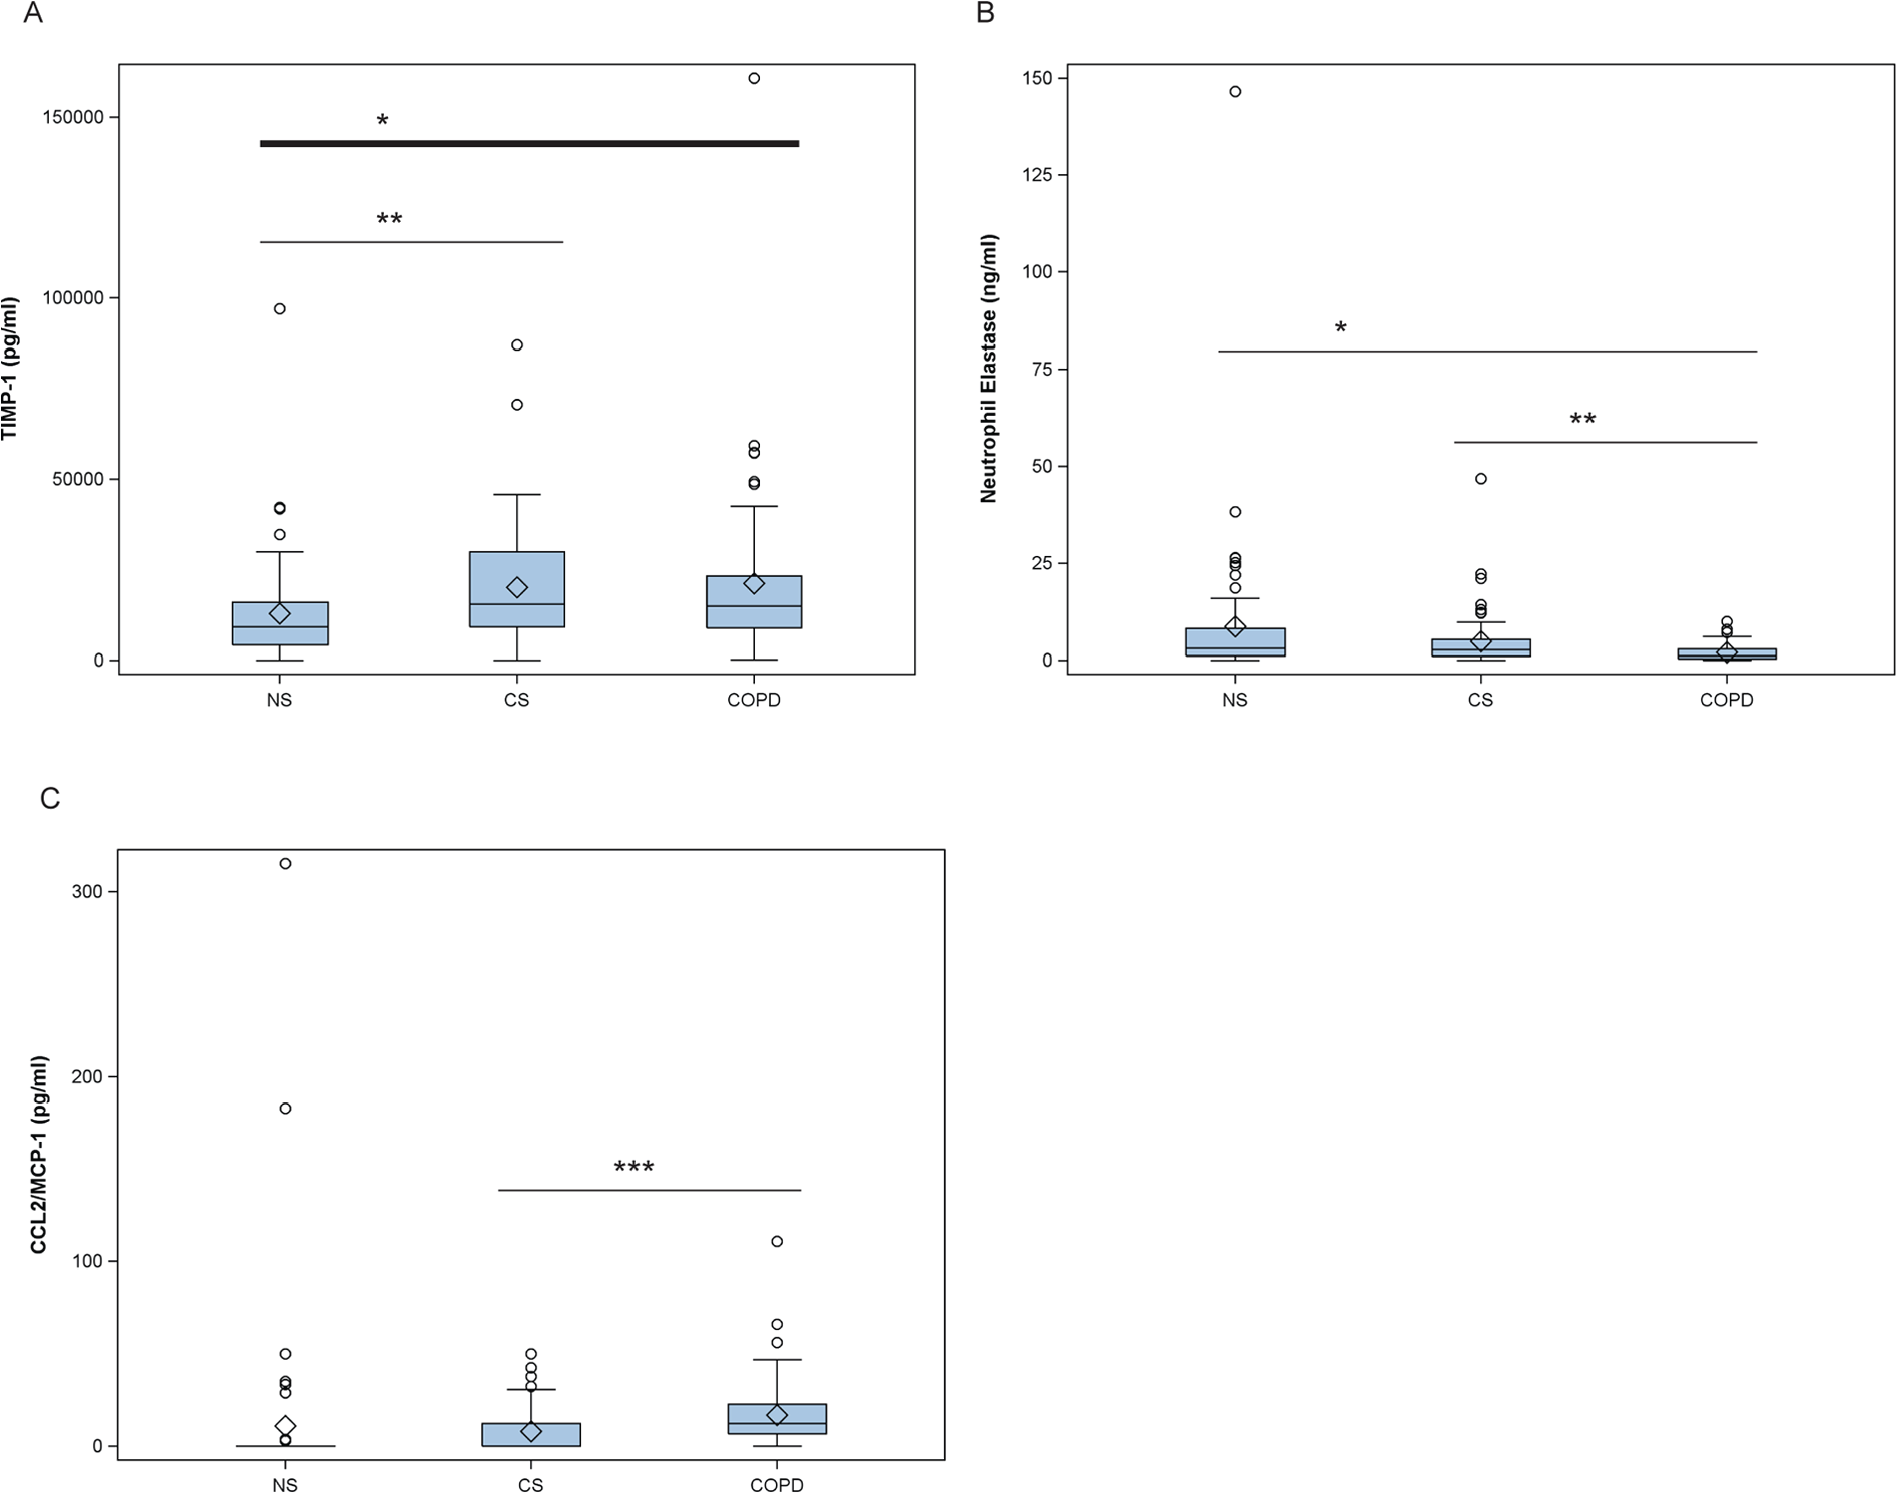
Quantification of cytokines in the nasal lavage of study subjects. Analytes that showed significant differences between the study groups are shown in box-whisker plots. Plots reflect the first and third quartile (lower and upper boundary of box, respectively), median (in-box line), mean (diamond), and minimum and maximum values (lower and upper whisker, respectively) for the corresponding study group. Outliers are represented by open circles. NS: never-smoker; CS: current smoker; COPD: subjects with chronic obstructive pulmonary disease. Unadjusted P values were estimated by paired t-tests: ***P <.001, **P < .01, *P< .05.
Discussion
In this article, we have described the transcriptomics findings from the nasal epithelia of subjects enrolled in a clinical study focusing on early-stage COPD (www.goldcopd.org). The data set is unique because it contains information about the impact of smoking and early-stage COPD on the nasal epithelium transcriptome, which has not been uncovered in any previous clinical study on COPD. Indeed, the ECLIPSE (Evaluation of COPD Longitudinally to Identify Predictive Surrogate Endpoints) clinical trial included subjects with more advanced COPD and only conducted transcriptomics analyses of sputum samples. 54
The upregulation of the xenobiotic metabolism response was expected in the nasal epithelial cells from smokers, as shown previously.22,55 Moreover, increased TIMP-1 in the nasal lavage of the CS group compared with the NS group was also in line with previous findings on the impact of smoking on the respiratory tract.56,57 More surprising was the downregulation of several processes in response to smoking identified by the top-down network approach and the leading node analysis, including decreased NF-κB signaling in the context of several network models. The predicted downregulation of the key molecules involved in cell cycle progression could indicate irreversible damage to the nasal epithelium by smoking. One limitation of the cross-sectional study design applied here is that it does not allow us to make statements about reversible or irreversible impacts or additional processes that are affected in the nasal epithelium on smoking cessation. To achieve this, a longitudinal study is necessary to monitor the impact in the same individual on smoking cessation. The need for such study design further underscores the necessity of an easily accessible surrogate tissue for repeated sampling, such as the nasal mucosa.
We discovered somewhat counterintuitive biological impacts of COPD in the nasal epithelium and large airway samples compared with the small airway samples. In the small airways, the MyD88/IRAK1 signaling pathway within the epithelial innate immune activation network was activated in COPD subjects compared with CS, consistent with the finding that MyD88 signaling mediates cigarette smoke–induced pulmonary inflammation 58 and reduces elastase–induced lung inflammation and emphysema in MyD88-deficient mice. 59 Supporting the surprising negative directionality of the impact on the same process in the nasal epithelium, neutrophil elastase was decreased in the nasal lavage of COPD subjects. Neutrophil elastase has previously been shown to upregulate IL-8 in large airway epithelial cells. 60 Although we were not able to detect differences in nasal lavage IL-8 levels among the groups in this study, the leading node analysis indicated that IL-8 was downregulated in the context of the innate immune activation network. Nicola et al 13 reported decreased IL-8 in the nasal lavage of heavy smokers, although it was increased in light smokers compared with NS. Both IRAK and MyD88 have been linked to this signaling cascade, resulting in the nuclear translocation of NF-κB. Activation of NF-κB was the top leading node predicted to be downregulated in our network analysis and upregulated in the small airway.
These observed opposite biological impacts in the nasal/large airway and small airway epithelium could be the result of differences in the innate immune response along the respiratory tract after COPD has manifested. Physiologically, the upper respiratory tract is exposed to pathogens, whereas colonization in the distal airways is relatively low or by potentially non-pathogenic microorganisms. 62 Exposure of a human nasal cell line to cigarette smoke has been shown to elicit the production of intracellular reactive oxygen species and the expression of the gene encoding toll-like receptor (TLR) 4, 63 an effect that has also been observed in bronchial epithelial cells64,65 On the contrary, a recent study showed that nasal epithelial cells treated with TLR ligands fail to exhibit similar responses as alveolar cells. 66 Comer et al further concluded that the in vitro treatment of nasal cells from COPD patients only partially mimics the responses obtained with large airway cells.67,68
In conclusion, although the xenobiotic metabolism response seems to be well recapitulated in the nasal epithelium of smokers, care should be taken when the upper respiratory tract is used as the surrogate for lower airways. Studies on sinonasal symptoms associated with COPD status are inconclusive, 17 and the analytical methods used, such as nasal lavage cytokine profiling, may not be sensitive enough to determine the impact of COPD on the upper respiratory tract. The network approach could provide a very sensitive means to investigate this biology, keeping in mind that the directionalities of processes, such as inflammation, could be reversed in the upper compared with the lower respiratory tract. Some additional biological processes, such as ciliary function, could also be added to the set of networks for the analysis of nasal data. For such an evaluation, however, a larger cohort of subjects is needed and FEV1 values may not be the most accurate means of categorizing individuals that are no longer healthy but do not match the criteria of early-stage COPD. The network approach could be used to identify subjects with subclinical disease and who therefore represent the target group for clinical intervention. Our analysis is in agreement with Titz et al 69 who showed that the majority of processes that were affected in the CS were affected to a higher degree in COPD subjects in the sputum samples from the same study. The comparison of COPD and CS groups with NS in the context of biological network models represents a putative quantitative scoring method for the nasal epithelium of smokers who do not yet show typical symptoms and exhibit normal FEV1 values.
An evident shortcoming of this study is the use of public data sets from different subject cohorts to compare the lower airway biology with the one in the upper airway. To minimize any bias, we have reprocessed the data using our pipeline, including quality control and normalization, and concluded that the data are of good quality. Moreover, the data sets used come from reputable institutions known for well-designed studies, and based on the annotations accompanying the public data, we are not concerned about confounding effects. That said, the establishment of diagnostic methods relying on the nasal transcriptome calls for the screening of a large cohort of long-term smokers with follow-up on the appearance of disease symptoms. Subjects showing increased impact on the nasal epithelium transcriptome and the resulting perturbation of selected network models would be the target group for closer follow-ups, intervention, or even preventive medical treatment to resolve the chronic inflammation that typically accompanies COPD. Intervention could include intensive coaching for quitting smoking or switching to nicotine products of potentially reduced risk to help with the strong nicotine dependence of COPD subjects. 70 It would also be of interest to compare the nasal transcriptome from subjects with different manifestations of COPD, ie, those with emphysema or small airway obstruction, to assess whether the nasal molecular profile could provide a general predictor of the disease regardless of the disease heterogeneity.
Conclusions
This study is the first to compare the nasal transcriptomics of smokers and COPD subjects to assess the value of the upper respiratory tract as the surrogate for lower airways in the field of biomarker discovery. Although the biological processes affected by COPD in the nasal epithelium were largely similar to the small airway biology of the disease, the directionality of the impact was divergent, indicating differences in innate immune response along the respiratory tract. Nevertheless, the network scoring approach applied to the nasal epithelial transcriptome could provide a sensitive readout on the pathological changes in the respiratory tract during COPD development and progression.
Footnotes
Acknowledgements
The authors would like to thank Dr Brian Leaker at the Queen Ann Street Medical Center for conducting the clinical study, as well as Elena Pierri and Loyse Felber-Medlin for managing the study from the PMI side.
Peer review:
Five peer reviewers contributed to the peer review report. Reviewers’ reports totaled 243 words, excluding any confidential comments to the academic editor.
Funding:
The author(s) disclosed receipt of the following financial support for the research, authorship, and/or publication of this article: Philip Morris International is the sole source of funding and sponsor of this project.
Declaration of conflicting interests:
The author(s) declared the following potential conflicts of interest with respect to the research, authorship, and/or publication of this article: All authors are full-time employees of Philip Morris International.
Author Contributions
NC, MCP, and JH conceived and designed the experiments. GV, AS, PL, and FM analyzed the data. MT wrote the first draft of the manuscript. MT, KL, MJP, and JH contributed to the writing of the manuscript. All authors agree with manuscript results and conclusions. MT and FM jointly developed the structure and arguments for the paper. All authors made critical revisions and approved the final version. All authors reviewed and approved of the final manuscript.
Disclosures and Ethics
As a requirement of publication, author(s) have provided to the publisher signed confirmation of compliance with legal and ethical obligations including but, not limited to, the following: authorship and contributorship, conflicts of interest, privacy and confidentiality and (where applicable) protection of human and animal research subjects. The authors have read and confirmed their agreement with the ICMJE authorship and conflict of interest criteria. The authors have also confirmed that this article is unique and not under consideration or published in any other publication, and that they have permission from rights holders to reproduce any copyrighted material.
References
Supplementary Material
Please find the following supplemental material available below.
For Open Access articles published under a Creative Commons License, all supplemental material carries the same license as the article it is associated with.
For non-Open Access articles published, all supplemental material carries a non-exclusive license, and permission requests for re-use of supplemental material or any part of supplemental material shall be sent directly to the copyright owner as specified in the copyright notice associated with the article.