
Abstract
Background:
Atrial fibrillation (AF) is the most common arrhythmia and can lead in the long-term to atrial remodelling. Three-dimensional speckle-tracking echocardiography allows evaluation of left atrial function and the magnitude of remodelling processes.
Methods:
Echocardiography loops were collected between December 2021 and December 2022. Only valid atrial loops with sinus rhythm during examination were included. The Spearman test was used to establish correlation matrices of left atrial parameters, with uni-, multivariate and binary logistic regression to predict the presence or absence of AF.
Results:
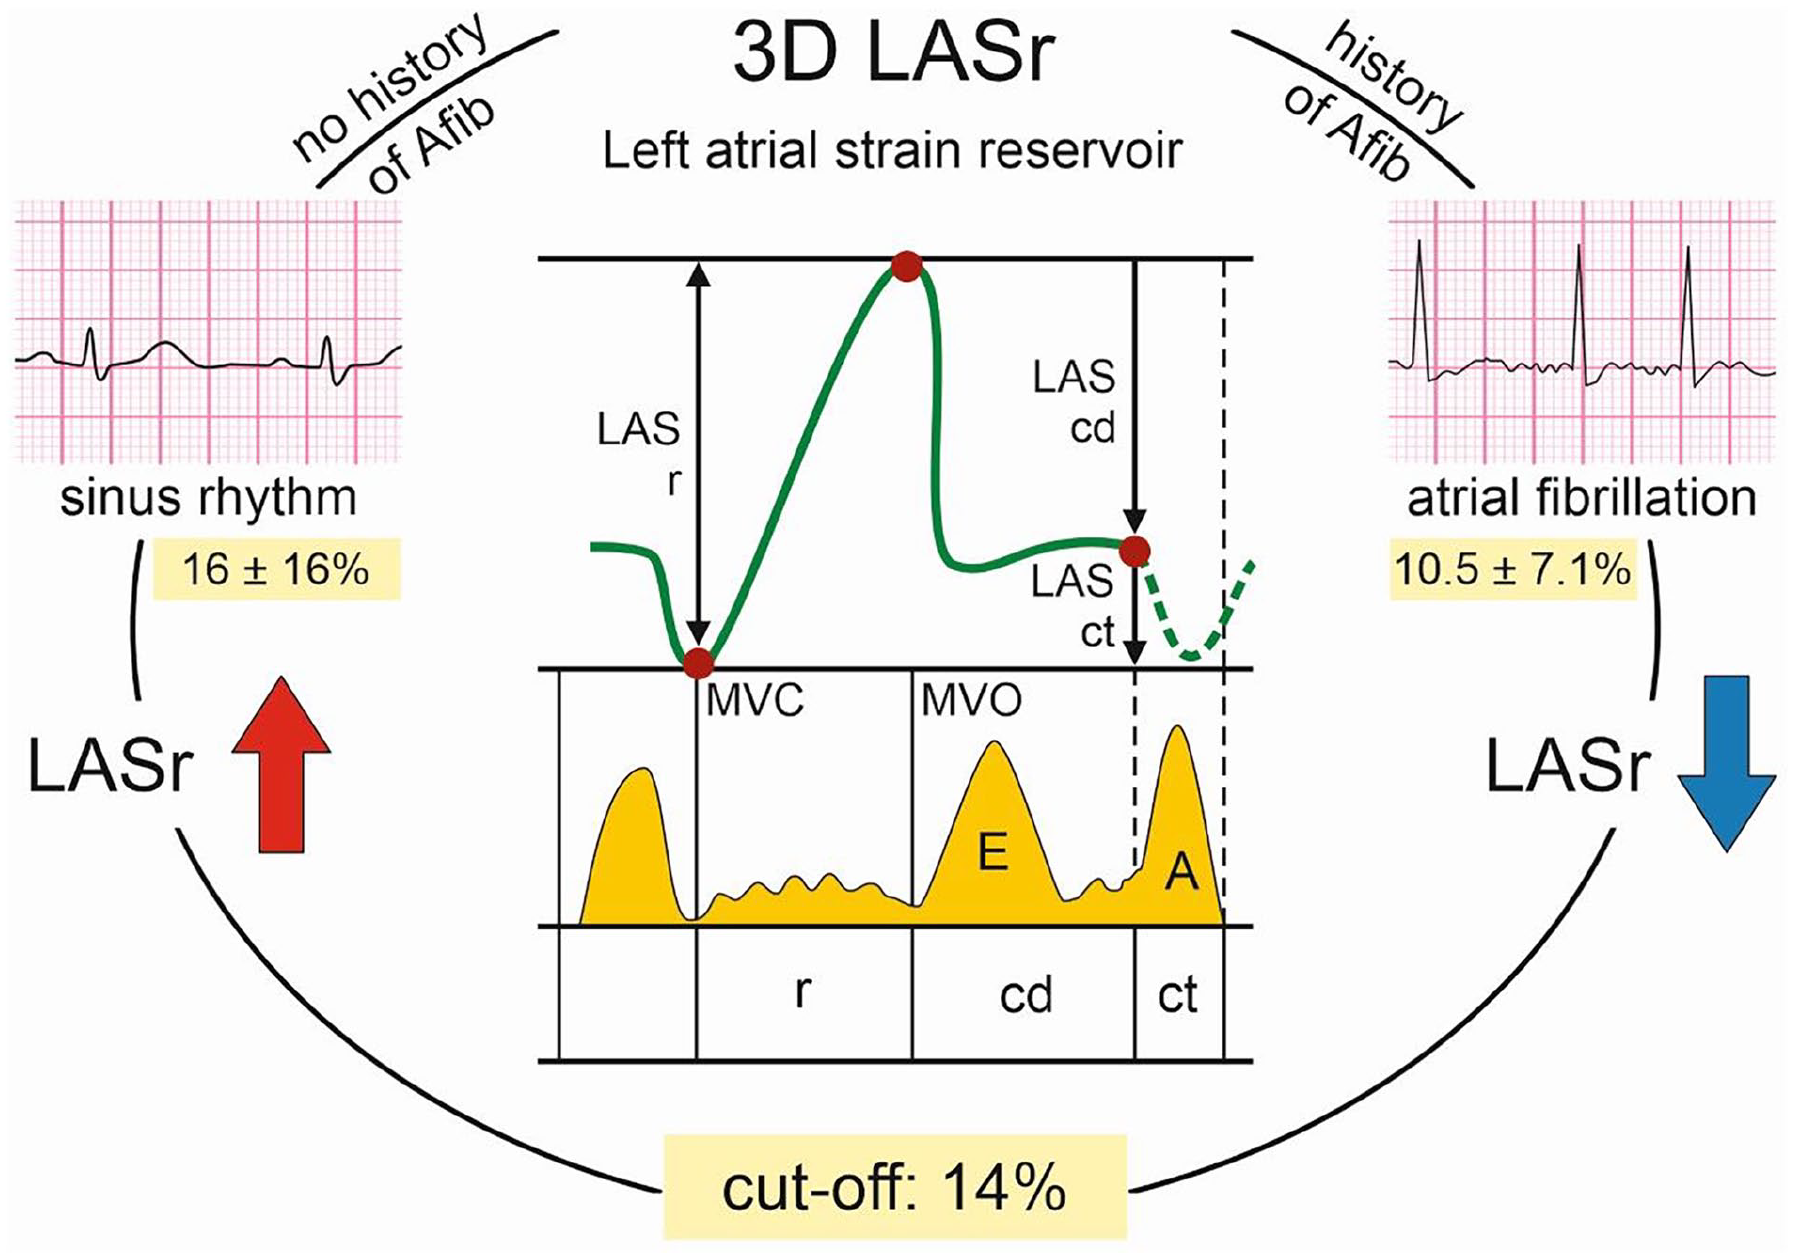
A total of 116 patients (50% females) aged 76.9 ± 11.2 years were included in the analysis. Males and females differed in anthropometric and other clinical parameters. Intra- and interobserver variability was 1.12% and 1.85%, respectively. 2D and 3D left atrial volumes correlated significantly (r = .8, P<.0001). Almost all left atrium strain measurements uni- and multivariately predicted the presence of AF, binary logistic regression model identified 2 independent parameters, left atrial longitudinal strain reservoir (LASr, P = .042) and LAS conduit phase (P = .044). LASr was significantly greater in patients without a history of AF than in patient with a history of AF (16 ± 16 and 10.5 ± 7.1, respectively; P = .012). LASr was able to discriminate between a history of paroxysmal AF and its absence with 72% specificity and 68% sensitivity with a cut-off value of 14% (AUC 0.72, 95% CI 0.62-0.82, P < .0001).
Conclusions:
Three-dimensional left atrial reservoir function can differentiate patients with paroxysmal AF from patients without a history of this arrhythmia.
Background
Atrial fibrillation (AF) is the most common arrhythmia with a lifetime risk of approximately 3 to 5 individuals after the age of 45 years. 1 In the last decade the prevalence of AF has almost doubled. Thus, early detection and new risk stratification is necessary to cope with this global health pandemic. Among the common risk factors for AF, hypertension is the most prevalent. 2 Left atrium (LA) size is a risk factor for further AF development in hypertensive patients. 3 Left atrial volume index (LAVI) predicts the risk of future recurrence of AF after both the electric cardioversion and catheter ablation.4,5 The next logical step in the study of atrial function are, besides the volumetric functions, left atrial strain (LAS) measurement. Speckle tracking echocardiography (STE) is a non-invasive imaging modality that tracks the motion of speckles (natural acoustic markers) in the myocardium, providing a quantitative assessment of myocardial deformation. STE was initially developed for left ventricle function, recently adopted to track all phases of LA function during the cardiac cycle. 6 Unlike traditional echocardiographic parameters, such as LA volume, which provide static measures of atrial size, strain analysis offers a dynamic view of atrial function. LA strain can be divided into 3 components, corresponding to the different phases of atrial function: (1) Reservoir strain: Reflects the deformation during ventricular systole, when the LA acts as a reservoir for pulmonary venous return (2) Conduit strain: Occurs during early diastole, when the LA passively transfers blood into the left ventricle (3) Contractile strain: Represents the active atrial contraction that contributes to ventricular filling in late diastole. 6
Even before the introduction of STE, patients with reduced LA reservoir function as measured by total LA emptying fraction (%) were more likely to develop AF or atrial flutter, regardless of atrial volume. 7 Hirose et al showed that reduced LA active ejection fraction (EF, ie, booster pump function) assessed by STE predicts new-onset AF. 8 Moreover, an inverse correlation was found between peak atrial longitudinal strain (PALS) and the grade of LA myocardial fibrosis in patients with severe mitral regurgitation referred for cardiac surgery. 9 In the present study, we aimed to associate three-dimensional (3D) LAS parameters with the presence/absence of paroxysmal atrial fibrillation (PAF) in patients in sinus rhythm during examination. The main study question was whether there is a reliable marker to discriminate patients with a history of PAF from those without a history of PAF.
Materials and Methods
Patients
For this study, we prospectively enrolled 116 consecutive patients between December 2021 and December 2022 who were scheduled for routine evaluation and undergoing echocardiographic examinations. All the echocardiographic examinations were performed by 2 experienced cardiologists (J.P., M.H.) in order to obtain only high-quality loops and images without foreshortenings and other errors in acquisition. All patient data were entered into the pre-specified database. Complete loops with adequate image quality for two-dimensional (2D) volume parameters and 3D LAS analysis were required. Patients with AF at the time of the image acquisition were excluded from the study. The study sample comprised patients with and without PAF as previously confirmed by 12-lead ECG or ECG Holter, AF duration must have been >30s. In general, the only exclusion criterion was atrial fibrillation at the time of loop acquisition and inadequate image quality for analysis. No other pre-selection criteria were used for enrolment. The enrolment was stopped after reaching balanced proportion of patients with and without atrial fibrillation. All the patients with PAF were treated for rhythm control with pharmacotherapy, electrical cardioversion or catheter ablation as appropriate. None of the patients underwent catheter ablation 3 weeks prior to the atrial loops being acquired, and no electrical cardioversion was scheduled 3 weeks prior to atrial loop acquisition to rule out atrial myocardium stunning. Almost all patients with heart failure in our cohort had reduced ejection fraction (HFrEF).
This study was approved (Nr.174/2021) by the institutional review board of University Hospital (IRB UHO) Ostrava and carried out in accordance with the Helsinki Declaration. The need for informed consent was waived for this study by IRB UHO since informed consent with future data management including publication is part of the standard institutional outpatient clinic protocol.
Echocardiography
Two-dimensional grayscale echocardiography was performed using a Vivid E95 scanner (GE Vingmed Ultrasound, Horten, Norway). The frame rate was >60/s for 2D analyses, and >40/s for 3D LAS analyses. Standard Doppler imaging, parasternal short- and long axis view, 2D and 3D loops from the apical 4-chamber (A4C) view were obtained from each patient and archived. At least 5 cardiac cycles in each plane were stored. The digitally stored images were retrieved offline and analysed using EchoPAC version 203 revision 73 (GE Vingmed Ultrasound, Horten, Norway). The LA endocardial inner border was traced at the end-ventricular systole, just before the mitral valve opening, avoiding both stationary speckles near the pericardium and the area under the valve annulus, LA appendage or pulmonary veins.
For 2D volume analysis apical 2-chamber (A2C) and A4C views were utilized. Two LA areas (A1, A2) and the length from the LA back wall to the line across the mitral valve hinge points (L) were measured from the A4C. To calculate the LA, the following formula was used: (8/3π) × (A1 × A2/L).
For 3D LAS analysis, we used the commercially available, automated LA quantification function (Auto LAQ) in EchoPAC software (Figure 1). Topographic markers were placed in the middle of the mitral valve. The endocardial border was automatically generated, with adjustments made whenever necessary in accordance with the actual shape of the left atrium. Left ventricular function (LV) was also assessed using a commercially available function (Auto LVQ) in EchoPAC software (Figure 1, video supplementum).

A, Apical 4-chamber, 2-chamber, and apical-long axis and short-axis view with the marker at the centre of the mitral valve for initial off-line automatic LAQ built-in 3D analysis of the EchoPAC software. B, – Same views as in (A) for review and automatic endocardial tracing throughout the built-in analysis. C, results of the LAQ analysis visualizing the left atrium 3D model and corresponding measurements in the right upper corner. The atrial cardiac cycle graph with corresponding volume tracing is in the right lower corner. D, Apical 4-chamber, 2-chamber, apical long-axis and short-axis view visualizing the left ventricular endocardial tracing and LV model for automatic built-in 3D AutoLVQ analysis of EchoPAC software.
Following LAS variables were studied: LA volume minimum (LA Vmin); LA volume maximum (LA Vmax); LA emptying volume (LA EV), LA emptying fraction (LA EF), LA longitudinal strain reservoir phase (LASr), LA longitudinal strain conduit phase (LAScd); LA longitudinal strain contraction phase (LASct); LA circumferential strain reservoir phase (LASr_c); LA circumferential strain conduit phase (LAScd_c); LA circumferential strain contraction phase (LASct_c. Left estimated LA pressure (LAP_est) was calculated according to the Nagueh et al formula: (LAP = 1.24 × (E/e’) + 1.96. 10
Statistical Analysis
Continuous variables were expressed as mean ± standard deviation and compared by T-test or Mann-Whitney U test as appropriate. Categorical variables were expressed as percentages, and compared using chi-squared test, Fisher’s exact test or logistic regression, as appropriate. We investigated the association of various LA parameters with the presence/absence of paroxysmal atrial fibrillation by uni-, multivariate and binary logistic regression analyses.
The Spearman test was used to obtain correlation matrices of LA parameters. Receiver operating curve (ROC) analysis was performed for selected 3D LAS parameters. To calculate the optimal cut-off value, the Youden index was utilized and visualized by the best threshold graph. A 2-tailed α < .05 was considered statistically significant, but for the test of equality of covariance matrices, for which P < .005 was considered significant. Most of the analyses were performed on the entire group of patients; however, subgroup analyses were performed for AF and heart failure. All analyses were carried out in IBM SPSS for MAC version 23 (IBM, New York, USA) and R studio posit cloud version 4.3.2 (Posit software, PBC, Boston, USA). The data visualization was done exclusively in R studio 4.3.2 (Posit software, PBC, Boston, USA).
Reproducibility Analysis
The intra- and inter-observer variability of 2D and 3D volume and LAS measurements were tested in all subjects. Intra-observer variability was tested by repeated measurements ⩾4 weeks apart with blinding to the original dataset. To test inter-observer variability, second experienced operator evaluated the loops with no access to the original dataset. Intra- and interobserver variability were presented as the mean percentage error and was calculated as an absolute difference between the 2 measurements.
Results
A total of 116 patients (50% females) aged 76.9 ± 11.2 years were included in the analysis. Males and females differed in anthropometric measures and several clinical and paraclinical parameters, as well as treatment options (Table 1). According to the visual inspection of the histograms, normal Q-Q plots and Shapiro-Wilk’s test (>0.05) the data were approximately normally distributed, with the exception for LV diastolic diameter and estimated LA pressure. There were almost no outliers in the data and the few not due to data entry or other error had no impact on the assumptions made in the analysis or results; thus, they remained in the analysis. Intra- and interobserver variability were 1.12% and 1.85%, respectively and the differences were not significant. Only 7% of patients underwent catheter ablation for atrial fibrillation and 11% direct-current cardioversion.
Baseline characteristics of the study population.
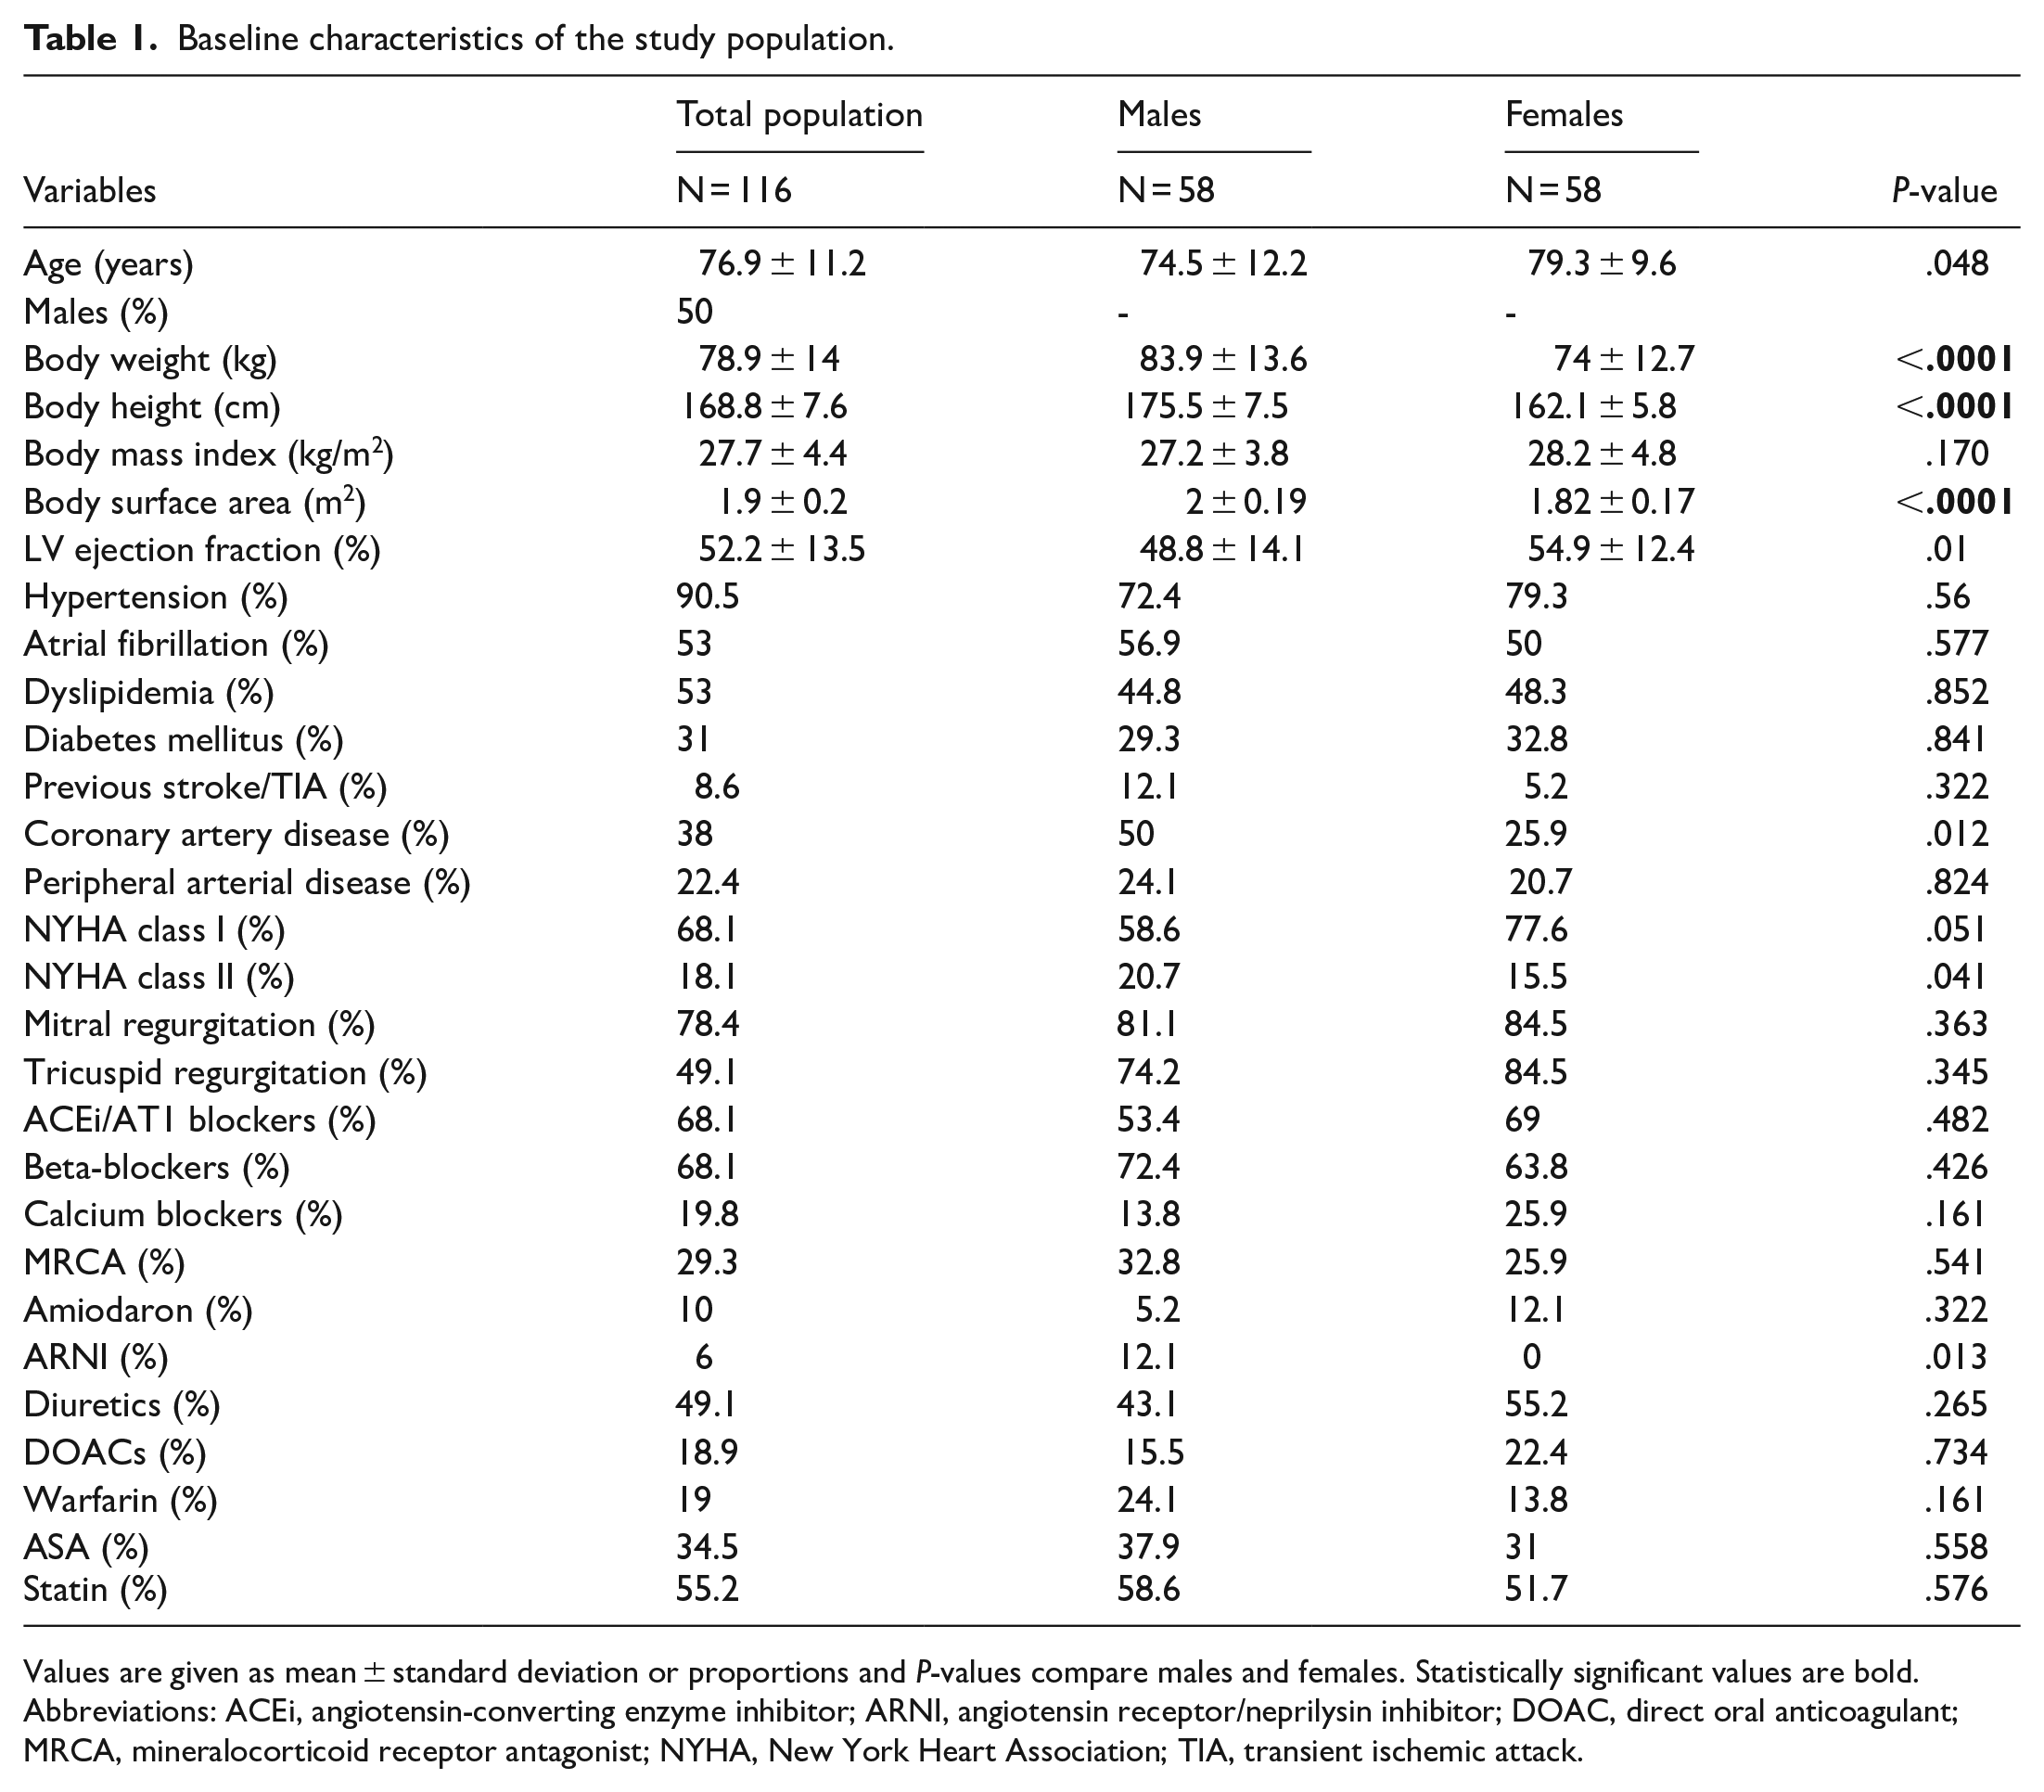
Values are given as mean ± standard deviation or proportions and P-values compare males and females. Statistically significant values are bold.
Abbreviations: ACEi, angiotensin-converting enzyme inhibitor; ARNI, angiotensin receptor/neprilysin inhibitor; DOAC, direct oral anticoagulant; MRCA, mineralocorticoid receptor antagonist; NYHA, New York Heart Association; TIA, transient ischemic attack.
The patient population with and without PAF differed in several LA parameters (Table 2), age, several anthropometric parameters, diabetes mellitus and tricuspid regurgitation (Table 3). To determine the best predictor of the presence of paroxysmal atrial fibrillation, univariate and multivariate analyses of variance were performed. These, however, identified several left atrial parameters as significant predictors of PAF (Table 4). Also another multivariate analysis including LASr, valvular diseases, age, sex, diabetes mellitus, weight, BMI, coronary artery disease and hypertension rendered several predictors of the PAF presence (LASr, P < .001). Consequently, the binary logistic regression model revealed 2 independent predictors of PAF (LA volume, LAVI and age were in the regression model); namely left atrial strain reservoir and conduit phase, LASr and LAScd (P = .042 and P = .044, respectively). The 2D left atrium volume and LAVI strongly correlated with the 3D measure (r = .81 and r = .76, P < .0001, Table 5). LAScd did not significantly differ in patients with or without PAF and failed to discriminate between them in ROC analysis (AUC 0.49, P = .896, 95% CI 0.38-0.6). Also, LAVI had very low capacity to differentiate between a history of PAF and no history of PAF (AUC 0.33, 95% CI 0.2-0.4, P = .02, Figure 2). In contrast, LASr was significantly greater in patients without a history of PAF than in patients with a history of PAF, (16 ± 16% and 10.5 ± 7.1%, respectively, P = .012, Figure 3). Moreover, LASr was able to discriminate a history of PAF from its absence with 72% specificity and 68% sensitivity, with a cut-off value of 14% as best threshold (AUC 0.72, 95% CI 0.62-0.82, P < .0001, Figures 1 and 4).
Comparison of left atrial and selected ventricular parameters according to the presence and absence of atrial fibrillation and heart failure.
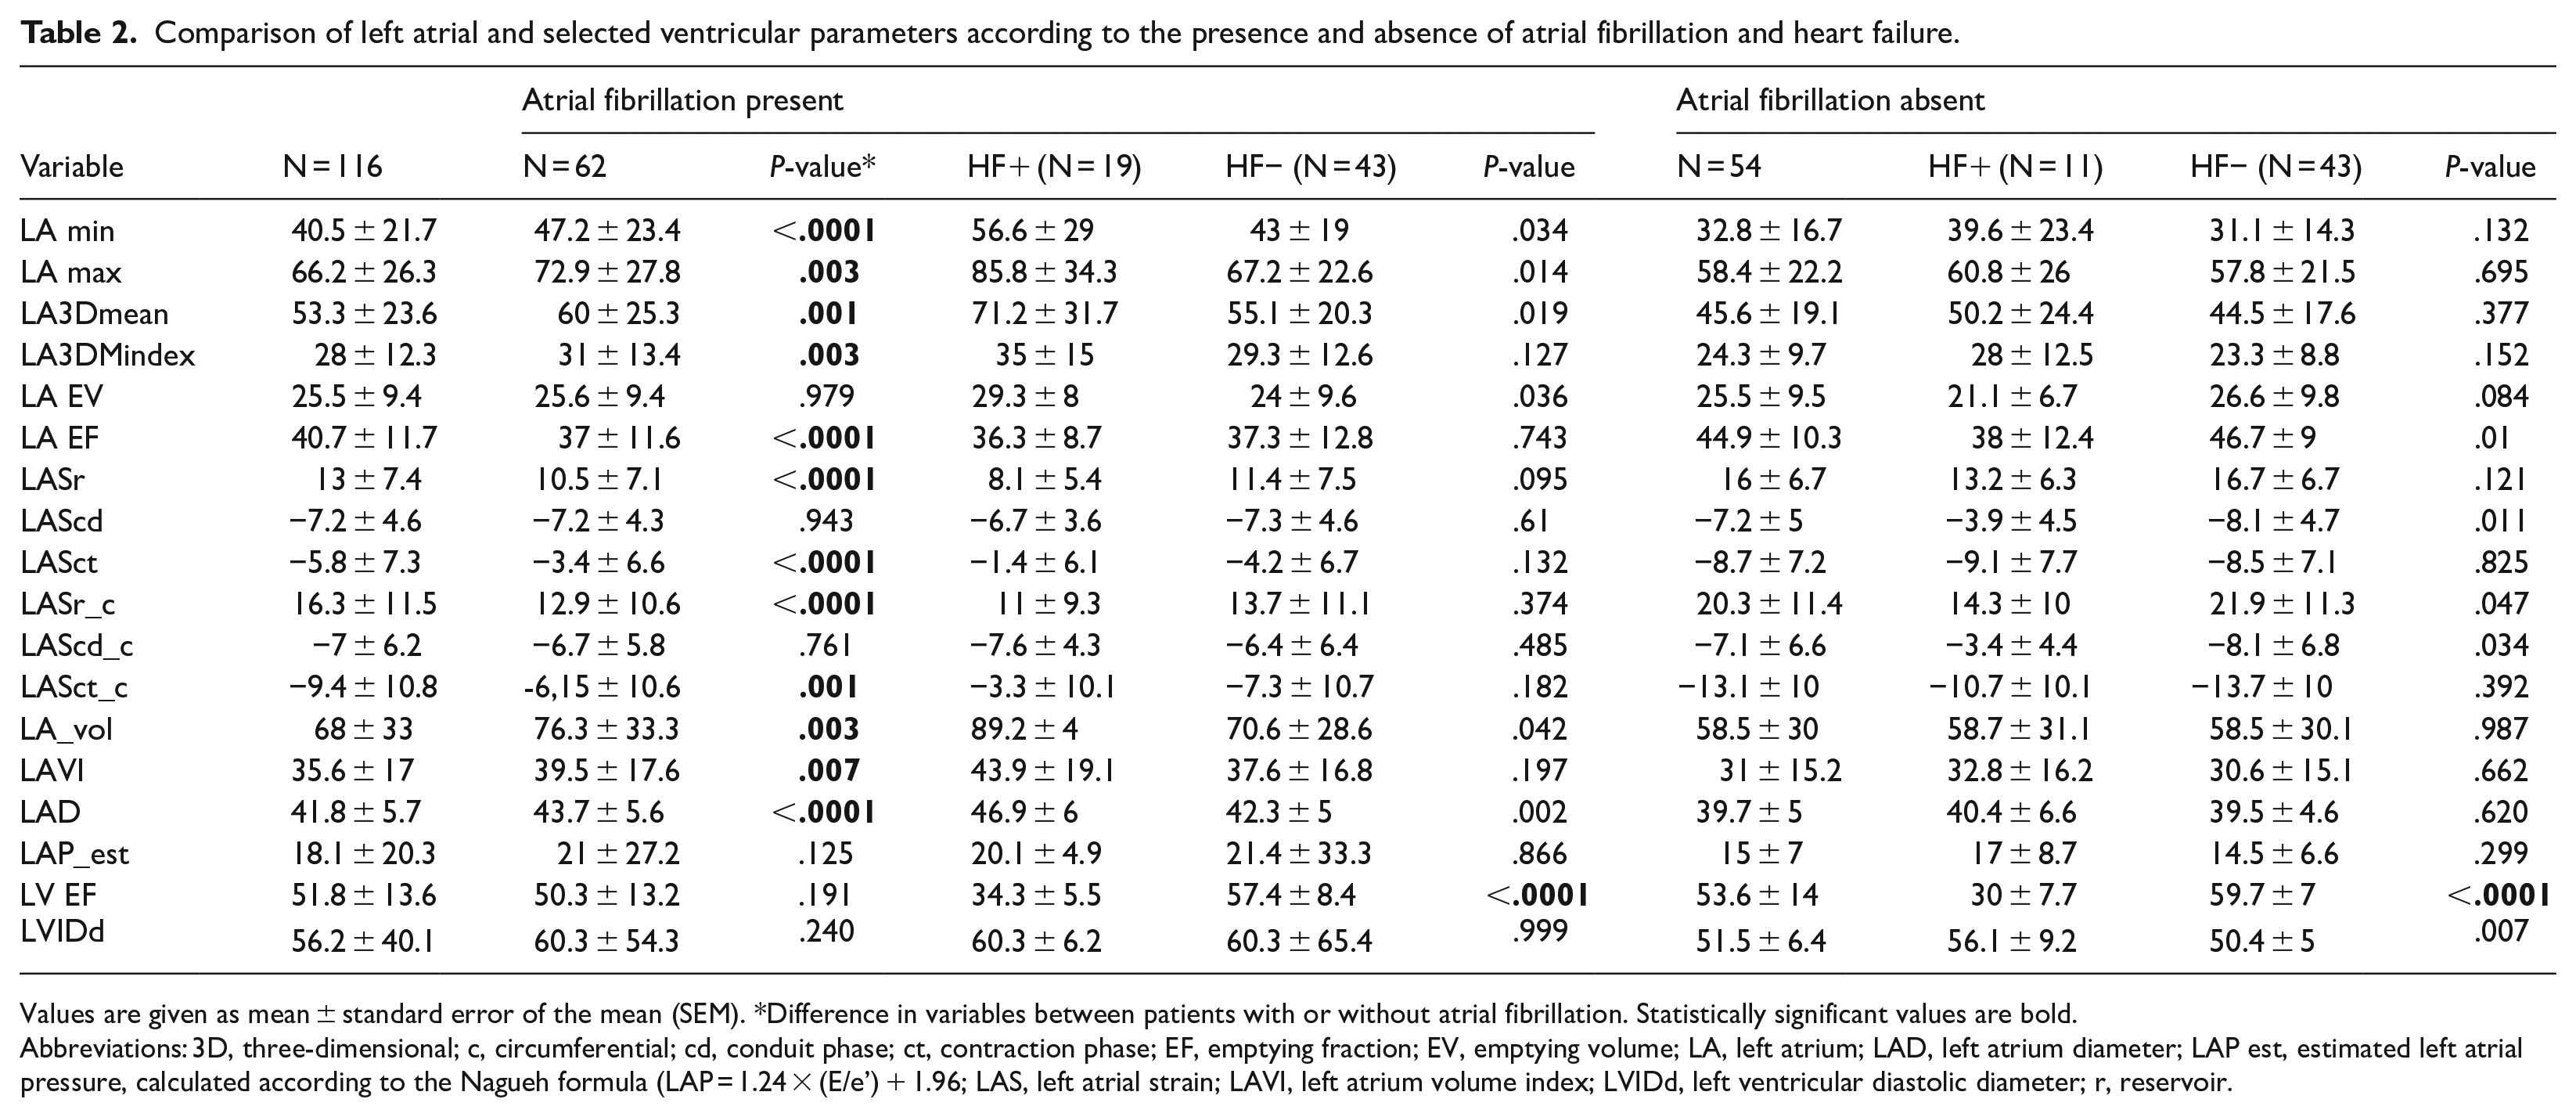
Values are given as mean ± standard error of the mean (SEM). *Difference in variables between patients with or without atrial fibrillation. Statistically significant values are bold.
Abbreviations: 3D, three-dimensional; c, circumferential; cd, conduit phase; ct, contraction phase; EF, emptying fraction; EV, emptying volume; LA, left atrium; LAD, left atrium diameter; LAP est, estimated left atrial pressure, calculated according to the Nagueh formula (LAP = 1.24 × (E/e’) + 1.96; LAS, left atrial strain; LAVI, left atrium volume index; LVIDd, left ventricular diastolic diameter; r, reservoir.
Detailed comparison of baseline characteristics between patients with and without history of AF.
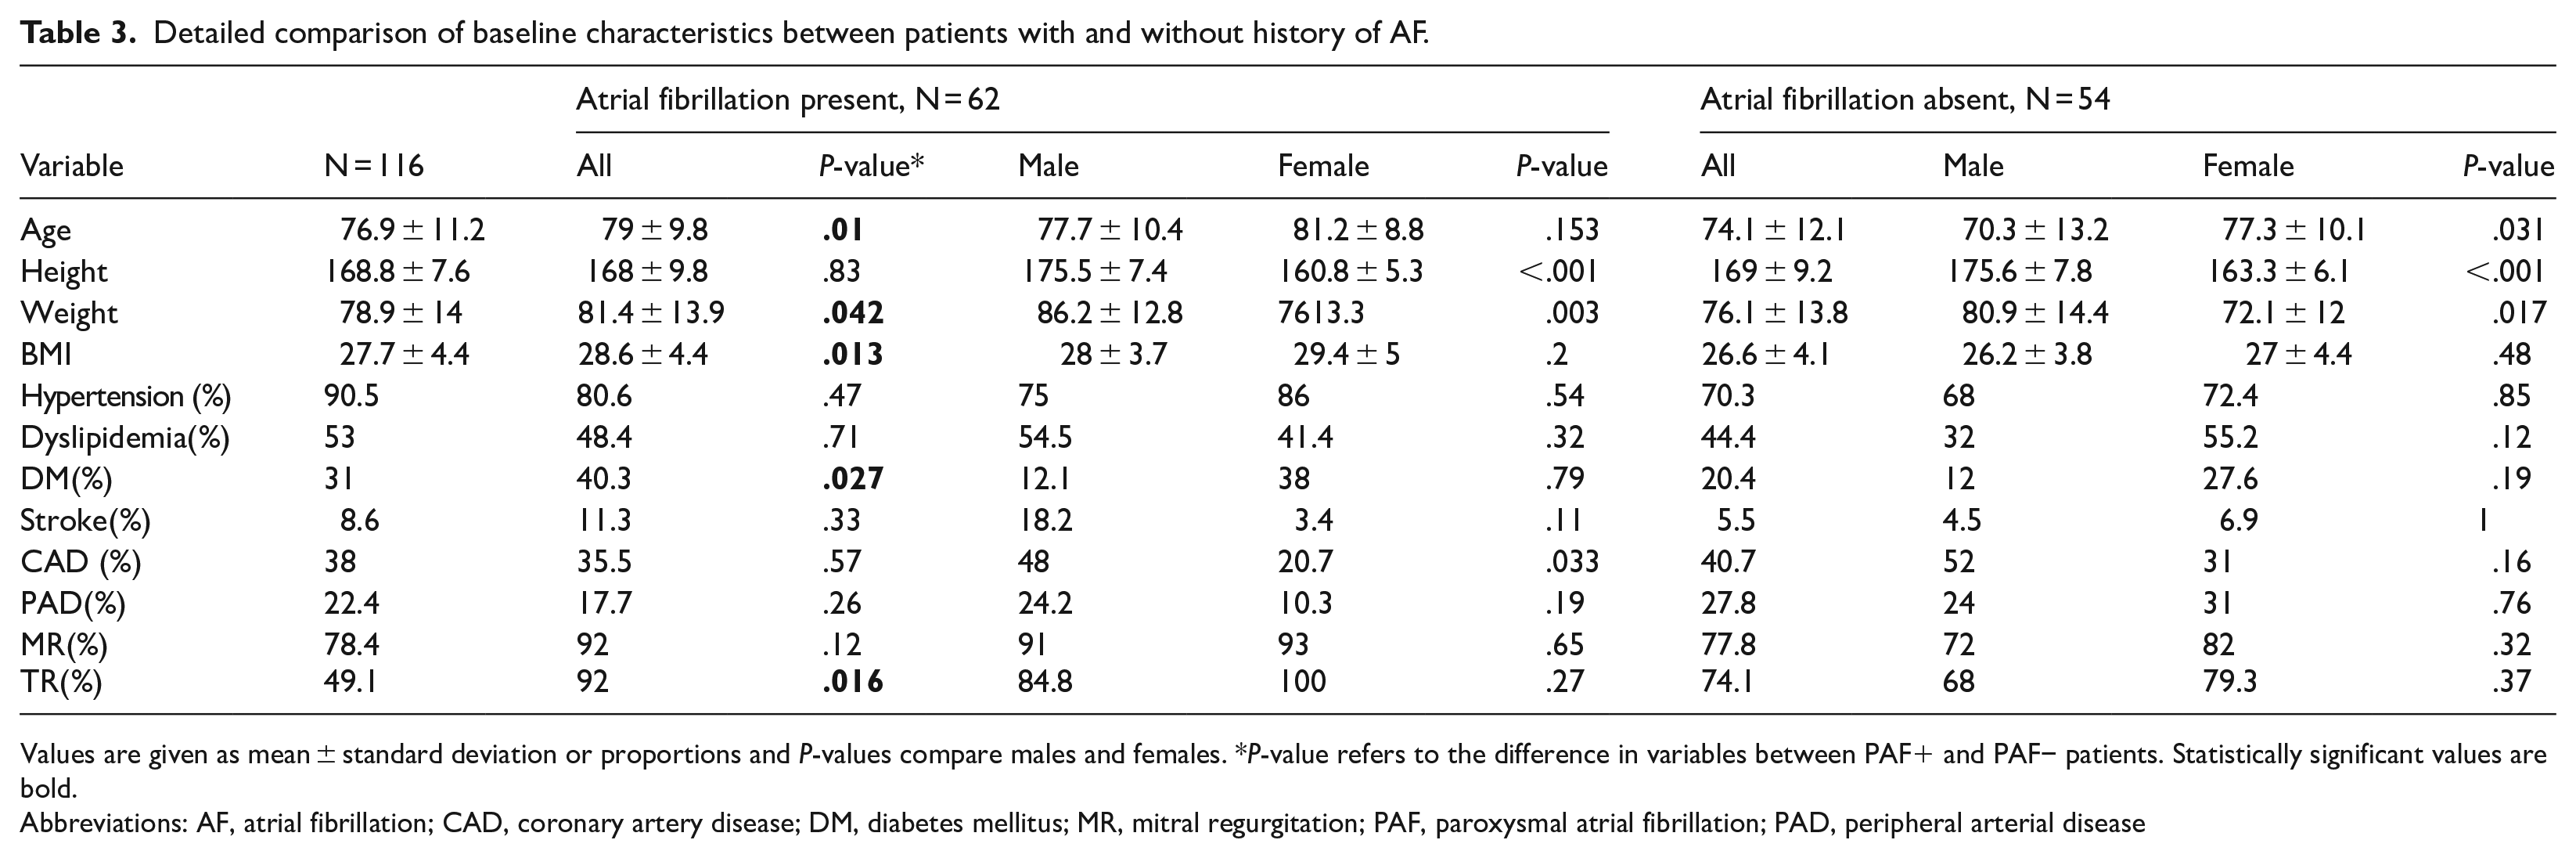
Values are given as mean ± standard deviation or proportions and P-values compare males and females. *P-value refers to the difference in variables between PAF+ and PAF− patients. Statistically significant values are bold.
Abbreviations: AF, atrial fibrillation; CAD, coronary artery disease; DM, diabetes mellitus; MR, mitral regurgitation; PAF, paroxysmal atrial fibrillation; PAD, peripheral arterial disease
Predictors of atrial fibrillation assessed by univariate and multivariate analysis of variance and binary logistic regression analysis.

Values are given as mean squares or odds ratios (ORs) with 95% confidence intervals (CIs). Statistically significant values are bold.
Abbreviations: 3D, three-dimensional; c, circumferential; cd, conduit phase; ct, contraction phase; EV, emptying volume; EF, emptying fraction; LA, left atrium; LAD, left atrial diameter (from parasternal long-axis view); LAS, left atrial strain; LVIDd, left ventricular diastolic diameter; r, reservoir.
Scaled correlation matrix for left atrial and ventricular parameters.
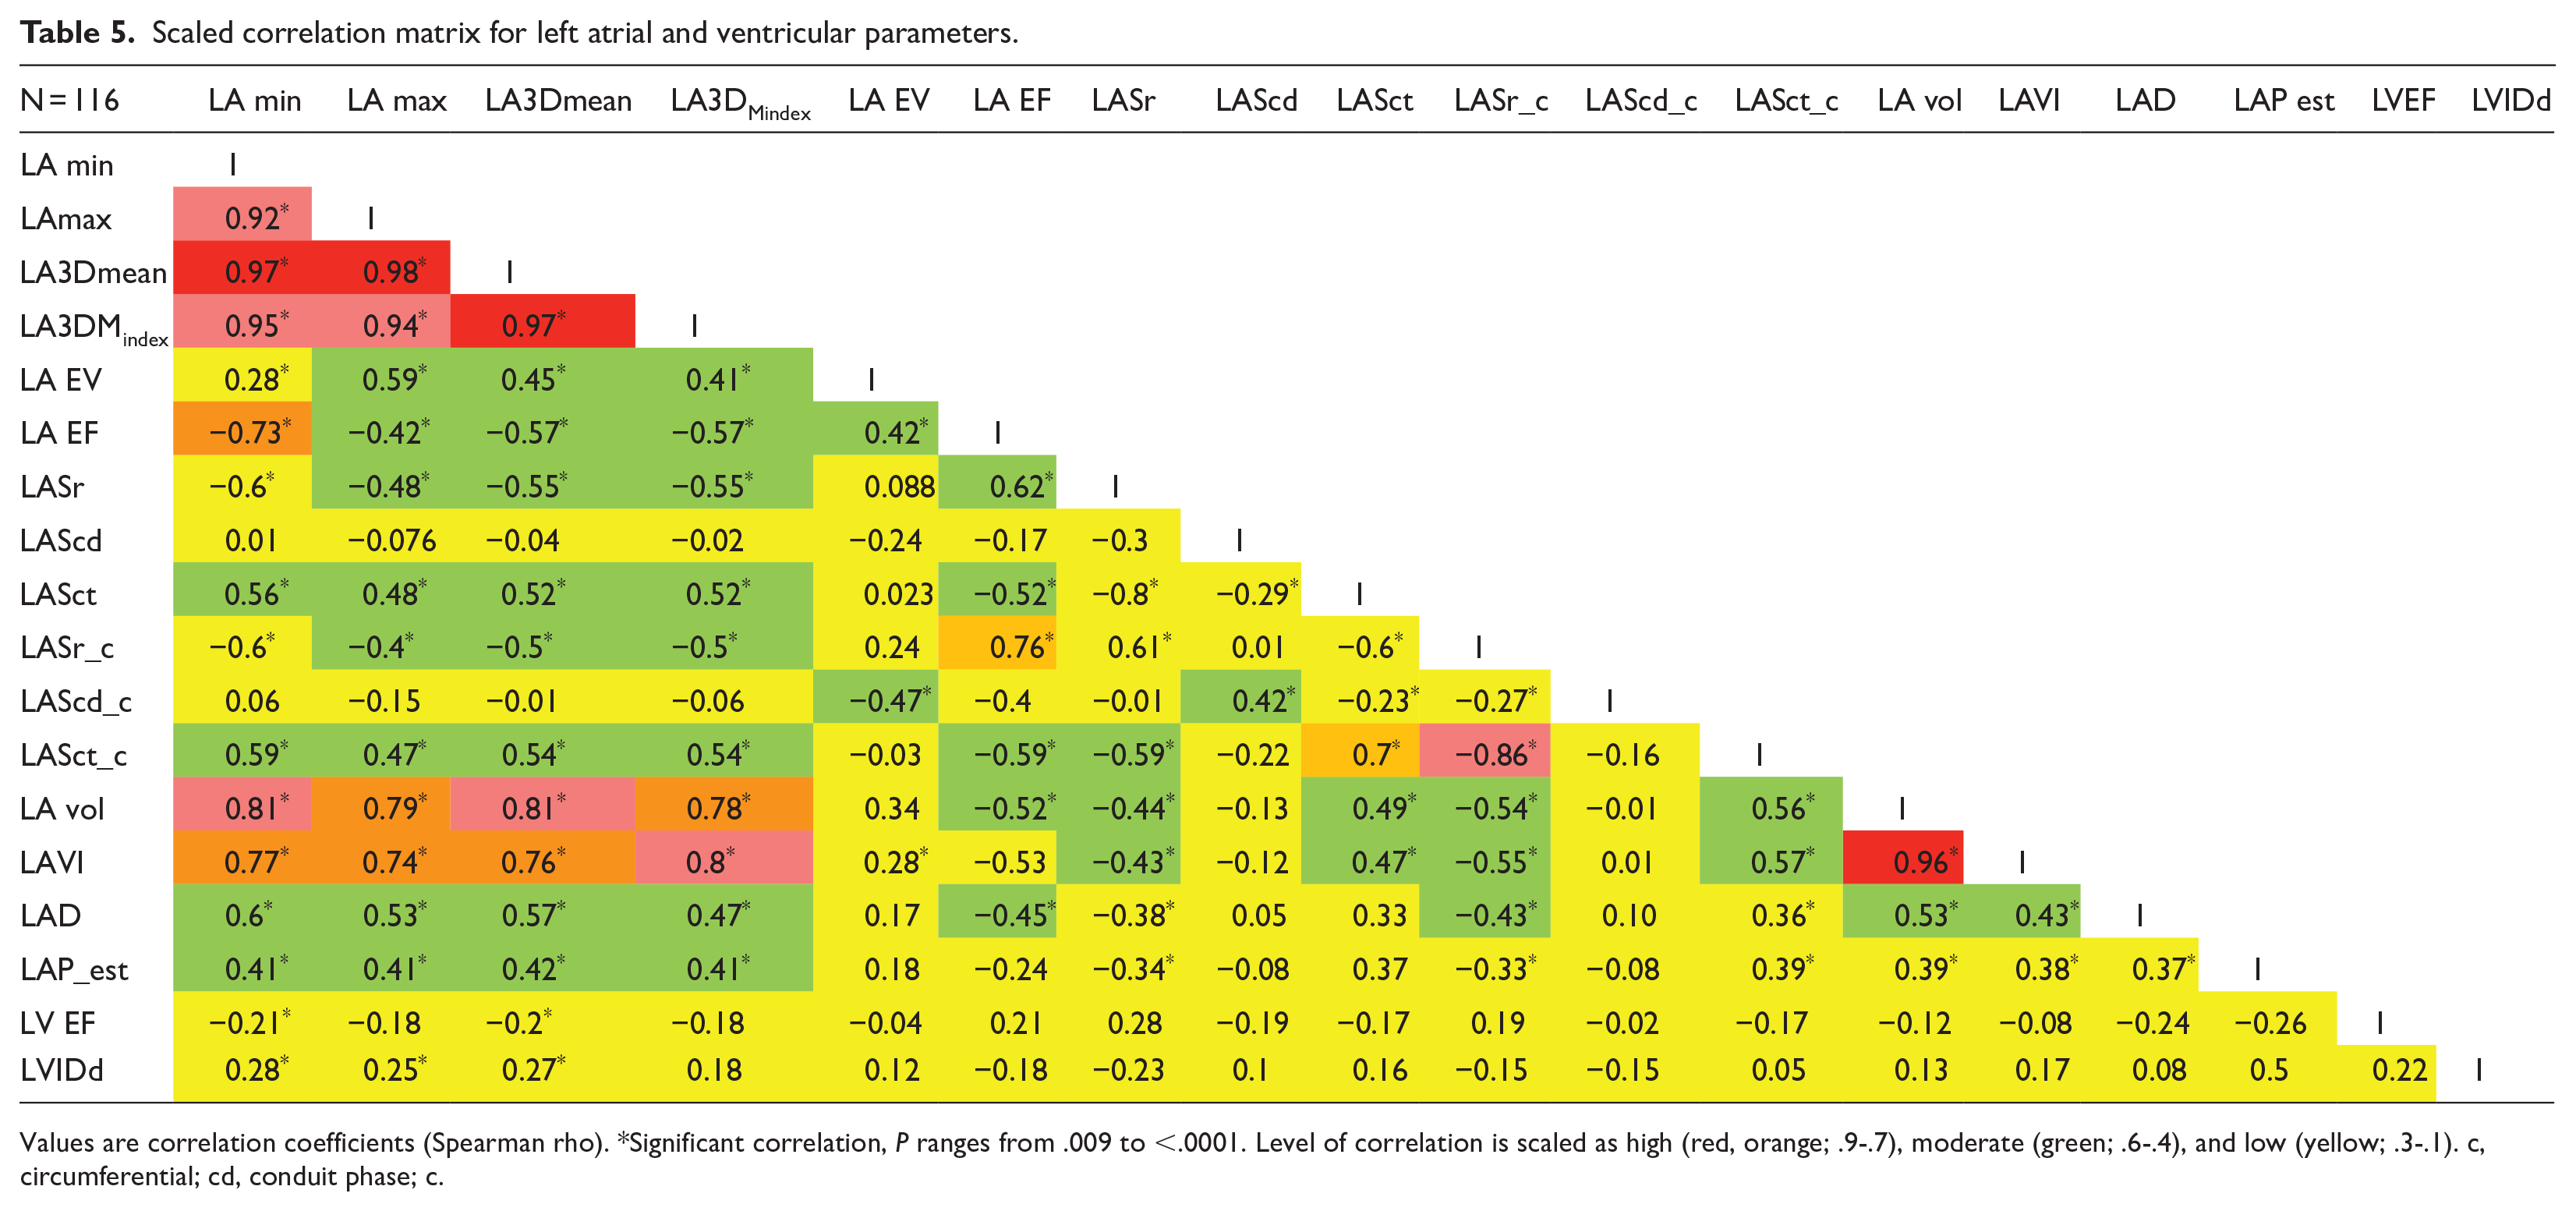
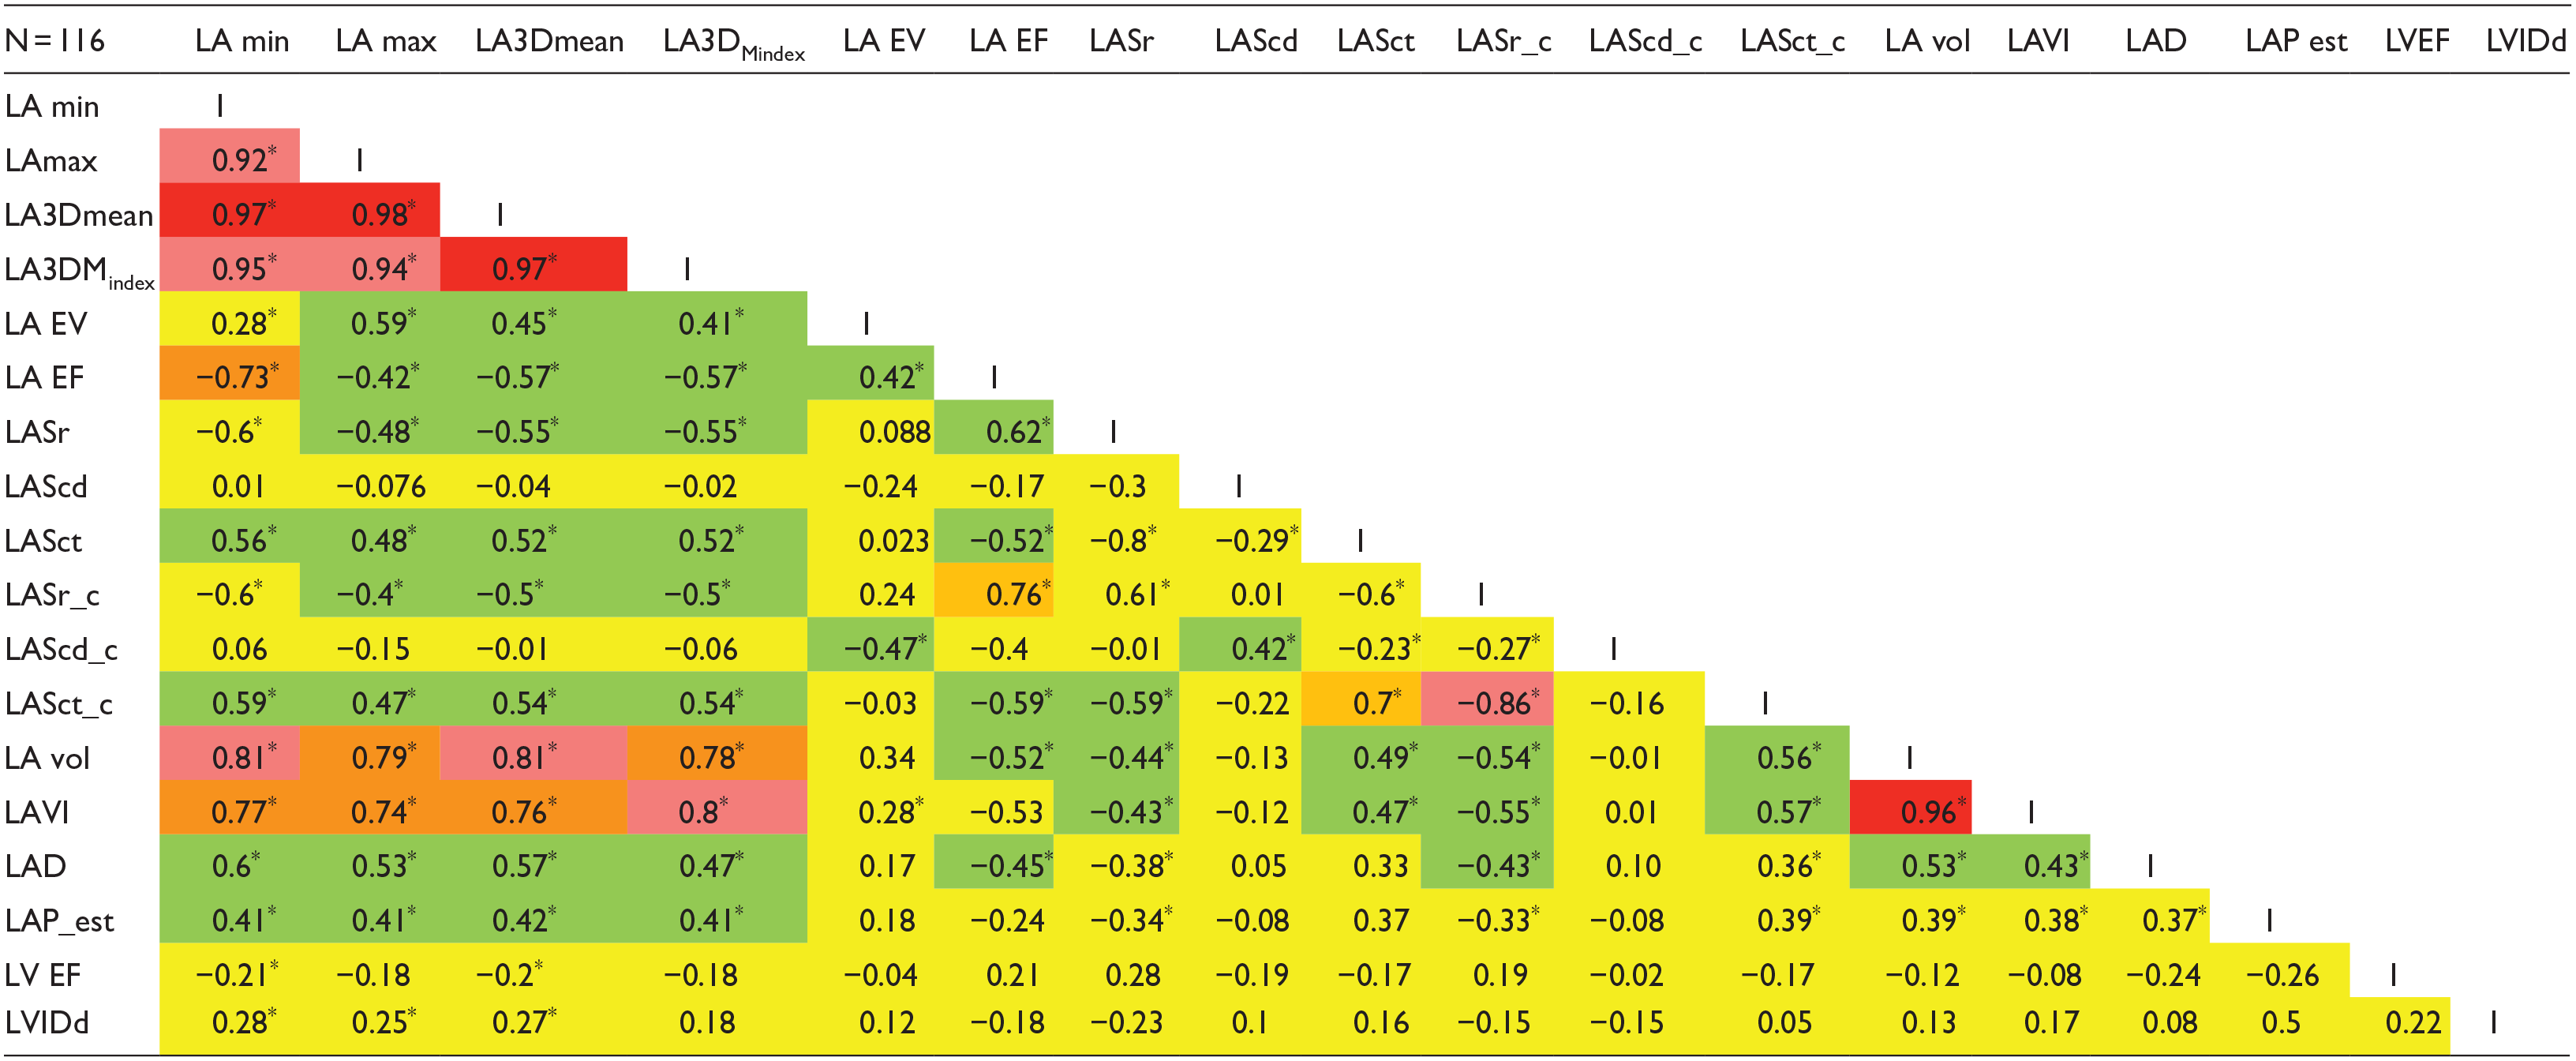
Values are correlation coefficients (Spearman rho). *Significant correlation, P ranges from .009 to <.0001. Level of correlation is scaled as high (red, orange; .9-.7), moderate (green; .6-.4), and low (yellow; .3-.1). c, circumferential; cd, conduit phase; c.
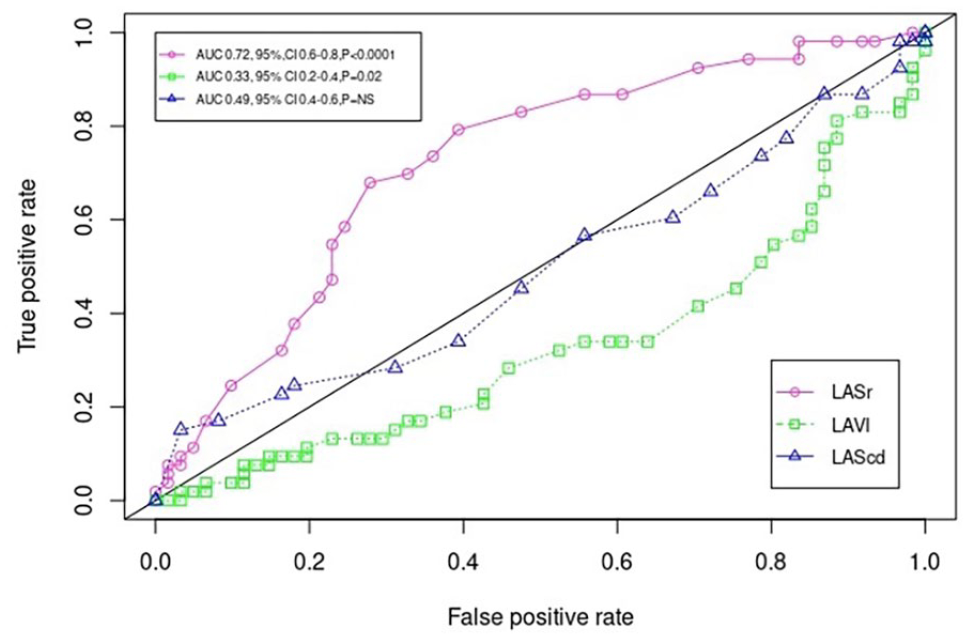
Receiver operating curves (ROC), for left atrial strain reservoir phase (LASr, AUC 0.72, 95% CI 0.62-0.82, P < .0001); for left atrial volume index (LAVI, AUC 0.33, 95% CI 0.2-0.4, P = .02) and for left atrial strain conduit phase (LAScd, AUC 0.49, 95% CI 0.4-0.6,P = NS) discriminating between the presence/absence of paroxysmal atrial fibrillation. X axis: average false positive rate (1-specificity), y-axis: true positive rate (sensitivity).
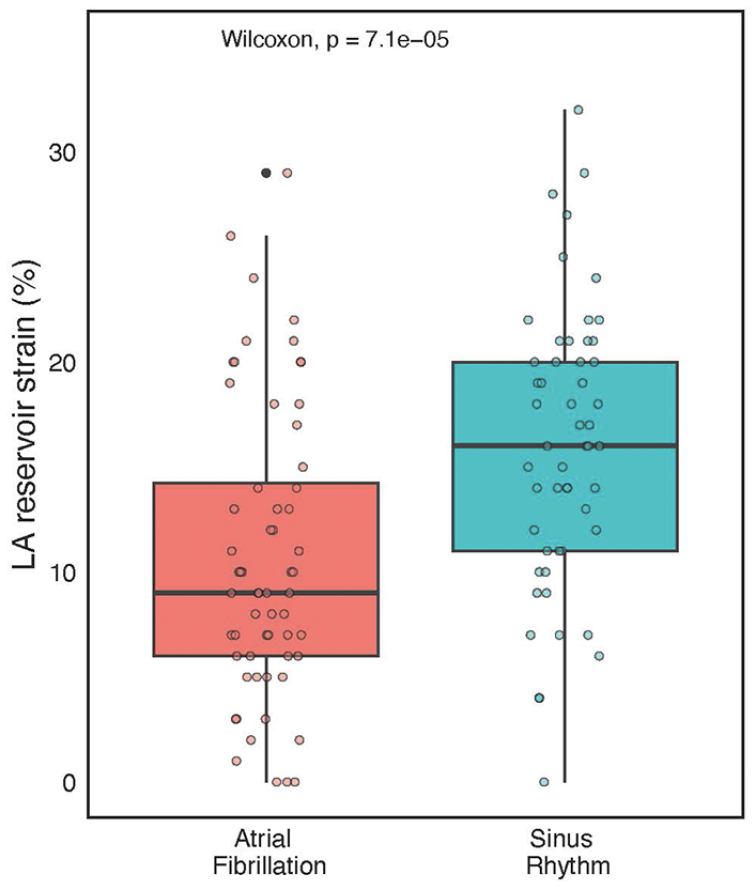
Box-plot with whiskers indicating differences in LA reservoir strain (LASr) in patients with or without a history of PAF. LASr values are given as %. The coloured dot scatter represents individual LASr measurements to display the data aggregation characteristics.

Best threshold values of LA reservoir strain to discriminate between the paroxysmal atrial fibrillation and sinus rhythm.
The probability of not having PAF is increased linearly with an increasing value of LASr (Figure 5). Furthermore, LASr values inversely correlated very poorly with LAVI (r = −.4, Figure 6); thus, the LA reservoir capacity seems not to be dependent on LA volume.

Logistic regression-based probability estimation of sinus rhythm (SR, y-axis) in relation to LASr values (x-axis). The lower the LASr value, the greater probability of having atrial fibrillation. The model is controlled for LAVI and LAScd. Median values were used to construct the plot: LAScd, −7%; LAVI 31.5 ml. The bottom rug displays negative partial residuals, the top rug displays positive partial residuals.

Linear regression of the association of LASr and LAVI. The regression line (dark pink) is shown with confidence bands (grey) and individual measurements (black dots); R = for Pearson correlation. Regression equation: y = 19-0.16x.
However, LASr did not differ in the presence/absence of PAF and in the related heart failure (HF) subgroup analysis (Table 2). In patients with a history of PAF, the volumetric and LA size parameters differed significantly between the populations with (HF+) and without (HF−) heart failure. In contrast, in patients without a history of AF, the HF+ and HF− populations differed significantly in both circumferential strain parameters and emptying fraction (LASr_c, LAScd_c, LA EF), with higher values in the HF- group (Table 2). The estimated LAP according to the Nagueh et al formula 10 was elevated in all our patients, the difference across the groups was not significant (Table 2).
Discussion
This study identified several LA parameters associated with PAF. The LASr was found to be an independent predictor of PAF, regardless of LA volume and age, as LASr is reduced in patients with PAF. Furthermore, LASr discriminated patients with a history of PAF from those without a history of PAF with 72% specificity and 68% sensitivity using a cut-off value of 14%.
Mechanisms Linking Left Atrial Strain and AF Risk
Several mechanisms have been proposed to explain the relationship between reduced LAS and and increased risk of AF, namely electrical and electromechanical remodelling, atrial fibrosis, atrial enlargement and elevated left ventricular filling pressure.
Electrical and Electromechanical Remodelling
Atrial remodelling refers to changes in atrial electrophysiologic properties which contribute to AF initiation and maintenance. These changes occur rapidly after the onset of AF and are characterized by alterations in ion channel functions, refractory period shortening and conduction abnormalities. 11 AF leads to downregulation of L-type calcium channels and upregulation of inward rectifier potassium channels, reducing action potential duration and thus decreasing refractory period. Especially shortening of the refractory period facilitates reentry circuits leading to AF persistence. 11 AF also induces electrical intercellular uncoupling due to changes in connexin-40 and 43 expression both in atrial myocardium and thoracic veins. 12 Reduced gap junctions conduction leads to anisotropic conduction promoting re-entrant circuits. Rapid and irregular ventricular rate intermittently reduces blood pressure, what increases sympathetic nerve activity. 13 Increases sympathetic activity increases triggered activity and cell calcium overload, which facilitates SERCA and ryanodine receptor activity disruptions. 13 Originally functional substrate evolves through changes in cell signalling and calcium overload into permanent structural changes. 14 LASr reduction is correlated with alterations in ion channel function and conduction velocity, leading to heterogenous atrial activation, local anisotropy and increased susceptibility to AF. 15 This may also explain, why LASr in our study was predictive of PAF even though the recording of the atrial loops was conducted in sinus rhythm.
Atrial Fibrosis
One key factor is atrial fibrosis, which is commonly seen in patients with AF and is associated with both structural and electrical remodelling of the atria. 16 Fibrosis leads to impaired atrial compliance and contractility, reducing LAS and creating a substrate for AF by disrupting normal atrial conduction. 16 During AF, the atrial contraction is lost, with more extensive remodelling the longer AF continues. 16 The substrate for structurally-determined AF is probably present long before the onset of AF, and atrial fibrosis has also been reported to be an independent risk factor for AF recurrence. 17 Notably, the degree of structural remodelling detected by magnetic resonance imaging is independent of AF type and associated comorbidities. 18 Extensive fibrosis and other preceding factors, such as genetics and inflammation, lead to atrial cardiomyopathy, which is interconnected with thromboembolism and AF. 19 Atrial cardiomyopathy mechanically affects the contractile and reservoir function of the left atrium, which may be captured by imaging modalities well before the onset of AF. 16
Atrial Enlargement
Another important mechanism is atrial enlargement, which is often a response to chronic pressure or volume overload. LA enlargement is linked to reduced LAS, as the stretched atrial myocardium becomes less capable of generating effective contraction. Both fibrosis and LA enlargement can contribute to abnormal electrical signalling, increasing the likelihood of AF initiation and maintenance. 16 In the Mendelian randomization study on more than 4 thousand individuals left atrial volume was strongly associated with 84 genetic variants associated with AF. 20 Is is not clear, whether left atrial enlargement is the cause or consequence of atrial fibrillation.
Even though LAVI was shown to predict the recurrence of AF both after cardioversion and catheter ablation in numerous trials,4,5 in our study, LAVI failed to identify patients with PAF. To begin with, the mean LAVI of 35.6 ± 17 ml/m2 is relatively small in the AF population, and the need for a catheter ablation and/or direct-current cardioversion was also relatively low in our patient population (7 and 11%, respectively). In a study by Kranert et al, the cut-off LAVI value for increased risk of AF recurrence was 36 ml/m2, and the recurrence group mean LAVI was 49 ± 18.6 ml/m2. 21 In a different study on patients with PAF, moderately enlarged LAVI (42-48 ml/m2) was a risk factor for atrial fibrillation recurrence. 22 The differences between the prediction capacity of LAVI in the literature and in our study may be in part explained by several factors, namely: smaller LAVI, different patient population (paroxysmal vs persistent AF)/outcomes (new onset/recurrence), lower need for catheter ablation or electrical cardioversion and “selection bias” since only patients in sinus rhythm during the examination could have been included.
Elevated Left Ventricular Filling Pressures
Reduced LAS may also reflect elevated left ventricular filling pressures, which can impose additional strain on the LA. In patients with conditions such as heart failure or diastolic dysfunction, elevated left ventricular pressures lead to increased LA pressure, impairing atrial function and reducing strain values. These haemodynamic changes promote atrial remodelling and increase AF susceptibility.
AF is frequently associated with LV systolic dysfunction, and the causality is bidirectional. 16 LV diastolic dysfunction is also an independent predictor of AF in the elderly . 23 Less known is the magnitude, as 25% to 35% of patients with new onset diastolic heart failure, heart failure with preserved ejection fraction (HFpEF), suffer from AF. 24 Consequently, up to 70% of the HFpEF population has a history of AF. 25
LAP and left ventricular end-diastolic pressure (LVEDP) are often used interchangeably and in stable patients without severe mitral valve disease may also be similar. 26 LVEDP is increased in hypertensive patients, but it depends heavily on the left ventricular mass. 27 Abnormal LV filling patterns were confirmed by different echocardiographic methods in hypertensive patients with LV hypertrophy. 28
Notably, hypertension leads to LA dilatation and increase in LA reservoir and pump function in contrast to PAF. 29
Estimated LAP was in our study elevated across all groups very probably due to the high prevalence of hypertension and coronary artery disease.
Clinical Implications of Left Atrial Strain in Atrial Fibrillation Management
The incorporation of LAS into clinical practice has significant potential implications for AF risk stratification and management. By providing a sensitive and dynamic measure of atrial function, LAS could be useful to guide therapeutic decisions, identify at-risk individuals, monitor disease progression and evaluate treatment response.
Assessment of atrial function with conventional methods has some limitations. Among others, Doppler transmitral flow velocity is load dependent; therefore, size and volumetric LA functions may not accurately reflect the function of the left atrium. 30 Before STE, there were attempts to assess the LA function by subtracting the minimal LA volume from the maximal LA volume, and dividing by maximal volume × 100, thus obtaining the total emptying fraction as a percentage. 7 Decreased LA EF (ie, LA reservoir function) markedly increased the propensity for first AF independently from LA volume, LV EF or clinical risk factors. 7 Other results in patients following direct-current cardioversion indicate that increased LA EF measured during AF is a significant predictor of sinus rhythm maintenance after 12 months. 31 STE seems to be an even more promising method for the purpose of functional evaluation of the LA. Functional abnormalities of the LA measured by STE may have a discriminative and stratification capacity in patients with AF. LA EF (ie, booster pump function) assessed by STE was an independent predictor of new-onset AF, suggesting a stronger association between LA functional remodelling than merely LA volume or size. 8
Interestingly, patients with low 2D reservoir strain (<33%) had a significantly higher risk of subclinical atrial fibrillation (SCAF) compared with those with high reservoir strain (incidence rate, 14.5 vs 9.8 events/100 person-years) as showed in the subanalysis of the LOOP trial. 32 Notably, patients after catheter ablation for persistent atrial fibrillation with AF recurrence have had lower 2D LASr (16.7 ± 5.7%) as compared to patients without recurrency (22.6 ± 8.5%, P = .001). 33 In the AFACT study enrolling patients after thoracoscopic surgical ablation, the AF recurrency group also displayed lower 2D LASr (13% vs 16.6%, P < .001). 34
Finally, in a very specific population of patients with light-chain-type cardiac amyloidosis (ALCA), LASr was able to discriminate patients with new-onset AF (NOAF). 35 Furthermore, LASr ⩽ 14.4% had a significantly higher risk of NOAF than those with LASr > 14.4% (18.1% vs 5.1%, P < .01). 35
Our own results confirmed that also 3D LA reservoir strain can discriminate patients with presumably impaired LA function due to PAF as compared to patients without a history of PAF but comparable cardiovascular diseases. Furthermore, quantitatively, our cut-off for a greater risk of AF was very similar to both the ALCA and the AFACT trial population. However, any comparison between 2D and 3D strain should be done with great caution as well as comparing different vendors used for recording and analyses of the echocardiographic loops.
Another trial examined LA stress, rest volume and strain parameter difference in patients with coronary artery disease characterized into 3 groups: sinus rhythm, PAF, and permanent AF. 36 LASr progressively decreased from the first to third group both at rest and during stress. 36
Speckle tracking of the LA reservoir can also be used as a prognostic surrogate for elevated LV filling pressure in a similar fashion as NT-proBNP. 37 In the HaFaC trial, LASr strongly inversely correlated with NT-proBNP, and with comparable specificity (83% vs 84%) and lower sensitivity (70% vs 61%), predicted the composite outcome of all-cause mortality and hospitalization. 37 Moreover, LA reservoir function and LA pump strain were able to determine the LV filling pressure with 75% and 72% accuracy, respectively. 38 The association of both strains with LV filling pressure was strongest in patients with a reduced LV EF. 38
In addition, patients with HFpEF have decreased LASr, a value <25.2% showed a moderate correlation with the Heart Failure Association – Preserved Ejection Fraction (HFA-PEFF) score. 39 Surprisingly, LASr was also a relatively more important variable for estimating a high HFA-PEFF score than the major components of the score TR-Vmax, septal E/e’, septal e’, LV mass index, and relative wall thickness. 39
Notably, LASr has become a major constituent of the LATE score estimating LV filling pressure based on echocardiographic parameters; LASr < 15% corresponds with increased LV filling pressure. 40
In our subgroup analysis regarding heart failure, only 3D circumferential strain-reservoir phase and emptying fraction were higher in patients without an absence of both heart failure and PAF. However, this was only a subgroup analysis of considerably fewer patients with heart failure because heart failure analyses were not the primary focus of the study. Even though, in our study, only circumferential reservoir function differed compared to previous heart failure studies (longitudinal LASr), the values were higher in the absence of PAF and/or heart failure. In other words, all the results are coherent with the main idea that decreased reservoir function is a measure of LA remodelling and a marker of cardiovascular disease.
Moreover, functional, and anatomic responses of the LA may differ significantly according to the stimuli. Increased LV filling pressure leads to increase in the LA volume, which rarely normalizes after the decrease in the LV filling pressure. 41 On the contrary, in AF, LA undergoes specific structural changes which manifests as thicker adipose tissue volume, lower attenuation levels on computed tomography, and decreased atrial voltage on cardiac mapping. 42
Notably, our study and the study performed on the ALCA population 35 and the AFACT study 34 reported similar LASr cut-off for the risk of AF, despite the studies differed in outcomes. The present study used history of PAF as a factor, the ALCA study NOAF and the AFACT study AF recurrence. Moreover, in our study a 3D acquisition was used, which may not be easily compared to 2D strain utilized in all other studies.
Recently, a large prospective cohort study confirmed that decreased LASr and LASct predicts atrial fibrillation in the general population. 43 Notably, decreased LASr (<33%) also predicts subclinical atrial fibrillation detected by long-term continuous monitoring in elderly high-risk individuals. 32
LASr seems to be a coherent marker of structural remodelling of the left atrium in AF. Evaluation of the 3D LA function strain is highly reproducible, probably due to reliable semi-automatized functions, as shown in our study.
In a trial specifically dedicated to 2D LA strain reproducibility, the vendor-specific inter- and intra-observer variability was 2.35% and 2.67% and the differences were significant. 44 The vendor-independent inter- and intra-observer variability were 1.39% and 3.87%, respectively. 44 Higher both intra- and interobserver variability of 2D versus 3D strain may be explained, in part, by more laborious analysis, including more echocardiographic planes. More planes/views result in mathematically more variables in the “equation” and, therefore, higher probability of differences, especially due to different acquisition angles. Furthermore, the final LASr in 2D is only extrapolation from two 2D planes as compared to direct 3D strain. According to our experience, 3D measurements are also faster than 2D strain, or even LAVI measurements. In the scenario of 2D versus 3D LA strain analysis, the speed of acquisition was not tested, but in LV myocardial strain assessment, the 3D strain data were acquired faster than the 2D data. 45
Finally, LA reservoir function was decreased regardless of which method is used, 2D/3D speckle tracking or emptying function, and according to our trial also independently from LA volume and patient age. Therefore, LASr seems to be a solid, reproducible, and promising PAF prediction parameter.
Limitations of 3D Strain Analysis: Technical Challenges and Pitfalls
Three-dimensional strain has become a valuable tool in assessing myocardial deformation, offering advantages over traditional 2D echocardiography. However, its application is subject to several limitations including technical challenges and potentials pitfalls. 46 First, 3D echocardiography is highly dependent on image quality, which can be compromised by patient factors like obesity, lung interference, abnormal rotation of the heart and operator experience. 46 Second, 3D strain imaging has lower temporal resolution compared to 2D strain due to acquirement of a full volumetric dataset. This may affect tracking accuracy, particularly in patients with higher heart rate. Also different vendors use different software, and thus acquired images and loops are not completely interchangeable. Classical pitfalls are tracking errors and interpolation causing inaccurate strain calculations, angle dependency (but to a lesser degree than 2D methods) and lack of clinical validation, historically also time-consuming postprocessing. According to our experience, LA myocardial strains may be acquired quickly, tracking errors may occur in rather low quality loops since it is technically more demanding to track the thin atrial wall.
Limitations
Our patient population was classified based on a history of PAF or its absence, not NOAF or prospective AF recurrencies, what limits the prediction capacity since the directionality of this association is reversed. We however believe, that even though these data are showing significant discrimination capacity of LASr, which is probably a surrogate of atrial cardiomyopathy.
We do not have NT-proBNP levels to compare those with LA reservoir function. Even though the study population is well balanced for both sex and presence/absence of PAF, it is still a single-centre evaluation of a small group of patients. We also do not have the data on frequency and duration of AF episodes, which might have added to less homogeneity in the PAF+ group. Moreover, a healthy control group was not part of the study. Without a healthy control group it may be difficult to determine, whether the differences in LASr are specific for atrial fibrillation or confounding cardiovascular diseases, even though we have adjusted for those.
Conclusion
Left atrial strain has emerged as a valuable imaging biomarker for assessing AF risk. By providing a dynamic assessment of atrial function, LAS offers advantages over traditional measures of LA size and volume. Three-dimensional left atrial reservoir function can differentiate patients with a history of paroxysmal atrial fibrillation as compared to patients without history of this arrhythmia with moderate sensitivity and specificity.
Footnotes
Author Contributions
JP: Writing Original Draft, Investigation, Project Administration, Visualization, Data Curation; VS: Resources, Investigation; JS: Resources, Investigation; DD: Writing, Review & Editing; MR: Project Administration, Supervision; JP: Visualization, Funding Acquisition; JV: Formal Analysis, Review & Editing; MH: Investigation, Resources; JV: Supervision, Review & Editing.
Funding
The author(s) disclosed receipt of the following financial support for the research, authorship, and/or publication of this article: The study was supported by the Ministry of Health, Czech Republic, for the conceptual development of a research organization (FNOs/2024).
Declaration of Conflicting Interests
The author(s) declared no potential conflicts of interest with respect to the research, authorship, and/or publication of this article.
Data availability statement
The data that support the findings of this study are available from the corresponding author upon reasonable request and in compliance with the General Data Protection Regulation.
Supplemental material
Supplemental material for this article is available online. Supplemental video is documenting step-by-step process of LA strain analysis.
References
Supplementary Material
Please find the following supplemental material available below.
For Open Access articles published under a Creative Commons License, all supplemental material carries the same license as the article it is associated with.
For non-Open Access articles published, all supplemental material carries a non-exclusive license, and permission requests for re-use of supplemental material or any part of supplemental material shall be sent directly to the copyright owner as specified in the copyright notice associated with the article.