
Abstract
Aims:
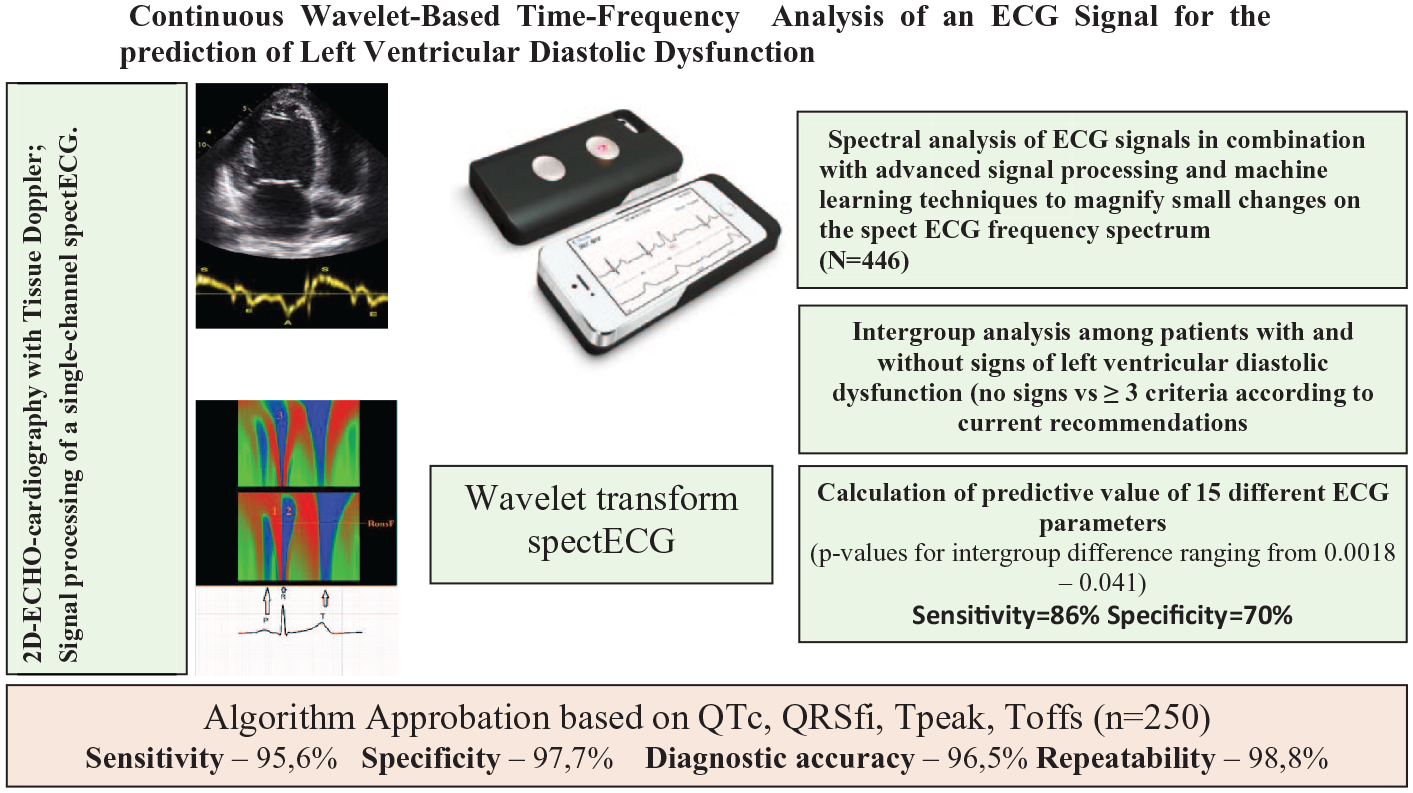
To investigate the potential of a signal processed by smartphone-case based on single lead electrocardiogram (ECG) for left ventricular diastolic dysfunction (LVDD) determination as a screening method.
Methods and Results:
We included 446 subjects for sample learning and 259 patients for sample test aged 39 to 74 years for testing with 2D-echocardiography, tissue Doppler imaging and ECG using a smartphone-case based single lead ECG monitor for the assessment of LVDD. Spectral analysis of ECG signals (spECG) has been used in combination with advanced signal processing and artificial intelligence methods. Wavelengths slope, time intervals between waves, amplitudes at different points of the ECG complexes, energy of the ECG signal and asymmetry indices were analyzed. The QTc interval indicated significant diastolic dysfunction with a sensitivity of 78% and a specificity of 65%, a Tpeak parameter >590 ms with 63% and 58%, a T value off >695 ms with 63% and 74%, and QRSfi > 674 ms with 74% and 57%, respectively. A combination of the threshold values from all 4 parameters increased sensitivity to 86% and specificity to 70%, respectively (OR 11.7 [2.7-50.9], P < .001). Algorithm approbation have shown: Sensitivity—95.6%, Specificity—97.7%, Diagnostic accuracy—96.5% and Repeatability—98.8%.
Conclusion:
Our results indicate a great potential of a smartphone-case based on single lead ECG as novel screening tool for LVDD if spECG is used in combination with advanced signal processing and machine learning technologies.
Keywords
Graphical Abstract
Introduction
Diastolic dysfunction of the left ventricle (LVDD) is both a cause and a consequence of the variety of heart diseases. Heart failure with preserved ejection fraction (HFpEF) is a global health problem with a prevalence of 4.9% in patients over 60 years of age. 1 The ESC Long-Term Registry, in the outpatient setting, reports that 16% have HFpEF. 2 It is expected that the number of our cases will further increase with increasing life expectancy.1,3 HFpEF is characterized by diastolic dysfunction of the left ventricle which is often asymptomatic. Impaired relaxation of the myocardium is the earliest manifestation of LVDD. Timely diagnosis and proper management have a positive effect on prognosis. 4 Echocardiography allows noninvasive diagnosis of early diastolic dysfunction.5-8 However, echocardiography and in particular tissue doppler imaging remain expensive and are not considered to be a wide screening method for asymptomatic patients. As electrical and mechanical functions of cardiac performance are closely coupled, advanced signal processing and machine learning methods have been used to identify subtle alterations in a 12-lead electrocardiogram (ECG) in patients who were referred for coronary computed tomography. 9 The ECG signals were deconstructed in a manner similar to Fourier analysis and subsequently represented as a plot of the signal frequency versus time, which allows an improved signal-to-noise ratio. A machine learning algorithm was then implemented to diagnose early diastolic dysfunction from 370 features of the processed ECG signal. 9 Meanwhile, several studies have been published demonstrating the potential of advanced signal processing and machine learning technologies and in particular spectral ECG analysis for classifying asymptomatic LV diastolic dysfunction or detecting abnormal myocardial relaxation by ECG analysis.10-12 However, although these new technologies that are promising, routine use of the ECG as a diagnostic tool for assessing LVDD is not generally accepted due to a lack of validation studies in larger patient populations and in different subgroups of patients including comorbidities such as hypertension, diabetes, obesity and ischemic heart disease. Furthermore, the potential of a single lead ECG for LVDD diagnosis is not known. As HFpEF is often asymptomatic in particular in early stages, the search for widely available and easy applicable screening tools for early diastolic dysfunction is ongoing.12,13 Given the widespread use of devices with the ability to record a single-channel ECG, it is appropriate to determine its accuracy for the prediction of LVDD in a larger number of patients and with this to evaluate to potential of this approach to be used as a widespread screening method.
The aim of this study was therefore to evaluate the potential of a smartphone-case based on single lead ECG monitor combined with advanced signal processing and machine learning technologies as diagnostic tool for the determination of LVDD.
Methods
We performed a prospective, cross-sectional study. The research protocol was elaborated in accordance with the Declaration of Helsinki and was approved by the local ethics commission. The study registered on the website ClinicalTrials.gov. Written informed consent was obtained from each participant.
We initially recruited 705 unselected consecutive subjects (age of ⩾18 years) presenting as an outpatients or have been hospitalized at the cardiology department of our hospital.
Inclusion criteria
Over 18 years of age;
Signed informed consent to participate in the study.
Non inclusion criteria
Patients in which we couldn’t have an adequate analysis of their cardiac cycle on ECG or reliably assess the presence and degree of diastolic dysfunction:
QRS morphology severe changes (WPW syndrome, complete block of left bundle branch, pacemaker rhythm);
Patients with severe mitral stenosis.
Exclusion criteria
Poor quality of ECG recording;
Poor visualization during echocardiography;
Refusing to participate in the study.
Patients with block of right bundle branch and pacemaker when not functioning were included.
We have fulfilled 2 phases in our work. First phase—determination of ECG parameters associated with LVDD. Of the 446 subjects enrolled on the first phase, we excluded 28 patients (6.3%): 15—due to inadequate echocardiographic image quality, 9—due to suboptimal electrocardiograms, 4—due to severe mitral stenosis (Figure 1). On the second phase we investigated 259 patients and excluded 9 patients (3.5%): 6—due to inadequate echocardiographic image quality and 3—due to suboptimal electrocardiograms. Finally 418 patients were included in the first phase and 250 in the second one.

Flow chart of study participants.
For all patients 2 independent specialists, not informed about the ECG results, and performed echocardiography. Just after that, a 3-minute record of a single-channel ECG (equal to I standard lead) was performed in a sitting position after a 10 minutes rest. For patients, included in phase 2, single-channel ECG was performed in the same way but twice a day with a difference of 3 to 4 hours to determine the repeatability of the results.
Echocardiography
All subjects underwent a comprehensive 2-dimensional echocardiogram and tissue Doppler examination using a GEVIVID7 scanner and a dedicated imaging of mitral inflow using pulsed-wave Doppler echocardiography and pulsed-wave tissue Doppler echocardiography of the septal and lateral mitral annulus. Data acquisition and interpretation including grading of left ventricular diastolic dysfunction was performed according to actual guidelines.14-17 Based on the actual guidelines,14-16 we determined LVDD in patients with preserved ejection fraction without known myocardial damage, having 3 or 4 of the following parameters: (1) decrease in the velocity of movement of the fibrous ring of the mitral valve with tissue Doppler imaging <7 cm/s on the medial part and <10 cm/s on the lateral part; (2) left atrial volume index >34 ml/m2; (3) ratio of the blood flow velocity through the mitral valve in the first phase of LV filling (peak E) to the average velocity of movement of the fibrous ring of the mitral valve (e′)—E/e′ > 14; (4) velocity of the regurgitation flow on the tricuspid valve >2.8 m/s. All measurements were made in ⩾5 consecutive cardiac cycles during at least 2 breath cycles and average values were used for final analysis.
Signal-processed surface ECG
A 3-minute ECG was recorded from the patients’ right and left index or middle fingers (standard lead I) using a single-channel electrocardiograph “CardioQVARK®.” 18 The device was integrated in the cover of a mobile phone (Figure 2).
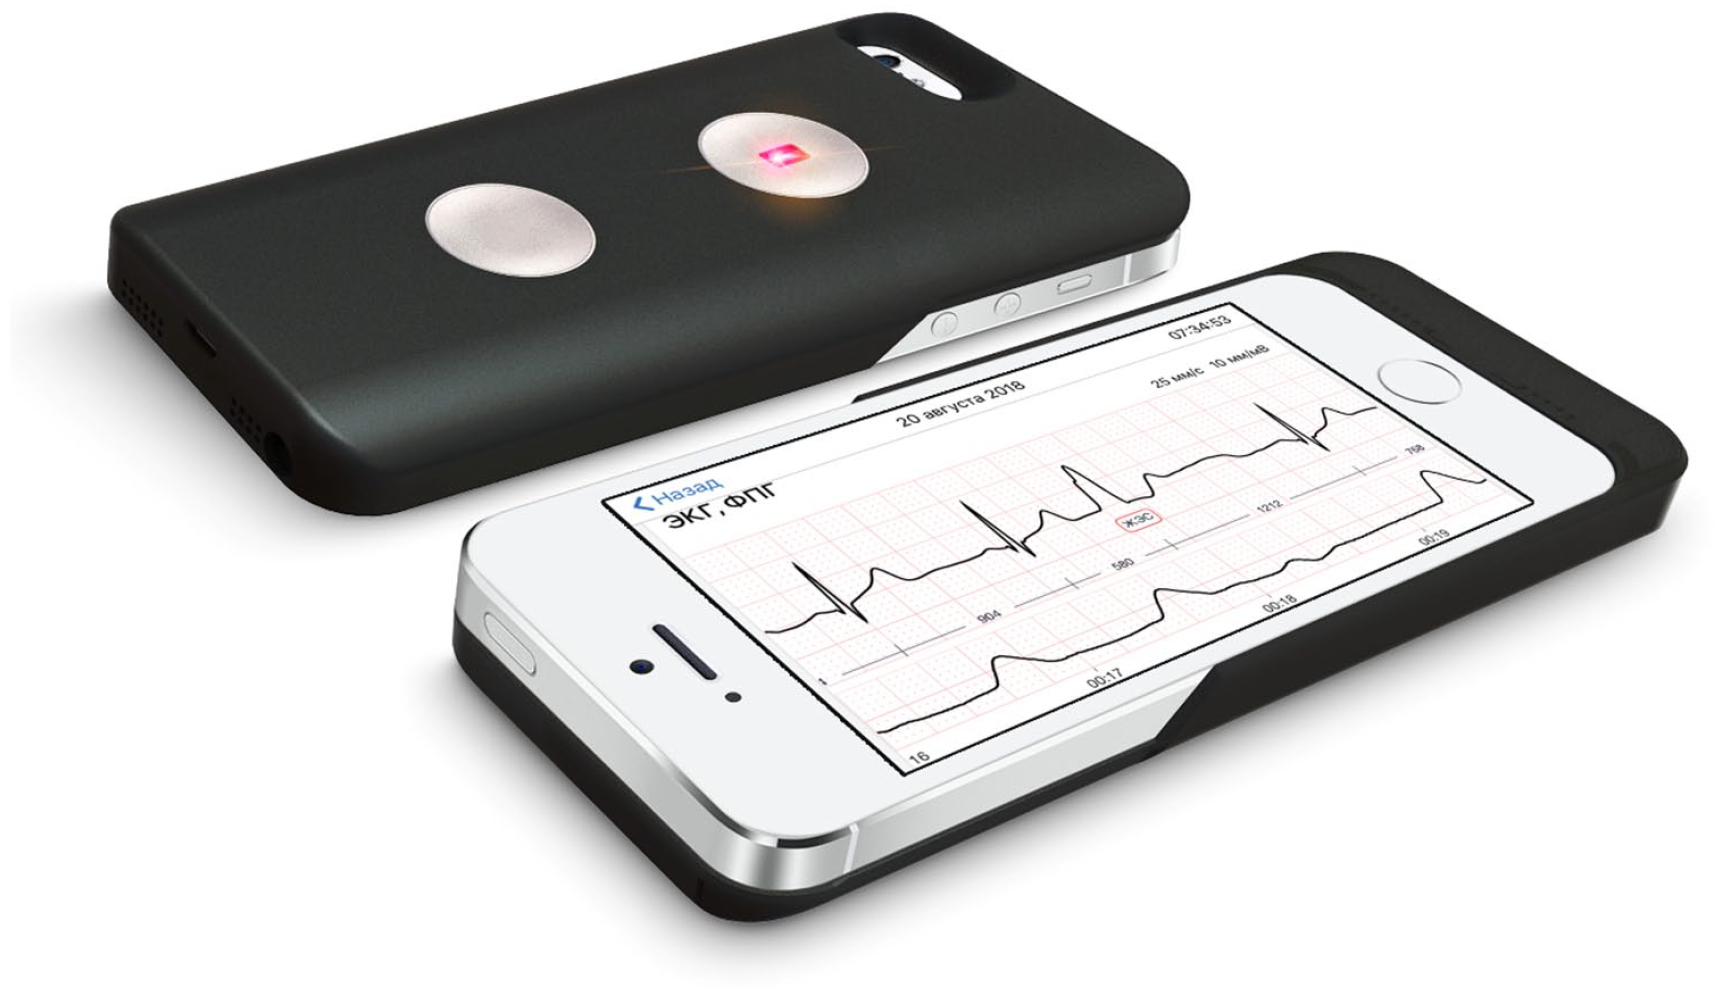
Single-channel electrocardiograph “CardioQVARK®.”
The device is integrated in the cover for a mobile phone. ECG is recorded from the patients’ right and left middle or index finger (standard lead I).
It was registered at the Russian Federal Service for Surveillance in Healthcare No. RZN 2019/8124 on February 15, 2019. The AZP sampling frequency is 1000 Hz, the frequency response of the analog path is 0.67 to 320 Hz, the input impedance is more than 6.5 M. The positive electrode of the I standard ECG lead was on the left hand, and the negative electrode on the right. The recorded ECG was processed by the CardioQVARK® algorithm, which filters, marks the signal, and then calculates the necessary parameters. The ECG parameters were performed in automatic mode, without exceptions. All signs were conditionally divided into the following groups: wavelengths slope and amplitudes of ECG-complex waves, durations between reference points, and spectral energies of various segments. All parameters were calculated for each normal complex, then the vector of the median values had been taken. To display the signal in the frequency domain, a continuous wavelet transformation was used.18-20 In our cases, 2 types of parent wavelets were used, corresponding to the first and second derivatives. Accordingly, it was possible to define various features of the signal such as the fronts and peaks of the waves. The averaged complex and its wavelet transforms are shown in Figure 3. Wavelet transform is a decomposition of an ECG into a color spectrum depending on time (x-axis) and frequency (Y-axis). The power value is encoded with a color gradient (red—highest energy, blue—lowest energy values). Two types of wavelet transform are illustrated: the first derivative on the upper part and the second derivative on the lower part of the Figure 3. Areas corresponding to energies QRS11energy, QRS12energy, QRS3energy are labeled with numbers 1, 2, and 3. The value of the frequency parameter RonsF is also shown. The imaging allows to clearly recognize the distribution of energy of the left and right ventricles at certain points in time throughout the entire cardiac cycle.

Averaged complex and its wavelet transformation.
Wavelet transformation is a decomposition of an ECG into a color spectrum depending on time (x-axis) and frequency (Y-axis). The power value is encoded with a color gradient (red—highest energy, blue—lowest energy values). Two types of wavelet transform are illustrated: the first derivative on the upper part and the second derivative on the lower part of the Figure 3. Areas corresponding to energies QRS11energy, QRS12energy, QRS2energy are labeled with numbers 1, 2, and 3. The value of frequency parameter RonsF energy of the leading and trailing fronts defined as frequency of the maximum is also shown. The imaging allows to clearly illustrate the distribution of energy of the left and right ventricles at certain points in time throughout the entire cardiac cycle.
For our study, we used the following ECG parameters:
QTc duration (Bazett’s formula);
amplitude parameters (JA is the amplitude at point J in microV, TA is the amplitude of the T-wave in microV, PAn is the amplitude of the negative P-wave in microV);
indices of asymmetry SBeta, Beta (ratio of the maximum modulus of the derivative value at the leading front of the T-wave to the maximum modulus of the value at the trailing front of the T-wave);
spectral integrals of energy of R and T waves: QRS11energy (leading front of R—1st derivative), QRS12energy (trailing front of R—1st derivative), QRS2energy (R-wave as a whole—2nd derivative), TE1 (T-wave as a whole) - (the integral is calculated as the sum of energies at all points of the corresponding region );
spectral integral set by the frequency grid 2 to 4 Hz, 4 to 8 Hz (QRSE1, QRSE2);
frequency of the maximum energy of the leading and trailing fronts of the R wave (RonsF, RoffsF);
rhythm variability (SDNN);
ECG time markers: PpeakN, Rpeak, Speak, Tpeak, Tons, Toffs.
ECG time intervals were calculated not from the beginning of the cardiac cycle, but from a point on the isoline, two-thirds of the duration of the R-R interval from the previous R-wave (so called—Calculated point). All parameters, except for the indicators of rhythm variability, were averaged taking into account the pulse rate. Rhythm variability indicators were evaluated by the program without averaging the values. Thus, the time parameters of the ECG took into account not only the morphology of the cardiac cycle, but also changes the heart rate. Considering that averaged values were taken into account, a longer recording provides the most accurate parameters. This includes markers of the beginning or the end of the wave (Pfi, QRSst, QRSfi), the shift of the negative or positive maximum value relative to the beginning of the averaged complex (PpeakN, Rpeak, Speak, Tpeak), as well as the maximum slope of the waves (Tons, Toffs). QRSfi is the time interval from the calculated point to the end of the QRS complex, expressed in ms. Tpeak is the time interval from the calculated point to the peak of the T wave. Toffs is the time interval from the calculated point to the point of maximum steepness of the descending knee of the T wave (Figure 4).
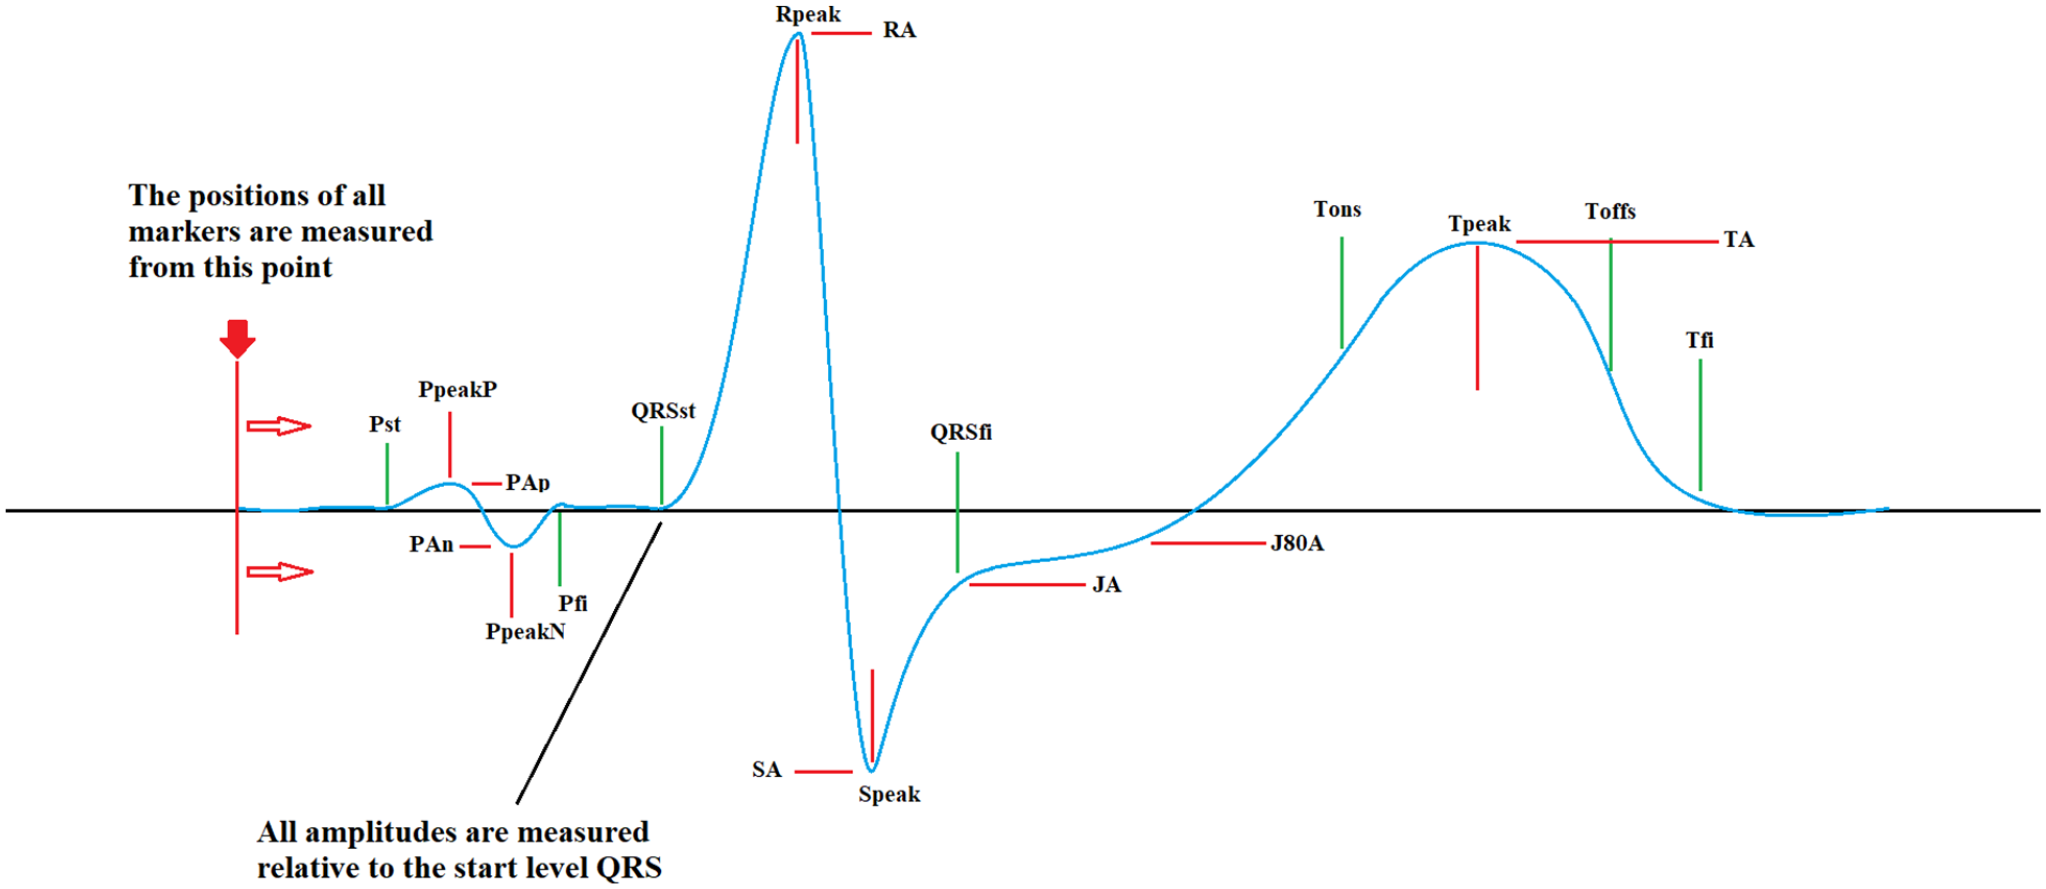
Time parameters of ECG.
Taking into account that the position of the calculated point depends on the R-R interval, it is possible to minimize the effect of heart rate on the time parameters of the cardiac cycle. These time parameters take into account not only the morphology of the QRS complex or T-wave, but also the temporal features of the entire cardiac cycle.
After logistic regression analysis including more than 200 ECG parameter listed above, the artificial intelligence method was used to find combinations with the highest accuracy for LVDD determination.
Statistical analysis
The patients ECHO and ECG characteristics were summarized with descriptive statistics. Mean values (standard deviation and median) were used for description of normally and non-normally distributed quantitative variables, respectively. Distribution normality was determined using histograms. Normally distributed values were compared using independent samples Student’s t test, whereas the Manne–Whitney U-test was used for non-normally distributed covariates. Chi-square or Fisher’s exact tests were used for categorical variables. Method parameters accuracy was measured using receiver operating characteristics (ROC) derived area under the curve (AUC). AUCs were compared as described in parameters of ECG with the higher p-value presented. Data analysis was conducted with SPSS version 25.0 (IBMCorp, Armonk, NY, USA).
Results
The algorithm was calculated on the development cohort on Phase 1 and then verified on other patients, additionally recruited into the validation cohort on Phase 2. A total of 668 patients were included in the final analysis. Due to criteria listed above, 5.2% of patients were excluded from the analysis. General characteristics of the study participants in Phases 1 and 2 are presented in Tables 1 and 2. We found no significant differences in regard to history and instrumental parameters between the patient in Phases 1 and 2 in subgroups with and without LVDD (P < .05).
Study patients on Phase 1 characteristics (n = 418).

Study patients on Phase 2 characteristics (n = 250).

ECG analysis and interpretation on Development cohort: Phase 1
In the first phase, an intergroup analysis was carried out among patients with significant diastolic dysfunction (⩾3 out of 4 criteria, according to the recommendations 14 ). Table 3 shows the ECG parameters that were significantly different in the 2 groups. No significant correlations were found between ECG parameters and ECHO Doppler and tissue Doppler mitral flow parameters when they were analyzed separately.
Intergroup comparison of ECG parameters in patients on Phase 1 with and without significant LVDD.

Abbreviations: LVDD, left ventricular diastolic dysfunction.
At the same time, some ECG indicators (QTc, QRSfi, Tpeak, and Toffs) had a statistical association with the presence of significant LVDD. ROC analysis was performed with the search for threshold values for the diagnosis of LVDD (Figure 5, Table 4).

ROC curves for QTc, QRSfi, Tpeak, and Toffs ECG parameters.
Diagnostic accuracy of ECG parameters for LVDD.

Abbreviations: LVDD, left ventricular diastolic dysfunction.
Based on the obtained data, a comprehensive indicator was developed, which included the excess of the calculated thresholds for QTc, QRSfi, Tpeak, Toffs. Separate ECG parameters have shown an average level of diagnostic accuracy. After that we searched for the best combination in terms of diagnostic accuracy using machine learning methods. The simultaneous exceeding of the threshold values of all 4 parameters: QTc, QRSfi, Tpeak, Toffs, led to an increase of sensitivity up to 87% and of specificity up to 70% (AUC 0.766; OR 11.7 [2.7-50.9], P < .001). This combined parameter was integrated in the CardioQVARK® monitor as a LVDD determination algorithm.
Algorithm approbation on the Validation cohort: Phase 2
During the second phase we used the developed algorithm on 250 patients. At the Phase 2—12.4% of patients had significant diastolic dysfunction. We determined that our algorithm shows a Sensitivity of—95.6%, Specificity of—97.7% and Diagnostic accuracy of—96.5%. With paired measurements, ECG data were contrasted just in 3 patients. Accordingly, in 98.8% of patients, the indicators of the developed algorithm were stable. Algorithm was not applicable in 3.5% of patients due to poor ECG or ECHO quality.
Discussion
Artificial intelligence-based algorithms have found widespread applications in medicine and particularly in cardiology with great outcome in ECG signal analysis. 21 The exact role electrocardiographic was shown in some works. Saeed Alipour Parsa et al reported that significant proximal left anterior descending coronary artery stenosis can be predicted by absence of septal q wave in ECG (sensitivity = 59%,and specificity = 47%). 22
Our results indicate a great potential of a smartphone-case based single lead ECG in combination with signal processing and machine learning technologies as novel screening tool for LVDD. The novelty of our approach is the use of an advanced signal processing technique which allows a more precise analysis of very small changes on the surface ECG frequency spectrum and to correlate this changes with myocardial relaxation abnormalities.
Whereas actual research is still focused on the use and for a further development of advanced imaging technologies, a major barrier for the widespread use of these technologies is the need for expensive equipment, which makes it not suitable for routine screening of larger populations, especially at the outpatient stage. Previous studies have shown the potential of using 12-channel ECG data to detect LVDD.18,23-25 Analysis of variance of the temporal parameters of the P wave on the ECG revealed a significant correlation with the presence of LVDD, as well as with its stages.23,26 Prolongation of the QT interval, inversion of the T wave on the ECG were also considered as predictors of the presence of LVDD.24,27,28 We are aware of one previous study which used machine learning methods for the identification of abnormal LV relaxation by processing a continuous wavelet transform from a 12-channel ECG signal. LV relaxation was detected using the machine learning method “Random forest” by using the following parameters: icon, irem2, ilo1 value, avrp51 value, v1p21 value, viemlv / vilmlv, v4p21 value, v6p21 value, avrp21 value, v3dtm, v1rlm, v1rem, iiirlm2, ip51 value, iip53 value, ip21 value, avf53, avfrlm value, v1drate, v1rem2, idrate, iram, iip51 value, irlm, irem. The study also assessed the average heart rate, P, Q, R and S waves (QRS); T; duration of P and QRS; PR and QT intervals; and timely diagnosis corrected QT interval (QTc). The area under the curve (AUC) for the prediction of low e′ using random forest-based classifier was 91%, with a sensitivity of 80% and specificity of 84%.9,11 In a multicenter prospective study, 18 parameters of a 12-lead ECG were selected to determine abnormal LV relaxation. A decrease in e′ was predictive with a sensitivity 78% and a specificity of 77%, AUC 0.83. Global LVDD could be predicted by the estimated e′ parameters with sensitivity 93% and specificity 51%, AUC: 0.76 in the internal test set and with sensitivity 67% and specificity 80%, AUC: 0.80 in the external test set. Also, the LVDD decrease prediction was based on a simplified algorithm proposed by the Mayo Clinic and another algorithm developed using the Framingham Heart Study. Good results were obtained with each algorithm. 10 Promising data has also been obtained in a study with a neural network to determine systolic function. A convolutional ventricular neural network to identify patients with LV dysfunction with an ejection fraction ⩽35% using the ECG data alone demonstrated a sensitivity 86.3% and a specificity 85.7%, respectively. 9 The neural network may also be promising for the prediction of diastolic function. However, we did not find results from studies using a machine learning algorithm from a single-channel ECG for prediction of LVDD. Therefore, the use of a smartphone-case based single lead ECG for prediction of LVDD is a novel approach which allows to detect significant differences in certain ECG parameters in patients with and without diastolic dysfunction. This is made possible by the use of an advanced signal processing technique which allows a more precise analysis of very small changes on the surface ECG frequency spectrum and to correlate this changes with myocardial relaxation abnormalities. In our work we focused on LVDD markers in an ample list of time, amplitude and frequency parameters. By using machine learning, we found QTc, QSfi, Tpeak, Toffs to be independent markers of significant LVDD developing for various reasons, whereas no accuracy was found for the prediction of mild LVDD.
The approbation of our algorithm showed a high diagnostic accuracy and a high level of repeatability of the results. We emphasize that this method should be used in population screening especially in people who ignore their disease. Therefore, if a patient with any cardiac pathology is already consulted by a doctor, he do not require our screening.
Study Limitations
Considering that our work did not include patients with complete block of left bundle branch, WPW syndrome and severe mitral valve stenosis, additional research is required. Considering that we were developing a method for cardiac pathology screening, we did not take into account the known heart diseases that could limit the use of our method, since these patients are already under control. A separate large study of the effectiveness of our algorithm in patients with atrial fibrillation is required.
Conclusion
Our results indicate the possibility to use a smartphone-case based single lead ECG with advanced signal processing and machine learning technologies for LVDD screening with a high diagnostic accuracy.
Footnotes
Acknowledgements
None
Funding:
The author(s) disclosed receipt of the following financial support for the research, authorship, and/or publication of this article: This work was financed by the Ministry of Science and Higher Education of the Russian Federation within the framework of state support for the creation and development of World-Class Research Centers “Digital biodesign and personalized healthcare” №075-15-2022-304.
Declaration of Conflicting Interests:
The author(s) declared no potential conflicts of interest with respect to the research, authorship, and/or publication of this article.
Authors Contributions
DG, ES, VS, PC and PhK were involved in the planning of the study, AG, ID, DG, AM, OO did the data acquisition, DG, ES, VS, PC, HS and PhK were involved in the data analysis and interpretation, all authors were involved in the manuscript writing, all authors reviewed and approved the manuscript.
Study Registration Information
We performed a prospective, cross-sectional study at the Sechenov University Clinical Hospital №1 in Moscow Russia between September 2019 and November 2020. The research protocol was elaborated in accordance with the Declaration of Helsinki and was approved at a meeting of the local ethics commission of Sechenov University №10-19 dated 17.07.2019. The study registered on the website ClinicalTrials.gov (ID NCT04474639).
Data Availability
The data underlying this manuscript is stored in the data repository of the First Moscow State Medical University in Moscow RU and is available by request from the first author Natalia Kuznetsova Email