
Abstract
Purpose:
The purpose of this study was to determine the effectiveness of a simple algorithm to mathematically predict a patients’ response to blood pressure (BP) therapy using functional genes in the 3 major organ systems involved in hypertension.
Methods:
Eighty-six patients with controlled hypertension completed 1 study visit consisting of a buccal swab collection, measurement of office BP, and a medical chart review for BP history. Genes in the analysis included 14 functional alleles in 11 genes. These genotypes were mathematically summed per organ system to determine whether a patient would likely respond to target therapy.
Results:
Patients recommended to and taking a diuretic had significantly higher rates of control (<120/<80) than patients recommended but not taking this drug class (0.2 ± 0.1 and 0.03 ± 0.03, respectively). Furthermore, there was a difference between patients genetically recommended and taking an angiotensin receptor blocker (ARB) vs patients recommended but not taking an ARB for the lowest diastolic blood pressure (DBP) and mean arterial pressure (MAP) recorded in the past 2 years (DBP = 66.2 ± 2.9 and 75.3 ± 1.7, MAP = 82.3 ± 2.8 and 89.3 ± 1.5, respectively). In addition, there was a nonsignificant trend for greater reductions in ΔSBP, ΔDBP, and ΔMAP in patients on recommended drug class for beta-blockers, diuretics, and angiotensin II receptor blockers vs patients not on these classes.
Conclusion:
The present study suggests that simple mathematical weighting of functional genotypes known to control BP may be ineffective in predicting control. This study demonstrates the need for a more complex, weighted, multigene algorithm to more accurately predict BP therapy response.
Introduction
Hypertension (HTN) is the strongest modifiable risk factor for cardiovascular disease (CVD) and is the most common condition seen in the primary care setting.1,2 Globally, approximately half of the adult population (1.39 billion people) had HTN in 2010, and HTN is the leading cause of death and disability-adjusted life-years worldwide.2–4 In the United States, HTN affects ~80 million individuals with over 5 million new diagnoses each year.4–6 Furthermore, high blood pressure (BP) is responsible for ~360,000 annual deaths with a $51 billion direct cost to the US healthcare system.7,8 Although new BP standards were released in 2017, 9 widespread clinical adoption is lacking. According to these new standards, BP is classified into 4 categories: normal BP (average systolic BP [SBP] < 120 mm Hg and average diastolic BP [DBP] < 80 mm Hg), elevated BP (average SBP of 120-129 mm Hg and average DBP < 80 mm Hg), stage 1 HTN (average SBP of 130 to 139 mm Hg or average DBP of 80 to 89 mm Hg) and stage 2 HTN (SBP of at least 140 mm Hg or an average DBP of at least 90 mm Hg).10–13
Effective treatment for rapid reductions in BP is important for survival in HTN patients as end organ damage occurs quickly, and even small reductions (~5 mm Hg) in BP can have a marked impact on survival. 14 Unfortunately, BP control rates are very poor with only half of HTN patients achieving control. 15 Furthermore, a therapy’s efficacy and BP control goes beyond adherence rates as ~70% of HTN patients are treated and only 50% of those are defined as controlled (BP < 140/90 mm Hg). 16 In addition, each common class of BP medication (diuretic, angiotensin-converting enzyme (ACE) inhibitors (ACEIs), angiotensin-II receptor blockers, beta-blockers) has an effectiveness rate of approximately 50%, suggesting a significant genetic component to therapy efficacy. 17 There is a well-established bell-curve response to most HTN pharmacotherapies demonstrated by a majority of patients having a reduction in BP, or no change; however, a critical component to the bell shaped curve suggests 10% to 20% of patients demonstrate an increase in BP.18,19 In studies demonstrating bell-curve response to common pharmacotherapies, mass-spectrometry has been used to assess plasma drug levels as a key metric of prescription adherence, thus clearly demonstrating that the variability in response is not due to a patient not taking the prescribed drug.17–19 To combat the general ineffectiveness of monotherapy, the current standard of care is to up-titrate the monotherapy to “maximally tolerated dose” and then “layer” an additional classes of therapies in an effort to control BP. However, this approach presents a number of clinical challenges including increased side effect profile and a reduced patient compliance and adherence to treatment. Previous work has demonstrated that for each additional drug prescribed there is up to 80% reduction in medication adherence. 20
Hypertension has a strong heritable component with estimates ranging from 30% to 60%.21,22 For example, the risk of developing HTN doubles for each first degree relative with HTN, and sons of HTN patients have an average of 10 mm Hg higher systolic and diastolic BP when compared with sons of normotensive individuals, independent of Na+ intake.23,24 Furthermore, the susceptibility to HTN is ~55% in monozygous twin siblings, up to 40% in dizygous twins, and as low as 20% for nontwin sibling pairs.25–27 Collectively, these data demonstrate a clear heritable component to HTN development. In addition, both genome-wide association studies and candidate gene studies have demonstrated that HTN monotherapy effectiveness may be improved using genetics to guide therapy.18,19,21,28
While the promise of using genetic information to guide medical therapy existed before the human genome was fully sequenced, there is a general lack of genetically informed therapy decisions in clinical practice today. Hypertension is a highly multifactorial disease modulated by multiple susceptibility genes, suggesting a strong genetic determinant to the BP response to therapies. Research examining genetic determinants of HTN therapy response has primarily focused on genetic variation and response to beta-blockade and thiazide (and thiazide-like) diuretics.19,21,28 Collectively, these data demonstrate genetic variation may be responsible for a portion of the variability of effectiveness to HTN therapy and may modulate the bell-curve response noted previously. The present study builds on previous research in that we score each genotype, along with other genotypes within an organ system, whether a patient would be mathematically (by summing genotypes that have been shown to demonstrate functionality individually) predicted to respond to one drug over another.
Methods
Study design
This pseudo-retrospective study included HTN patients with a history of BP control (<140/<90) (clinicaltrials.gov identifier: NCT02524873). The study involved 1 prospective clinic visit consisting of buccal swab collection, measurement of office BP, and completion of a medication history survey. The study visit was followed by a thorough clinical chart review of the patient’s HTN and medication history. The primary outcome variable for analysis was office BP at time of buccal cell collection. Additional variables included lowest BP measurement throughout their HTN therapy and number of clinic visits within the prior 2 years, percent of patients with current BP control, and change in BP measurements over the last 2-year treatment period. From this BP measurement, we were able to assess the level of BP control as defined by the old American Heart Association/American College of Cardiology (AHA/ACC) BP guidelines 29 (<140/<90) and current Systolic Blood Pressure Intervention Trial (SPRINT) BP guidelines 12 (<120/<80) as well as the change in BP from baseline to control. From these data, we calculated the number of clinic visits in the last 2 years, and the time to BP control. Patients provided written informed consent after thorough description of study requirements and prior to enrollment and data collection (Chesapeake IRB# 00011237). All study procedures followed the rules of the Declaration of Helsinki.
Subjects
All patients enrolled in the study were HTN patients who had their BP under control for at least 6 months and who had been diagnosed with HTN for at least 1 year. In addition to BP history, demographic information collected included age, sex, height, weight, race, and ethnicity. Inclusion criteria for the study included the following: 30 to 70 years of age, patient on the same class/classes of BP medication for a minimum of 6 months (change in dosage, frequency, or specific medication was accepted as long as there were no changes to the class/classes of medications prescribed), body mass index (BMI) between 19 and 45 kg/m2, patient had to be prescribed and taking one of the following classes of medications alone or in combination: diuretics (thiazide or thiazide-like), ACEI, angiotensin receptor blocker (ARB), beta-blockers, and were on an average of 1.78 ± 0.08 HTN medications. Subjects were excluded from participation in the research study if one or more of the following conditions were met: a diagnosis of secondary HTN or a complication of pregnancy, currently prescribed and taking any additional class of medication(s) for high BP not included in the inclusion criteria, or systolic BP > 190 or diastolic BP > 120 documented within the immediate 6 months prior to the study visit.
Cell collection and genotyping
Two buccal swabs were collected for measurement of individual genotyping. The patient first collected cells via a buccal brush by swabbing the inside of their right cheek repeatedly for 15 seconds using moderate pressure (A-swab). The patient then deposited the swab in 750 μL of lysis buffer consisting of 50 mM Tris pH 8.0, 50 mM ethylenediaminetetraacetic acid (EDTA), 25 mM Sucrose, 100 mM NaCl, and 1% SDS to lyse the cells and stabilize DNA during transit prior to extraction. This process was repeated with the left cheek (B-swab) to ensure adequate cell collection necessary to achieve a minimum yield of 500 ng total genomic DNA necessary for downstream genotyping. Subsequent lysate from buccal swabs was used in DNA isolation via Qiagen DNeasy isolation kits according to manufacture recommended specification (Qiagen). Patient isolated DNA was then assayed for 14 functional alleles in 11 genes selected for known functionality in the heart, kidney, and vasculature from previous peer-reviewed studies: (2) SNPs in beta-1 adrenergic receptors (ADRB1, rs1801252, and rs1801253), (2) SNPS in beta-2 adrenergic receptors (ADRB2, rs1042713, and rs1042714), the alpha subunit of the epithelial sodium channel (ENaC) (SCNN1A, rs2228576), alpha-adducin (ADD1, rs4961), sodium-chloride symporter (SLC12A3, rs1529927), (2) in lysine deficient protein kinase 1 (WNK1, rs1159744, and rs2107614), ACE (rs1799752), angiotensin (AGT, rs699), angiotensin receptor (AGTR1, rs5186), cytochrome P450 2D6 (CYP2D6*4, rs3892097), and renin (REN, rs12750834).28,30–45 With the exception of the ACE insertion/deletion (indel) genotype, all genotype polymorphisms were quantified using a 2-step process beginning with a multiplex PCR (Supplemental Table 1), directly followed by a single base extension (SBE) reaction (Supplemental Table 2). The products of the SBE reaction were pooled and subsequently flown on a genomic mass spectrometer (Agena MassARRAY System, CD Genomics, New York, NY) to generate individual genotypes. The ACE indel status was assessed using a standard PCR primer set and protocol provided in Supplemental Table 3, followed by 2% agarose sizing gel electrophoresis. Precharacterized Coriell cell line DNAs consisting of all possible genotype combinations were run in parallel for each SNP as controls. All genotype data in aggregate were also used to compute population allele frequencies which were confirmed against known existing frequencies in publicly available databases (ExAC browser, 1000 Genomes project, GO-exome sequencing project, and TOPMED).
Mathematical prediction of drug responsiveness
This study builds on previous work in that we use simple scoring for each genotype and then mathematically sum if a patient would respond to one drug over another.21,46 In previous work, investigators have used one genotype to assess pharmacologic effectiveness. 46 In some studies, investigators used multiple genotypes within an organ system to assess effectiveness, but few studies have used this method and then compared against scores of the other key organ systems.21,46,47 For the purpose of this study, if a patient was functional in a majority of genotypes within an organ system (eg, 3/5 in the cardiac system, 3/5 in the renal system, and/or 3/4 in the vascular system), they were predicted to be “likely” to respond to a certain drug class (beta-blockers, diuretics, and/or ACE inhibitors/ARBs, respectively) (Table 1). Furthermore, to make a determination between ACE-inhibition and ARBs, if the renin-angiotensin-aldosterone system (RAAS) is “generally functional” (3/4 genotypes are functional) compared with the other organ systems/drug classes, and a patient demonstrates functionality in the ACE genotype (rs1799752), then an ACEI is favored over an ARB. If the RAAS is “generally functional” (three/four genotypes are functional) compared with the other organ systems/drug classes, and a patient demonstrates nonfunctionality in the ACE genotype but functionality in the angiotensin receptor (rs5186), then an ARB is favored over an ACEI. Should the RAAS be generally functional, compared with other organ systems but not demonstrate functionality in ACE or ARB, then an ARB is recommended, given that it is at the end of the RAAS. Interestingly, there were few cases (6 in total) of a “tie” between organ systems. Because the focus of this trial was to assess the impact of one drug class when compared with another, we selected the best drug class when 2 classes came out as the same functionality by selecting the class that most aligns with the Joint National Committee recommendations.
Functional allele variants within organ systems, phenotype of importance, and the difference between functional and nonfunctional allele variants used to build the mathematical algorithm.

Abbreviations: BP, blood pressure; HTN, hypertension; MAP = mean arterial pressure.
If a majority (>50%) of the organ system genes were found to be functional in nature, when compared with the other organ systems, then it was determined that a patient should respond best to the drug that targets that organ system, when compared with other pharmacotherapies.
Data analysis
All data were coded for statistical analysis (ie, drug classes and genotypes coded numerically according to functionality) and were analyzed with SPSS v.21. Normality of the data were assessed using Levene’s test prior to substantive analysis to assess equality of variance and correct statistical tests accordingly. Descriptive statistics were computed (average time for BP control, average number of visits to the clinician for BP control, age, height, weight, BMI, etc.). Post hoc correction for univariate analysis of variance was conducted using Bonferroni analysis. Ordinary least squares regression via univariate modeling was used to estimate the magnitude of linearity between drug classes that yielded the best BP control and that which was mathematically predicted based on the sum of genotypes for the subject. All statistical analyses were considered significant at an alpha level of 0.05.
Results
Eighty-six patients completed all aspects of the study and were included in the statistical analysis (Table 2). On average, the patients were on 1.78 ± 0.08 classes of medications, with 37 patients on 1 medication, 35 patients on 2 medications, and 14 patients on 3 medications. The percentage of patients currently on the genetically determined optimal drug class is 26.2% for beta-blocker, 39.2% for diuretic, 59.7% for ACEI, and 32.4% for ARB (Table 3). There were no differences in initial SBP, DBP, or MAP taken at the time of HTN diagnosis between patients who were on the genetically determined optimal drug class and those who were not (Table 4).
Subject characteristics (mean ± standard error and N).
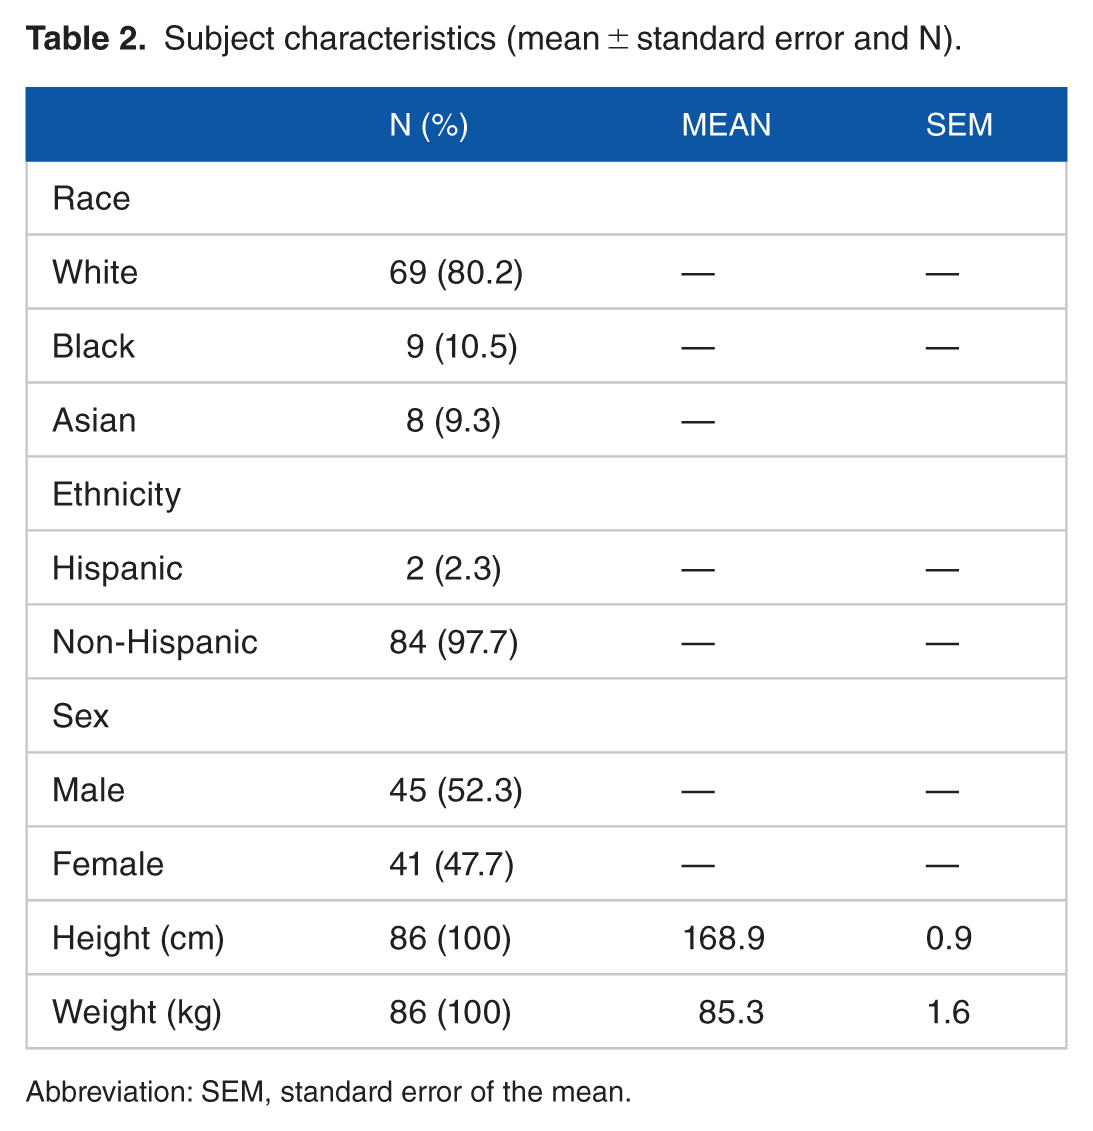
Abbreviation: SEM, standard error of the mean.
Number and percent of patients on the genetically determined optimal drug class.

Abbreviations: ACEI, angiotensin-converting enzyme inhibitor; ARB, angiotensin II receptor blocker.
Initial blood pressure measurements at hypertension diagnosis for patients on the genetically determined optimal drug class versus patients not on the optimal drug class.

Abbreviations: ACEI, angiotensin-converting enzyme inhibitor; ARB, angiotensin II receptor blocker; DBP, diastolic blood pressure; MAP, mean arterial blood pressure; SBP, systolic blood pressure.
There were no statistically significant differences in initial blood pressure measurements.
The number of clinic visits over the preceding 2 years and whether BP control was achieved as defined by the AHA/ACC or SPRINT guidelines are presented in Table 5. There was a statistically significant difference between patients who were on the genetically determined optimal therapy for diuretics and patients not on the optimal therapy for diuretics for the number of clinic visits the last 2 years (Table 5). Furthermore, there was a difference in rates for patients on the genetically determined optimal therapy for diuretics and patients not on the optimal therapy for diuretics for achieving BP control as defined by the SPRINT guidelines (0.24 ± 0.10 vs 0.03 ± 0.03, respectively) (Table 5). There was a difference between patients who were on the genetically determined optimal therapy for ACEI and patients not on the optimal therapy for ACEI for the number of clinic visits the last 2 years (4.4 ± 0.7 vs 2.6 ± 0.5, respectively) (Table 5). The patients’ current and lowest (from the last 2 years) SBP, DBP, and MAP are presented in Table 6. There was a significant difference between patients on the genetically determined optimal therapy for an ARB and patients not on the optimal therapy for an ARB for the lowest DBP (66.7 ± 2.9 mm Hg vs 75.3 ± 1.7 mm Hg, respectively) and MAP (82.3 ± 2.8 mm Hg vs 89.3 ± 1.5 mm Hg, respectively) recorded in the last 2 years (Table 6). There were no significant differences between patients on their genetically determined optimal drug class and patients not on the optimal drug class for change in SBP, DBP, and MAP. However, our data demonstrate a trend for a greater reduction in SBP, DBP, and MAP in patients on the genetically determined optimal drug classes for beta-blockers, diuretics, and ARBs compared with patients not on the optimal therapy for these classes (Figure 1). Collectively, these data demonstrate an effect of genotype/pharmacotherapy matching in some (percent under control, number of clinic visits to obtaining BP control, and lowest BP recordings since diagnosis) but not other (delta BP from diagnosis) outcome variables.
Number of clinic visits in the last 2 years and if blood pressure control was achieved under the old American Heart Association/American College of Cardiology guidelines or the SPRINT guidelines for patients on the genetically determined optimal drug class versus patients not on the optimal drug class.

Abbreviations: ACEI, angiotensin-converting enzyme inhibitor; ARB, angiotensin II receptor blocker; SEM, standard error of the mean; SPRINT, Systolic Blood Pressure Intervention Trial.
Statistically significant difference between patients on the recommended drug class versus patients not on the recommended drug class.
Current blood pressure measurements and lowest blood pressure measurements from the last 2 years for patients on the genetically determined optimal drug class versus patients not on the optimal drug class.

Abbreviations: ACEI, angiotensin-converting enzyme inhibitor; ARB, angiotensin II receptor blocker; DBP, diastolic blood pressure; MAP, mean arterial blood pressure; SBP, systolic blood pressure; SEM, standard error of the mean.
Statistically significant difference between patients on the recommended drug class vs patients not on the recommended drug class.

Change in systolic blood pressure, diastolic blood pressure, and mean arterial pressure for patients on their genetically determined optimal drug class and patients not on their optimal drug class for beta-blocker (B-blocker), diuretic, angiotensin-converting enzyme inhibitor, and angiotensin II receptor blocker for a 2-year treatment period.
Discussion
In this study, we assessed HTN patient responsiveness to beta-blocker, diuretic, ACEI, and ARB HTN therapy based on genetically determined drug class. This builds on future work in that we mathematically predicted responsiveness based on multiple genotypes within an organ system. We demonstrated variability in the number of patients (26%-60%) who were prescribed our genetically determined optimal drug class across those classes. Despite no difference in initial BP measures, there was a difference in the lowest measured DBP and MAP for patients who were on the genetically determined optimal therapy for an ARB compared with patients not on the optimal therapy for an ARB. Our data also demonstrate a pattern, though nonsignificant, of greater reductions in SBP, DBP, and MAP for patients on the genetically determined optimal drug class versus patients not on the optimal drug class for beta-blockers, diuretics, and ARBs. Furthermore, there was a difference between patients on the genetically determined optimal drug class and patients not on the optimal drug class for the number of clinic visits in the last 2 years for diuretic and ACEI therapy. There was also a difference between patients on the genetically determined optimal therapy for diuretics and patients not on the optimal therapy for diuretics for the number of patients who achieved BP control as defined by the SPRINT BP guidelines. Collectively, these data suggest a simple algorithm based on single polymorphisms for determining the effect of genotype on BP response to common drug classes is associated with some important outcome variables with respect to BP, but may not be the most robust approach to genetically guided therapy: However, it does provide a great step forward in our ability to logically use genetics for developing a multigene mathematical prediction of HTN pharmacotherapy responsiveness.
Hypertension is a highly multifactorial disease modulated by multiple susceptibility genes, suggesting a strong genetic determinant to the response of HTN to therapies. Research examining genetic determinants to HTN therapy response has primarily focused on genetic variations of thiazide and thiazide-like diuretic response and has identified WNK1, ADD1, SLC12A3, and SCNN1A variants as playing functional roles in BP response to HTN therapy.19,21,28 To date, most research on the effectiveness of BP therapies has been monogenic and has not adequately taken into account the multiorgan and multisystem integrative nature of the disease. There are likely many genes that need to be considered to guide therapy, simultaneously, along with gene-gene interactions of the pathways in the cardiorenal axis responsible for BP control, in order for HTN pharmacogenetics to be effective. Therefore, in the present study we assess 14 genotypes of within the heart, vasculature, and kidney on the BP response to therapy. In a previous study, we assessed each of these genotypes, which have known functionality, and their response on BP control and change in BP from diagnosis, with mixed results. 48
Pathways responsible for fluid volume and BP regulation include ion cotransporters that modulate Na+ reabsorption in the kidneys. These are the Na+/Cl– cotransporter (NCC) and the Na+/K+/2Cl– cotransporters (NKCC1 and NKCC2) and are targets for thiazide-diuretic and loop-diuretic drugs, respectively. These transporters are members of the SLC12 family of ion transporters and have vital roles in regulating electrolyte transport and BP. 49 The SCL12A is a kidney-specific isoform expressed exclusively along the distal convoluted tubule and the C variant of SLC12A3 (rs1529927) has been shown to be more responsive to a diuretic.49,50 In addition, upstream regulators of these pathways have been identified. For example, Lysine deficient protein kinases (WNKs) are comprised of 4 members, WNK1-4, and demonstrate differential kinase activity. 51 The WNKs function primarily as negative regulators of NCCs and play a regulatory role in electrolyte transport across membranes and epithelia, thus playing a pivotal role in fluid volume regulation and BP control. 52 Furthermore, it has been demonstrated WNKs form complexes in the kidney tubule and regulate each other, suggesting WNKs constitute a signaling complex in the aldosterone-sensitive distal nephron (ASDN). 53 Genetic variation in WNK1 (the kidney specific isoform) predominantly effects renal electrolyte transport.54,55 These genetic variations of WNK1 have been associated with variation in BP and have demonstrated ~5 to 6 mm Hg difference in BP response to hydrochlorothiazide (re2107614, rs1159744, and rs2277869).19,51,55
The ENaC is an ion channel composed of α, β, γ, and δ subunits and functions via Na+ reabsorption and concomitant H2O diffusion across the apical membrane of renal nephrons and plays a critical role in the maintenance of extracellular fluid volume, BP, and sodium homeostasis.56,57 Others have demonstrated that SCNN1A is absolutely required for the regulation of Na+ flux through this channel and its genetic variations are associated with BP modulation.58,59 Furthermore, while transepithelial Na+ transport across the luminal plasma membrane is modulated by ENaC, Na+ transport across the basolateral plasma membrane is regulated by Na-K-ATPase. These are the pathways responsible for maintaining ion concentration gradients for the facilitation of ion reabsorption and secretion, suggesting the Na-K-ATPase and ENaC form a functional complex for ion transport. 50 An integral regulator of this complex is adducing which is a ubiquitously expressed protein comprised of α, β, and γ subunits and functions to recruit spectrin to actin filaments, bundling actin filaments, and capping actin filament ends and is involved in intercellular contact, signal transduction, and ion transport across the cell membrane. 60 Specifically, adducin is responsible for the expression and maximum velocity of Na-K-ATPase and subsequently strengthens renal tubular Na+ reabsorption.61,62 Genetic variants of the alpha adducin subunit (ADD1) influence a patient’s HTN risk and response to diuretic therapy. 50 Specifically, the T variant of alpha adducin (rs4961) has been shown to be more responsive to a diuretic. 50
Additional pathways responsible for the regulation of fluid balance and BP maintenance is the RAAS. The RAAS is a hormonal cascade and is initiated by the secretion of renin, the rate-limiting enzyme responsible for the formation of angiotensin I (Ang I) from angiotensinogen. Angiotensin I is then hydrolyzed by ACE to form angiotensin II (Ang II), the primary product of RAAS and a potent vasoconstrictor. 63 Ang II has several functions in the cardiovascular system (vasoconstriction, increased cardiac contractility, vascular and cardiac hypertrophy), in the kidney (renal tubular Na+ reabsorption, inhibition of renin release), sympathetic nervous system, and adrenal cortex (stimulation of aldosterone synthesis), all of which directly or indirectly influence BP control. 64 Therapeutic responses to RAAS antagonists suggest renin-dependent mechanisms to be involved in ~70% of HTN. 63 Furthermore, the response to vasodilation has primarily focused on genetic variation of the ACE inhibitor (ACEI), Ang I, and the Ang II receptor. Specifically, the deletion variant of ACE (rs7079), the C variant of Angiotensin (rs699), and the C variant of the Ang II receptor (rs5186) have shown improved response to ACEI and Ang II receptor antagonism.65–67
The beta-adrenergic receptors (ADRB1, ADRB2) are key targets for pharmacological antagonists (selective and nonselective beta blockers, respectively) and mediate important cardiovascular responses including cardiac contractility and heart rate. 68 The response to beta-blockers has traditionally focused on functional variants of ADRB1 and ADRB2. Specifically, the Ser49 and Arg389 of ADRB1 (rs1801252 and rs1801253, respectively) and the Arg16 and Glu27 of ADRB2 (rs1042713 and rs1042714, respectively) have demonstrated an improved responsiveness to beta-blockade.69–71 The beta-adrenergic receptors are also located in juxtaglomerular cells of the kidney whereupon their stimulation induces renin release activating RAAS72,73 demonstrating the close relationship and integration between physiologic pathways and organ systems. Specifically, within the RAAS, aldosterone preferentially increases renal tubular luminal Na+ transport via increasing apical Na+ permeability. 74 Furthermore, SBP and DBP are inversely related to RAAS activity (ie, BP decreases with more RAAS activity) and reflect Na+ retention. 74 The influence of the beta-adrenergic receptors on renal Na+ handling and BP demonstrates the important functional role-played in HTN.
Cumulatively, these data suggest HTN is a multifactorial disease comprised of multiple organ systems and pathways. Most recent studies have been monogenic and operate on the assumption of the efficacy of an “on/off” approach to regulation of the aforementioned pathways.18,28,19,75,76 Although the present study has built on previous monogenic studies, the results are mixed. In particular, while we see an average drop in BP if a patient is on a drug that we mathematically predict (although this did not reach statistical significance for some and the primary effect was localized to β-blockade, diuretic, and ARB use), there is no clear pattern of number of visits/BP control. This may be due to the varying dose and timing of prescriptions, duration of drug class use, and the various drug classes have different follow-up laboratory tests needed for treatment. Therefore, the influence on clinic visits/BP control may have less to do with the drug class predicted and the drug class itself. In addition, because we see the largest effect in the “less complex” organ systems, or those with many previous studies, it is likely that an algorithm needs to be more complex to account for integrative physiology. For instance, the ADRB1 and ADRB2 genotypes have been heavily studied and have a general consensus to functionality while ARB is on the mathematical end of the RAAS (ie, ARBs modulate the action of AGT and therefore the functionality of RAAS), making it a better target for “summation” for prediction. In contrast, many of the genotypes within the renal system have fewer peer-reviewed studies and previous findings on ACE are mixed. The present study demonstrates drug class and dosing algorithms for BP therapy should be based on which and how many functional genotypes are present in the organ systems modulating BP in HTN patients. These algorithms should then be weighted based on genotype effect size to more accurately predict BP response to individual drug classes.
Limitations
Given the retrospective nature of this trial, we were not able to determine the effectiveness of one drug class over another drug class. Importantly, patients were on an average of 1.78 ± 0.08 medications. Although we assessed the best first choice in these patients, it is possible that the additional therapy had an effect on BP. Future studies should focus on monotherapy (if performed in a retrospective nature) and in a randomized control design to allow for selection of one drug over another in a priori manner. In addition, this was a relatively small sample size that was heterogeneous in nature. Future, larger studies could control for variables that may influence BP in addition to genetics.
Conclusion
Hypertension is a multifactorial disease modulated by multiple susceptibility genes, suggesting a strong genetic determinant to the response of HTN to therapies. Furthermore, research has identified genetically targeted monotherapy on BP response to have an effectiveness of ~50%. 1 Our data further support the general ineffectiveness of BP pharmacotherapy using simple genotype scoring as a guideline. Although we did demonstrate some meaningful and statistically significant effects using our simple prediction technique, we also demonstrated little or no difference between patients who are on their genetically recommended therapy and patients who are not in some of the outcome variables. These findings suggest a move in the right direction (ie, beyond one gene/one pharmacotherapy); however, continued evolution towards an even more logical multigene weighting approach to therapy may result in even tighter BP control, particularly when compared to the standard HTN approach.
Supplemental Material
Supplementarytables – Supplemental material for The Effect of Genetically Guided Mathematical Prediction and the Blood Pressure Response to Pharmacotherapy in Hypertension Patients
Supplemental material, Supplementarytables for The Effect of Genetically Guided Mathematical Prediction and the Blood Pressure Response to Pharmacotherapy in Hypertension Patients by Eli F Kelley, Thomas P Olson, Timothy B Curry, Ryan Sprissler and Eric M Snyder in Clinical Medicine Insights: Cardiology
Footnotes
Funding:
The author(s) disclosed receipt of the following financial support for the research, authorship, and/ or publication of this article: The study was supported by funds from Geneticure Inc which has developed multigene panels for blood pressure prescribing using pharmacogenetics. The results of the study are presented clearly, honestly, and without fabrication, falsification, or data manipulation. Publication of this study does not represent an endorsement of Geneticure from this journal or any professional organization.
Declaration of Conflicting Interests:
The study was supported by funds from Geneticure Inc which has developed multigene panels for blood pressure prescribing using pharmacogenetics. Eric M Snyder, Thomas P Olson, Timothy B Curry, and Ryan Sprissler have significant financial interest in Geneticure Inc. Eli F Kelley declares that he has no conflict of interest.
Author Contributions
Conceptualization, EMS, TPO, and RS; Data analysis, EMS, TPO, TBC, and RS; Manuscript drafting and submission, EFK, EMS, TPO and RS. No member from Geneticure was involved in data collection. The study was conducted in a blinded manner by a third-party research organization (RCRI, Inc.).
Supplemental Material
Supplemental material for this article is available online.
References
Supplementary Material
Please find the following supplemental material available below.
For Open Access articles published under a Creative Commons License, all supplemental material carries the same license as the article it is associated with.
For non-Open Access articles published, all supplemental material carries a non-exclusive license, and permission requests for re-use of supplemental material or any part of supplemental material shall be sent directly to the copyright owner as specified in the copyright notice associated with the article.