
Abstract
Introduction
This study quantifies the impacts of strengthening 2 tobacco control policies in “Tobacco Nation,” a region of the United States (U.S.) with persistently higher smoking rates and weaker tobacco control policies than the rest of the US, despite high levels of support for tobacco control policies.
Methods
We used a microsimulation model, ModelHealthTM:Tobacco, to project smoking-attributable (SA) outcomes in Tobacco Nation states and the U.S. from 2022 to 2041 under 2 scenarios: (1) no policy change and (2) a simultaneous increase in cigarette taxes by $1.50 and in tobacco control expenditures to the CDC-recommended level for each state. The simulation uses state-specific data to simulate changes in cigarette smoking as individuals age and the health and economic consequences of current or former smoking. We simulated 500 000 individuals for each Tobacco Nation state and the U.S. overall, representative of each population.
Results
Over the next 20 years, without policy changes, disparities in cigarette smoking will persist between Tobacco Nation and other U.S. states. However, compared to a scenario with no policy change, the simulated policies would lead to a 3.5% greater reduction in adult smoking prevalence, 2361 fewer SA deaths per million persons, and $334M saved in healthcare expenditures per million persons in Tobacco Nation. State-level findings demonstrate similar impacts.
Conclusions
The simulations indicate that the simulated policies could substantially reduce cigarette smoking disparities between Tobacco Nation and other U.S. states. These findings can inform tobacco control advocacy and policy efforts to advance policies that align with evidence and Tobacco Nation residents’ wishes.
Introduction
In the past 2 decades, cigarette smoking has substantially declined in the United States (U.S.). Declines have been most dramatic among youth, with smoking among U.S. high-school aged youth falling from 28.5% in 1999 to 1.9% in 2021.1,2 Tobacco control policies have been effective in reducing combustible tobacco use, particularly policies that increase taxes on cigarettes and increase funding for comprehensive tobacco control.3,4 However, tobacco control policy implementation and subsequent reductions in tobacco use have not occurred equally nationwide, leading to increased geographic and sociodemographic disparities in cigarette smoking.5-9
Thirteen U.S. states in the South and Midwest – termed “Tobacco Nation” – consistently rank in the highest 25% of tobacco use prevalence among all 50 states, based on Behavioral Risk Factor Surveillance System (BRFSS) data: Alabama, Arkansas, Indiana, Kentucky, Louisiana, Michigan, Mississippi, Missouri, Ohio, Oklahoma, South Carolina, Tennessee, and West Virginia. 5 Tobacco control policies are less common in these states. In 2018, the average price of a pack of cigarettes was 19% lower in Tobacco Nation than the rest of the US, and only 2 of the 13 Tobacco Nation states banned smoking in workplaces, restaurants, and bars compared with 24 of the 37 non-Tobacco Nation states. 5 All states received funds from the Master Settlement Agreement, yet many states – including Tobacco Nation – did not allocate these funds toward tobacco control. 10
Residents of Tobacco Nation support tobacco control policies. 11 For example, a survey conducted in late 2017 found that 73% of adults in Tobacco Nation supported a ban on smoking in restaurants, 61% supported a ban on the sale of tobacco products in stores near schools, and 60% supported a requirement for tobacco retailers to be licensed. 11 While support for tobacco control policies is high, several Tobacco Nation states preempt enactment of local tobacco control policies that are more stringent than state-level policies, proscribing local authorities from enacting policies their residents support.12,13
Without increased adoption of strong tobacco control policies, it is likely these states will sustain disproportionately high rates of smoking and smoking-attributable (SA) disease and mortality.5-9,14 The extent to which disparities between Tobacco Nation and the rest of the U.S. could be reduced by key tobacco control policies can be estimated using simulation modeling. Maciosek et al (2015) previously provided state-level estimates of health and economic outcomes of tobacco policies in the Community Health Advisor online tool by scaling results from the initial national version of ModelHealthTM: Tobacco microsimulation model by state population characteristics that effect smoking behaviors. 15 Similarly, the Tobacco Control Policy tool provides state-level estimates of policy effects on adult smoking prevalence and mortality by scaling a national model to reflect each state’s smoking status and population size by age and sex.16,17
This study provides the first estimates of the effect of eliminating the gap in smoking between Tobacco Nation states and other states through 2 evidence-based policies. To our knowledge, it is the first study to quantify the potential for tobacco control policies to reduce regional disparities in the harms caused by use. Specifically, we project the impact of 2 effective tobacco control strategies – increased cigarette tax and increased tobacco control expenditures – over 20 years in Tobacco Nation compared to the rest of the US. We provide tailored estimates by incorporating state-specific estimates of initiation, cessation, incidence of SA disease and mortality, differences in state medical care spending and income, and current cigarette price and tobacco control expenditures. We provide estimates of smoking status, SA disease and death, SA medical costs, and productivity for each Tobacco Nation state to inform its policy options.
Methods
We simulated the combined impact of increasing state tobacco taxes by $1.50 in each Tobacco Nation state and simultaneously increasing each state’s tobacco control expenditures to CDC-recommended levels. Below, we briefly describe the “intensified policy” scenario and “no policy change” comparison scenario, and the microsimulation model that generate state-specific policy impact estimates. These are described in more detail in Supplements 1 and 2, respectively.
Simulation scenarios
We obtained the average price of a pack of cigarettes in each state in 2021 from The Campaign for Tobacco Free Kids (CTFK). 18 In the no policy change, we presumed prices will only increase at the rate of inflation. In the intensified policy scenario, we assume the $1.50 tax adds $1.50 to the point-of-sale price. We identified studies that reported price elasticities (the percent change in smoking prevalence per 1% change in price).19-36 We determined the relative risk of smoking initiation for youth (defined in this study as individuals 12-17) and young adults (ages 18-24) implied by the estimated elasticities, and the relative risk of smoking cessation for adults 25 or more years of age. We assumed that the tax has an ongoing effect on initiation as youth cohorts age into years at risk for initiation and are exposed to higher cigarette prices. We conservatively assumed that the tax increase has a one-time only effect on adult cessation rates in the year the tax is introduced and has no effect on the probability of relapse.
We obtained total appropriations for tobacco control from the University of Illinois at Chicago Health Policy Center (UIC) from the CDC State System. 37 As these data are not available from 2016 on, we added changes in state allocations since 2016 38 to project total appropriations through 2021. We inflation-adjusted appropriations to 2021 U.S. dollars using the Consumer Price Index for all Urban Consumers (CPI-U) 39 and we calculated per capita expenditures by state. In the intensified policy scenario, we assume each state increases tobacco control expenditures to CDC-recommended levels. 40
In Supplement 1 we identify literature that reports tobacco expenditure elasticities and estimates the implied relative risk of an expenditure change on initiation and cessation. For the no policy change scenario, we set future expenditures equal to each state’s 2021 per capita expenditure and used historical expenditures to tabulate discounted cumulative expenditures. As the simulation runs, cumulative expenditures are updated by adding expenditures in the current year and discounting previous years’ expenditures by an additional 25%. For the intensified policy scenario, we used historical expenditures to tabulate cumulative expenditures, and set future expenditures equal to each state’s CDC-recommended per capita expenditure.
We assumed that taxes and per capita expenditures are indexed to inflation to maintain effectiveness. CDC-recommended expenditures include expenditures for ongoing evaluation and redesign of state comprehensive tobacco control programs. Therefore, we assume that the increased, inflation-indexed expenditures maintain effectiveness over time.
Simulation model
We adapted an existing microsimulation model, ModelHealthTM: Tobacco model using Java software. The model was constructed for the US as whole41,42 and previously was adapted to retrospectively assess the impact of comprehensive tobacco control in Minnesota.43-45 The model and model inputs are described in Supplement 2.
Demographics and smoking status
The model simulates annual changes in smoking status (never: did not report did not report 100 days of smoking in their lifetime; current: currently smokes everyday or some days and has smoked at least 100 cigarettes in their lifetime; former: does not currently smoke and has smoked at least 100 cigarettes in their lifetime) and estimates the resulting health and economic consequences. We simulated individuals ages 12 and older representing age, sex, race-ethnicity, educational attainment and poverty distributions of each state. 46 For most states, youth smoking status (currently smokes or not) by age, sex and race-ethnicity was estimated from logistic regression from 2019 Youth Risk Behavior Surveillance System (YRBSS). 47 We created similar estimates from published summaries of the 2018 Indiana Youth Tobacco Survey 48 and Ohio Youth Risk Behavior Survey/Youth Tobacco Survey 49 because 2019 YRBSS data for those states are not included in CDC-distributed data. Similarly, using multinomial logistic regression, we estimated adult cigarette smoking status (never, current, former) by demographic characteristics from BRFSS surveys. 50 Combined 2016 to 2019 surveys were used to increase the analytical sample, and estimates from combined surveys were then rescaled to 2019. Regression was used rather than direct descriptive statistics in this and other instances to create more robust model inputs for strata that remain small even after combining years of data (eg a single year of age for 1 sex in a race-ethnicity group that is not well represented in data for a state). We validated the accuracy of regression-based probabilities by comparing them to descriptive probabilities for larger population groups (eg over a range of ages and for all individuals in a race-ethnicity group within a state). We estimated annual relapse probabilities after a quit of at least 6 months from literature as described in Supplement 2.
Smoking-attributable disease events
The model simulates SA diseases identified in Smoking-Attributable Mortality, Morbidity, and Economic Costs (SAMMEC) as updated in 2014. 3 These conditions span cancers, cardiometabolic diseases, and respiratory disease. We obtained incidence and deaths from SA cancers by state, sex, and race/ethnicity from data that inform the US Cancer Statistics Data Visualizations Tool. 51 We obtained deaths for other SA conditions from Detailed Mortality Data. 52 We used hospitalizations to measure annual cardiometabolic and respiratory disease incidence. We assigned hospitalization rates for each state’s Census Division as tabulated from the 2018 National Inpatient Sample from the Healthcare Cost and Utilization Project (HCUP). 53
The simulation model determines whether an individual has a SA disease event and whether that event is fatal. For fatal events, the simulation applies a probability of death in each of the next 10 years. The probabilities for each of these steps reflect differences by demographic characteristics and either state or census region as allowed by available data. Incidence and mortality rates in national data sets are not reported by smoking status. We disaggregated cancer incidence and hospitalization rates into 3 smoking status categories (people who never smoked, formerly smoked, and currently smoke) using standard attributable-risk calculations54-56 and relative risks of mortality of people who currently smoke and formerly smoked relative to people who never smoked from the 2014 Surgeon General’s Report. 3 Thus, prevented events with policy change in model reflect 1 of 2 scenarios: (1) a policy prevented someone from smoking initiation so that person never suffered the SA event or (2) a policy resulted in earlier cessation, so the person who smoked was able to reduce their risk of SA events.
Quality-adjusted life years (QALYs) were computed for each year by assigning a utility value of .87 for each year lived without a SA condition and lower values for each year lived with each SA condition.
Economic outcomes
Smoking-attributable medical costs are determined by comparing medical costs of people who report current and former smoking compared to costs of people who report never smoking. For each state, we multiplied national estimates of SA costs for people who currently smoke by the ratio of state to US per capita healthcare expenditures 57 and adjusted these costs to 2021 US dollars using the medical care component of the CPI-U. 39 Smoking−attributable medical costs of people who formerly smoked are assigned by conservatively assuming an average time since quit of 5 years and using a function of the difference in mortality risks between people who report current vs former smoking by time since quit that we estimated from a report by the Congressional Budget Office (CBO). 58
Productivity losses in the model include market and non-market production lost to premature death, absenteeism, and presentism in the workplace, and in non-market production. The model assigns age-group specific market and non-market production for each year of life based on Grosse et al. 59 We adjusted their estimates to account for differences in absenteeism, presenteeism and non-market productivity by smoking status using averages derived from 3 studies.60-62 Finally, these adjusted productivity estimates are scaled to each state by the ratio of state to U.S. median individual earnings. 63
Conducting the simulation and sensitivity analysis
We compared outcomes in the intensified policy scenario and the no policy change scenario to estimate combined policy effects. Policies effects were estimated multiplicatively with no assumptions regarding synergistic or competing effects, which produces a lower effect of combined polices than would an additive approach.
For every state, we conducted 30 pairs of simulations of 500 000 individuals for the intensified policy baseline scenarios with a different random number sequence for each of the 30 pairs. To discern rare outcomes, such as cancer cases prevented in a single year, or by demographic subgroups, the model uses the same random number sequence in each scenario. This ensures that the difference between the scenarios is attributable only to policy effects. We report the standard deviation among the 30 pairs of policy intensification/no-policy intensification simulation runs with different random number sequences for each pair to indicate how likely differences in effects between states are due to differences between states and not to a particular random number sequence.
We used each state’s 2021 population to compute weighted Tobacco Nation average effects. We then computed a non-Tobacco Nation state average as the difference between the U.S. results and the Tobacco Nation average, weighted by state population size. We also report state totals by scaling results to each state’s 2021 population. 64
Internal validation ensured that differences in model outputs were consistent with changes to model inputs in model-testing sensitivity analyses and with differences in inputs among states and demographic groups.
Results
Policy values and initial smoking prevalence.
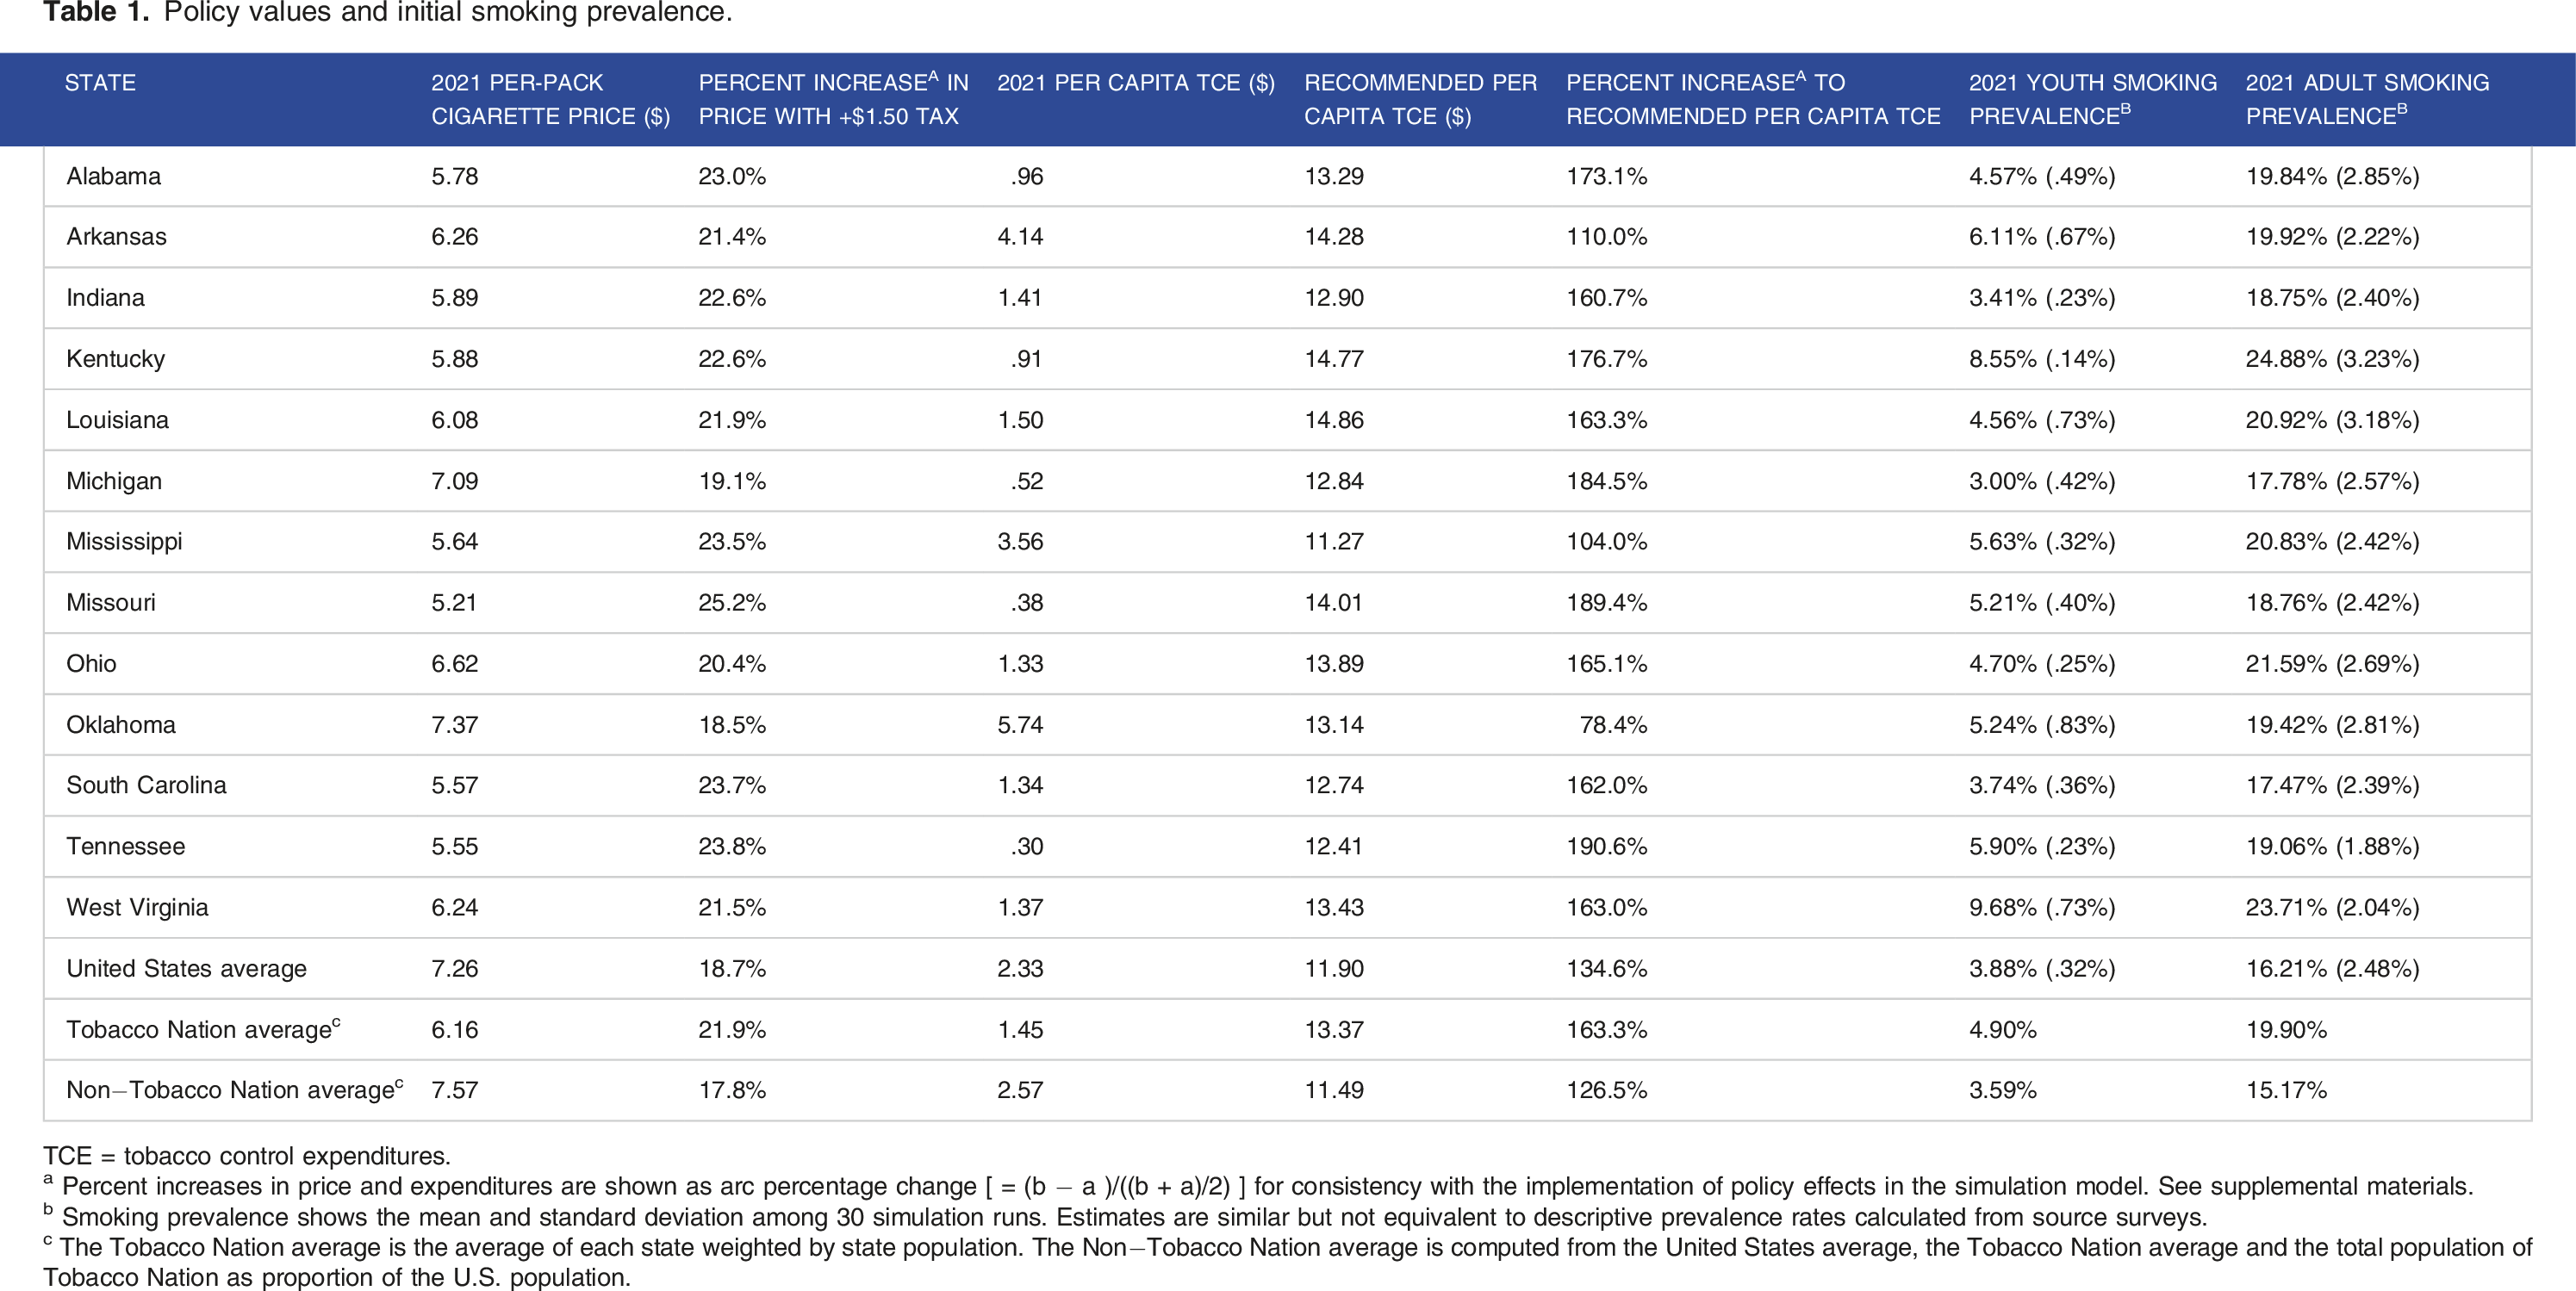
TCE = tobacco control expenditures.
a Percent increases in price and expenditures are shown as arc percentage change [ = (b − a )/((b + a)/2) ] for consistency with the implementation of policy effects in the simulation model. See supplemental materials.
b Smoking prevalence shows the mean and standard deviation among 30 simulation runs. Estimates are similar but not equivalent to descriptive prevalence rates calculated from source surveys.
c The Tobacco Nation average is the average of each state weighted by state population. The Non−Tobacco Nation average is computed from the United States average, the Tobacco Nation average and the total population of Tobacco Nation as proportion of the U.S. population.
Figure 1 compares the predicted Tobacco Nation trends in smoking status in the baseline and policy-intensification scenarios. Trends for individual states and the US are shown in Supplement 3. The simulation predicts that adult current and former smoking will continue to decline in these states, even without policy change, largely because youth cohorts with lower initiation rates slowly replace older cohorts that had higher youth initiation rates. The simulation predicts that implementing the combined policies in each state would reduce average Tobacco Nation adult smoking by an additional 3.49 percentage points after 20 years (range 1.56% to 5.53%). Former smoking is predicted to increase and then resume the downward trend driven by cohort replacement. As expected, former smoking increases with intensified policies while current smoking declines. Smoking prevalence, tobacco nation average.
20-year combined effect of $1.50 price increase and tobacco control expenditure increase to CDC recommended level, per million persons in 2021; means (standard deviation) of simulations for 30 random number seedsa.

aResults are scaled to State total populations in 2021. The population size changes each year in the model.
b The Tobacco Nation average is the average of each state weighted by state population. The Non−Tobacco Nation average is computed from the United States average, the Tobacco Nation average and the total population of Tobacco Nation as proportion of the U.S. population.
Kentucky and West Virginia are predicted to experience larger benefits per million persons from intensified policies due to high adult smoking prevalence. Tennessee has the highest expenditure increase and second-highest price increase. Michigan, Missouri, and Ohio also experience high predicted benefits per million residents. In these states, drivers of higher benefit are partially offset by factors that point to a lower benefit. Michigan would have the third largest percent increase in expenditure with intensified policies but would have the second lowest percent increase in cigarette price and has the third lowest starting adult prevalence rate. Missouri would have the largest percent increase in cigarette price and the second largest percent increase in expenditures, but starts with relatively low smoking prevalence. Ohio starts the simulation with the third highest adult smoking prevalence, but also starts with a relatively high tobacco price. Oklahoma is predicted to have the lowest reduction in harms from intensified policies because initiation and cessation rates in the state reflect a $1.00 tax increase in 2018 and relatively high tobacco control expenditures.
20-year combined effect of $1.50 price increase and tobacco control expenditure increase to CDC recommended level for total population in 2021 a ; means (standard deviation) of simulations for 30 random number seeds.

aResults are scaled to State total populations in 2021. The population size changes each year in the model.
Sensitivity analysis
Detailed sensitivity analysis results are provided in Supplement 5. Tobacco control expenditure elasticities, baseline smoking cessation probabilities, the baseline incidence of SA disease, and price elasticities most strongly influenced results. When we simultaneously changed 3 variables in same direction, reductions in the harms of tobacco from policy change —as measured by deaths, QALYs, medical costs and productivity— could vary as much as 60%.
Discussion
This study provides results of the first multi-state simulation with state-by-state modeling and economic impact of tobacco control policies. Our results indicate that tobacco use is projected to continue declining, particularly among adults, over the next 20 years. However, in the absence of policy change, disparities will persist between Tobacco Nation and the rest of the US. While all states can make substantial gains by increasing cigarette taxes and tobacco control expenditures, the predicted impact in Tobacco Nation states is approximately twice that of other states. This underscores the critical importance of better aligning state policy with CDC recommendations. 5
We are not aware of studies that have compared the potential impact of the same policy among U.S. states or regions. Prior studies have provided estimates of increasing taxes and/or comprehensive tobacco control programs in individual states. Notably, the SimSmoke model has been adapted to Arizona, California, Kentucky, Louisiana, Michigan and Minnesota.4,65-70 While direct comparisons of results among studies are not possible due to differing time periods and policy scenarios, the general magnitude of results is consistent with our findings. Other simulation models have assessed state tobacco policy in California and Minnesota,44,71,72 and econometric models have been used to assess tobacco policy in Arizona, California and Florida.73-76
The simulations predict that adult smoking prevalence in the U.S. will fall to 8.4% over the next 20 years, while the adult smoking prevalence in Tobacco Nation will only fall to 12.0%, unless policies change. However, by simultaneously increasing tobacco taxes by $1.50 and increasing tobacco control expenditures to CDC-recommended levels, smoking prevalence in Tobacco Nation states would fall to 8.5% and virtually eliminate the defining characteristic of Tobacco Nation. Importantly, our simulations indicate that no Tobacco Nation state will achieve an adult smoking rate equal to or lower than the U.S. average over 20 years without significant policy change. Further, without these changes, the simulation predicts that in Kentucky, Ohio, and Tennessee, youth smoking rates will either not change or decline only very slightly.
Depending on current smoking rates, tobacco control policies, and state population size, policy effects vary. States with the lowest tobacco control expenditures and cigarette taxes at baseline are likely to experience the largest impacts, as the policies would result in the greatest percentage increase in cigarette pack price and tobacco control expenditures. States with the highest smoking rates also would experience greater changes in the simulated health and economic outcomes. Further, states with large populations, such as Michigan and Ohio, have the largest potential to reduce the population harms of tobacco. Finally, although these policies would have about twice the impact on health and economic outcomes in Tobacco Nation, it should be noted that all U.S. states’ expenditures for comprehensive tobacco control are below CDC’s recommended levels and could substantially reduce tobacco harms by increasing expenditures.
The benefits that would be realized from intensified policies over the next 20 years are likely just the beginning. Using a similarly constructed single-state simulation model, we predicted that the health and economic benefits to Minnesota from reducing smoking from 1998 to 2017 would be 2 to 4 times higher in the subsequent 20 years (2018 to 2037) than in the initial 20 years.43,45 Additionally, local adoption of stronger tobacco control policies would result in further reduction in harms of tobacco in Tobacco Nation. However, jurisdictions in several Tobacco Nation states are unable to enact such policies due to preemption at the state level. Recently, Tennessee passed a bill to remove preemption that prevents local governments from prohibiting smoking in age-restricted venues that are not retail tobacco stores. 77 Continued efforts to enable local tobacco control policies could lead to increased adoption of such policies in Tobacco Nation, further reducing tobacco harms.
The accuracy of simulation models is limited by the accuracy of model inputs and necessary simplifications of the complex interactions of behaviors and environment. In sensitivity analysis, we explored which limitation may be most influential. The price and expenditure elasticities we used may be inaccurate. A wide range of price elasticity estimates exist in the literature. We averaged available elasticity estimates to use estimates aligned with the broader literature. As described in Supplement 2, interpolation and extrapolation were sometimes necessary. For example: to avoid use of small cell sizes, smoking status was interpolated through statistical regression rather than by using descriptive statistics; the U.S. age distribution of cancer cases by sex and race-ethnicity was applied to statewide cancer counts by sex and race/ethnicity to derive age-group specific cancer rates for each state; and cancer rates for Hispanics in Kentucky were extrapolated from U.S. rates because they are not reported. In addition, we used the same price and expenditure elasticities for all states without adjustment for demographic or environmental factors. Despite these and other necessary simplifications, the relative magnitude of results between Tobacco Nation states is consistent with our expectations, given state baseline cigarette prices, tobacco control expenditures and smoking prevalence. Nevertheless, any point estimate embeds false precision. Plausible ranges of estimates should be considered as indicated by sensitivity analyses.
Our study highlights substantial health and economic benefits of strengthening tobacco control policies, particularly in U.S. states with the highest smoking rates and weakest policies. Further, our results demonstrate the urgency to enact such policies in states most affected by the harms of tobacco. In the absence of strengthened policies, these states will continue to experience disproportionate harms. Tobacco control practitioners and policymakers in Tobacco Nation can use these findings to advocate for increased taxes and tobacco control expenditures, among other strong tobacco control policies, to reduce geographic disparities in the US.
Supplemental Material
Supplemental Material − Illuminating a Path Forward for Tobacco Nation: Projected Impacts of Recommended Policies on Geographic Disparities
Supplemental Material for Illuminating a Path Forward for Tobacco Nation: Projected Impacts of Recommended Policies on Geographic Disparities by Michael Maciosek, Emily M Donovan, Amy LaFrance and Barbara A Schillo in Tobacco Use Insights
Footnotes
Acknowledgements
The authors would like to thank Blaine Hardy for his support with the analysis conducted for this manuscript.
Author Contributions
DECLARATION OF CONFLICTING INTERESTS:
The author(s) declared no potential conflicts of interest with respect to the research, authorship, and/or publication of this article.
FUNDING:
The author(s) disclosed receipt of the following financial support for the research, authorship, and/or publication of this article: Support for manuscript was provided in part by the Robert Wood Johnson Foundation, Grant ID 78927. Robert Wood Johnson Foundation funds were awarded to MVM and ABF. The views expressed here do not necessarily reflect the views of the Foundation. The study was additionally funded by Truth Initiative.
Supplemental Material:
Supplemental material for this article is available online.
References
Supplementary Material
Please find the following supplemental material available below.
For Open Access articles published under a Creative Commons License, all supplemental material carries the same license as the article it is associated with.
For non-Open Access articles published, all supplemental material carries a non-exclusive license, and permission requests for re-use of supplemental material or any part of supplemental material shall be sent directly to the copyright owner as specified in the copyright notice associated with the article.