
Abstract
As in other excitable tissues, two classes of electrical signals are of fundamental importance to the functioning of smooth muscles: junction potentials, which arise from neurotransmission and represent the initiation of excitation (or in some instances inhibition) of the tissue, and spikes or action potentials, which represent the accomplishment of excitation and lead on to contractile activity. Unlike the case in skeletal muscle and in neurons, junction potentials and spikes in smooth muscle have been poorly understood in relation to the electrical properties of the tissue and in terms of their spatiotemporal spread within it. This owes principally to the experimental difficulties involved in making precise electrical recordings from smooth muscles and also to two inherent features of this class of muscle, ie, the syncytial organization of its cells and the distributed innervation they receive, which renders their biophysical analysis problematic. In this review, we outline the development of hypotheses and knowledge on junction potentials and spikes in syncytial smooth muscle, showing how our concepts have frequently undergone radical changes and how recent developments hold promise in unraveling some of the many puzzles that remain. We focus especially on computational models and signal analysis approaches. We take as illustrative examples the smooth muscles of two organs with distinct functional characteristics, the vas deferens and urinary bladder, while also touching on features of electrical functioning in the smooth muscles of other organs.
Introduction
In excitable tissues, ie, nerves and muscles, electrical signaling underpins much of the ultimate function of these tissues, such as information coding in neurons and contractile activity in muscle. Some excitable tissues are syncytial in nature, ie, the constituent cells in them are interconnected to one another, often along all 3 spatial dimensions.1,2 The coupling is mediated by cell-to-cell communication pathways known as gap junctions, which constitute electrical pathways of high conductance that serve to form functionally cohesive bundles of cells.
The electrophysiology of such syncytial tissues as smooth and cardiac muscles has consistently been more challenging to study than that of non-syncytial tissues. This owes principally to the experimental difficulties involved in making precise intracellular electrical recordings from smooth muscles, using which junction potentials and spikes occurring in cells embedded in their native microenvironment are recorded, and also to two inherent features of this class of muscle, viz, distributed innervation and gap junction coupling. When electrical recordings are obtained from syncytial tissues, their interpretation in terms of tissue electrical properties often rests on uncertain ground. Electrical properties of syncytia, in their turn, are complex and poorly understood compared with those of cells that are electrically isolated from one another. For instance, even the subthreshold depolarizing electrical responses elicited in smooth muscles during neurotransmission, the excitatory junction potentials (EJPs), analogous to synaptic potentials in neurons, have long been incompletely understood, and this uncertainty extends to the supra-threshold activity manifested in action potentials (APs), or spikes, as well. 3 Consequently, in many cases, the electrophysiology continues to be explored at the phenomenological level rather than the analytical level.
In this review, we will be delineating some of the recent progress made in comprehending the origins and attributes of these signals. For each class of signal, ie, junction potentials and spikes, we will take up in some detail the example of an organ that best illustrates these ideas—the mammalian vas deferens in the case of junction potentials, and the urinary bladder for questions pertaining to smooth muscle spikes—while also touching on other smooth muscles wherever relevant. We will discuss how analysis of junction potentials has helped in inferring electrical properties of smooth muscle cells (SMCs) and features of neurotransmitter release from presynaptic neurons, while analysis of spikes has helped in forming deductions on propagation pathways within the tissue and on foci of excitation.
In contrast to smooth muscles, the processes involved in neurotransmission at skeletal muscle and in many neurons have been rather thoroughly elaborated4,5 starting from the end-plate potential (EPP) down to the gating properties of the transmitter activated receptor-ion channel complex and the explanation of the end-plate currents (the synaptic currents in skeletal muscle) in terms of channel functions.6,7 However, in recent years, considerable progress has been made in our understanding of the generation of smooth muscle evoked EJPs (eEJPs) as well as the membrane currents underlying them. Some of this owes to the application of novel electrical recording methods to smooth muscle8,9 and some to theoretical and computational modeling works. This article aims to review the development of the several emergent interesting observations and hypotheses that have emanated from these lines of work. To set them in context, the historical development of ideas on the electrical properties of smooth muscles will first be outlined. This will include a discussion of the “cable” properties of smooth muscle, and the factors determining current spread and membrane potential development during eEJPs. Attention will principally center on the properties of sympathetically innervated smooth muscle, particularly the vas deferens, which has provided an interesting and fruitful territory of research. Furthermore, the urinary bladder smooth muscle (the detrusor smooth muscle or DSM) has in recent years been the focus of considerable computational modeling efforts, and these will be reviewed. Action potentials in smooth muscles are highly varied and complex between (and in some cases within) organs.2,10 To exemplify these complexities, we will consider the spikes recorded in DSM. Before elaborating these details, we begin with a brief overview of syncytial smooth muscles and their salient properties, to furnish the reader with a broad perspective on the diversity of signals and mechanisms that underlie their generation.
Syncytial Smooth Muscle Tissues
In this section, we attempt to provide a short overview of several examples of syncytial smooth muscle tissues while also briefly outlining the role that cell-to-cell communication plays in them. Several different syncytial smooth muscle tissues are found in the mammalian body, contributing to a wide variety of physiological functions. For purposes of description, we shall discuss them as parts of the systems in which they are involved in:
Respiratory system: Airway smooth muscles, such as tracheal smooth muscle and bronchial smooth muscle, are known to form electrical syncytia by means of gap junctions. 11 The gap junctions are reported to play an important role in the regulation of contractions in airway smooth muscle in response to physiological stimuli. 12 It has also been proposed that altered gap junctional behavior could contribute to bronchial asthma and thereby present a target for its treatment.
Digestive system: Intestinal smooth muscles are known to operate as an electrical syncytium. Interstitial cells of Cajal (ICCs) are reported to act as pacemaker cells, which generate slow waves that spread through the stomach and the small intestine owing to the syncytial nature of these tissues. This provides electrical rhythmicity within the gastrointestinal tract, 13 resulting in peristaltic motion necessary for the movement of food through the tract. Ileal smooth muscle, colonic smooth muscle, taenia coli, and gastric smooth muscle are a few specific examples of syncytial smooth muscle tissues found here.
Reproductive system: Several examples of syncytial smooth muscles can be cited in the reproductive system, such as uterine smooth muscle, vas deferens, corporal smooth muscle, and the mesotubarium. Myometrial cells in the uterus are coupled to one another to form an electrical syncytium. The extent of this coupling is reported to be poor during most of pregnancy, in accordance with the physiological requirement of muscle quiescence.14,15 But at term, with the need for coordinated contractions, the extent of coupling between cells significantly increases resulting in a vastly more effective functional syncytium. 16 In vas deferens, the presence of the electrical syncytium is believed to be necessary for coordinated neurogenic contractions to allow sperm transport. Only a small fraction of the cells is directly innervated, and not all of the varicosities on the terminal axons are activated by each presynaptic AP, owing to the low probability of evoked transmitter release. 17
Excretory system: Studies have shown that the DSM of the urinary bladder wall behaves as an electrical syncytium. 18 The extent of coupling is reported to be less than those in other syncytial tissues.19,20 This fits into the dual role of the urinary bladder, where localized contractions are required to maintain bladder tone during the filling phase, and coordinated contractions ensue from concerted parasympathetic excitation during the voiding phase. In the case of ureter smooth muscle, it has been demonstrated that it behaves as an electrical syncytium and is responsible for ureteral peristalsis. 21 The smooth muscle of the urethra is another example of syncytial tissue in this system. 22
Others: Several other examples of syncytial smooth muscle tissues exist in the body. For example, the cells of the iris sphincter and iris dilator smooth muscle of the eye, managing the constriction and dilation of the pupil, respectively, are reported to be tightly coupled electrically. 23 The formation of functional syncytia by means of gap junctions throughout the vascular tree is another such example.
The above examples, though numerous, do not constitute an exhaustive listing of all syncytial tissues found in the body. It may be noted that in morphological terms, many of the examples constitute tube-like structures, while some others form hollow “balloon-like” structures. Each demonstrates the distinct role played by syncytial tissues in their respective systems in terms of producing coordinated activity by interacting with other neighboring cells.
Syncytial Nature of Smooth Muscle and Its Innervation
The first indications that smooth muscles cells are electrically interconnected to one another to form a “three-dimensional syncytium” came from studies that showed that current injected into smooth muscle can flow, and membrane potential changes can be recorded, over distances in the tissue that are considerably greater than the average cell length.24–28 Such spread of current and potential was held to occur through pathways of low electrical resistance connecting individual cells.2,26,29,30
The mode of innervation of smooth muscle by autonomic nerves is also quite remarkable. The innervation pattern in many smooth muscle organs is of the “distributed” sort (Figure 1), where each cell may receive input from presumptive release sites (periodic axonal swellings known as varicosities) present on more than 1 terminal nerve fiber, and any given terminal fiber may supply several cells. 24 Consequently, there is a meshwork of innervation that has been termed the “autonomic ground plexus,” varicose in appearance. Some smooth muscle cells receive “close-contact” innervation by varicosities (contact distance <20 µm) while others receive “loose-contact” innervation (contact distance of 50-200 µm).24,31 Such an arrangement is in contrast with the innervation of skeletal muscle, where each skeletal muscle cell receives a sharply localized innervation from a somatic motor neuron that forms a discernible “end-plate” where neurotransmission occurs (Figure 1).4–6 Moreover, each skeletal muscle fiber is supplied by the terminal branch of just one somatic motor axon and usually features just one end plate.

Comparison of patterns of innervation at the autonomic (top) and skeletal (bottom) neuromuscular junctions. Smooth muscle cells are shown relatively shortened in length (eg, in relation to their own and varicosity diameter) for purposes of illustration. E indicates end plate; G, gap junction coupling; M, muscle cell; N, nerve fiber; V, varicosity.
Certain interesting electrical features of operation ensue from the electrical continuity between smooth muscle cells and their distributed innervations. For instance, neurotransmitter activated membrane potential transients, such as eEJPs or APs, recorded in a particular cell will embody not just the electrical response set up in that cell alone but also the activity of adjoining cells, passively or actively propagated to the recorded cell. Thus, spatial-temporal integration can occur in any given cell of junction potentials or APs over a discrete region of tissue. 27 The degree to which such “pick-up” occurs will be a function of the electrical conductivity of the gap junctions that interconnect the cells. Such intricacies have rendered it problematic to analyze electrical events in smooth muscles to the level at which they have been analyzed in tissues with electrically isolated cells: in skeletal muscle, for instance, the electrical responses of an individual muscle cell are independent of the responses of neighboring cells, and this has facilitated their more definitive characterization in exhaustive detail.
Passive Electrical Properties and Junction Potentials
The passive electrical properties of a cell or a tissue determine the transfer function and consequently its electrical response to any given input. These properties include, among others, the membrane resistance and capacitance, the cytosolic and extracellular resistivities, and the time and space constants.32–34 Thus, the amplitude, dynamics, and spatial spread of a synaptic potential depend strongly on the passive properties. So do AP characteristics such as the conduction velocity.34,35
In smooth muscle, as in other cells, the synaptic potentials (“junction potentials”) possess the canonical shape shown in Figure 2. They usually exhibit a relatively rapid rising phase and a slower, usually exponentially decaying falling phase. In many cell types, the falling phase of the junction potential decays with a time constant that equals the cell’s membrane time constant, τ m . This indicates that the junction potential decay is a purely passive electrical process. The active part of the process, ie, the neurotransmitter activated membrane current, is relatively brief. Its duration is often on the order of the rise time of the junction potential. Transmitter activated membrane current serves to discharge the membrane capacity and produce the rising phase of the junction potential, with the subsequent decay of the potential following the time course of passive recharging of the membrane capacity back to resting potential, at a rate determined by τ m .6,36 Thus, the time constant of decay, τdecay, of the junction potential equals τ m . This coincidence has afforded, in much electrophysiological work, a convenient rule of thumb for the estimation of τ m . 37

(A) Typical relationships between evoked and spontaneous junction potentials (a) in skeletal muscle cells and neurons, and (b) in smooth muscle. Spontaneous and evoked excitatory junction potentials in smooth muscle are the sEJP and eEJP. In skeletal muscle cells, they are termed the mEPP and eEPP. Note that in smooth muscle, the sEJP is briefer than the EJP but can be as large as the EJP. In skeletal muscle, the mEPP follows the same time course as the eEPP but has a smaller amplitude. (B) A sample recording from the smooth muscle of the guinea pig vas deferens, showing sEJPs and eEJPs as indicated. Evoked excitatory junction potentials occur following electrical stimuli delivered to the nerve, the instant of occurrence of each such being indicated by a white dot.
In smooth muscle, though, this notion has proven more difficult to examine. The previously mentioned properties of this tissue present confounding complications. One is that in a syncytium, τ m itself varies with the procedure adopted for determination. The estimation of τ m has been relatively straightforward in electrically simpler structures, especially those that approximate 1-dimensional (1D) cables, such as skeletal muscle fibers and axons. Rectangular pulses of current are injected at a point inside the cable, and the resulting membrane potential responses (the subthreshold or electrotonic responses) are measured at increasing distances from the point of injection.4,6 From the suite of electrotonic responses, not just membrane time constant τ m but also other passive parameters such as membrane resistance, membrane capacitance, and membrane space constant (λ m ) can be evaluated, by making use of the well-established properties of the cable equation.4,6
In contrast to this scenario, current injection at a sharp locus in the smooth muscle syncytium—which can take the form of injection through an intracellular electrode inserted into a single cell—gives rise to no detectable membrane potential change even in its immediate vicinity.27,38 This owes to the extremely rapid spatial fall-off of the injected current through the many ramifying, low-resistance pathways in three dimensions constituted by the intercellular gap junctions. As a consequence, when interrogated with intracellular current injection, smooth muscle does not exhibit cable-like behavior. However, when current is driven through the whole tissue (or strips of tissue) through large extracellular electrodes, smooth muscle does exhibit cable properties, with membrane potential changes now being recorded at appreciable distances from the locus of current injection.
Such whole-tissue or whole-strip polarizing current injection was first employed by Tomita26,27 and Abe and Tomita, 29 with the technique being christened the “partition stimulation” technique. Figure 3 shows the experimental setup for its deployment. Here, a cylindrical or quasi-cylindrical smooth muscle organ or strip is drawn through a circular hole of congruent diameter in a metallic plate (P1), with the plate forming a plane orthogonal to the long axis of the tissue. Plate P1 also divides the organ bath into two compartments electrically insulated from each other. Current is passed extracellularly between plate P1 and a second plate electrode (P2) installed in the stimulating compartment (S), while membrane potential transients are measured intracellularly in the adjacent zone, the recording compartment (R). As indicated in Figure 3, passive or electrotonic potentials can now be picked up in smooth muscle cells at distances up to a few millimeters from the plate. The work of Tomita and associates26,27,29 evidenced, through a quantitative evaluation of these responses, that the whole organ or strip behaves under these conditions as a 1D electrical cable.
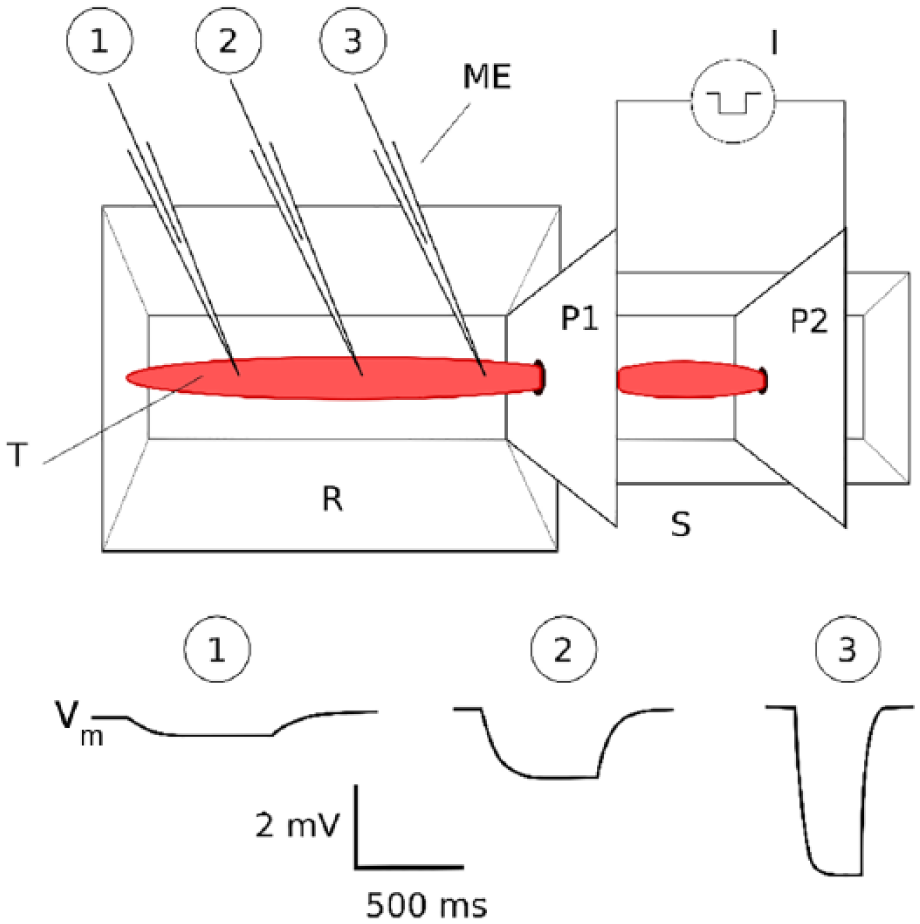
Partition stimulation technique used for investigation of smooth muscle cable properties. The scale is exaggerated: Vm responses may be recorded up to only a few millimeters from P1. Also there requires to be a close fit between the tissue and the hole in P1. Amplitude and time scales are appropriate for guinea pig vas deferens. I indicates current source; ME, intracellular microelectrode; P1, P2, metal plates for stimulation and partition; R, recording chamber; S, stimulating chamber; Vm, membrane potential responses at various distances from plate P1, recorded intracellularly.
The explanation advanced for this curious transformation of electrical behavior is that when external plate electrodes are used to polarize a smooth muscle tissue, it is driven to isopotential (or quasi-isopotential) along the two radial axes at the stimulation plate, so that no net current can flow along these axes. Injected current is thereby constrained to spread in 1 direction only, ie, along the longitudinal aspect of the tissue. As a result, the smooth muscle organ or strip now evinces cable-like properties along this dimension.26,27,30 Notable among these properties are (1) exponential decay of the asymptotic values of membrane potential with respect to distance from the polarizing plate and (2) conformity of the membrane potential dynamics at any given distance to the predictions of the linear 1D cable equations.
Subthreshold responses measured in this manner can be used to estimate certain passive electrical constants of the tissue, such as its time constant and space constant.27,39 Hyperpolarizing current is most often employed so as to obviate complications arising from insidious or frank nonlinearities in the depolarized regions near threshold. In the case of hyperpolarizing current, the development of membrane potential (Vm) with respect to both time (t) and space (x) is given by29,32

where X = x/λ m (here 0 < X < ∞); T = t/τ m ; x = distance from stimulating electrode; t = time from start of stimulation; and erf is the error function, given by

By setting the predictions of equation (1) against observed potential changes, one can substantiate the values of space constant and time constant obtained experimentally, and thus work out the tissue’s passive electrical properties. Such analyses have been carried out for the smooth muscle of taenia coli, 40 vas deferens,27,41 and urinary bladder. 18
Based on the responses to intracellular and extracellular polarizations, various suggestions, often conflicting, have been advanced about the factors determining the time courses of eEJPs, and the relationship of membrane potential change to membrane current, in smooth muscle. These hypotheses are reviewed below.
Analysis of Smooth Muscle Junction Potentials
Two kinds of excitatory potentials are recorded in the smooth muscle cells of the vas deferens42,43: the eEJP and spontaneous excitatory junction potential (sEJP), respectively (Figure 2A). The evoked and spontaneous excitatory junction potentials have been recorded in several autonomically innervated smooth muscles, but some of the most comprehensive analyses have been carried out on junction potentials at the sympathetic neuroeffector junction, especially in the vas deferens, and in its sympathetically innervated counterpart of the vasculature, ie, in small arteries and arterioles.
The sEJP, which occurs in the absence of nerve stimulation, is presumed to be caused by a single quantum of neurotransmitter released spontaneously from an axonal varicosity. The eEJP, by contrast, is a stimulation-evoked signal and is produced in response to the release of neurotransmitter throughout the autonomic ground plexus that occurs in the wake of nerve stimulation.44,45 The sEJP and eEJP signals are analogous, qualitatively, to the miniature and the stimulation-evoked end-plate potentials (mEPPs and eEPPs) recorded at the skeletal neuromuscular junction, which are produced, respectively, by the release of a single quantum of transmitter released spontaneously or by the synchronized release of several quanta following nerve stimulation 46 (Figure 2B). Important differences exist, however, as illustrated in Figure 2. In the realm of signal dynamics, the most striking difference is that while the mEPP and the eEPP exhibit similar kinetics, the sEJP and the eEJP differ by a factor of 5 to 10 in their time courses, with the eEJP being the more prolonged signal42,47 (Figure 2A).
Using the principle of comparison of τ m with τdecay of the junction potentials, the falling phases of the mEPP as well as the eEPP of skeletal muscle were shown to be determined by the passive properties of the skeletal muscle cell membrane. However, in initial studies, the decays of the sEJP and eEJP in the vas deferens were suggested by various researchers to reflect not τ m but the time course of membrane current.27,39,48–50 This was because initial estimates of τ m in the guinea pig vas deferens returned a value of ~100 ms, while the τdecay of the eEJP was observed to be ~300 ms.27,39,48–50 The deduction was made that because τm was too short to determine eEJP decay kinetics, the latter must be governed by prolonged neurotransmitter action. These investigations suggested that neurotransmitter action at the autonomic neuroeffector junction was fundamentally different from that in skeletal muscle.
Experimental studies
Subsequent to the studies just described, however, experimental evidence was presented which suggested a somewhat different picture for the eEJP. The most salient analysis was that of Bywater and Taylor 39 who reinvestigated the passive electrical properties of the guinea pig vas deferens. They showed that the estimation of membrane time constant depended critically on the respective lengths of tissue placed in the recording and stimulating compartments of the partitioned chamber. In particular, the calculated time constant was shown to be a considerable underestimate of its true value if less than 3 length constants of tissue were placed in the stimulating compartment.
After eliminating these sources of error, τ m was estimated with external polarization to be about 270 ms, 39 a value notably different from the previous estimate (100 ms). 27 This study also furnished an estimate of length constant λ m (~860 µm), a value markedly lower than the prior estimate of 1500 to 2600 µm. 27 Unlike the earlier value, the new estimate of τ m coincided with the time constant of decay of that in the guinea pig vas deferens. The decay of the eEJP appeared therefore to be dictated by the passive membrane properties of the smooth muscle cells. This would indicate a brief duration of transmitter activated current underlying the eEJP, in accord with the situation that obtains in other, non-syncytial cell types. Thus, the earlier notions on the biophysics of neurotransmission in smooth muscle had to be partially revised.
Theoretical studies
Smooth muscle syncytial properties have also been investigated from a theoretical standpoint.25–27 It was shown that if current were injected from a point source into the syncytium (as for the sEJP), then because of intercellular electrical coupling the charge introduced would dissipate away from the point of injection very rapidly, both spatially as well as temporally. 27 As a result, the time course of the membrane potential change at or near the point of current injection would be similar to that of the current itself. However, when current of the same time course is injected uniformly throughout the syncytium (as for the eEJP), spread of current is heavily restricted and the potential change that then develops is prolonged, lagging considerably behind the current. 25
Purves 25 obtained the time course of the eEJP by convolving the impulse response, h(T), of an isopotential circuit with the input, the transmitter activated current I(T)

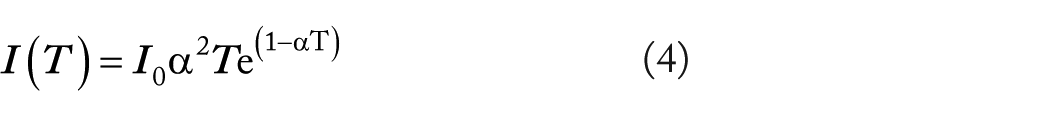
where Qo is the charge deposited instantaneously on the membrane capacity and Cm is the capacitance of unit volume of tissue, T is normalized time (t/τ m ), and α is a driving function which, as used in equation (4), generates waveforms very similar in shape to synaptic currents observed at a variety of synapses.25,34 In this event, the membrane potential response V(T) is given by V(T) = h(T) * I(T), the asterisk denoting the convolution operation. Solving the convolution integral gives us the essential part of V(T)

Simulation of V(T), using equation (5) corresponding here to the eEJP, shows that the eEJP is considerably prolonged compared with the injected current I(T). This is at variance with the earlier suggestions of prolonged transmitter action, and therefore injected current, during the eEJP. 27
Purves also derived an expression for the voltage transient during the sEJP. In this case, the impulse response h(T) is given by
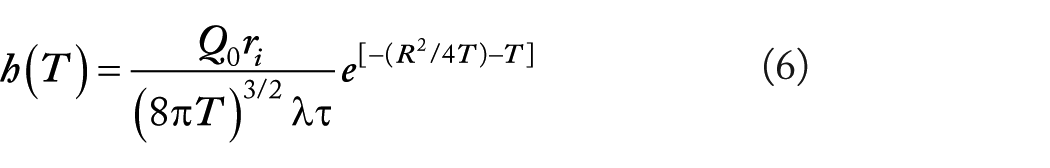
ri being the intracellular resistance per unit volume.
Equation (6) can be convolved with the expression for transmitter produced membrane current (equation (4)) and the voltage response derived. It was shown that the resulting voltage change is much briefer than that predicted for the isopotential eEJP and in fact follows closely the time course of the current itself. 25 This theoretical insight indicated, therefore, that whereas the eEJP is prolonged compared with its underlying membrane current, the sEJP follows the time course of the current.
In conclusion, while the decay of the sEJP reflects the time course of transmitter action, that of the eEJP reflects τ m . This is in contrast to skeletal muscle where both mEPP and eEPP decays reflect time course of transmitter action.
Action Potentials
In smooth muscle, unusual patterns of electrical activity are not confined to junction potentials; they manifest equally markedly in supra-threshold voltage signals, ie, the APs. These are the electrical entities which trigger off the mechanical responses of muscle tissues. Depending on the function of the smooth muscle tissue, the nature and pattern of the APs would vary. In this review, as mentioned earlier, we shall focus on the patterns of APs observed in the DSM cells, wherein several interesting observations have been made.
The APs in detrusor are designed to aid the two distinct phases of operation of the urinary bladder: (1) a filling phase where the urine is stored without significant change in intravesical pressure and (2) a voiding phase where the stored urine is squeezed out of the bladder through the urethra. The patterns of electrical activities observed in the DSM cells during these phases of operations are distinctly different. The filling phase is characterized by a completely autonomous, seemingly random production of spontaneous action potentials (sAPs) appearing asynchronously at various locations of the DSM without a definite focal point. The voiding phase, however, is under neuronal control during which a well-coordinated stimulation of the entire detrusor tissue is observed, generating the requisite forceful contraction starting from the bladder dome. We restrict our discussion to the electrical activities during the filling phase, which is comparatively more complex and harder to decipher.
The investigations so far conducted on the detrusor sAPs revealed that they can be of either neurogenic or myogenic origin.51,52 When the detrusor tissue was treated with α,β-meATP—a drug which abolishes the neurogenic sAPs by desensitizing P2X purinergic receptors—only 38% of the sAPs were abolished. 52 It is known that acetylcholine (ACh) and adenosine triphosphate (ATP) are only two neurotransmitters released by the varicosities present in the detrusor. 53 Among those, it has been demonstrated that the application of purinergic blockers has greatly reduced the frequency and amplitude of the sEJPs, whereas the muscarinic blockers have no effect on them.53,54 This means that the sAPs which remained after the application of purinergic blockers are caused by non-neurogenic (myogenic) sources. The morphological difference between the neurogenic and myogenic sAPs was investigated by Meng et al. 51 They observed that the neurogenic sAPs were having a rapid rising phase, relatively slow half-width, smaller after-hyperpolarization (AHP), and a relatively slower falling slope compared with the myogenic sAPs. For convenience, we shall henceforth refer to the neurogenic sAPs as Type A sAPs and the myogenic sAPs as Type B sAPs.
On closer examination, it can be observed that the Type B sAPs have a signature shape, possessing a slow ramp-like foot (region of passive depolarization to the threshold) and a large AHP (Figure 4H). The Type A sAPs, however, exhibit dramatic variations in their profiles (Figure 4A-G). Adding to the complexity, these variations can be observed even from the recordings from a single small muscle cell (SMC). Some representative shape variations seen in the Type A sAPs are shown in Figure 4. Recently, an attempt was made to explain some of these variations by proposing sEJP-superposition hypothesis. 55 According to this, the Type A sAP is a composite event formed by the superposition of a passive supra-threshold sEJP, and an active AP generated by the cell’s active channels. A schematic diagram which describes the sEJP-superposition hypothesis is given in Figure 5. The feasibility of this hypothesis can be found in the work of Bramich and Brading 20 where it was shown that the nerve-evoked APs in guinea pig urinary bladder had an underlying eEJP which contributed to the convexity at the rising phase of the AP. This underlying supra-threshold EJP could be visible in nifedipine-treated tissue in which the APs were abolished. Here in the case of Type A sAPs, it was shown that the features at the AP foot such as the curvature and height of the foot exhibited strong correlation with the tail features such as AHP and after-depolarization (ADP) amplitude, in a way as predicted by the hypothesis. 55 This is a clear indication that these features are affected by a common underlying sEJP. An analysis of the first derivatives done by Young et al 54 also found that the first peak of the first derivatives of Type A sAPs matched the peak value of first derivatives of the sEJPs obtained in the nifedipine-treated bladder tissue, indicating that the Type A sAPs indeed originated from the supra-threshold sEJPs and that the features of the AP-evoking sEJPs were measurable from the sAP signal, thereby supporting the superposition hypothesis.

The variations in shape profile observed in the sAPs in DSM cells. Most of the variations occur in Type A sAPs (A-G), whereas Type B sAPs show a signature profile (H). DSM indicates detrusor smooth muscle; sAPs, spontaneous APs.
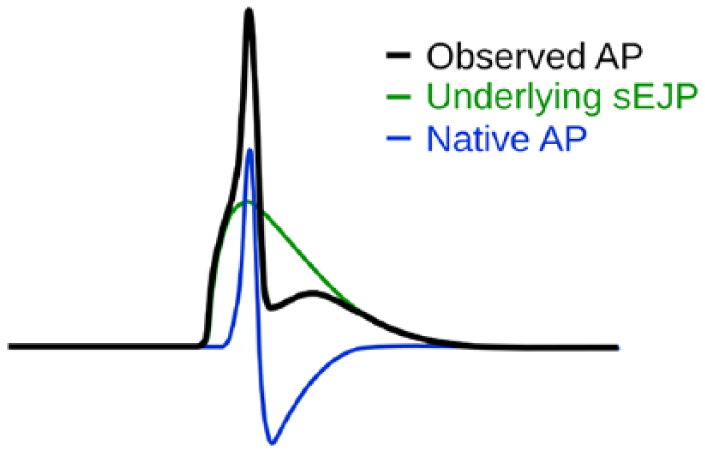
Schematic figure depicting the hypothesis that the variations in AP shape is caused by an underlying sEJP. 55 Note that the properties of the AP foot are determined by the underlying sEJP, and it also affects the amplitudes of after-depolarization and after-hyperpolarization as well. AP indicates action potential; sEJP, spontaneous excitatory junction potential.
The sEJP-superposition hypothesis predicts that the profile of the sAPs should vary depending on the variation in amplitude of the underlying sEJP. This variation in sEJP amplitudes was initially attributed to the passive transmission of electrotonic potential. 56 An analogy would be the observation by Fatt and Katz 35 where they have recorded the APs from the neuromuscular junction. The APs observed at the vicinity of the neuromuscular junction (end plate) contained an underlying EPP which appeared as a convex foot at the rising phase of the AP and a hump at the falling phase of the AP, corresponding, respectively, to the convex foot and the ADP observed in the sAPs of detrusor smooth muscle cell (DSMC). In skeletal muscle, this convexity and the post-peak hump became less evident and finally disappeared as the recordings were taken at increasing distance from the end plate, owing to the attenuation of the EPP. The same phenomenon could be expected in smooth muscle as the sAPs propagate through the muscle syncytium. However, this explanation was challenged by certain observations from the prior studies. Bramich and Brading 20 inserted two closely spaced microelectrodes (20-60 µm apart) in guinea pig detrusor. By injecting current through one of the electrodes, they attempted to record electrotonic potential using the other electrode. In most cases, no resultant electrotonic potentials were recorded at the second electrode, and the sEJPs picked up by the two electrodes were asynchronous. These observations clearly indicate a poor coupling between the SMCs in the detrusor. This raised the question as to the source of the skewed distribution of sEJP amplitudes observed 54 from the DSMs. The issue was addressed by Young et al 57 who showed that the varying amplitudes of the sEJPs were mostly attributed to the broad distribution of the neurotransmitter vesicle sizes. Almost all the sEJPs recorded from the DSMC were generated in the impaled cell itself. On this assumption, the propagated sAPs, even if they travel for a very short distance, would exhibit no indication of an underlying sEJP, and hence would not exhibit a convex foot or an ADP. With this information, it is now possible, by examining signal profiles, to assess whether the sAPs observed are propagated signals or whether they are generated in the impaled cell itself. When sAPs recorded from DSM cells were subjected to such an analysis, it was observed that Type A sAPs with an absence of convex foot occurred only rarely. 56 This implies that the Type A sAPs generated in a DSMC seldom propagate to neighboring cells.
Although much of the variation in the Type A sAP profiles could be described using the sEJP-superposition hypothesis, there were some variations which were not captured by the hypothesis. These variations included sAPs which exhibited a slow AHP (sAHP), lasting up to 200 ms, and those which exhibited very slow AHPs (vsAHP) which continued to about 300 ms after the peak of sAPs. This meant that there are more components in a Type A sAPs, other than the sEJP and the native AP, which needed to be uncovered. Accordingly, an attempt was made to isolate all observable components of Type A sAPs. 56 This was achieved by classifying the Type A sAPs into 2 groups: (1) Group-0, which do not exhibit sAHP/vsAHP and (2) Group-1, which exhibits sAHP/vsAHP. The salient components present in the Group-1 Type A sAPs were isolated by subtracting a matching AP from Group-0. Following this procedure, 4 components were isolated; their template shapes were obtained by averaging the estimates obtained from individual cells. To test if the components thus obtained were necessary and sufficient to explain all the shape variations observed in the DSM cells, attempts were made to replicate each of the Type A sAP profiles using the component templates. These reconstructions, following the scheme given in Figure 6, proved to be successful as this 4-component model could satisfactorily replicate almost all the major sAP profiles observed in the detrusor, both qualitatively and quantitatively. 56

Top: A schematic diagram explaining the synthesis of sAP profiles using the 4-component model. The a, b, c, and d represent the amplification factors for the basic components sEJP (S), native AP (A), sAHP (H1), and vsAHP (H2), respectively. The parameter nd represents the time delay in milliseconds provided for the sEJP component with respect to the native AP component. The resulting sAP profile is represented as Y. Bottom: Replications of experimentally observed sAP profiles using the 4-component model. The blue traces represent the experimental sAP and green traces represent the synthesized sAP. AP indicates action potential; AHP, after-hyperpolarization; sAHP, slow AHP; sAP, spontaneous action potential; sEJP, spontaneous excitatory junction potential; vsAHP, very slow AHP.
These developments unravel a novel picture of urinary bladder function, while opening up further questions. What are the possible biophysical mechanisms which give rise to the sAHP/vsAHP components? Are there any specific population of cells which are endowed with the mechanisms that generate those extra components? Do the variations in sAP profile have an influence on the mechanical behavior of the detrusor? Such questions are yet to be answered but could be addressed using pharmacological, Ca2+ imaging, and electrophysiological experiments. Apart from those, recent techniques such as simulations using a biophysically realistic model 3 and the mapping of electrical activities of the whole organ using extracellular electrode arrays 58 might be able to shed light on such issues and thus aid in better understanding of detrusor function.
Population Electrical Activity Observed Extracellularly
The sAPs recorded intracellularly provide information about how individual cells in a smooth muscle tissue behave. However, the collective behavior of the tissue which is caused by the propagation of APs in the tissue is best understood when the signals are observed extracellularly. With the advancement of technology, it is now possible to observe and track such collective electrical activities in smooth muscle using imaging techniques. Once such technique is made use of by Kanai et al, 59 where they intravesically loaded urinary bladder with voltage and Ca2+ sensitive dyes and simultaneously monitored spontaneous electrical activities and variations in intracellular Ca2+ concentrations from neonatal and adult rat bladder. From such whole bladder recordings, it was observed that electrical and Ca2+ transients arose at the dome of neonatal bladder and were conducted in a coordinated fashion to the neck, with electrical signals traveling 10 times faster than Ca2+ waves. These signals were associated with bladder contractions high enough to cause voiding. Such coordinated activities were not observed in adult bladder in which the activities originated randomly at different parts of the bladder without a focal point and they failed to conduct over a significant distance. These findings were confirmed by Ikeda et al 60 who also reported that the coordinated bladder activity re-emerged in spinal-cord-transected (SCT) animals. Coordinated signaling in the neonatal and SCT rats originated from the urothelial-suburothelial surface of the dome, 59 and this is postulated to be aided by the heightened gap junctional expression in urothelium and lamina propria, and also in the inter-bundle region of the detrusor. 60 Studies indicate that autonomous myogenic mechanisms exist in the neonatal bladders for high amplitude spontaneous contractions until the neural control matures and takes over to transition to voluntary voiding. Thus, the syncytial properties of the bladder are modified alongside the development of neural input, so as to aid the fine control of the filling and voiding phases.
Another method of observing the spontaneous electrical activities from an smooth muscle (SM) tissue is by making use of an electrode array to directly measure the surface potentials. In the study reported by Hammad et al, 58 a 16 × 4 electrode array was used to explore the population electrical activity observable from the surface of guinea pig urinary bladder. Unlike intestine and uterus, the bladder surface did not exhibit slow waves or bursts. Instead, it displayed small electrical waves which originated randomly at different parts of the bladder and propagated for a short distance before terminating spontaneously. The vast majority (>90%) of these waves were propagated in an axial (longitudinal) direction, either toward the dome or the base. The velocity of propagation in the axial direction was significantly higher than that in the transverse direction. These electrical waves appear to represent the coordinated activity of multiple bundles. Apart from these signals, “microscopic deflections” which represent the uncoordinated electrical activities of individual bundles were commonly observed as high frequency, low amplitude oscillations. Frequently, the electrical waves degraded into “microscopic deflections” after propagating some distance before dying out completely. Apart from the electrical waves that propagate, and microscopic deflections which do not, a third category of signals, called “electrical patches,” were picked up occasionally by the electrodes. These signals displayed high amplitudes similar to that of the propagating electrical waves and were simultaneously observed at multiple electrodes, as if they were passively transmitted electrotonic signals. The source of such signals is not clearly understood as yet. In search of the mechanisms behind the activities, the intravesical volume was varied. On increase or decrease in the intravesical volume, it was observed that the frequency of activities was augmented, whereas the propagation velocity of the waves was reduced. Thus, the activities may be triggered by the stretch receptors, and the reduction in velocity might be caused by the increase in volume, causing an increment in the inter-bundle distance. Intravesical application of Tetrodotoxin (TTX) had little effect on the electrical activities, indicating a lack of neuronal control on the spontaneous activities of bladder during the filling phase.
Such studies on population electrical activity in urinary bladder, as in the case of heart muscle syncytium, would play an important role in understanding the spatiotemporal spread of excitation in the urinary bladder DSM.
Recent Developments
A number of modeling studies have been undertaken in recent years on the detrusor. The inferences and interpretations of syncytial features, discussed below, will qualitatively hold true for all syncytial tissues, with the degree of correspondence being determined by the extent of gap junctional coupling and the topology of intercellular connectivity. Computational models were developed for the DSM of the urinary bladder, along the lines indicated in Figure 7. The models were developed in 3 stages, viz, (1) 1D multicellular cable (Figure 7B) with adjacent cells connected via gap junctions (Figure 7A), (2) 2-dimensional (2D) lattice of smooth muscle cells (Figure 7C), and (3) 3-dimensional syncytium (3D) of cells (Figure 7D), the cells being interconnected via gap junctions. The studies outlined below are cited with reference to this model.

Simplified representations of the topology deployed in the computational model of the urinary bladder DSM: (A) gap junction implementation, (B) multicellular model of 1D cable, (C) 2D lattice, and (D) 3D smooth muscle syncytium. 1D indicates 1-dimensional; 2D, 2-dimensional; 3D, 3-dimensional; DSM, detrusor smooth muscle.
Cable properties
When the model syncytium is reduced to a 1D cable by mimicking the partition stimulation protocol, the spatial decay of steady-state potential along the intracellular path follows an exponential trend. This is in accordance with findings from experimental investigations on the vas deferens27,39 and taenia coli. 29 The exponential trend is interspersed with discontinuities at sites of intercellular coupling, corresponding to sharp drops in membrane potential (Figure 8). This occurs because the gap junctional resistance between cells is greater than the cytoplasmic resistance within each cell.
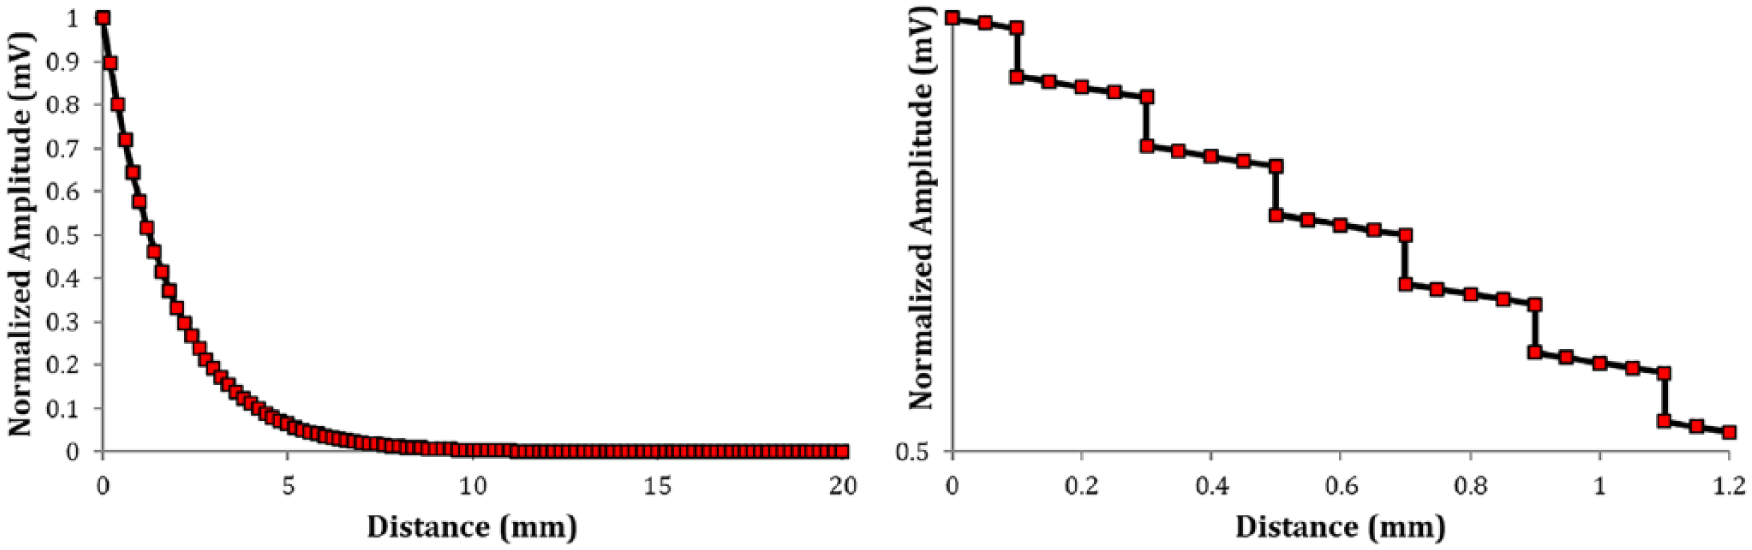
Left panel: The spatial decay of membrane potential when the syncytium is rendered a 1D cable is found to be mostly exponential. There are sharp jumps at the intercellular boundaries owing to the difference between gap junctional and cytoplasmic resistance. This is evident in the zoomed-in plot shown in right panel. 1D indicates 1-dimensional.
Simulations of focal stimulation on a compartmental model of smooth muscle syncytium demonstrated that membrane potential undergoes significant decay across the first gap junctional pathway away from the focally stimulated cell. 3 The magnitude of spatial decay is such that the length constant along the transverse axis is expressed even prior to the neighboring cell, at the locus of the connecting gap junctional path, and just beyond in the case of the longitudinal axis. This indicates that the 3D length constant, λ3D, is comparable with the cell’s length and diameter along the axial and transverse directions, respectively.
Computational simulations have allowed quantitative evaluations of the extents of spatiotemporal spread based on the mode of stimulation. These have helped interpret the drastically different biophysical renderings of the syncytial environments as determined by the nature of applied stimulus. It is observed that the 1D length constant, λ1D, is orders of magnitude larger than its 3D counterpart (1.81 mm vs 130 µm). 3 Similarly, the membrane time constants are also found to vary widely (τ1D = 138.4 ms, τ3D = 1.73 ms). The smaller values for the 3D rendering stem from the sharp dissipation of current along multiple dimensions in a syncytium, resulting in rapid spatial decay of potential. This is attributed to the orders of magnitude difference between the membrane resistance of an electrically isolated smooth muscle cell and the gap junctional resistance. The relatively low-resistance gap junctional pathways offer a preferential pathway for current dissipation, as opposed to flowing across the highly resistive membrane.
When the injected current was in the form of an alternating current (AC) for a 1D rendering of the syncytium, it was observed that (1) the AC length constant was shorter than the direct current (DC) length constant, and (2) the value of AC length constant fell sharply with increasing frequency between 0 and ~100 Hz. This holds particular significance in determining the spatial decay of transient signals, such as junction potentials and APs.
Junction potentials
Computational simulations have helped in revealing the notable differences that may arise from differences in the activation of varicosities. The time constants of decay for junctional current, spontaneous excitatory junctional current (SEJC) and excitatory junction current (EJC), were found to be almost identical (65.7 vs 65.8 ms) under focally applied stimulus (producing sEJP) and mimicking of nerve-evoked stimulus (producing EJP). But the time constants of decay of the synaptic potentials, ie, sEJP and EJP, were found to differ markedly (67.2 vs 167.3 ms). 3 It could also be noted that SEJC and sEJP followed near-identical time courses (Figure 9).

The figure illustrates the correspondence between model behavior and expectations from theoretical studies: (A) time course of junction potentials—sEJP and EJP, and (B) time course of underlying junctional currents—SEJC and EJC. EJP indicates excitatory junction potential; sEJP, spontaneous excitatory junction potential.
It is pertinent to mention here that computational studies have suggested that the activation of a small fraction of varicosities could suffice to render the syncytium quasi-isopotential. Stimulation of only 343 uniformly spaced cells in a computational model of smooth muscle syncytium consisting of a total of 15 625 cells (ie, only ≈2% cells stimulated) is capable of producing spatiotemporal decay of membrane potential remarkably similar to that observed under true isopotential conditions where each cell is individually stimulated. 3
Analysis of the amplitude distribution of sEJPs in the model syncytium produces a positively skewed histogram. This corresponds well with both experimental measurements 20 and theoretical expectations 25 (Figure 10), and can be attributed to the severe spatial attenuation of sEJPs. In a syncytium, this would result in the recording of a very large number of smaller potentials, and a significantly lower occurrence of larger potentials which have their origin in close proximity to the site of recording. Such analysis shows how complementary approaches, ie, experimental and computational, can shed light on factors that can contribute separately to an observed phenomenon, viz, variations in neurotransmitter vesicle sizes as well as syncytial attenuation contributing to the skewed amplitude distribution of sEJPs. Further explorations in this domain will be required to work out the precise contributions.

The sEJP amplitude histogram for the 3D model syncytium shows a positively skewed distribution, in accordance with the distribution observed experimentally (inset—from Meng et al 51 ). This can be attributed to the rapid spatial decay of sEJPs and thus the low frequency of larger recorded potentials. It is to be noted that spontaneous depolarizations or “SDs” of Meng et al 51 is the term used for sEJPs. 3D indicates 3-dimensional; sEJP, spontaneous excitatory junction potential.
Experimental studies in the past have reported the absence of simultaneously recorded events in cell pairs for sEJPs and for potential changes induced by current injection. 20 This has led to the interpretation that the absence of synchronous activity could be an indication of poor syncytial coupling. Through simulations on a syncytial model, it has been possible to demonstrate that such observations are also an indication of a well-coupled syncytium owing to the very rapid spatial decay of potential. 3
Computational models of smooth muscle AP
Just as has been the case for synaptic potentials, the development of computational models for active signals, ie, APs or spikes, in smooth muscle has lagged considerably behind that for other muscles and neurons, for the reasons outlined above. In this sphere as well, however, there has been notable progress in recent years. One of the first comprehensive smooth muscle spike models was reported in 2011 for uterine smooth muscle cells. 61 Among the vas deferens and urinary bladder smooth muscle, a model for the spike of the vas deferens has not yet been reported except in a nascent form,62,63 while for DSM progress has been more substantial.
An electrophysiological model of the DSM spike based on the Hodgkin-Huxley formalism was first reported in 2014 by Korogod et al 64 ; however, there were key conflicts between the components used for this model and experimentally elucidated DSM electrophysiology. For instance, the AP upstroke was based on an active sodium conductance, whereas most experimental studies do not indicate the presence of voltage-gated sodium ion channels in DSM.65,66 Other salient conflicts also existed in the choice of ion channels. An added lacuna was that the properties of the ion channels employed were not validated against experimental data, such as ionic currents recorded under voltage clamp conditions and current-voltage curves derived from these, thus not being constrained by biophysically known parameters.
More recently, a DSM spike model has been reported that addresses the aforementioned issues and is purported to be more stringently constrained by available physiological data. 67 For instance, DSM ionic currents were modeled using parameters directly drawn from previously published data. Furthermore, these currents were tuned in respect of their amplitudes and their dynamic profiles under voltage clamp conditions to achieve an optimal match to experimentally recorded signals. Likewise, the current-voltage curves for each channel in this model conform to those reported experimentally, thus closely validating the ionic currents against physiological data.
Following these measures toward model robustness, the known complement of ion channels for DSM cells was integrated to generate the spike-type AP of the DSM. Action potentials were elicited both by external current injection and physiologically realistic inputs represented by synaptic potentials. The emergent computational spikes matched quite closely the experimentally recorded ones. A particularly noteworthy feature of the model is that it is able to reconstruct not just one but a variety of AP shapes recorded in DSM.54,56 By varying the synaptic conductance over a modest range, a number of spike-type AP shapes were successfully simulated. These spikes featured, as do the experimentally recorded ones, varying amplitudes of ADP and AHP. 67 This is congruent with the contention, noted above, that some of the shape variation observed in spike-type APs may be produced by differing degrees of superposition between the underlying synaptic potential and the evoked AP, 56 thus placing the hypothesis on a stronger footing. However, other mechanisms contributing to diversity of spike shapes, such as variations in the complements of ion channels present in different smooth muscle cells, cannot as yet be discounted.
As the spike model reported in Mahapatra et al 67 is biophysically detailed and tightly constrained by empirical data, it lends itself well to plausible heuristic predictions. The model has been employed to resolve existing conflicts and to gain new biological insights that are experimentally testable. For instance, it has been used to clarify the precise roles of small-conductance (SK) and big-conductance (BK) potassium channels in shaping the spike, which had hitherto remained contentious.
Integrating the syncytium and spike models
The simulated spike also exhibits the canonical property of APs, viz, regenerative, non-attenuating propagation along a long length of excitable cell. This was demonstrated by incorporating the model AP into an elongated, multicellular 1D cable model constructed as outlined in the section “Recent Developments,” with adjacent cells being electrically interconnected by gap junctions. The AP was shown to be capable of successfully propagating in a regenerative, non-attenuating fashion along the length of the smooth muscle cable. 67 Moreover, while the AP at the site of its initiation displayed a convex-upward foot and a marked ADP, the propagated AP exhibited the gradual waning of the convex foot as well as the ADP with respect to distance, as predicted by the hypothesis derived from cable theory (see Figure 5).
This recent development renders it possible in future work to insert the biophysically detailed AP model into the 3D syncytium of the DSM. It will set the stage for explorations of spike propagation in more realistic topological settings. More broadly, it will also enable examination of spatiotemporal integration of electrical signals in the muscle of the detrusor, which is held to be a necessary precursor to physiologically effective contractile activity.
Inter-Species Differences
Notable variations are often observed for the same tissue across different species. These contrasts could exist both at the myogenic level, in terms of the cellular and syncytial features, and at the neurogenic level with variability in the nature and extent of innervation.
Myogenic variations could be in the form of the arrangement of smooth muscle cells within the syncytium. Koyanagi and Miyoshi 68 investigated and compared these for the outer layer of the vas deferens musculature in guinea pigs, rats, and mice, and found that the smooth muscle bundles formed a net-like topology, with the exact structure varying between species. They reported that in guinea pigs, smaller smooth muscle bundles, of similar size, branched along the same longitudinal direction and anastomosed with branches of neighboring bundles to form a regularly shaped mesh. In rats, however, the sizes of smooth muscle bundles varied, and their alignments were seldom aligned. In mice, the bundles were of irregular thickness and branched into smaller bundles, anastomosing with adjacent bundles to form an irregular mesh. In both rat and mice, the bundles often crossed over one another and formed anastomoses with other bundles at distally located regions. In the case of humans, there exists an even more prominent difference owing to the presence of an additional inner longitudinal smooth muscle layer just beneath the mucosal lamina propria. 69
Significant variations are also observed in neurogenic inputs to smooth muscle tissues. For instance, less than half the cells in the outer layer of the guinea pig vas deferens are in close proximity (<20 nm) to nerve fibers. 70 This is in strong contrast to cells of the mouse vas deferens, where studies have reported innervation to be such that cells are in close proximity to up to 6 axons, with regions that could potentially have individually innervated cells. 71 Studies on the rat vas deferens have similarly suggested the possibility of each muscle fiber being individually innervated. 72 Differences even exist in the nature of neurotransmitters released at the nerve terminals. Contractions of the DSM in most mammalian bladders are reported to be mediated via dual excitatory parasympathetic innervation comprising of cholinergic and non-adrenergic, non-cholinergic (NANC) components, with their contributions varying between species.73–75 Non-adrenergic, non-cholinergic excitatory transmission is found to be predominant in the detrusor of small mammals. In contrast, the human detrusor is found to be almost solely mediated by cholinergic pathways, with the NANC component coming to play under certain pathological conditions.73,76 Differences also exist in the structure of the parasympathetic system innervating the urinary bladder of certain species. For example, in the rat bladder, the postganglionic parasympathetic cell bodies are completely located within the pelvic ganglia, whereas in humans, a sizable proportion of the cell bodies are located in the bladder wall. 77
The above discussed variations in the myogenic and neurogenic aspects translate into differences in the emergent behavior of the cells. This can be observed not only in the electrical responses of the cells recorded from different species but even within sub-populations of cells within the same species. For example, the responses of the cells to nerve stimulation are reported to vary between the guinea pig and mouse vas deferens. The former is found to produce EJPs which then elicit APs, whereas in the latter most cells failed to elicit AP even in the presence of large eEJPs (35-40 mV) but could be elicited via additional stimuli, indicating their electrical excitability. 78 Other studies have established that the guinea pig vas deferens is electrically well coupled, whereas the mouse vas deferens is reported to also contain a small population of poorly coupled cells.57,79 This suggests that the cells from the mouse vas deferens that do not easily elicit APs are probably drawn from the larger sub-population that is strongly coupled, and the more easily excitable cells are those that are poorly coupled. This aligns with the findings of computational studies where it has been demonstrated that with a higher degree of coupling between the smooth muscle cells, the cells are less excitable, and for very well-coupled syncytia, the cells are incapable of producing APs owing to the rapid dissipation of charge from the stimulated cell to other neighboring cells via gap junctions. 80
Changes in Syncytial Features
The syncytial organization of the tissues engenders them with specific biophysical properties necessary for their physiological functioning. Differences in the syncytial features would lead to altered behavior. This can be demonstrated by taking a comparison of the two smooth muscle tissues discussed here—the vas deferens and the detrusor. These tissues exhibit divergent syncytial properties. The coupling between the SMCs in the former is stronger compared with that in the latter, as is evident from their length constants. 81 Mouse vas deferens consists of a well-connected syncytium of SMCs,48,82 with an exception of a thin layer of “isolated cells” present in its outermost layer.57,78 Due to this property, it is almost impossible to elicit an AP in the SMCs of the vas by intracellular current injection.27,48 Physiologically, APs in vas deferens are rarely spontaneous and only occur following nerve stimulation. Brock and Cunnane 8 showed that spontaneous neurotransmitter release events are observed in the vas deferens, but the responses to these events are passive—in other words, no sAPs were observed from the vas. The APs in vas are always preceded by an AP in the innervating nerve terminal and adhere to a unique temporal profile. Compared with the features of the vas, the detrusor SMCs are relatively sparsely coupled 81 and densely innervated.83–87 Spontaneous neurotransmitter release events from the varicosities are able to produce APs that do not propagate across the syncytium, owing to the limited coupling between the cells. Furthermore, the complex syncytial arrangement of the SMCs in the detrusor gives rise to wide variations in the sAP profiles. 56
It is possible that the syncytial properties of a certain SM organ vary with time. In certain scenarios, this might be warranted, such as the increased coupling between uterine smooth cells during parturition enabling rhythmic, coordinated contractions. But in other scenarios, such changes may hinder the regular functioning of the tissues and result in pathology. For example, it has been reported that the overactive detrusor, characterized by involuntary detrusor contractions during the filling phase, showed a mark reduction of gap junction coupling as compared with normal detrusor. Sui et al 88 have demonstrated that there is an increment in the intracellular resistivity of the overactive human bladder compared with normal bladder. This was supported by the observation that there is a diminished expression of Cx45 gap junctions in overactive bladder (OAB) as revealed by both immunoconfocal imaging and Western blot analysis.19,88 However, diminished coupling also restricts cell-to-cell AP propagation. Hence, sAPs generated in any one SMC will not be able to propagate as effectively across the syncytium and give rise to the characteristic synchronized contraction observed in overactive bladder. Other studies have unambiguously revealed an enhancement in gap junction expression, especially Cx43 in the neurogenic and idiopathic OAB in animal and human models.89–93 Phé et al 93 reported that application of 45Gap27, a Cx45 selective gap junction blocker, inhibits the carbachol-induced contractions in the OAB, indicating that there is an enhanced expression of Cx45 in the OAB—which is incongruent with the findings reported by Sui et al. 88
Syncytial features can also be targets for treatment of disorders and other pathological conditions. For instance, in the case of the uterus, the emergence of an electrically well-coupled syncytium owing to increased gap junction coupling has been implicated both during term and preterm labor. 94 This offers a potential avenue for the management of preterm labor by means of reducing the syncytial coupling by the use of gap junction blockers or other inhibitors.
Concluding Remarks
We have attempted in this article to survey the electrical properties of smooth muscle in such a way as to highlight (1) the often tortuous development of ideas that has hallmarked this field, with hypotheses and prevailing notions undergoing radical changes over the first few decades of investigation; (2) recent explorations that have substantiated some of the prior hypotheses over others, and allow for a framework to test ideas computationally as well as experimentally. In doing so, we have focused on two smooth muscle organs, the vas deferens and the urinary bladder, which together have furnished a great deal of insight into electrical activity during neurotransmission, in the form of junction potentials, as well as into spikes, or APs, that ensue following neurotransmission.
A brief survey of electrical signaling in these smooth muscles and others shows us that beyond certain fundamental concepts, smooth muscles behave very differently from one another, and each smooth muscle needs to be explored on its own merits. This is analogous to how neurons, while belonging to the same family of cells and sharing certain properties in common, can diverge in many key respects when it comes to their finer details of function. However, 2 of the binding features of smooth muscle organs, ie, syncytial organization of the muscle cells and the distributed innervation they receive, endow them with facets of functioning that render the electrical signals generated in them both challenging to understand and a fertile territory for biophysical research. While we have dealt with junction potentials and spikes and shown how strides have been made recently in their analysis, much remains to be done on several other fronts, eg, (1) subjecting recent predictions made in computational work to experimental tests; (2) delineation of the ion channels involved in smooth muscle spikes and the development of fine-grained spike models constrained by biological data; (3) the interaction between electrical signals and Ca2+ signals within the smooth muscle cells, leading to the generation of Ca2+ transients and contraction; and (4) the propagation of Ca2+ signals through the syncytium, analogous to the propagation of junction potentials and spikes. This last named will be of critical importance in strengthening our understanding of the coordination and spread of contractile waves across smooth muscle tissues, which in turn is of vital importance to their physiological functions. With the rapid advance of experimental and computational techniques witnessed recently, we believe that such questions should have their answers in the not-too-distant future.
Footnotes
Funding:
The author(s) disclosed receipt of the following financial support for the research, authorship and/or publication of this article: This work was supported by grants from the Department of Biotechnology (DBT), India (BT/PR12973/MED/122/47/2016).
Declaration of conflicting interests:
The author(s) declared no potential conflicts of interest with respect to the research, authorship, and/or publication of this article.
Author Contributions
All authors contributed equally to the conception, writing, and editing of this review article. All authors reviewed and approved of the final manuscript.