
Abstract
Aims:
To compare developmental changes of delta 1 (0.5-2.0 Hz) and delta 2 (2.25-3.75 Hz) power spectra between healthy monozygotic (MZ) and dizygotic (DZ) twin pairs and among MZ and DZ twin groups during active/REM (AS/REM) and quiet/NREM (QS/NREM) sleep stages at 38th, 46th, and 52nd weeks of postmenstrual age (PMA).
Materials and methods:
Electroencephalography (EEG) recordings were analyzed using fast Fourier transforms. Differences in the developmental changes of delta power within twin pairs and between twin groups were estimated by calculating mean absolute differences of relative spectral values in delta 1 (0.5-2 Hz) and delta 2 (2.25-3.75 Hz) frequencies.
Results:
A review of electrodes showed that relative delta 1 power decreased, whereas delta 2 power increased from 38th toward 52nd week of PMA regardless of zygosity, sleep stages, and electrode position. Twin groups did not significantly differ (P > .05) in within-pair MZ and DZ similarity for delta 1 and delta 2 power spectra; similarity between MZ twin partners for delta 1 and delta 2 power spectra was as high as that of DZ twin partners on each electrode position, sleep stage, and period of measurement.
Conclusions:
Developmental changes of delta 1 and delta 2 power spectra occurred equally in MZ and DZ twin groups during AS and QS sleep stages at 38th, 46th, and 52th PMA. The rhythm of EEG maturation evidenced by the maturation of delta 1 and delta 2 power spectra was not dependent on zygosity.
Introduction
During a neonate’s first months of life, the electroencephalography (EEG) serves as a neurophysiologic marker of brain organization and maturation not only in healthy neonates but also in those at risk for later neurodevelopmental compromise. 1 Maturation of the brain evidenced by EEG follows an inherited program showing a characteristic pattern of development which evolves in a generally predictable manner as a function of postmenstrual age (PMA). 2 Despite this overall trend, individual differences in EEG power in children of the same age are striking. 3 These individual differences are being used to diagnose deviant brain development, such as that related to neurologic and behavioral problems.3–5 Studies using power spectra, a measure of oscillatory amplitude that contributes to neural synchrony, have documented differences in EEG power spectra that are associated with autism spectrum disorder.5–7 However, it is not clear whether these differences in neural oscillations represent an index of the disorder or are shared more broadly among both affected and unaffected family members. 5 In addition, it remains unclear how early these differences emerge in development and whether they remain constant or change over time. Moreover, it is not yet known whether the altered functional brain maturation in the absence of major encephalopathic patterns may represent “natural” fluctuations or significant changes from the genetically promoted time course of maturation.1,4,8,9
Evidence from numerous investigations, including twin and family studies, has suggested that interindividual differences of human brain wave patterns are predominantly determined by genetic factors.10–12 Twin studies provide an overall impression of the role of genetic factors in the EEG variability by comparing the phenotypic resemblance of monozygotic (MZ) and dizygotic (DZ) twins. If identical twins (which share nearly 100% of their genes) were considerably more similar than fraternal twins (share 50% of their genes), this would implicate that genes play an important role in some trait.13,14 Extensive twin studies by Vogel in the 1960s and 1970s established strong evidence that EEG and its variants are under genetic control. Moreover, investigation by Vogel of different EEG parameters based on 110 pairs of MZ and of 98 pairs of DZ twins, between 5 and 20 years old have suggested that genetic factors determine not only the individual EEG but also the rhythm of EEG maturation. 15 He found MZ twins to be absolutely concordant during childhood, thus suggesting that speed of maturation is determined genetically. Using spectral patterns, Stassen et al reported that the waking EEG in MZ twins was strikingly similar (as a person is to himself over time) and that the EEGs of MZ twins reared apart were as similar to each other as are the EEGs of the same person over time or as the EEGs of MZ twins brought up together.16,17
This phenomenon has not been examined in early infancy when brain development influences the EEG recordings. It is unclear whether genetic contribution to EEG parameters is evident over the first postnatal months. During the period between 35 and 52 weeks of PMA, the brain is subjected to large structural and functional changes including formation of multiple interconnected neuronal networks that create a new anatomical substrate for the continuous changing of electrical activity.18,19
Delta activity (1-4 Hz) is the dominate activity in human EEG during early developmental stages.20,21 It means that delta activity not only has the highest power in the spectrum (comparative to theta and alpha frequencies) but is also the most functionally “active” oscillation in earlier developmental stages. 20 Delta activity provides important information in the assessment of brain damage in preterm infants. 22 Delta brushes (rhythmic 0.3-1.5 Hz delta activity of 50-250 μV associated with a superimposed rhythm of low to moderately faster frequencies of 10-20 Hz) are a prominent feature of delta oscillatory activity in the human cortex during the third trimester of gestation. 2 Other delta rhythms occur in the temporal and occipital locations particularly after 28 weeks’ gestation.2,23 With advancing PMA, spectral power of the delta frequencies decreases. The decrease in the amplitude with increasing PMA is distinctive in the lowest frequency band (<1 Hz). 24 During further development of resting state activity, the EEG generally decreases in amplitude, and slow activity is substituted by fast activity. 25 This dynamic is generally considered as a sign of maturation. 26
A series of precise studies investigated maturational changes of delta activity but none of them investigated delta maturation in twins.1,22,24,27,28
In this study, we particularly focused our research on delta maturation in twins because the developmental changes in the delta power spectra represent an index of central nervous system maturation.18,20
We postulated that if the rhythm of brain maturation evidenced by EEG was determined by genetic factors, it would follow that changes in delta activity would proceed at the same rate for identical twins, whereas the developmental synchronies should be lower within pairs of fraternal twins. Such data would be of great value when searching for the role of genetic factors in the EEG variability in the infancy.
Therefore, we conducted a twin study comparing developmental changes of delta 1 (0.5-2.0 Hz) and delta 2 (2.25-3.75 Hz) power spectra between healthy MZ and DZ twin pairs and MZ and DZ twin groups during AS/REM and QS/NREM sleep stages at their 38th, 46th, and 52nd weeks of PMA.
Materials and Methods
This study was part of a comprehensive EEG research program of Department of Pediatrics and Department of Gynecology and Obstetrics at the Clinical Hospital Center Split that was conducted from October 2011 to May 2013.
This is a secondary analysis of the data set included in our previous study to assess genetic influence on EEG composition during sleep in MZ and DZ twins in the first trimester of life. For details of the study group, we refer to earlier article. 29
During the study period, 66 healthy near-term neonates (12 pairs of MZ, 21 pairs of DZ twins, recruited from well-child nurseries) were eligible for the study on the basis of inclusion criteria: born between 36 and 38 weeks of gestation (GW), normal birth process with uncomplicated postnatal adaptation, the Apgar scores ⩾7 at 5 minutes, birth weight appropriate for gestational age, no congenital anomalies, normal cerebral ultrasonography <72 hours after birth, and stable general condition at EEG recordings. Of the eligible population, 6 subjects were subsequently excluded because of sepsis, acute respiratory disease, and recurrent apnea during the study period. In total, 60 infants (10 pairs of MZ, 20 pairs of DZ) were enrolled in the study. 29
The MZ group consisted of 3 male pairs and 7 female pairs with birth weights ranging from 2.560 to 3.050 g (2793 ± 174.99). The DZ group consisted of 6 male pairs, 4 female pairs, and 10 male/female pairs with birth weights ranging from 2.300 to 3.200 g (2726 ± 254.13). Clinical and demographic data for 60 neonates are listed in Table 1. 29
Clinical characteristic of MZ and DZ twins.
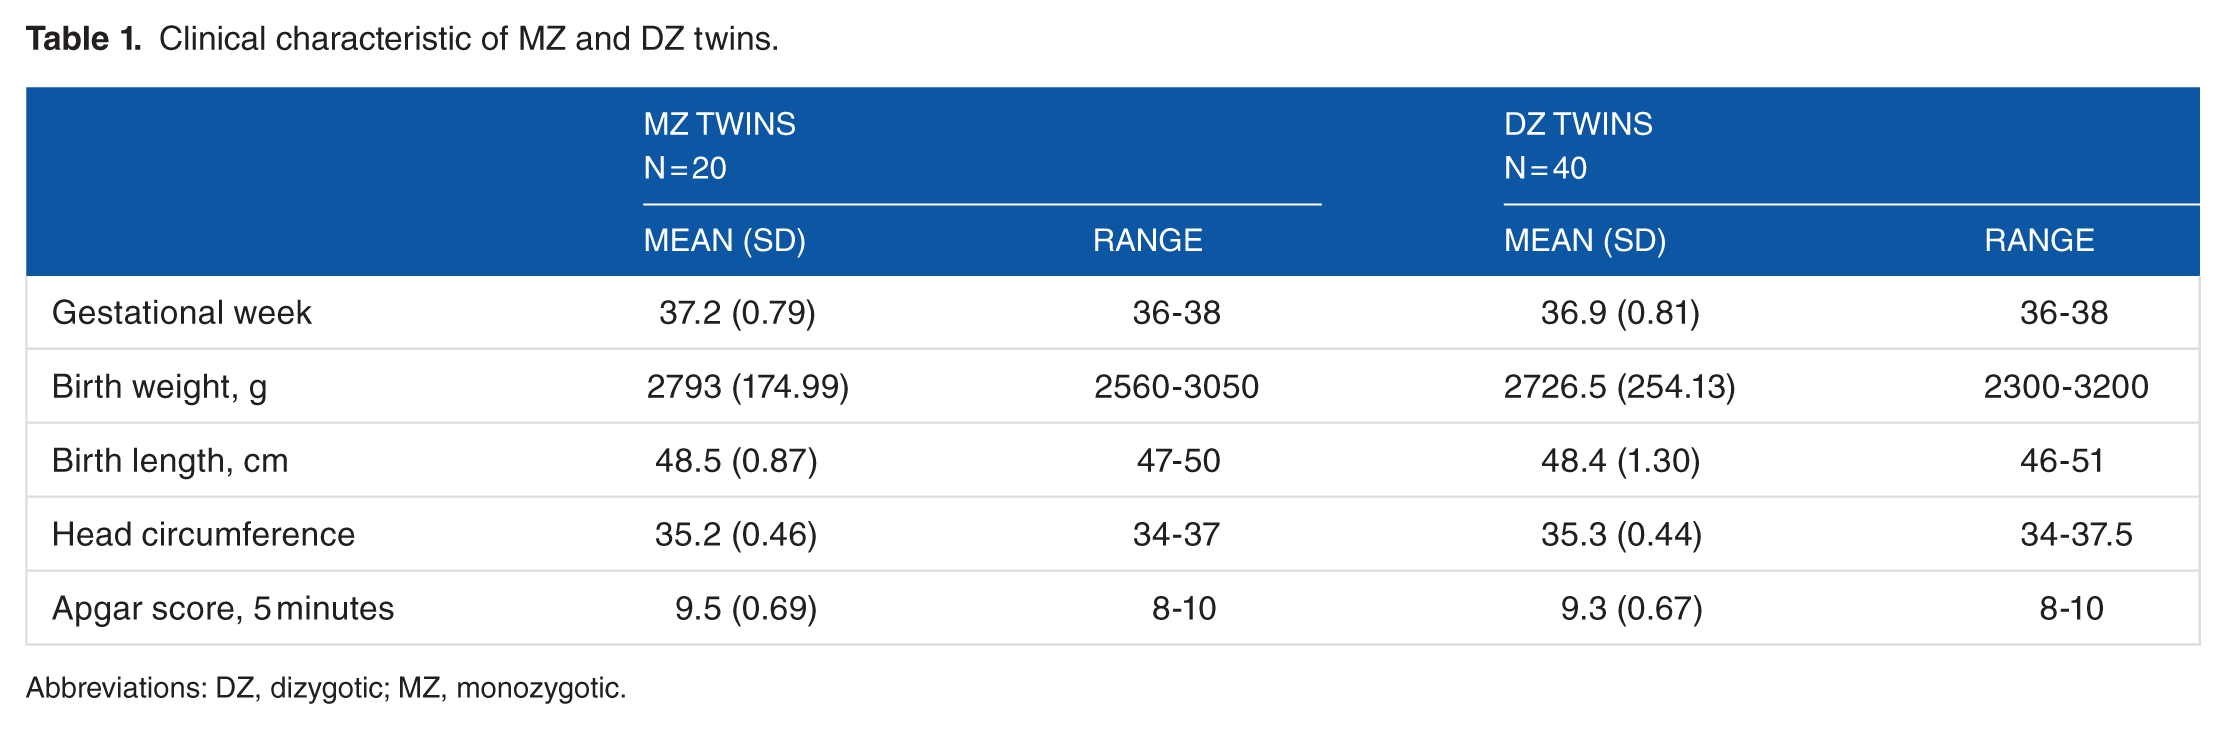
Abbreviations: DZ, dizygotic; MZ, monozygotic.
Gestational age was estimated based on data related to last menstrual period, fetal ultrasound measurements, and clinical assessment of physical and neurologic determinants of maturity at birth. 30 Postconceptional age was defined as gestational age plus postnatal age.
Twin zygosity was determined on the basis of data obtained regarding the number of placentas obtained by ultrasound examination in pregnancy and exploration of the fetal membranes and placenta after birth. In the case where 2 placentas were found, zygosity was determined by DNA (deoxyribonucleic acid) analysis by polymerase chain reaction.29,31
All neonates received a physical and neurodevelopmental assessment on the day of each recording to verify their health status. 32 The initial EEG recording was done at 38th week of PMA. Thereafter, EEGs were performed at 46th and 52nd week of PMA. A cranial ultrasound was available to document the absence of intracranial hemorrhage or periventricular echodensities.
Informed parental consent was obtained after detailed explanation of the method and purpose of the study. The study was conducted in accordance with the Declaration of Helsinki, and the protocol was approved by the Ethics Committee of University Hospital Split (216-2163166-0509).
Polysomnographic Recording Procedures
The EEGs were recorded polygraphically with digitized electroencephalograph (NicoletOne; Viasys Healthcare, Conshohocken, PA, USA) with 12 surface electrodes yielding 12 bipolar derivations (Fp1-C3, Fp1-T3, Fp2-C4, Fp2-T4, C3-T3, T4-C4, C3-O1, T3-O1, C4-O2, T4-O2, C4-Cz, and Cz-C3), according to the modified 10-20 international system combined with electro-oculogram, electrocardiogram, and respiratory movement as previously reported. 29 A high-pass filter of 0.3 Hz (−0.3 dB), a low-pass filter of 70 Hz (−3 dB), a notch filter of 50 Hz, a base time of 10 seconds, and a sensitivity of 7 μV/mm were maintained. The EEGs were conducted at 38th week of PMA, 46th and 52nd week of PMA, and were performed in an environmentally controlled setting for more than 90 minutes during wakefulness through spontaneous sleep including all states of sleep.29,33 All subjects were video monitored for changes in behavior specific to their particular sleep state. Electroencephalographic data were recorded on the hard disk of the computer workstation prior to further processing. 29 Artifacts were excluded visually using our own method. 29 The intention was to analyze 60 minutes of artifact-free record (at least 1 sleep cycle).
Spectral Analysis of the EEG
For further processing, the sampled EEG recording, taken from a NicoletOne software package in ASCII format, along with the recording of sleep state, was further processed using a MATLAB software package as part of a software system developed for the purposes of this study. For the present analysis, we selected EEG data from the left fronto-central derivation (Fp1-C3), central (C3-Cz), and centro-occipital (C3-O1) derivations of each of 3 recordings. These derivations were selected on the basis of the maximal amount of artifact-free data. It was also taken into account that occipital areas may be most suitable for assessing EEG maturation. The EEG data of AS/REM and QS/NREM sleep were submitted to fast Fourier transform which allowed time-series data to be shown as corresponding amplitudes of spectral power density. 29
As total spectral power between subjects may vary considerably, spectral power values are normalized for total power and expressed as relative spectral power measures. Relative power of a band was defined as the ratio of the absolute power of that band to the total power of all bands, expressed as percentage. Spectra of 30-second epochs were matched with the corresponding sleep stages.
For the further analysis, delta spectrum (0.5-4.0 Hz) was isolated from the entire frequency spectrum and subdivided into 2 frequency bands: delta 1 (0.5-2.0 Hz) and delta 2 (2.25-3.75 Hz).
Statistical Analysis
R (R Core Team, 2018) and Statistica 10 software package (StatSoft, Inc., Tulsa, OK, USA) were used to perform statistical analysis of the data.
Mixed model analysis of variance (type 3) with afex package was used to determine whether there were any differences among the means and absolute difference of relative spectral values in delta 1 (0.5-2 Hz) and delta 2 (2.25-3.75 Hz) frequencies in active and quite sleep for MZ and DZ twin pair in 3 repeated experimental conditions (at 38th, 46th, and 52nd week of PMA). 34
The 2 grouping factors are participants (id) and group (MZ and DZ twin pair). The within-participant factors are time (38th, 46th, and 52nd week of PMA), sleep (active, quite sleep), electrodes (FC, CC, CO), and frequency (delta 1, delta 2). We used the Kenward-Roger method for obtaining P values within mixed model analysis of variance which provides the best control against anticonservative results. Similarity in the developmental changes of delta power within MZ and DZ twin pairs was estimated by calculating mean absolute differences of relative spectral values in delta 1 and delta 2 frequencies. The MZ and DZ twin pair differences for developmental changes of delta 1 and delta 2 power spectra were illustrated by Box-Whisker plots of mean with 95% confidence interval of absolute differences of power values in MZ and DZ twin groups. Statistical values were considered significant at 99% (P < .01). The MZ and DZ intraclass correlation coefficient (ICC) values were calculated using irr package. 35
Comparisons of MZ and DZ ICC values were done using the Wilcoxon signed rank sum test function in the package coin. 36
The ICC is used to quantify the degree to which individuals with a fixed degree of relatedness (eg, full siblings) resemble each other in terms of a quantitative trait. 37
Results
In total, 180 EEG polysomnographic recordings obtained at 38th, 46th, and 52nd week of PMA were analyzed. Demographic and clinical data of the patients are listed in Table 1. All analyzed EEG recordings have at least 1 sleep cycle. The mean duration of total sleep time in all 3 recordings was higher than 60 minutes.
Spectral analysis of REM and NREM
Our initial approach was to ascertain the maturational changes of relative delta 1 (0.5-2 Hz) and delta 2 (2.25-3.75 Hz) power spectra in MZ and DZ twins at 3 electrode positions regarding sleep state. Analyses of these data indicated that the proportion of delta 1 predominated in the EEG spectrum throughout all 3 periods of measurements (38th, 46th, and 52nd PMA) regardless of zygosity, sleep stages, and electrode positions (Figure 1).

Maturational changes of delta 1 (0.5-2 Hz) and delta 2 (2.25-3.75 Hz) power spectra in relation to age and sleep stage at left fronto-central, central, and centro-occipital electrodes in MZ (blue color) and DZ (red color) twins. The spectral power of each frequency band at 38th, 46th, and 52nd PMA is expressed in a relative power (as a percentage of the total power of all frequency bands). DZ indicates dizygotic; MZ, monozygotic; PMA, postmenstrual age.
Relative delta 1 mean values ranged between 51% and 70%, whereas delta 2 ranged between 11% and 28% of the total power spectra regardless of sleep stages (Figure 1).
Two distinct patterns of changes in the delta activities were found with advance of PMA: delta 1 relative power decreased, whereas delta 2 relative power increased from 38th to 52nd week of PMA in both zygosity groups (Figure 1).
The pattern of developmental changes in delta activities showed a similar time course in MZ and DZ twins, at each electrode position and both sleep stages.
Mixed model analysis of variance show that there were not significant (P > .05) differences between MZ and DZ twins in the proportion of delta 1 and delta 2 power spectra (Table 2). There were not significant interaction effect (P > .05) effect between group (MZ/DZ twins) and sleep stages (AS/REM and QS/NREM) in all 3 periods of measurement, at each electrode location (Table 2).
Mixed model analysis of variance with 4 main effects and 3 interactions of relative power spectra value in delta 1 and delta 2 frequencies.
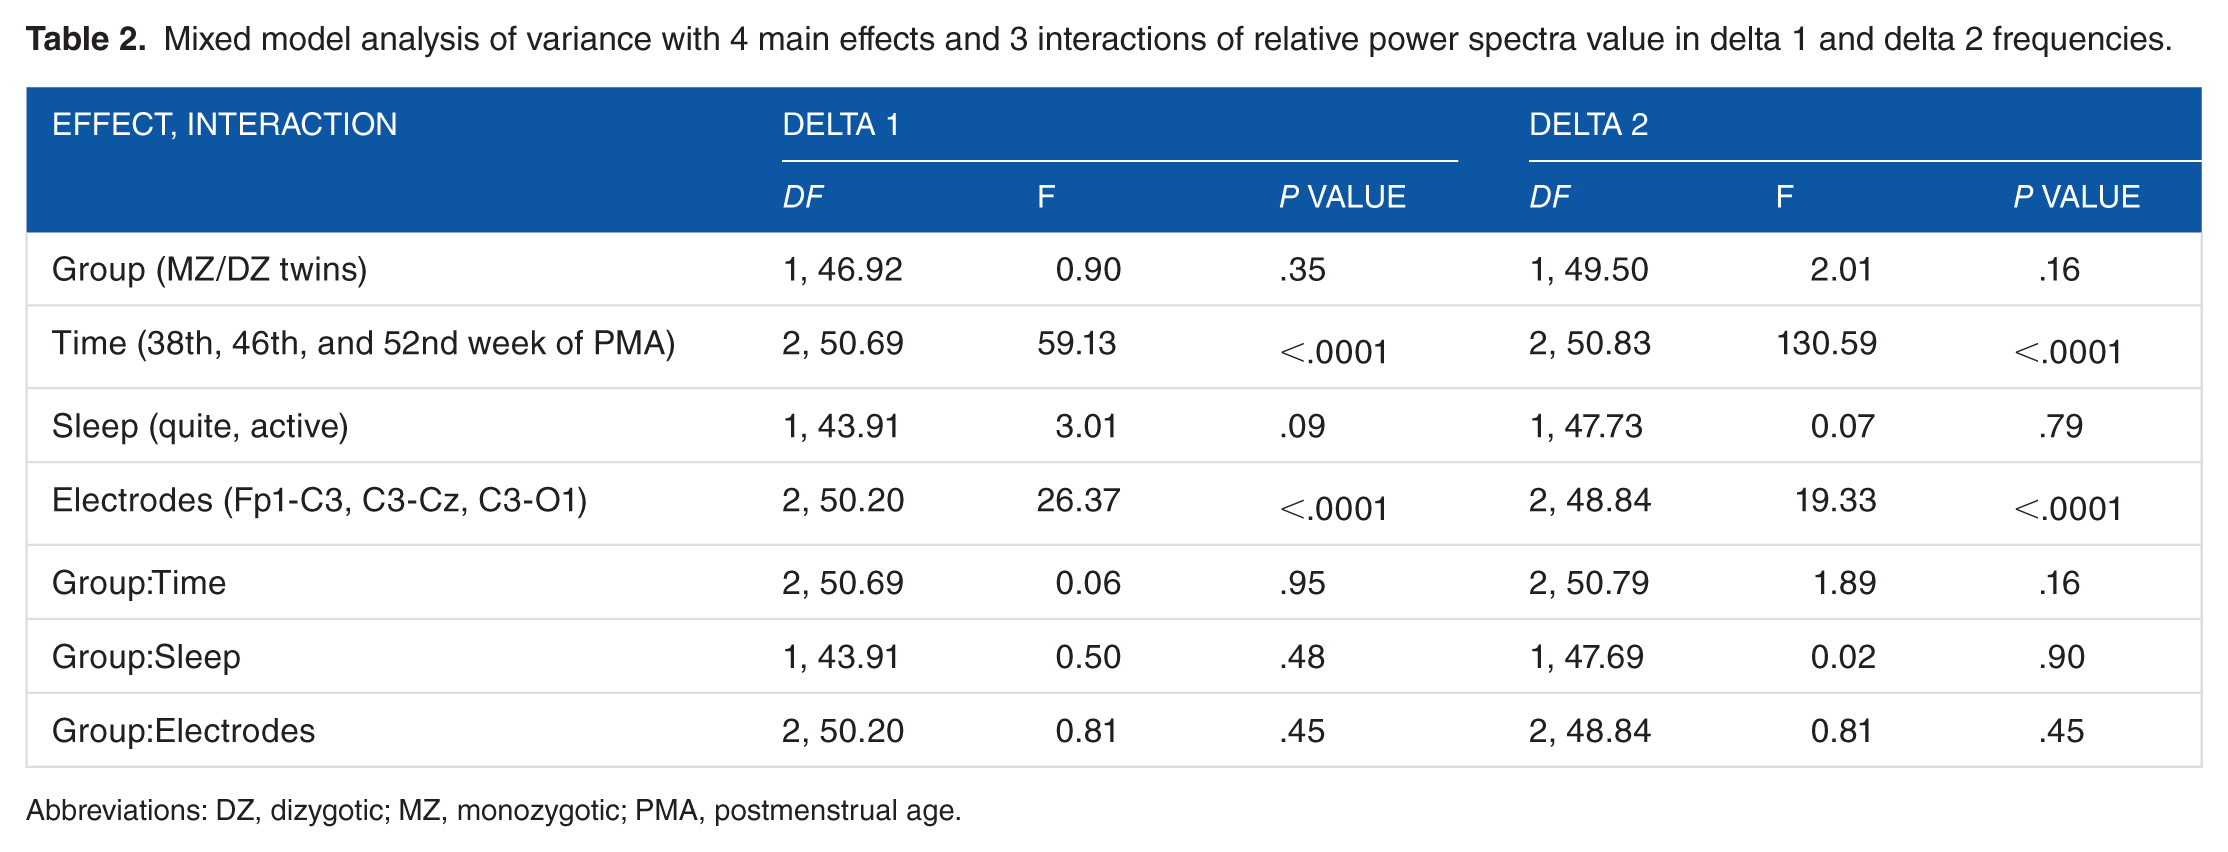
Abbreviations: DZ, dizygotic; MZ, monozygotic; PMA, postmenstrual age.
To examine within-pair similarity in developmental changes of delta 1 and delta 2 activities in MZ and DZ twins, we computed mean absolute differences of relative spectral values in delta 1 and delta 2 frequency bands for each zygosity group at 38th, 46th, and 52nd week of PMA, especially in AS/REM and QS/NREM (Figure 2).

Within-pair similarity of spectral power in AS/REM and QS/NREM sleep in MZ (blue color) and DZ twins (red color), expressed as comparative means plot (vertical bars denote 0.95 confidence intervals) for absolute difference in relative power spectra value for delta 1 (0.5-2 Hz) and delta 2 (2.25-3.75 Hz) at 38th, 46th, and 52nd week of PMA, at left fronto-central, central, and centro-occipital electrodes. DZ indicates dizygotic; MZ, monozygotic; PMA, postmenstrual age.
Mixed model analysis of variance on Fp1-C3, C3-Cz, and C3-O2 electrodes showed that MZ and DZ twin groups did not significantly differ (F1,45.03 = 1.85, P > .05) in within-pair similarity for relative delta 1 and delta 2 activities during 2 sleep stages and 3 periods of measurement. No statistically significant (P > .05) interreaction was found between group (MZ/DZ) and time, sleep stage, frequency band, and electrode positions (Table 3).
Mixed model analysis of variance with 5 main effects and 4 interaction of within pair of MZ and DZ absolute difference in relative power spectra value.

Abbreviations: DZ, dizygotic; MZ, monozygotic; PMA, postmenstrual age.
These results confirmed that the differences in delta maturation depended on sleep stages, frequency range, and periods of measurement but not on zygosity.
As to ICCs—the result of correlation analysis with respect to frequency bands and periods of measurement showed that MZ twins did not show significantly higher ICC correlations than DZ twins for delta frequencies in any time period of measurement (Z = −1.22, P = .224) (Table 4).
Intraclass correlation coefficient values for MZ and DZ twin pairs for delta 1 (0.5-2 Hz) and delta 2 (2.25-3.75).
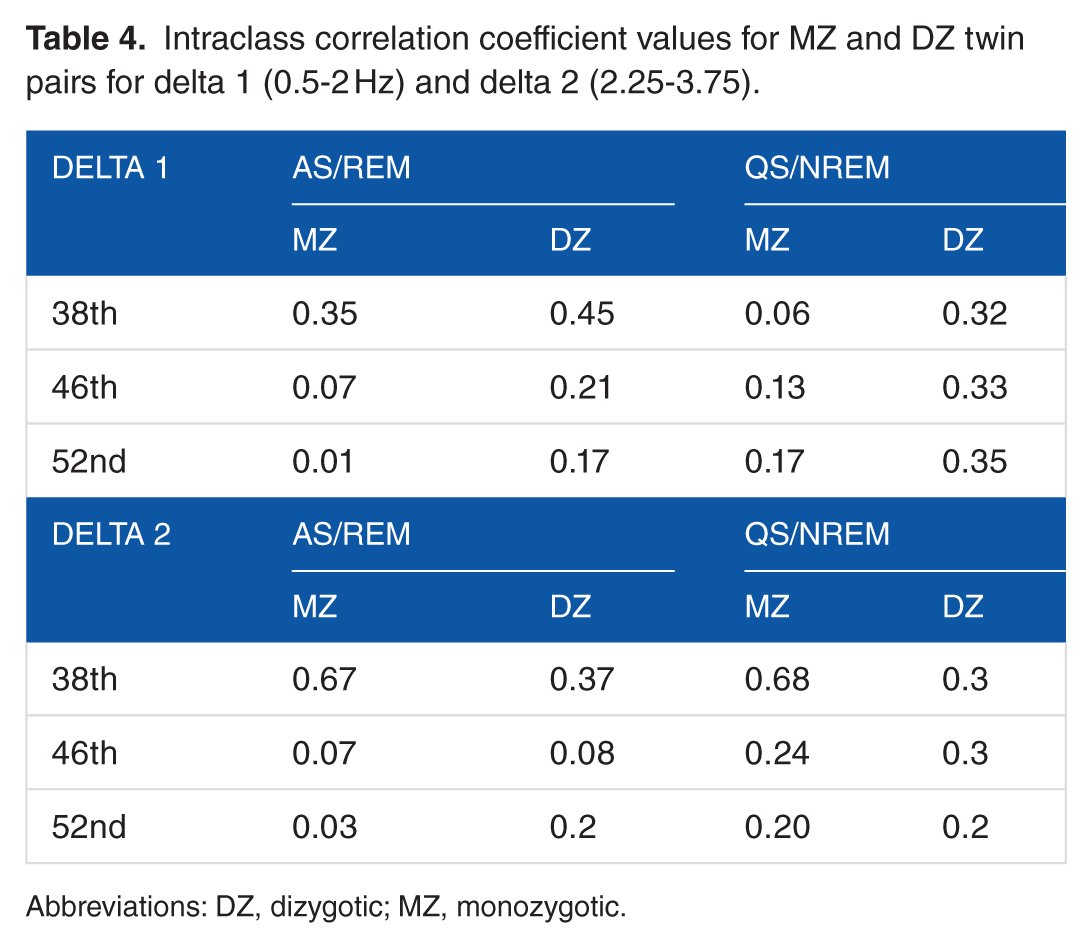
Abbreviations: DZ, dizygotic; MZ, monozygotic.
Discussion
In this study, we investigated spectral power changes in delta frequency range, in serial 4-hour EEG recordings performed in late preterm MZ and DZ twins between 38th and 52nd weeks of PMA. This is an extension of our previous study evaluating genetic influence on EEG composition during sleep. Our present research was particularly focused on the comparison of the maturational changes of delta power spectra between MZ and DZ twin partners and MZ and DZ twin groups over the same postnatal developmental period.
After subdividing the delta frequency band in the delta 1 and delta 2, we found 2 opposite patterns of changes in delta activities that were dependent on frequency band: relative delta power decreased, whereas delta 2 power increased from 38th toward 52nd week of PMA regardless of zygosity, sleep stages, and electrode position (Figure 1). These results corresponded with the EEG pattern of maturing preterm infants in whom the EEG pattern changes from high-amplitude low-frequency waves to low-amplitude high-frequency waves.22,38–40
We also demonstrated that EEG maturation of delta activity in early infancy occurred equally in MZ and DZ twin groups. No significant differences were found between MZ and DZ twin groups in the proportion of delta 1 (0.5-2 Hz) and delta 2 (2.25-3.75 Hz) power spectra during 2 sleep stages and 3 periods of measurement. Moreover, MZ and DZ twin groups showed consistency in maturational changes of delta activity that was not dependent on the region of the brain. These findings are in agreement with the results of visual analysis presented in our previous study in which we showed that macrostructural parameters of sleep architecture changed with the increase in PMA in all subjects regardless of zygosity, whereas MZ and DZ twin groups differed from each other only sporadically. 28 Considering that EEG activity has been proposed as a measure of the developmental changes within neuronal networks that are responsible for the expression of particular quantitative EEG measures, it is not surprising that these changes occurred equally in the population of healthy neonates regardless of their zygosity.
The central part of this study was focused on the comparison of maturational changes of delta 1 and delta 2 power spectra among MZ and DZ twin partners throughout the 2 sleep stages and 3 periods of measurement. We found some dissociation in distribution of within-pair MZ and DZ similarities that was dependent on frequency, periods of measurement, electrode position, and sleep state (Figure 2). However, the main finding revealed that within-pair MZ similarity was as high as that of DZ twins for delta 1 and delta 2 power spectra on each electrode position and both sleep stages. In addition, zygosity groups did not significantly differ in within-pair MZ and DZ similarity for delta 1 and delta 2 power spectra. Furthermore, the results revealed that within-pair similarity for delta 1 and for delta 2 power spectra substantially decreased with age, not only in DZ but also in MZ twin groups. It was shown particularly at fronto-central and central electrode positions during both sleep stages and at centro-occipital electrode during AS/REM.
As a first step in genetic analyses, MZ and DZ correlations were computed on relative powers of 2 delta bands and all leads (Table 4). Our results showed low correlations for MZ as well as for DZ twin partners for all electrode positions and both delta frequencies during AS/REM and QS/NREM sleep stages. Moreover, correlations of the MZ twins were about the same as the DZ twins, indicating lack of genetic influence on delta frequency range. The results of this study clearly demonstrated that the rhythm of EEG maturation evidenced by the maturation of delta 1 and delta 2 power spectra was not dependent of zygosity and proceeded in the same way in MZ and DZ twins. There have been few twin studies in children reporting genetic influences on quantitative EEG parameters but none of them included EEG sleep measures during early infancy. In a large twin study on 209 five-year-old MZ and DZ twin pairs, Van Baal et al reported striking genetic influence for the spectral composition of the EEG background during quiet rest with estimates ranging from 63% to 68% for most frequency bands. Somewhat lower heritability was found in delta band (mean heritability 55%). 3
In a study on 49 pairs of MZ and 45 pairs of DZ twins aged 7 to 12 months, Orekhova et al (2003) provided the evidence for genetic determination of alpha frequency in infants similar to that in adults. They also reported decrease in DZ similarity while increase in MZ similarity for many of the EEG parameters during the second half of the first year of life. 13
Therefore, the results of this study can only be compared with our previous study which was designed to investigate genetic influence on absolute power values of EEG power spectrum during the first trimester of life-time period that represents a milestone of functional reorganization of brain activity in the early infancy.2,29
Those results showed substantially higher correlations in MZ than in DZ twins for alpha (8-11.5 Hz), sigma (12-14 Hz), and beta (14.5-20 Hz) frequency ranges in all 3 periods of measurements (37th, 46th, and 52nd weeks), thus suggesting genetic influence in these frequencies. 29 In contrast, only weak correlations were found for absolute delta power spectra at each stage of development. Although the present results failed to indicate any genetic influence on delta frequency range, we considered challenging to target our present research specifically on more precise investigation on delta oscillations. There has been evidence that wide range of developmental disorders is associated with the increase in relative power in low EEG frequencies including delta range.42–44 The most consistent finding has been an increased low-frequency activity in children with attention-deficit/hyperactivity disorder compared with control children. 42 Therefore, delta waves could provide sensitive indicator for cortical health across development. However, if we expected for EEG spectral power to represent an endophenotype than it should posses a pattern of genetic expression within its structure. The present findings suggested the absence of genetic influence on maturation of delta 1 and delta 2 power spectra in the first 3 months of life, thus confirming our previous results. Genetic influence on EEG measures has not been examined in early infancy when brain development influences the EEG recordings. Hence, it is unclear whether genetic contribution to EEG parameters is evident over the first postnatal months when the brain is subjected to large structural and functional changes.18,19 The existing literature showed that genetic effects are not fixed for life. Genetic determination of many psychological and somatic characteristics increases from infancy to childhood, whereas the influence of shared environment decreases with age. 41 Furthermore, the relative roles of genetic and environmental influences on brain structure during childhood and adolescence do not seem to be static. A recent meta-analysis found that heritability increased for a range of cognitive and behavioral features, including IQ, externalizing behaviors, anxiety, and depressive symptoms. 45 Recent advances in the field of genetics have also shown that there may be limitations regarding a second assumption of the twin model, which is that MZ twins actually have identical genetic material. Bruder et al found a significant incidence of differences in copy number variations in MZ twin pairs, providing evidence for the presence of somatic mosaicism and the possible contribution of posttwinning structural variation in chromosomal architecture to phenotypic differences between identical twins. 46
We are aware that the interpretations of our study results are limited by the small sample size. Besides, it would be beneficial to involve subsequent measurements with larger sample sizes, matching for multiple demographics covariates (mono/dichorionic, mono/diamniotic, spontaneous, or fertility treatment–induced pregnancies) to validate the genetic influence on the process of EEG maturation. Therefore, longitudinal twin data are needed to test the change in genetic contribution to the rhythm of delta maturation over time.
When summarizing our results that indicated high degree of MZ variability in the process of delta maturation, it follows that delta frequency range may not possess the characteristics of endophenotype. We still consider that future neonatal EEG twin studies may constitute a neurophysiologic representative of gene-environment interreactions that can be used to diagnose neurodevelopmental disorders.
Conclusions
The main finding of our study was that the MZ twins were no more similar in respect to their delta power spectra maturation than DZ twins. We suggest that these findings illustrate an important phenomenon that is related to the developmental age. This research has importance because there is not a single twin study based on quantitative analyses of EEG sleep measures that explored similarity in the rhythm of EEG maturation in the first 3 months of life.
Footnotes
Acknowledgements
This research was performed at University Clinical Hospital Split, Neonatal Intensive Care Unit; Department of Gynecology and Obstetrics.
Funding:
The author(s) disclosed receipt of the following financial support for the research, authorship and/or publication of this article: The research was funded by University Hospital Centre Split.
Declaration of conflicting interests:
The author(s) declared no potential conflicts of interest with respect to the research, authorship, and/or publication of this article.
Author Contributions
MV is the leading researcher who designed and executed this study and wrote the manuscript. GK made a substantial contribution to analysis and interpretation of data. JV participated in drafting the article and revising it critically. AV made a substantial contribution in drafting and design of the article.
Informed Parental Consent
It was obtained after detailed explanation of the method and purpose of the study. The study was conducted in accordance with the Declaration of Helsinki, and the protocol was approved by the Ethics Committee of University Hospital Split (216-2163166-0509).