
Abstract
Background:
Child undernutrition is a major public health concern in Uganda that can lead to increased risks of death with its prevalence higher in rural hard-to-reach areas than in urban areas. While it is assumed that the prevalence will be more concerning in islands with restricted accessibility to healthcare resources, limited research has been conducted on the prevalence and associated factors of stunting and underweight among children in Bussi Islands of Uganda. This study aimed to assess the prevalence and predictors of stunting and underweight among children aged 6 to 59 months in Bussi Islands of Wakiso District in Uganda.
Methods:
A cross-sectional study was conducted in Bussi Islands of Wakiso District. Sociodemographic and anthropometric measurements were obtained for randomly sampled 409 caretaker-child pairs from 409 households. Data was collected using pre-tested structured electronic questionnaires validated by the Uganda Ministry of Health. Anthropometric indices were calculated using ENA-SMART version 2011 and data analysis was conducted using STATA version 14. Modified Poisson regression was used to generate Unadjusted and Adjusted Prevalence Ratios (APRs) with 95% confidence intervals.
Results:
Prevalence of stunting and underweight among children in Bussi Islands were 29.8% and 16.1%, respectively. Independent predictors of stunting included: suffering from diarrhea (APR: 1.8; 95% CI: 1.3, 2.5); household food insecurity (APR: 1.7; 95% CI: 1.2, 2.4); and child age of 12 to 23 months and 24 to 35 months (APR: 2.3; 95% CI: 1.3, 4.0 and APR: 2.0; 95% CI: 1.1, 3.6 respectively). Protective factors against stunting were not suffering from measles (APR: 0.62; 95% CI: 0.42, 0.92); receiving deworming tablets every 6 months (APR: 0.58; 95% CI: 0.42, 0.81); and daily household utilization of more than 80 L of water (APR: 0.48; 95% CI: 0.24, 0.95). Predictors of underweight were suffering from diarrhea (APR: 2.2; 95% CI: 1.4, 3.4) and having more than 9 household members (APR: 2.8; 95% CI: 1.1, 7.5).
Conclusions:
Child stunting and underweight are prevalent public health problems in Bussi Islands of Wakiso District. Therefore, the study suggests that nutrition interventions in the Islands should focus on childhood vaccination, family planning, sufficient safe water coverage, household food security, and health education of child caretakers on optimal infant and young child feeding and development.
Introduction
Child undernutrition remains a global challenge with rural hard-to-reach areas of low and middle-income countries carrying most of the global burden. 1 It contributes to 11% of Disability Adjusted Life Years (DALYs) and about 45% of deaths among children under 5 years of age.1,2 It is also the leading contributor to increased risk of death, learning difficulties in school, reduced financial stability as adults, weakened immunity, increased susceptibility to infections as well as long-term developmental delays. 3
Globally in 2020, an estimated 22.0% (149.2 million), 6.7% (45.4 million), and 5.7% (38.9 million) of children under 5 years were stunted (too short for age), wasted (too thin for height), or overweight (too heavy for age), respectively. In the same year, it was estimated that 41% (61.2 million), 27% (12.3 million), and 27% (10.5 million) of all stunted, wasted, or overweight children under 5 years globally, respectively, lived in Africa. In East Africa, it was estimated that 32.6% (22.1 million), 5.2% (3.5 million), and 4.0% (2.7 million) of all children under 5 years were stunted, wasted, or overweight, respectively.4,5 In Uganda, specifically, it was estimated that 29%, 11%, 4%, and 4% of children under five were stunted, underweight, overweight, or wasted, respectively. 6
Children in rural hard-to-reach areas of Uganda are more likely to be stunted than those in urban areas. The current prevalence of stunting in rural Uganda is 30% compared to 24% in urban areas. 6 Some causes of stunting include: poor breastfeeding and child feeding practices7-10; diseases2,11 such as worm infestations, 12 diarrhea, measles, respiratory tract infections, and malaria7,13-15; inadequate dietary intake, household food insecurity, poor child care, poor health services, and unhealthy environments15,16; inadequate access to sufficient nutritious food 16 ; low levels of parental education15,17,18; low socioeconomic background19-21; and poor access to antenatal services. 10
Stunted children may never reach their full height potentials as well as their cognitive potentials, and therefore, are starting their lives at a significant disadvantage. 4 If their undernutrition is left unaddressed, consequences such as increased susceptibility to infections, increased risk of death, learning difficulties in school, reduced financial stability as adults, and barriers to community participation will persist through adulthood.3-5
National interventions like operation wealth creation have previously targeted but reported only limited success in reducing the high rates of undernutrition. 22 Local interventions of promoting routine immunization, nutrition education of child caretakers based on Infant and Young Child Feeding (IYCF) guidelines, deworming, and Vitamin A supplementation for children have also reported little success.
Bussi Islands have unique geographic challenges that complicate access to proper healthcare services. While the Islands are about 10 km away from Entebbe Municipality (Wakiso District), availability of both road and water transportation are limited. Safe water coverage in the Islands is among the lowest in the country at 20% (Bussi Subcounty Data, unpublished data). Island residents also struggle with inadequate access to electricity, limited access to quality healthcare services with only one health facility in the Islands (government-owned Bussi Health Centre III), strict regulation of livelihood activities like fishing, and limited arable land compared to their population size (Bussi Subcounty Data, unpublished data).
No research had been conducted to generate scientific evidence on stunting and underweight among children in Island areas of Uganda. Such evidence is crucial to better inform and, thus, design interventions to effectively address this major public health concern.
Thus, this study investigated the prevalence and predictors of stunting and underweight among children aged 6 to 59 months in Bussi Islands.
Methods
Study area, design, and period
A community-based cross-sectional study was conducted in April 2019 in Bussi Islands of Wakiso District in Uganda. Bussi Islands are a group of 5 Islands that make up Bussi Subcounty with an approximate population of 10 000 people. 22 They are surrounded by Lake Victoria and are located 41 km (24.6 mi) south of Kampala City.23,24
Study population and sampling
In this study, child caretakers were study respondents while children aged 6 to 59 months in Bussi Islands were the study population. Children who had physical body deformities that interfere with anthropometric assessment were excluded from the study. An adjusted sample size of 409 was estimated using the Kish Leslie formula 25 with a 95% confidence interval, expected stunting prevalence of 30% in rural Uganda, 6 5% maximum acceptable error, a design effect of 1.2, and a 5% potential non-response. A sampling frame was developed for 3 out of 5 islands, which were randomly selected. The number of households (HHs) selected per island was proportionate to the number of households with eligible children in each of the selected islands. Simple random sampling was used to select the households and a child in a household with more than one eligible child.
Variables
Outcome variables
Stunting was determined using height-for-age z-score (HAZ) and underweight was determined using weight-for-age z-score (WAZ). A child was classified as stunted when their HAZ was < −2 standard deviations (SD) and normal when their HAZ was ⩾ −2SD. A child was classified as underweight when their WAZ was < −2SD and normal when their WAZ was ⩾ −2SD.26-28
Independent variables
Socio-demographic and economic characteristics: Caretaker age, sex, type, marital status, education, maternal parity, pregnancy, and breastfeeding status (when the caretaker was the biological mother), income source of household head, number of household members, and children aged <60 months in households.
Dietary intake and child characteristics: Introduction of solid, semi-solid, or soft foods, feeding method, breastfeeding status, meal frequency, age, sex, delivery place, type of delivery attendant at birth, number of children given birth to at the time of delivery, and birth order.
Child health status characteristics: Vaccination status, sickness (diarrhea, malaria, and respiratory diseases within 2 weeks prior to the study, and measles within 6 months prior to the study), Vitamin A supplementation and deworming medications within 6 months prior to the study. A child was reported to have been vaccinated if their vaccines were up-to-date based on the UNEPI schedule 29 at the time of the study. Diarrhea was defined as more than 3 loose stools in 24 hours. Respiratory disease was defined as an episode of fever and cough with at least one of the following: running nose, wheezing, breathing difficulties, sputum, and chest pain. Measles was defined as having a positive Measles-specific IgM test or a generalized maculopapular skin rash with a fever and at least one of the following: Koplik’s spots, dry cough, runny nose, sore throat, and conjunctivitis. Malaria was defined as having fever with a confirmed positive test (rapid diagnostic or microscopy) or a history of fever plus at least one of the following: chills, headache, muscular aching, and vomiting. 30
Household food access: Household Food Insecurity Access Scale scores (HFIAS), Household Dietary Diversity Scores (HDDS), Food Consumption Scores (FCS), number of household members earning an income, and household food source. HFIAS was measured by asking 9 questions that assessed the risk of food insecurity in the past month. Upon indication of food insecurity in a respondent’s response, a score was given based on the frequency of the experience in the last month. An answer of “No” scored “0,” “yes” with 1 to 2 times scored “1,” “yes” with 3 to 10 times scored “2,” and “yes” with >10 times scored “3.” Then the total score was calculated by the sum of all scores of 9 questions. Total HFIAS scores of 9 and under indicated food security while scores between 10 and 16 indicated marginal food insecurity, and between 17 and 27 was categorized as food-insecure households. 31 HDDS was measured by following the Food and Agricultural Organization of the United Nations (FAO) recommendations. Out of the 12 food groups, a score of 1 point was given for each group consumed while 0 points were given for each group not consumed in the previous 24 hours, assuming usual consumption. If their consumption pattern in the previous 24 hours was unusual, a score for any other day was calculated. The total score was the sum of scores across 12 food groups. Households with HDDS greater than the mean HDDS of the respondents’ households were classified as having good HDDS whereas those with HDDS lower than the mean were classified as having poor HDDS. 32 FCS was used to assess the quality of food consumed by household members in the previous 7 days. FCS represents the number of days where the household diet included food from each of the 8 food groups multiplied by the assigned weight of each group. Total FCS was calculated by the sum of scores across all food groups, and it may range from 0 to 112. Assigned weights are as follows: milk weighting “4”; cereals and tubers weighting “2”; meat, fish, and poultry weighting of “4”; pulses weighting “3”; vegetables and fruits each weighting “1”; and sugar and oil each weighting “0.5.” Scores under 21.5 showed poor quality, between 21.5 and 35 showed borderline quality, and above showed acceptable quality. 33
Household food availability: Agricultural land access, current crop growth, purpose of crop production, fishing, food stocks, livestock ownership, and purpose of livestock.
Health system characteristics: Transport mode to health facility (Bussi Health Centre III), ownership of transport means, and transport cost to the health facility.
Water sanitation and hygiene (WASH) characteristics: Drinking water source, daily water usage of household, waste disposal method, child’s handwashing before meals, and drinking water treatment method.
Data collection
Research assistants interviewed caretakers face to face using a pre-tested structured electronic questionnaire. The questionnaire had inbuilt skips, validations, and mandatory fields that ensured high-quality data collection. The questionnaire was adopted from the Uganda Demographic Health Survey (UDHS), which was validated by the Uganda Ministry of Health (MoH). Research assistants were trained in the procedures of data collection and taking anthropometric measurements. Pre-tested and standardized digital SECA scales were used to measure the weight of the children to the nearest 0.1 kg. Stadiometers approved by the United Nations Children’s Fund (UNICEF) were used to measure the length of children 6 to 23 months horizontally and the height of children 24 to 59 months vertically. All anthropometric measurements were taken twice, and the mean was entered into the questionnaire. The data collection process was supervised by the principal investigator, and errors were rectified before the questionnaires were uploaded to the server. Five research assistants, each with a motorcycle provided by the study, were recruited to make house-to-house visits to collect data from each household.
Data analysis
Anthropometric data were entered into ENA SMART version 2011 where stunting and underweight classification was based on the 2006 World Health Organization (WHO) Growth Standards. Combined with the rest of the data in Excel, it was exported to STATA version 14 for cleaning and subsequent univariate, bivariate and multivariate analysis. Prevalence of stunting and underweight were each obtained by dividing the number of children who were stunted or underweight by the total number of children in the study and expressed as a percentage.
Associations between stunting and underweight with independent variables were calculated by Prevalence Ratios (PRs) at their 95% confidence intervals, and p-values of <0.05 showed statistically significant associations. PRs were used instead of Odds Ratios (ORs) since the prevalence rates of stunting and underweight were both greater than 10%, and the ORs tend to overestimate the strength of association in such scenarios.34,35 PRs at both the bivariate (Unadjusted PRs) and multivariate analysis level (Adjusted PRs) were estimated using the Modified Poisson regression analysis, with robust standard errors via generalized linear models with family (Poisson) and link (log). 36 Crude associations were determined at bivariate analysis, and a cut-off point of P ⩽ .2 was used to consider variables for multivariate analysis where confounders were controlled. If variables included in the multivariate model resulted in a loss of significance, they were removed.
The final model selection was based on Akaike Information Criteria (AIC) with smaller AIC values suggesting a better model. Covariates with P-values < .05 were considered as predictors of stunting and underweight.
Ethics approval and consent to participate
This study was approved by Makerere University School of Public Health Higher Degrees Research and Ethics Committee (5th March 2019) and permission to carry out the study was then sought from the District Health Officer of Wakiso District (21st March 2019, Ref. No. 218/03/2019). Participation was voluntary and free from coercion. Written informed consent was obtained from all study respondents and all the information got was kept confidential. Parental consent was obtained before taking anthropometric measurements of all children. All children who were identified to have undernutrition were referred to different health facilities depending on the severity of their conditions.
Results
Socio-demographic and economic characteristics of the respondents
The final analysis of this study was based on the calculated sample size with a response rate of 100%. Most of the caretakers were female (376 respondents, 91.9%), and 207 (50.6%) were between 20 and 29 years old. Slightly more than three quarters of caretakers were the biological mothers of the children (320 respondents, 78.2%) of which 171 (53.4%) were multiparous (having 2-4 children). Half of the biological mothers of the children (160 respondents, 50.0%) reported that they were not pregnant nor breastfeeding at the time of the survey. Slightly more than three quarters, 315 (77.0%) caretakers were married, 269 (65.8%) of the households had 2 to 5 family members with an overall mean family size of 5 ± 2 persons. Most of the caretakers, 207 (50.6%) received basic primary education while 114 (27.9%) completed secondary education. Major sources of income of the household heads were the sale of agricultural produce (156 respondents, 38.1%) and fishing (101 respondents, 24.7%). Two hundred twenty-four (54.8%) households had one child aged <60 months with a mean of 2 ± 1 children aged <60 months per household (Table 1).
Socio-demographic and economic characteristics of households in Bussi Islands, April 2019.

Only applies for child caretakers who were biological mothers of the study children.
Child and dietary intake characteristics
There were slightly more girls (211 children, 51.6%) than boys (198 children, 48.4%). Most of the children, 128 (31.3%) were aged 12 to 23 months with an overall mean age of 26.7 ± 12.9 months. Three hundred two (73.8%) were delivered in a health facility, 305 (74.6%) were delivered by a health worker, 403 (98.5%) were born as singleton babies, and 205 (50.1%) were second to fourth born children of their mothers (Table 2).
Dietary intake and characteristics of children 6 to 59 months in Bussi Islands, April 2019.
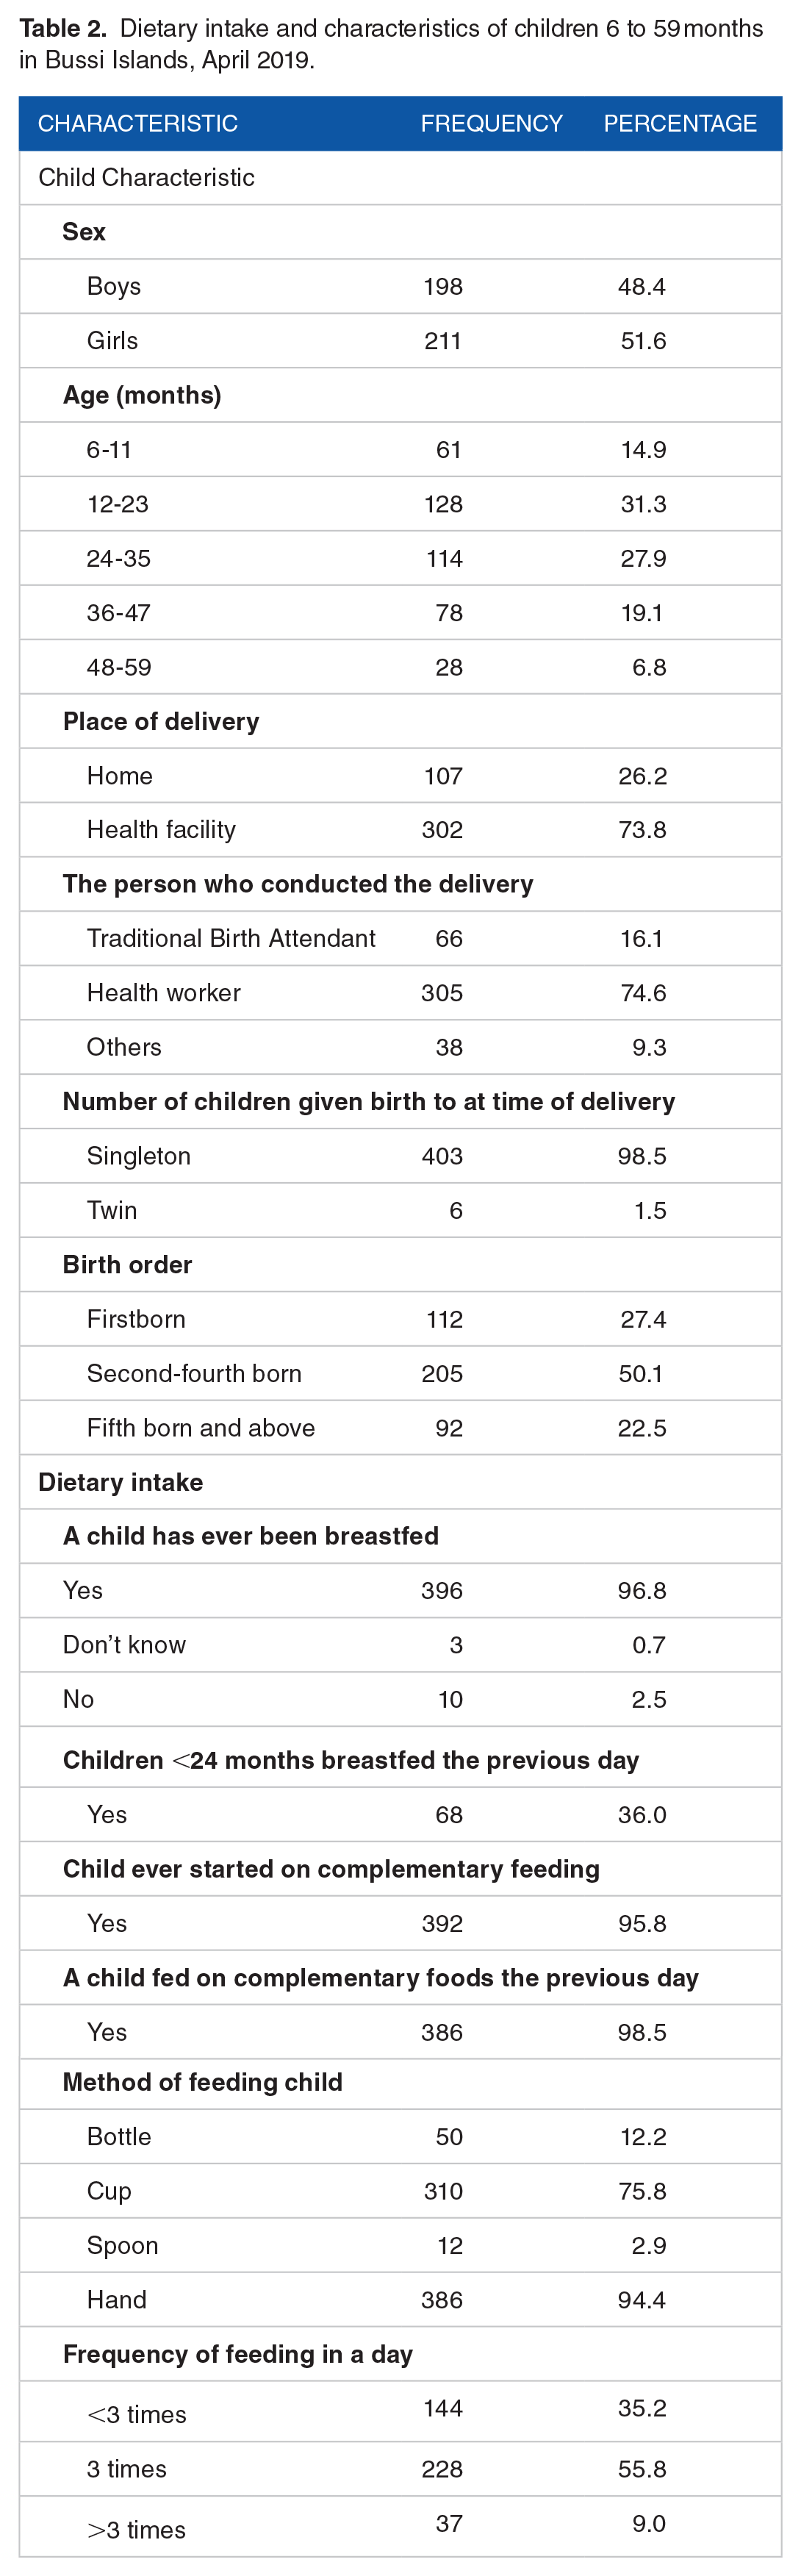
Nearly all children, 396 (96.8%) had been previously breastfed, and 68 (36.0%) of the children who were <23 months of age at the time were breastfed within the 24 hours before the survey date. Most of the children, 392 (95.8%) had been introduced to complementary foods at the time of the survey, of which 386 (98.5%) were fed on complementary foods in the 24 hours preceding the survey date. Most of the children, 386 (94.4%) were fed using hands, 310 (75.8%) were fed using a cup, and 228 (55.8%) were fed 3 times a day with 3 ± 1 as the mean number of feeding times (Table 2).
Child health status and health system characteristics
Most of the children, 355 (86.8%) had received the up-to-date vaccinations appropriate for their age as per UNEPI recommendations at the time of the study. In the 2 weeks preceding the survey, 158 (38.6%) children suffered from diarrhea, 177 (43.3%) suffered from a fever, and 363 (88.8%) suffered from respiratory diseases. In the 6 months preceding the survey, 278 (68.0%) children suffered from measles, 295 (72.1%) had received Vitamin A supplementation, and 282 (69.0%) had received deworming tablets (Table 3).
Health status of children and health system characteristics in Bussi Islands, April 2019.
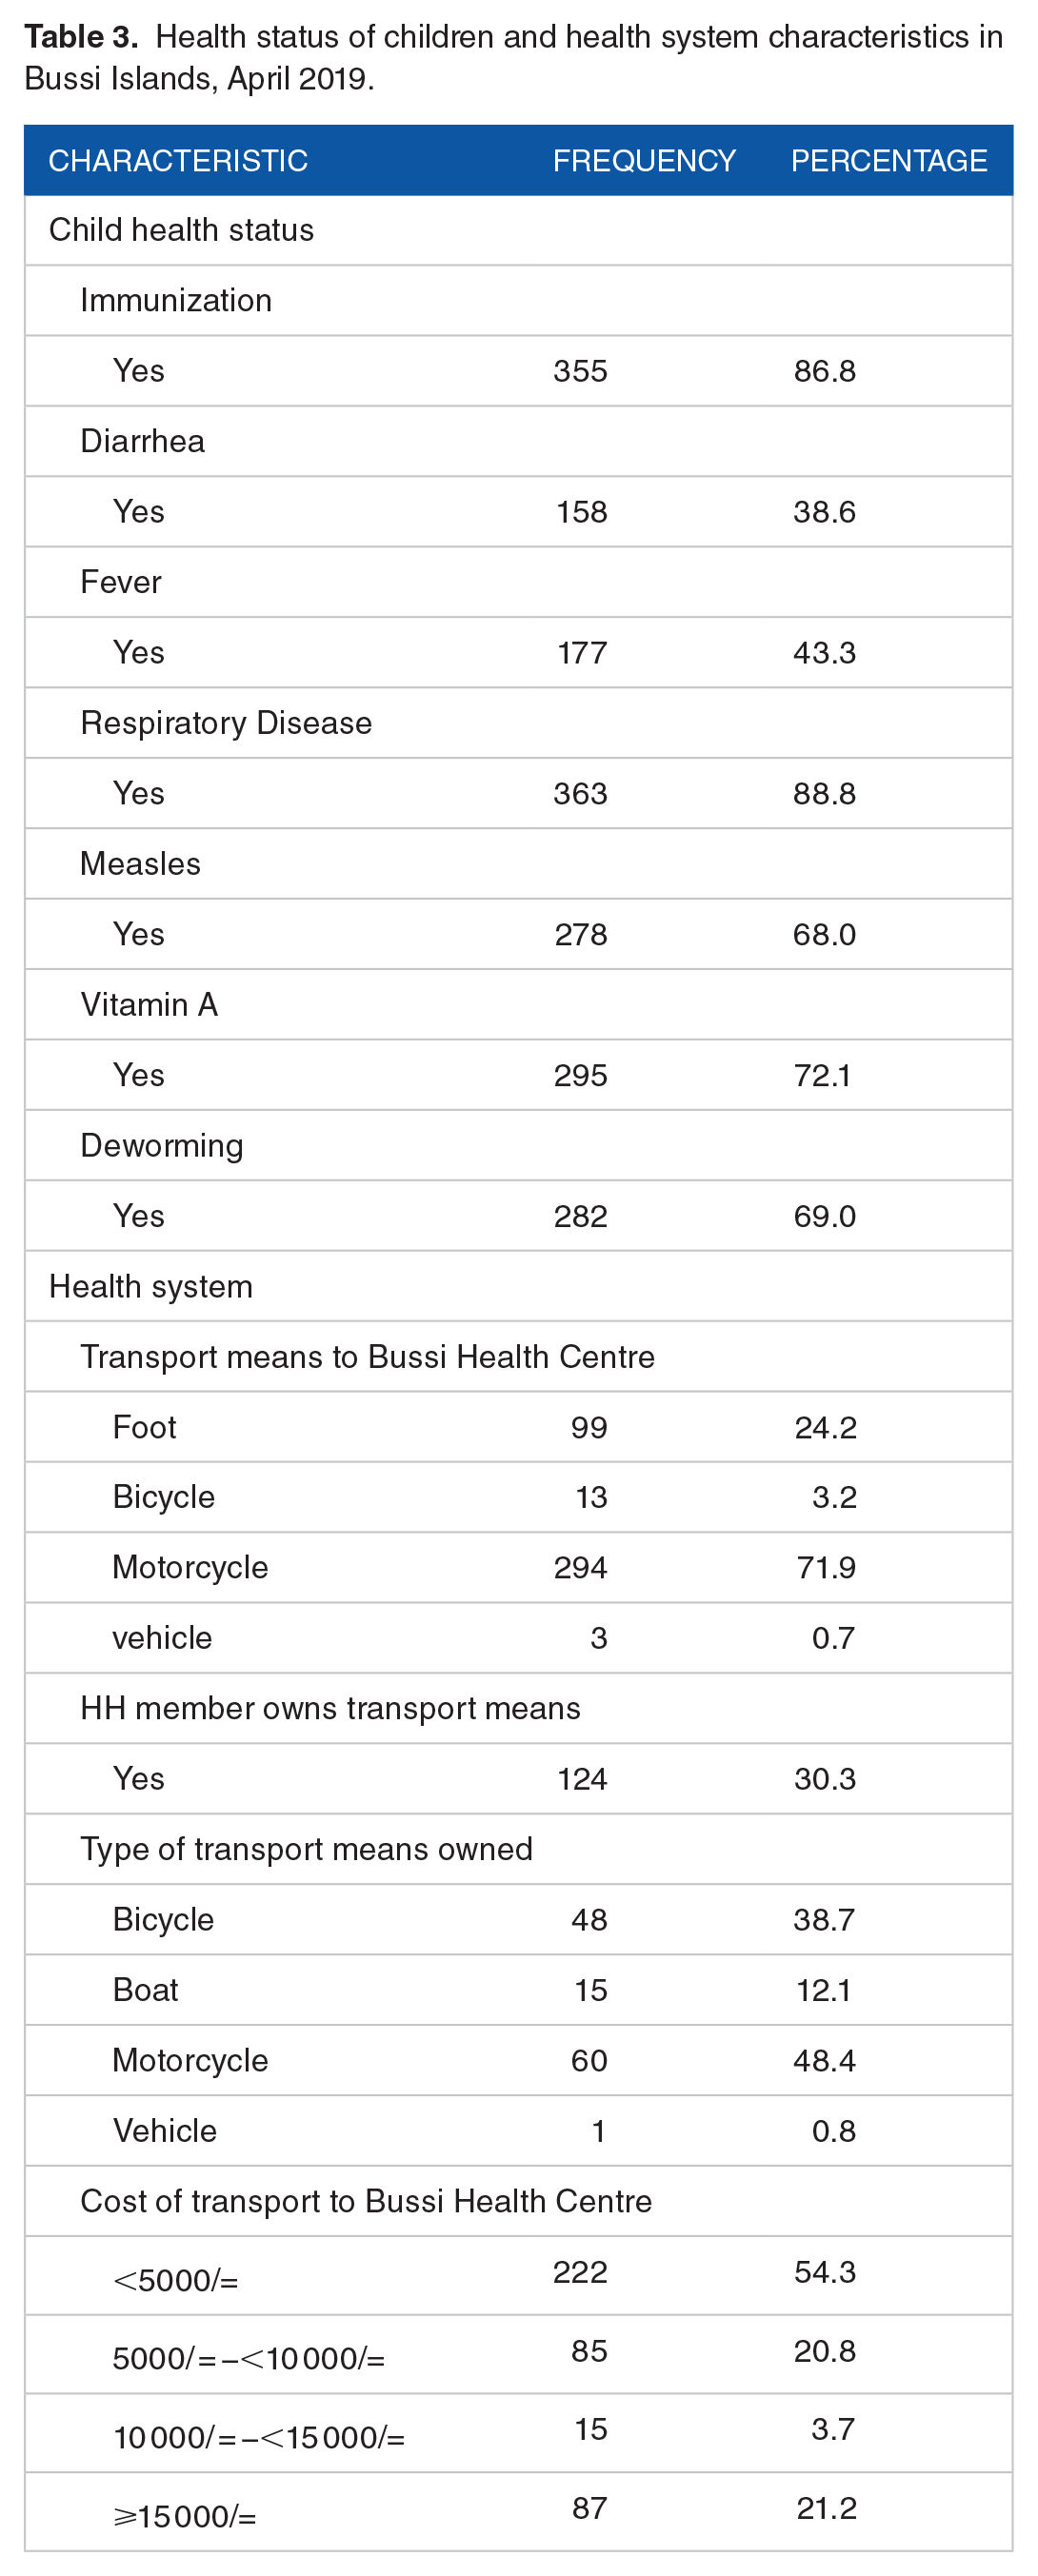
The main means of transport in Bussi Islands was motorcycles (Boda-bodas) with 294 (71.9%) of the respondents reporting usage when traveling to Bussi Health Centre III (the only health facility on the Islands). A third of the households, 124 (30.3%) owned at least one form of transport means, of which 60 (48.4%) owned motorcycles. Close to half of the respondents, 222 (54.3%) reported spending 5000 Uganda Shillings ($1.42) or more to travel to and from Bussi Health Centre III (Table 3).
Household food security status characteristics
Results of analysis of the HFIAS showed that 45 (11%) households were food insecure with an HFIAS score of 17 to 27 and a mean HFIAS score of 8.7 ± 5.7 for all the households. More than half of the households, 225 (55.0%) had a poor HDDS of below 5.4, which was the mean HDDS out of a maximum score of 12. Most of the households had an acceptable FCS of >35 and a mean of 45.3 ± 15.9 out of a maximum of 112. Close to two-thirds, 263 (64.3%) households had only one member who was earning an income. Two hundred ninety-two (71.4%) reported purchasing all or some of their food, 272 (66.5%) owned or had access to agricultural land, 269 (65.8%) were growing crops at the time, 262 (64.1%) kept livestock, 120 (29.3%) had a member who carried out fishing, and 89 (21.8%) had a stock of food at home (Table 4).
Household food security status characteristics of households in Bussi Islands, April 2019.

WASH characteristics
Most of the households, 304 (74.3%) used 40 to 80 L of water daily, 333 (81.4%) got their water from boreholes, and 92 (22.5%) used untreated water for drinking either sometimes or all the time. One hundred two (24.9%) of the caretakers reported always washing their hands before giving food to children, and 138 (33.7%) used open field disposal for household wastes (Table 5).
WASH characteristics of households in Bussi Islands, April 2019.

Prevalence of stunting and underweight
The overall prevalence of stunting was 29.8% and underweight was 16.1%. The boys had a higher prevalence of stunting and underweight compared to their female counterparts (Table 6).
Prevalence of stunting and underweight among children aged 6 to 59 months in Bussi Islands, April 2019.

The prevalence of edema was 0.0%.
Predictors of stunting
The prevalence of stunting among children who suffered from diarrhea was about 2 times the rate among those who didn’t in the 2 weeks preceding the survey (Adjusted PR: 1.8; 95% CI: 1.3, 2.5). Similarly, the prevalence of stunting was 38% lower among children who did not suffer from measles as compared to those who did in the 6 months preceding the survey (Adjusted PR: 0.62; 95% CI: 0.42, 0.92). The prevalence of stunting among children from food-insecure households was about 2 times the prevalence among children in food-secure households (Adjusted PR: 1.7; 95% CI: 1.2, 2.4). The prevalence of stunting was 42% lower among children who had received deworming tablets as compared to those who did not in the 6 months prior to the survey (Adjusted PR: 0.58; 95% CI: 0.42, 0.81).
The prevalence of stunting among children aged 12 to 23 months and 24 to 35 months were 2 times the prevalence among children aged 6 to 11 months (Adjusted PR: 2.3; 95% CI: 1.3, 4.0 and Adjusted PR: 2.0; 95% CI: 1.1, 3.6 respectively). Also, the prevalence of stunting was 52% lower among children from households that used >80 L of water daily as compared to those from households that used <40 L (Adjusted PR: 0.48; 95% CI: 0.24, 0.95) (Table 7).
Predictors of stunting among children aged 6 to 59 months in Bussi Islands, April 2019.

Significant association at P-value < .05.
Maternal parity only applies for child caretakers who were biological mothers of the study children.
Predictors of underweight
Children who suffered from diarrhea had a prevalence of underweight 2 times higher than that among children who did not in the 2 weeks preceding the survey (Adjusted PR: 2.2; 95% CI: 1.4, 3.4). Additionally, the prevalence of underweight among children from households with ⩾10 members was approximately 3 times higher than that among children from households with 2 to 5 members (Adjusted PR: 2.8; 95% CI: 1.1, 7.5) (Table 8).
Predictors of underweight among children aged 6 to 59 months in Bussi Islands, April 2019.

Significant association at P-value < .05.
Discussion
This was a cross-sectional study that was carried out in the community. It assessed the prevalence and predictors of stunting and underweight among children aged 6 to 59 months in Bussi Islands to guide and better inform future nutrition interventions.
The study found high prevalence of stunting (29.8%) and underweight (16.1%) among children aged 6 to 59 months. The prevalence rates above are both poor (medium) according to the WHO classification of the prevalence of undernutrition. 37
While the prevalence of stunting among children under five in Bussi Islands was comparable to the national prevalence of 29%, the prevalence of underweight was higher than the national prevalence of 11%. 6 This can be attributed to the Islands’ geographical barriers as well as overall population of low socioeconomic status. On the contrary, prevalence of stunting and underweight in this study were far less than those from studies conducted in rural areas of Ethiopia and Kenya.38-40 This can be attributed to the frequent droughts in the 2 countries that threatened food security and hence led to high prevalence of stunting and underweight.
The study showed that suffering from diarrhea, household food insecurity, and children age of 12 to 35 months were positively associated with stunting whereas not suffering from measles, receiving deworming tablets every 6 months and daily utilization of >80 L of water in the household were protective. Suffering from diarrhea and having more than 9 household members were associated with being underweight.
In the current study, diarrhea was an independent predictor of both stunting and underweight as children who had suffered from diarrhea in the 2 weeks preceding the survey were more likely to be stunted or underweight. This comes as no surprise as diarrhea leads to undernutrition, and undernutrition predisposes diarrhea. Diarrhea leads to inflammation of the gut and affects the individual’s ability to digest and absorb food. It also leads to dehydration, loss of electrolytes and other nutrients, predisposing children to lactose and fat intolerances, and potential food aversion due to the instigated pain after eating. Such consequences of diarrhea lead to a reduction in nutrient absorption and an increase in nutrient loss, which can lead to being underweight. The result of this study may suggest that children who suffered from long and repeated episodes of diarrhea predisposed them to stunting. Such results are consistent with other studies carried out in Ethiopia by Betebo et al, 41 Bantamen et al, 42 and Teshome et al, 39 which also demonstrated that diarrhea is an independent and positive predictor of stunting and underweight in children under 5 years of age.
Children with a history of a measles infection in the 6 months prior to the survey had greater odds of being stunted. This also comes as no surprise since measles leads to lowered immunity and reduced food intake due to diarrhea and loss of appetite. These lead to faltering in the growth and development of children. This was in agreement with similar studies in other low and middle-income countries.43,44
Household food insecurity was found to be an independent predictor of stunting with children from food-insecure households being more likely to be stunted. Children from households that struggle with prolonged periods of food insecurity are limited in consumption options and, thus, eat low quantities of low-quality food, which predisposes them to stunt. This aligns with previous studies that have shown that household food insecurity is significantly associated with stunting.41,45-47
This study also revealed that taking deworming tablets every 6 months was protective against stunting. Deworming medications protect children from intestinal worms, which predispose them to stunt if left untreated. Food absorption in children with intestinal worm infestation is interrupted by worms and leaves behind little nutrition to be used for the child’s growth, leading to increased risks of stunting. A similar study conducted by Yalew 48 in Ethiopia showed that deworming was protective against stunting in children aged under 5. Wamani et al 49 also demonstrated that failure to deworm children aged 12 months and older was positively associated with stunting.
According to this study, children aged 12 to 35 months were more likely to be stunted. This may be accounted by the fact that, around this timeframe, most children stop breastfeeding and only depend on family foods. At this age, children are also losing the passive immunity they were receiving from their mothers through breast milk. Most of the family foods they eat are not hygienically prepared, served, and stored, which predisposes them to repeated cycles of diarrhea and thereby leads to stunting.
Children of these ages also show increased physical activity, including very actively moving around and impulsively eating anything they find in the neighborhood, which may predispose them to worm infestations that may eventually lead to stunting. This is in agreement with several other studies done in Ethiopia, Nigeria, and Pakistan which also reported that the age of children is a risk factor of stunting with the majority of them showing that chronic and acute undernutrition develops during the weaning period and then rises sharply thereafter.39-41,50-52
In this study, daily household utilization of more than 80 L of water was protective against stunting. This may be attributed to the household having enough water to maintain the hygiene of their children. Children without access to adequate amounts of water are more susceptible to hygiene-related diseases like frequent diarrhea, which predisposes them to stunting. Such results are in agreement with findings from a study conducted by Demissie and Worku 50 in Ethiopia that demonstrated that there was a significant association between access to sufficient clean water and stunting. The study also reported that sufficient water prevents the spread of water-borne diseases that can negatively affect the health and nutrition of young children like stunting. Similarly, another study done in Nigeria reported that the lack of sufficient amounts of safe water was a risk factor for stunting. 53
Having more than 9 members in a household was an independent predictor of being underweight as children were more likely to be underweight in those households. When a household has many people to feed, allocating enough food for everyone becomes a struggle. This leads to a greater risk of vulnerable children, who depend on adults feeding them, having insufficient food intake. This worsens if most of the members in the household are adults and are unemployed. This is consistent with a study by Yikii et al, 54 which revealed that households with fewer adult members had significantly better food security compared with those with more adults. Findings from this study are also consistent with another study carried out by Adeladza 55 in Kenya, which reported that children from large households were more likely to be undernourished due to characteristic problems of maintaining large families, such as competition for limited food. In contrast, a study carried out by Bisrat Getaneh and Kulkarni 56 in Ethiopia showed that having fewer household members was a positive predictor of underweight. Such results may have been derived from the fact that their study was done in an urban area where larger households had more people earning an income and, thus, had improved food security as compared to those with fewer members.
Limitations
The results are based on sample size for precision in stunting and not for risk factor analysis. Despite being underpowered for multivariate analysis, the results of the multivariate analyses were in line with other similar studies.38,39,41,42,49,53-55 Also, since this was a cross-sectional study, it could not establish a causal relationship between the dependent and independent variables. Recall bias may have affected some responses as they depended on the respondent’s memory. However, several measures like quality control checks were incorporated in the questionnaire to ensure the accuracy of the data collected. This study also used key items adopted from the UNICEF conceptual framework on the causes of undernutrition. 2
Conclusions
Child stunting and underweight are significant public health concerns in Bussi Islands of Uganda. This is shown by the high prevalence rates of stunting and underweight among children aged 6 to 59 months on the Islands. Suffering from diarrhea, household food insecurity, and child age of 12 to 35 months were predictors of stunting whereas not suffering from measles, receiving deworming tablets every 6 months, and daily household utilization of >80 L of water were protective. Suffering from diarrhea and having more than 9 household members were predictors of underweight.
Recommendations and Policy Implications
The results of this study have important policy implications for improving health and development outcomes for children in hard-to-reach areas in Uganda and possibly other regions of Africa. First, the government must prioritize the provision of clean water for rural households. Clean water will prevent the spread of diarrheal diseases that negatively affect the health and development of children. The government should take measures through the Ministry of Water and Environment to increase safe water coverage in hard-to-reach areas by constructing more boreholes and increasing coverage of piped water. Secondly, measles vaccination coverage and biannual provision of deworming tablets to children in hard-to-reach areas must be improved to prevent measles and worm infestations in children. Thirdly, the Ugandan government should carry out continuous education on the importance of small family size in hard-to-reach areas as well as on family planning methods. Improvement of food security at the household level as well as continuous health education of child caretakers on optimal IYCF practices should also be highlighted.
Supplemental Material
sj-docx-1-nmi-10.1177_11786388221125107 – Supplemental material for Predictors of Stunting and Underweight Among Children Aged 6 to 59 months in Bussi Islands, Wakiso District, Uganda: A Cross-Sectional Study
Supplemental material, sj-docx-1-nmi-10.1177_11786388221125107 for Predictors of Stunting and Underweight Among Children Aged 6 to 59 months in Bussi Islands, Wakiso District, Uganda: A Cross-Sectional Study by Edirisa Juniour Nsubuga, Ivan Arinda Kato, Seungwon Lee, Muzafaru Ssenyondo and John Bosco Isunju in Nutrition and Metabolic Insights
Supplemental Material
sj-docx-2-nmi-10.1177_11786388221125107 – Supplemental material for Predictors of Stunting and Underweight Among Children Aged 6 to 59 months in Bussi Islands, Wakiso District, Uganda: A Cross-Sectional Study
Supplemental material, sj-docx-2-nmi-10.1177_11786388221125107 for Predictors of Stunting and Underweight Among Children Aged 6 to 59 months in Bussi Islands, Wakiso District, Uganda: A Cross-Sectional Study by Edirisa Juniour Nsubuga, Ivan Arinda Kato, Seungwon Lee, Muzafaru Ssenyondo and John Bosco Isunju in Nutrition and Metabolic Insights
Research Data
sj-xls-3-nmi-10.1177_11786388221125107 – Supplemental material for Predictors of Stunting and Underweight Among Children Aged 6 to 59 months in Bussi Islands, Wakiso District, Uganda: A Cross-Sectional Study
Supplemental material, sj-xls-3-nmi-10.1177_11786388221125107 for Predictors of Stunting and Underweight Among Children Aged 6 to 59 months in Bussi Islands, Wakiso District, Uganda: A Cross-Sectional Study by Edirisa Juniour Nsubuga, Ivan Arinda Kato, Seungwon Lee, Muzafaru Ssenyondo and John Bosco Isunju in Nutrition and Metabolic Insights
Footnotes
Acknowledgements
The authors acknowledge Dr. Henry Wamani who provided the anthropometric equipment. We also acknowledge the team of research assistants. We also thank the study participants.
Funding:
The author(s) received no financial support for the research, authorship, and/or publication of this article.
Declaration of Conflicting Interests:
The author(s) declared no potential conflicts of interest with respect to the research, authorship, and/or publication of this article.
Author Contributions
Edirisa Juniour Nsubuga: Conceptualization, data curation, formal analysis, funding acquisition, investigation, methodology, project administration, resources, software, validation, writing-original draft, writing-review and editing. Ivan Arinda Kato: Formal analysis, investigation, methodology, software, validation, writing-original draft, writing-review and editing. Seungwon Lee: Formal analysis, investigation, methodology, software, validation, writing-original draft, writing-review and editing. Muzafaru Ssenyondo: Formal analysis, investigation, methodology, software, validation, writing-original draft, writing-review and editing. John Bosco Isunju: Conceptualization, data curation, formal analysis, investigation, methodology, software, supervision, validation, writing-original draft, writing-review and editing. All authors read and approved the final manuscript.
Supplemental Material
Supplemental material for this article is available online.
References
Supplementary Material
Please find the following supplemental material available below.
For Open Access articles published under a Creative Commons License, all supplemental material carries the same license as the article it is associated with.
For non-Open Access articles published, all supplemental material carries a non-exclusive license, and permission requests for re-use of supplemental material or any part of supplemental material shall be sent directly to the copyright owner as specified in the copyright notice associated with the article.